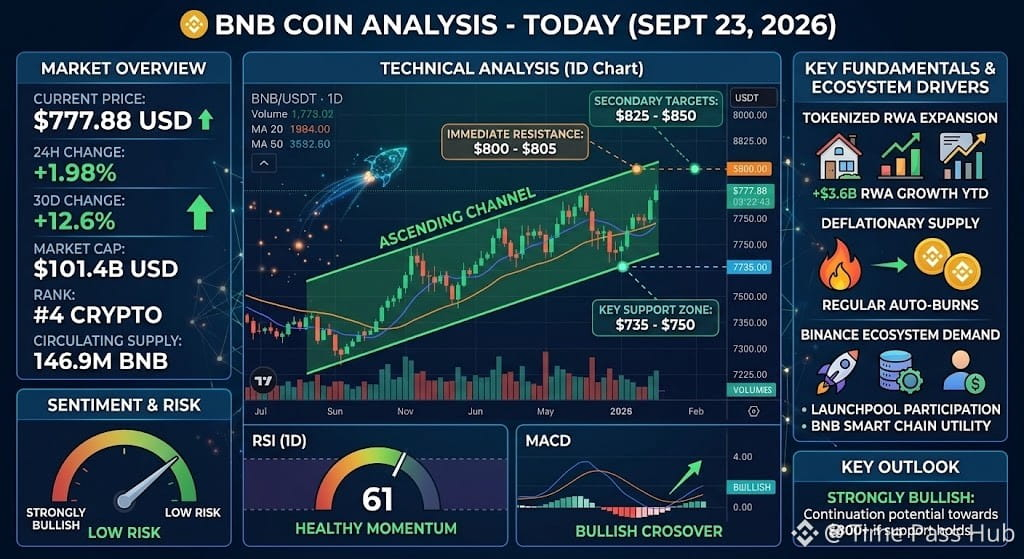
$BNB is trading near $777.88 USDT, demonstrating solid strength with a 30-day gain of over +12.6%.
Market Overview
Current Price: ~$777.88 USDT
24-Hour Change: -1.7% to -2.0% (minor intraday consolidation)
30-Day Change: Up +12.6%
Market Capitalization: ~$101.4 Billion USD
Rank: 4th largest cryptocurrency by market cap
Circulating Supply: ~146.9 Million BNB
Technical Analysis Highlights
Trend & Structure:
Ascending Channel: BNB continues to trade within a steady higher-high, higher-low pattern, maintaining a strong macro bullish trend.
Moving Averages: Holding above the short-term 20-day and 50-day Exponential Moving Averages (EMAs), signaling underlying buying strength.
Key Price Levels:
Immediate Resistance: ~$800 – $805 (Psychological resistance near recent local highs)
Secondary Targets: ~$825 – $850 if volume breaks above the $800 level.
Key Support Zone: ~$735 – $750. A close below $720 would signal temporary structural weakness.
Technical Oscillators:
RSI (1D): Hovering around 58–62, indicating healthy bullish momentum without being overbought.
MACD: Mild bullish crossover on daily timeframes, supporting upward continuation.
Key Fundamentals & Ecosystem Drivers
Tokenized RWA Expansion: BNB Chain has seen over $3.6 Billion in growth in tokenized real-world assets (RWA) year-to-date, driving institutional interest and chain activity.
Deflationary Supply: Regular auto-burn mechanisms continue to reduce circulating supply, providing long-term structural value support.
Binance Ecosystem Demand: Launchpool participation and gas usage across BNB Smart Chain maintain consistent utility demand for the token.
#bnb #BNBAnalysis #analysis #crypto #Binance $BNB $BTC
Market Overview
Current Price: ~$777.88 USDT
24-Hour Change: -1.7% to -2.0% (minor intraday consolidation)
30-Day Change: Up +12.6%
Market Capitalization: ~$101.4 Billion USD
Rank: 4th largest cryptocurrency by market cap
Circulating Supply: ~146.9 Million BNB
Technical Analysis Highlights
Trend & Structure:
Ascending Channel: BNB continues to trade within a steady higher-high, higher-low pattern, maintaining a strong macro bullish trend.
Moving Averages: Holding above the short-term 20-day and 50-day Exponential Moving Averages (EMAs), signaling underlying buying strength.
Key Price Levels:
Immediate Resistance: ~$800 – $805 (Psychological resistance near recent local highs)
Secondary Targets: ~$825 – $850 if volume breaks above the $800 level.
Key Support Zone: ~$735 – $750. A close below $720 would signal temporary structural weakness.
Technical Oscillators:
RSI (1D): Hovering around 58–62, indicating healthy bullish momentum without being overbought.
MACD: Mild bullish crossover on daily timeframes, supporting upward continuation.
Key Fundamentals & Ecosystem Drivers
Tokenized RWA Expansion: BNB Chain has seen over $3.6 Billion in growth in tokenized real-world assets (RWA) year-to-date, driving institutional interest and chain activity.
Deflationary Supply: Regular auto-burn mechanisms continue to reduce circulating supply, providing long-term structural value support.
Binance Ecosystem Demand: Launchpool participation and gas usage across BNB Smart Chain maintain consistent utility demand for the token.
#bnb #BNBAnalysis #analysis #crypto #Binance $BNB $BTC