🔴 Bearish Engulfed Candle! 📉
This 2-candle pattern at the top = Buyers failed, Sellers took full control! Learn to spot the reversal before the drop 🚨
💡 What is a Bearish Engulfed Candle?
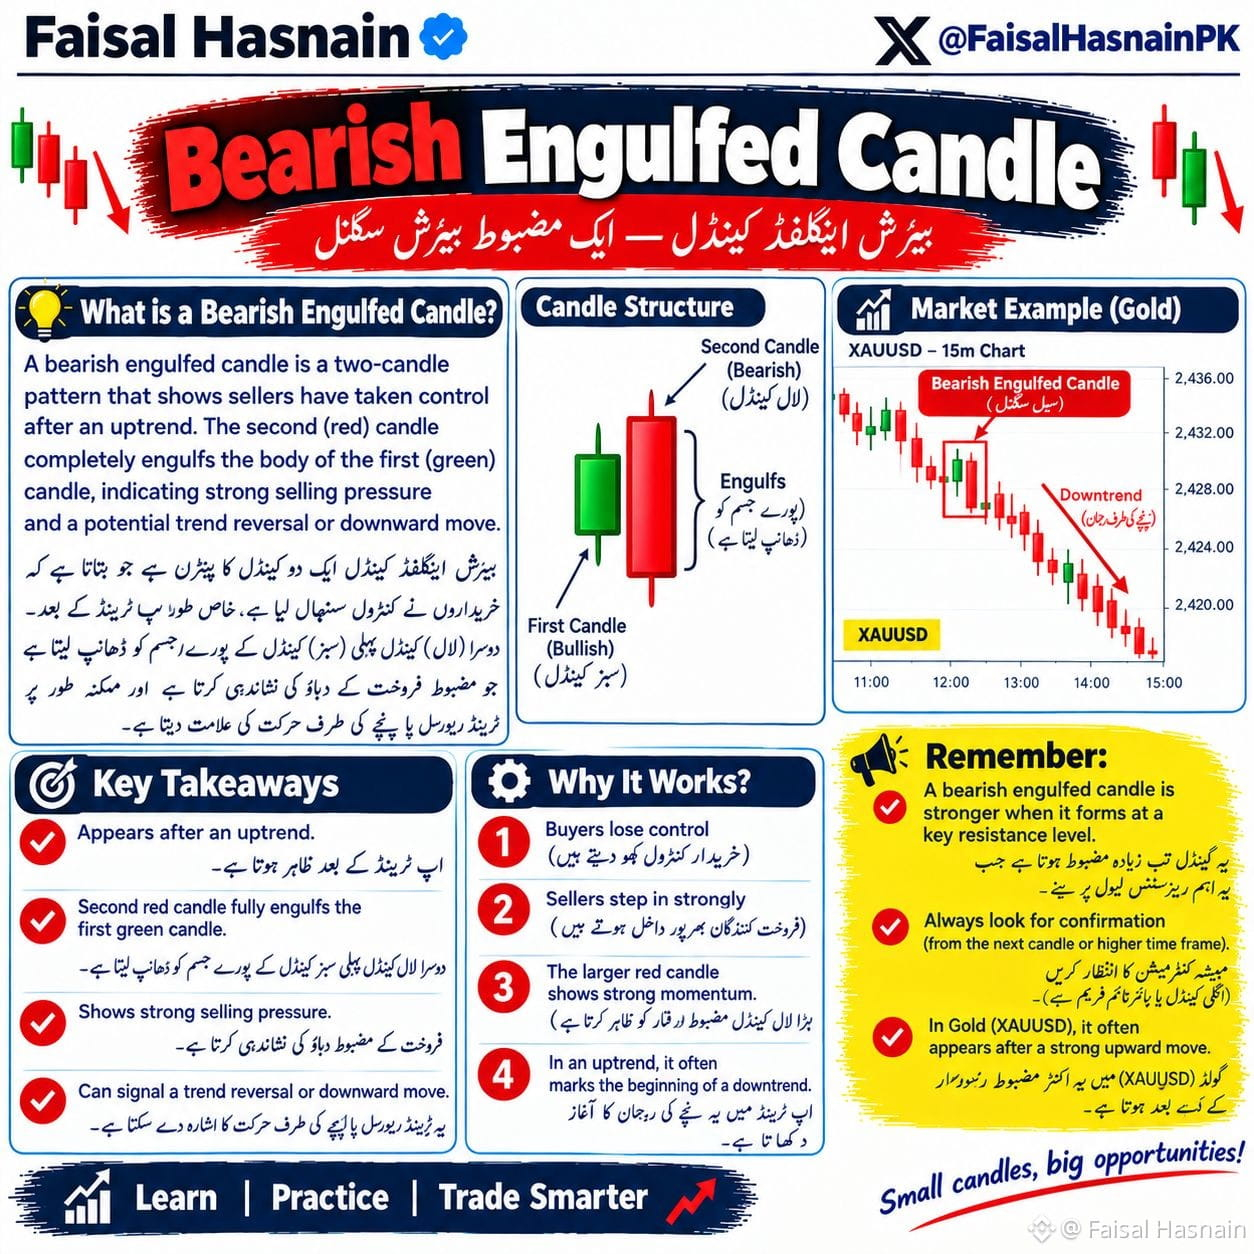
A bearish engulfed candle is a two-candle pattern that shows sellers have taken control after an uptrend. The second (red) candle completely engulfs the body of the first (green) candle, indicating strong selling pressure and a potential trend reversal or downward move.
🕯️ Candle Structure:
First Candle (Bullish) - Small green candle showing buyers are in control
Second Candle (Bearish) - Big red candle that fully engulfs the previous green candle's body - This shows complete seller dominance
📊 Market Example (XAUUSD - Gold 15m Chart):
Uptrend ⬆️ ➡️ Bearish Engulfed Candle forms at top ➡️ Downtrend starts 🔻
Price was rising, then a strong red candle covered the previous green candle completely - this shows sellers stepping in with full power and starting a sell-off.
✅ Key Takeaways:
✔️ Appears after an uptrend
✔️ Second red candle fully engulfs the first green candle
✔️ Shows strong selling pressure
✔️ Can signal a trend reversal or downward move
⚙️ Why It Works?
1️⃣ Buyers lose control
2️⃣ Sellers step in strongly
3️⃣ The larger red candle shows strong momentum
4️⃣ In an uptrend, it often marks the beginning of a downtrend
⚠️ Remember:
✔️ A bearish engulfed candle is stronger when it forms at a key resistance level
✔️ Always look for confirmation from the next candle or higher time frame
✔️ In $XAUT $BTC $ETH , it often appears after a strong upward move
Small candles, big opportunities! 💰
Save this for your next trade 🔖
Learn | Practice | Trade Smarter
#BearishEngulfing #CandlestickPatterns #priceaction #TechnicalAnalysis #FaisalHasnain
This 2-candle pattern at the top = Buyers failed, Sellers took full control! Learn to spot the reversal before the drop 🚨
💡 What is a Bearish Engulfed Candle?
A bearish engulfed candle is a two-candle pattern that shows sellers have taken control after an uptrend. The second (red) candle completely engulfs the body of the first (green) candle, indicating strong selling pressure and a potential trend reversal or downward move.
🕯️ Candle Structure:
First Candle (Bullish) - Small green candle showing buyers are in control
Second Candle (Bearish) - Big red candle that fully engulfs the previous green candle's body - This shows complete seller dominance
📊 Market Example (XAUUSD - Gold 15m Chart):
Uptrend ⬆️ ➡️ Bearish Engulfed Candle forms at top ➡️ Downtrend starts 🔻
Price was rising, then a strong red candle covered the previous green candle completely - this shows sellers stepping in with full power and starting a sell-off.
✅ Key Takeaways:
✔️ Appears after an uptrend
✔️ Second red candle fully engulfs the first green candle
✔️ Shows strong selling pressure
✔️ Can signal a trend reversal or downward move
⚙️ Why It Works?
1️⃣ Buyers lose control
2️⃣ Sellers step in strongly
3️⃣ The larger red candle shows strong momentum
4️⃣ In an uptrend, it often marks the beginning of a downtrend
⚠️ Remember:
✔️ A bearish engulfed candle is stronger when it forms at a key resistance level
✔️ Always look for confirmation from the next candle or higher time frame
✔️ In $XAUT $BTC $ETH , it often appears after a strong upward move
Small candles, big opportunities! 💰
Save this for your next trade 🔖
Learn | Practice | Trade Smarter
#BearishEngulfing #CandlestickPatterns #priceaction #TechnicalAnalysis #FaisalHasnain