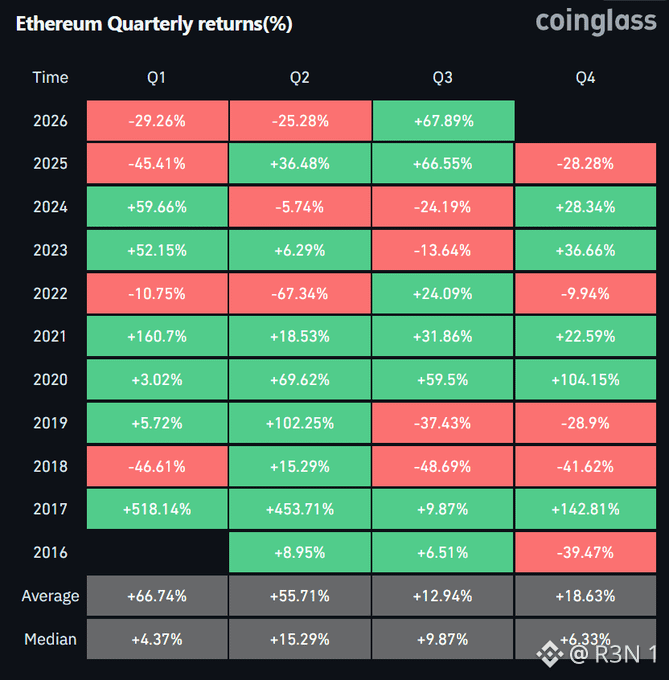
Looking at the full history, ETH's Q3 record before this year was 2020's +59.5%, with 2025 close behind at +66.55%. This quarter beats both, a genuine record by the numbers shown. Here's what I find more interesting than the headline though. Q3's median return across the full dataset is +9.87%, well below both the average of +12.94% and this year's +67.89%. That gap between median and average tells you Q3 returns are usually much more modest than the "average" figure implies, a few outlier years like 2017's +9.87% actually being one of the smaller Q3 prints, and this year's number, are doing a lot of work pulling that average up. The pattern worth flagging directly is what happens after strong Q3s specifically. 2025 had a strong Q3 at +66.55%, followed by a Q4 loss of -28.28%. 2020's massive Q3 at +59.5% was actually followed by an even bigger Q4 gain of +104.15%, so that one broke the other direction. Two data points isn't a reliable pattern on its own, but it does show that a standout Q3 has historically preceded both continuation and sharp reversal, not consistently one or the other. Worth being direct about the sample size problem here too. Ten years of quarterly data is genuinely thin for drawing statistical conclusions, crypto's volatility means single outlier quarters, 2017's +518% Q1 for instance, distort averages in ways that make this table more interesting as a record book than as a predictive tool. The open question isn't whether this Q3 is real, the data confirms it is. It's whether Q4 2026 follows the 2025 script, where a strong Q3 gave back gains, or the 2020 script, where strength compounded into an even bigger finish. This table alone doesn't tell you which. #BTC Price Analysis# $ETH #Altcoin Season#

Đăng

--
Tuyên bố miễn trừ trách nhiệm: Nội dung bao gồm cả quan điểm của bên thứ ba, không phải lời khuyên. Có thể sử dụng nội dung do Binance Ai đưa ra nhưng không được đảm bảo. Xem Điều khoản & Điều kiện.