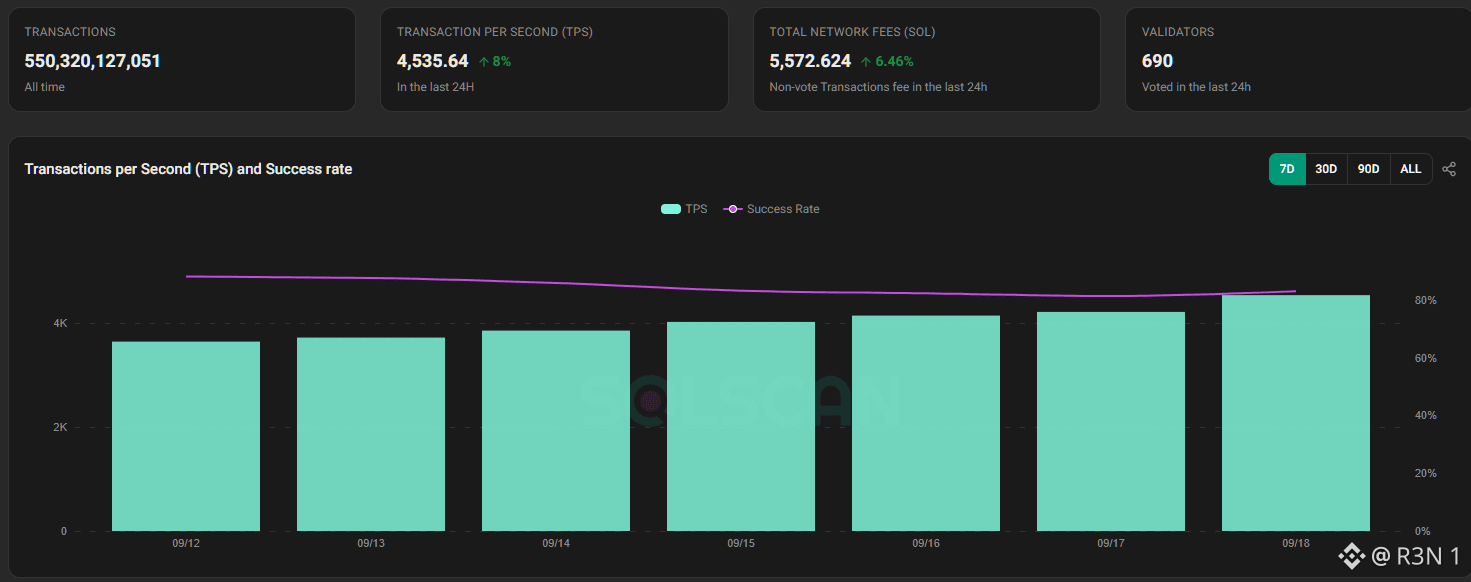
Solana's TPS climbed steadily from roughly 2.3K to over 4.5K across this seven day window, while the success rate line drifted the opposite direction, down from around 80% toward the high 70s. That divergence is actually the more interesting read here than either number alone. The headline figures are real scale. 550.3 billion total transactions processed all time, current TPS at 4,535.64, up 8% in the last 24 hours, non vote network fees at 5,572.624 SOL, up 6.46%, and 690 validators voting within the same window. Throughput and fee revenue both climbing together tracks logically, more transactions generally means more fees paid, that part isn't surprising. What's worth flagging is that rising throughput and a softening success rate moving in opposite directions isn't automatically a red flag, but it's not nothing either. Higher transaction volume can put more pressure on the network, and a slightly lower success rate during a period of rising activity is a pattern worth watching rather than dismissing outright, especially since the decline looks gradual and controlled here, not a sharp cliff. My honest read: this data reads as a network under increasing real load handling it reasonably well, not perfectly. The TPS growth is a genuinely positive signal on its own, actual usage climbing rather than stagnant. The success rate softening slightly alongside that growth is the detail I'd keep an eye on rather than ignore, since it's the kind of early signal that either resolves on its own as infrastructure catches up, or continues degrading if load keeps climbing. What I'm watching: whether that success rate stabilizes or keeps sliding as TPS continues climbing, since the trend in that relationship matters more than either single data point. #SOL #Macro Insights# $SOL #Meme Alpha#

Đăng

--
Tuyên bố miễn trừ trách nhiệm: Nội dung bao gồm cả quan điểm của bên thứ ba, không phải lời khuyên. Có thể sử dụng nội dung do Binance Ai đưa ra nhưng không được đảm bảo. Xem Điều khoản & Điều kiện.