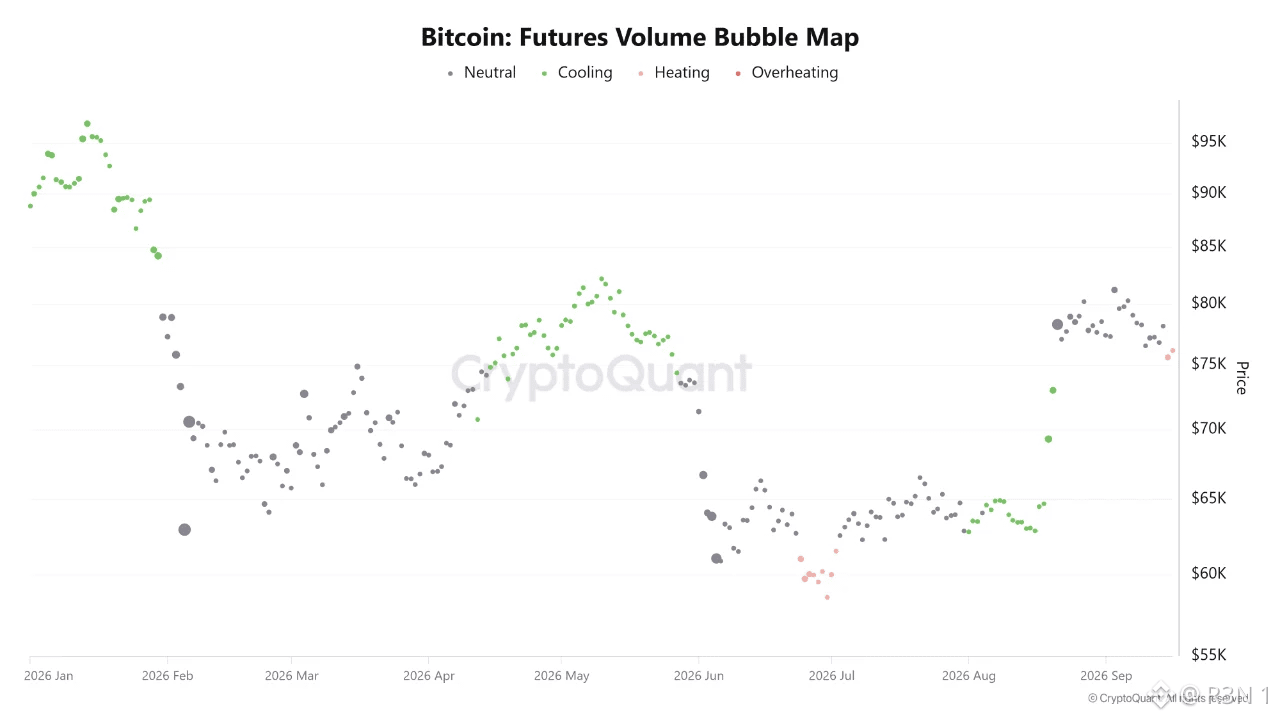
One red dot at the far right edge of this chart, sitting right around $75,000 to $76,000. That's the actual overheating signal, and it's worth being precise that it's a single fresh print, not yet a cluster. Compare that to how this indicator behaved back in late June and early July, when a genuine cluster of heating and overheating dots showed up together as price bottomed near $58,000 to $62,000. That was a sustained stretch of derivatives stress, several sessions in a row, not one isolated reading. What's showing up now is different in scale, one dot appearing during a bounce off recent lows, following a run of green cooling dots through late August into September as price recovered from around $70,000 toward $80,000. That context matters for how much weight to put on this. A single overheating print after a stretch of cooling and neutral readings is a signal worth watching, not yet a confirmed pattern. The June to July cluster gave you multiple data points confirming sustained leverage stress before price action got genuinely choppy. This is one print so far. My honest read: this is an early warning rather than a developed one. Derivatives volume spiking into overheating right as price tries to hold a recovery is exactly the kind of setup that's preceded choppier action before, per this same chart's own history, but the June to July example shows what a fuller confirmation actually looks like, and we're not there yet on this print alone. What I'm watching: whether this stays an isolated dot or starts clustering with more heating and overheating readings over the next several sessions, since that's what would actually confirm elevated leverage risk rather than a single spike in trading volume. $BTC #BTC Price Analysis# #Altcoin Season#

Đăng

--
Tuyên bố miễn trừ trách nhiệm: Nội dung bao gồm cả quan điểm của bên thứ ba, không phải lời khuyên. Có thể sử dụng nội dung do Binance Ai đưa ra nhưng không được đảm bảo. Xem Điều khoản & Điều kiện.