The ETH ETF number changes a lot when I change the window.
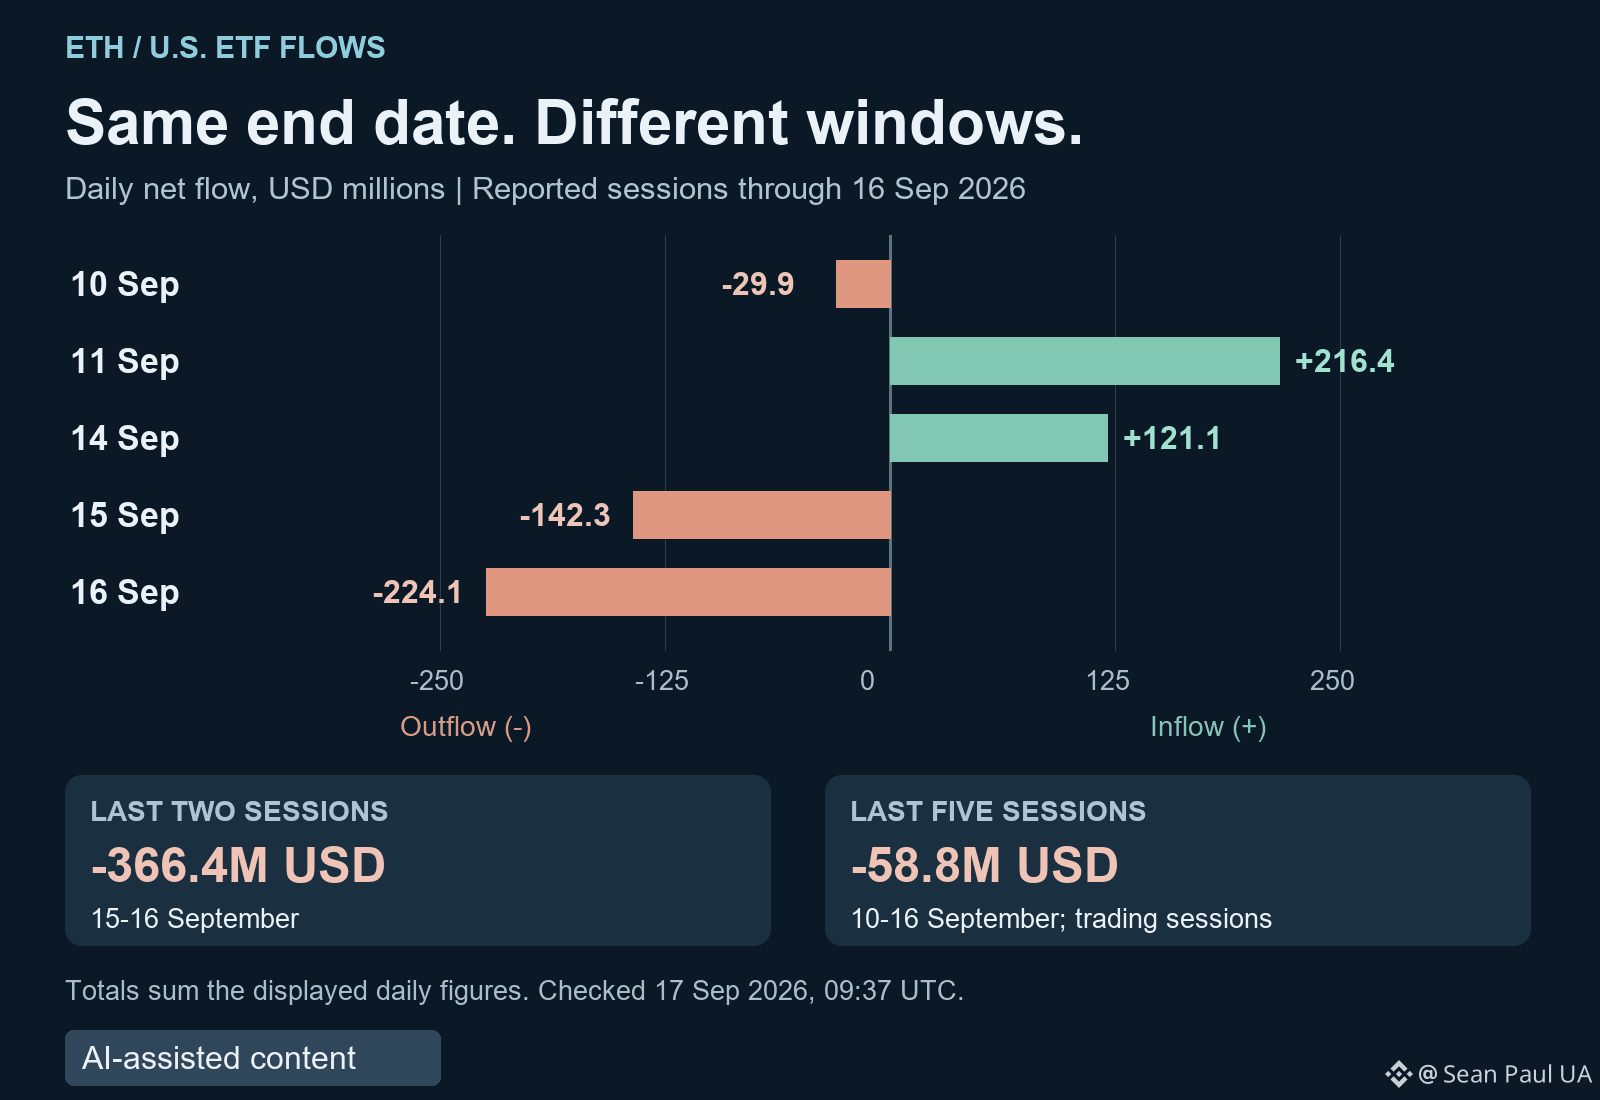
Farside's table shows $224.1 million of net outflows on September 16, after $142.3 million on September 15. Together: $366.4 million out across those two sessions.
But the five reported sessions from September 10 through 16 sum to a much smaller $58.8 million net outflow. Inflows on September 11 and 14 offset part of the withdrawals. Both totals use the same daily series and end date.
That is why I want the dates beside every flow headline. The five-session total gives context, but it can hide how sharply the last two sessions changed. The two-session total captures that turn, but leaves out the earlier inflows.
For my next ETH read, I'll keep the daily sequence beside the total. These figures describe this ETF channel; they don't measure every buyer and seller or settle the next price move.
Which would you check first: A) the latest session, B) the five-session total, or C) the daily sequence - and why?
#Ethereum #ETFs
Farside's table shows $224.1 million of net outflows on September 16, after $142.3 million on September 15. Together: $366.4 million out across those two sessions.
But the five reported sessions from September 10 through 16 sum to a much smaller $58.8 million net outflow. Inflows on September 11 and 14 offset part of the withdrawals. Both totals use the same daily series and end date.
That is why I want the dates beside every flow headline. The five-session total gives context, but it can hide how sharply the last two sessions changed. The two-session total captures that turn, but leaves out the earlier inflows.
For my next ETH read, I'll keep the daily sequence beside the total. These figures describe this ETF channel; they don't measure every buyer and seller or settle the next price move.
Which would you check first: A) the latest session, B) the five-session total, or C) the daily sequence - and why?
#Ethereum #ETFs