


A price chart shows you the move. It says nothing about who made it. CryptoQuant's spot average order size fills in that missing half.
What it measures. Trades on a spot exchange each carry a dollar value. This metric takes the average of those values and lays it over the price. When the average climbs, size is entering the market — funds, corporate treasuries, large desks. When it falls, the volume is coming from a crowd of small tickets, meaning retail.
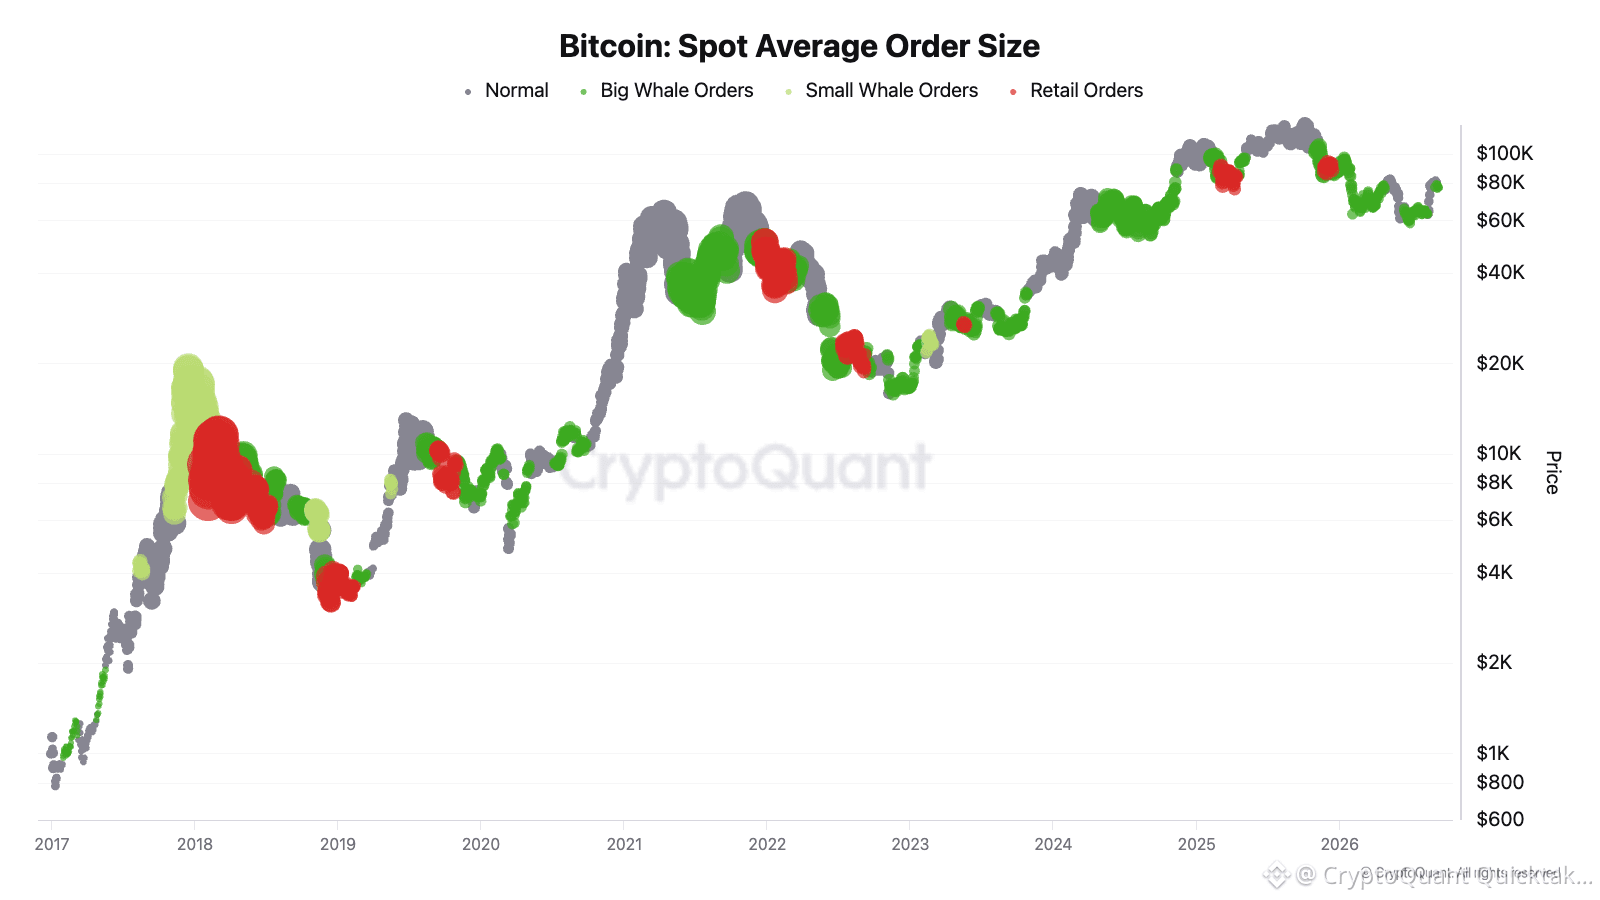
The output splits into four bands: dark green marks big whale orders, light green small whale, red retail, grey neutral.
What the history shows. Through 2018, Bitcoin slid from $20,000 down toward $4,000 and the chart stayed red for nearly the entire drop — retail bought every leg lower. In 2021, dark green filled the $30,000 to $60,000 accumulation zone, then flipped red at the peak, and the correction came after. Come 2022, green resurfaced around the $16,000 to $20,000 floor as retail quietly disappeared.
Read across all three: size shows up when fear peaks, and retail shows up when confidence does.
Where we are now. Bitcoin topped near $126,000 in October 2025 and sits around $77,000 today, roughly 39% off that high. Green has clustered again in the lower band while red has faded. That configuration has historically marked accumulation — treat it as background, not prediction.
The limits. Coverage stops at spot exchanges, which leaves OTC desks and ETF flows entirely out of frame. Size also carries no direction; $2 million could be entering or exiting. Read it alongside exchange netflow.
How to use it. Confirmation only, never a trigger. It reinforces a thesis you brought with you. It should never be the thesis.
Written by Zakariya Sharif