
#aster
aster
15.5M lượt xem
31,558 đang thảo luận
Phổ biến
Mới nhất

·
--
Đã xác minh
Mọi người xem tin này: Aster công bố báo cáo điều tra sự kiện bất thường, nguyên nhân là các tài khoản mới phối hợp giao dịch khiến giá lệch
Nhìn chung hơi tiêu cực, nhưng liệu điều này đã được phản ánh trước đó hay chưa thì cần đối chiếu diễn biến vài ngày trước. Trời ơi, tin này khá chấn động!
$ASTER (24h -1.05%)
#ASTER
Mọi người xem tin này: Aster công bố báo cáo điều tra sự kiện bất thường, nguyên nhân là các tài khoản mới phối hợp giao dịch khiến giá lệch
Nhìn chung hơi tiêu cực, nhưng liệu điều này đã được phản ánh trước đó hay chưa thì cần đối chiếu diễn biến vài ngày trước. Trời ơi, tin này khá chấn động!
$ASTER (24h -1.05%)
#ASTER
Nhìn chung hơi tiêu cực, nhưng liệu điều này đã được phản ánh trước đó hay chưa thì cần đối chiếu diễn biến vài ngày trước. Trời ơi, tin này khá chấn động!
$ASTER (24h -1.05%)
#ASTER
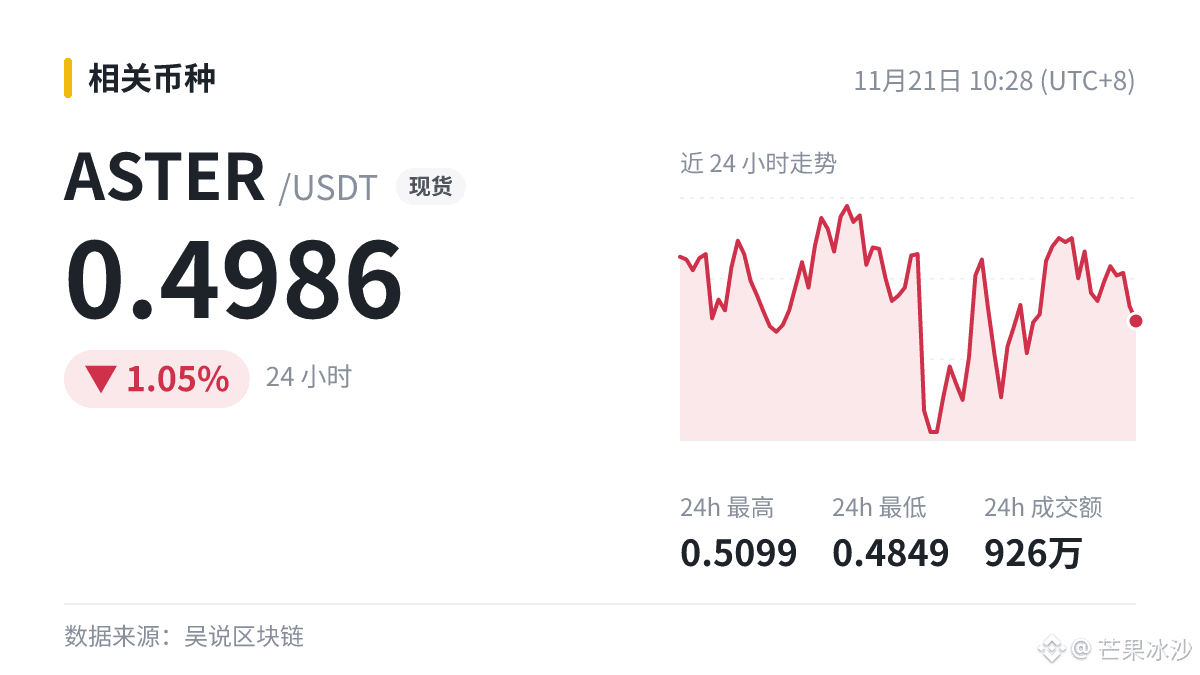
风中浪客:
就跌一个点?这报告看着吓人,盘面倒没啥反应 $ASTER
1
1.5k

🚨 ASTER GIẢI THÍCH SỰ KIỆN THANH LÝ NGÀY 15 THÁNG 11
Biến động của hợp đồng vĩnh cửu ngày 15 tháng 11 $ASTER có thể bắt nguồn từ hoạt động phối hợp của một nhóm tài khoản mới được tạo.
Theo báo cáo sự cố của @Aster_DEX , các tài khoản này giao dịch cùng nhau ở mức giá cao hơn đáng kể so với thị trường chung, khiến giá đánh dấu lệch khỏi chỉ số trong khoảng 12 phút.
Kết quả là gì? Một chuỗi thanh lý dây chuyền. Các vị thế bán khống bị ảnh hưởng trước, sau đó đến các vị thế mua khi thị trường biến động.
Khi không thể đóng các vị thế thông qua sổ lệnh, Quỹ Bảo hiểm đã can thiệp để hấp thụ phần rủi ro.
Hiện Aster đang rà soát các biện pháp bảo vệ trước tình trạng giá biến động đột ngột.
Bài học lớn hơn là tính toàn vẹn của giá, cơ chế bảo vệ giá đánh dấu và các biện pháp bảo vệ chống thanh lý cũng quan trọng không kém thanh khoản khi xây dựng một nền tảng phái sinh chuyên nghiệp.
Biến động thử thách mọi sàn giao dịch. Điều quan trọng là cách nền tảng ứng phó. 🧵
#ASTER #DeFi #CryptoTrading #Perpetuals
{future}(ASTERUSDT)
🚨 ASTER GIẢI THÍCH SỰ KIỆN THANH LÝ NGÀY 15 THÁNG 11
Biến động của hợp đồng vĩnh cửu ngày 15 tháng 11 $ASTER có thể bắt nguồn từ hoạt động phối hợp của một nhóm tài khoản mới được tạo.
Theo báo cáo sự cố của @Aster DEX , các tài khoản này giao dịch cùng nhau ở mức giá cao hơn đáng kể so với thị trường chung, khiến giá đánh dấu lệch khỏi chỉ số trong khoảng 12 phút.
Kết quả là gì? Một chuỗi thanh lý dây chuyền. Các vị thế bán khống bị ảnh hưởng trước, sau đó đến các vị thế mua khi thị trường biến động.
Khi không thể đóng các vị thế thông qua sổ lệnh, Quỹ Bảo hiểm đã can thiệp để hấp thụ phần rủi ro.
Hiện Aster đang rà soát các biện pháp bảo vệ trước tình trạng giá biến động đột ngột.
Bài học lớn hơn là tính toàn vẹn của giá, cơ chế bảo vệ giá đánh dấu và các biện pháp bảo vệ chống thanh lý cũng quan trọng không kém thanh khoản khi xây dựng một nền tảng phái sinh chuyên nghiệp.
Biến động thử thách mọi sàn giao dịch. Điều quan trọng là cách nền tảng ứng phó. 🧵
#ASTER #DeFi #CryptoTrading #Perpetuals
Biến động của hợp đồng vĩnh cửu ngày 15 tháng 11 $ASTER có thể bắt nguồn từ hoạt động phối hợp của một nhóm tài khoản mới được tạo.
Theo báo cáo sự cố của @Aster DEX , các tài khoản này giao dịch cùng nhau ở mức giá cao hơn đáng kể so với thị trường chung, khiến giá đánh dấu lệch khỏi chỉ số trong khoảng 12 phút.
Kết quả là gì? Một chuỗi thanh lý dây chuyền. Các vị thế bán khống bị ảnh hưởng trước, sau đó đến các vị thế mua khi thị trường biến động.
Khi không thể đóng các vị thế thông qua sổ lệnh, Quỹ Bảo hiểm đã can thiệp để hấp thụ phần rủi ro.
Hiện Aster đang rà soát các biện pháp bảo vệ trước tình trạng giá biến động đột ngột.
Bài học lớn hơn là tính toàn vẹn của giá, cơ chế bảo vệ giá đánh dấu và các biện pháp bảo vệ chống thanh lý cũng quan trọng không kém thanh khoản khi xây dựng một nền tảng phái sinh chuyên nghiệp.
Biến động thử thách mọi sàn giao dịch. Điều quan trọng là cách nền tảng ứng phó. 🧵
#ASTER #DeFi #CryptoTrading #Perpetuals
2
1.2k

·
--
🍂 $ASTER : NHỮNG LO NGẠI VỀ BẢO MẬT KHIẾN ASTER TRỞ THÀNH TÂM ĐIỂM!
Aster đang đối mặt với cả hoạt động trên nền tảng lẫn những câu hỏi mới về bảo mật:
- Ngày 18 tháng 11: Một người dùng báo cáo các giao dịch chuyển tiền trái phép trị giá khoảng 4,56 triệu USD liên quan đến khóa ví API bị lộ.
- Phản hồi của Aster: Đội ngũ cho biết đã tăng cường các biện pháp kiểm soát ủy quyền và đang điều tra sự cố.
- Hoạt động trên nền tảng: World Liberty Financial đã hoàn tất đợt mua lại WLFI trị giá 5 triệu USD được cho là thực hiện thông qua Aster.
- Tokenomics: Bản cập nhật mới nhất của Aster cho biết đã mua lại 2,6 triệu ASTER và đốt một lượng tương đương.
Liệu Aster có thể khôi phục niềm tin trong khi tiếp tục mở rộng nền tảng không?
$ASTER
{future}(ASTERUSDT)
.
.
.
#ASTER #AsterDEX #Crypto
Đây không phải lời khuyên tài chính. Hãy tự nghiên cứu.
🍂 $ASTER : NHỮNG LO NGẠI VỀ BẢO MẬT KHIẾN ASTER TRỞ THÀNH TÂM ĐIỂM!
Aster đang đối mặt với cả hoạt động trên nền tảng lẫn những câu hỏi mới về bảo mật:
- Ngày 18 tháng 11: Một người dùng báo cáo các giao dịch chuyển tiền trái phép trị giá khoảng 4,56 triệu USD liên quan đến khóa ví API bị lộ.
- Phản hồi của Aster: Đội ngũ cho biết đã tăng cường các biện pháp kiểm soát ủy quyền và đang điều tra sự cố.
- Hoạt động trên nền tảng: World Liberty Financial đã hoàn tất đợt mua lại WLFI trị giá 5 triệu USD được cho là thực hiện thông qua Aster.
- Tokenomics: Bản cập nhật mới nhất của Aster cho biết đã mua lại 2,6 triệu ASTER và đốt một lượng tương đương.
Liệu Aster có thể khôi phục niềm tin trong khi tiếp tục mở rộng nền tảng không?
$ASTER
.
.
.
#ASTER #AsterDEX #Crypto
Đây không phải lời khuyên tài chính. Hãy tự nghiên cứu.
Aster đang đối mặt với cả hoạt động trên nền tảng lẫn những câu hỏi mới về bảo mật:
- Ngày 18 tháng 11: Một người dùng báo cáo các giao dịch chuyển tiền trái phép trị giá khoảng 4,56 triệu USD liên quan đến khóa ví API bị lộ.
- Phản hồi của Aster: Đội ngũ cho biết đã tăng cường các biện pháp kiểm soát ủy quyền và đang điều tra sự cố.
- Hoạt động trên nền tảng: World Liberty Financial đã hoàn tất đợt mua lại WLFI trị giá 5 triệu USD được cho là thực hiện thông qua Aster.
- Tokenomics: Bản cập nhật mới nhất của Aster cho biết đã mua lại 2,6 triệu ASTER và đốt một lượng tương đương.
Liệu Aster có thể khôi phục niềm tin trong khi tiếp tục mở rộng nền tảng không?
$ASTER
.
.
.
#ASTER #AsterDEX #Crypto
Đây không phải lời khuyên tài chính. Hãy tự nghiên cứu.

147

·
--
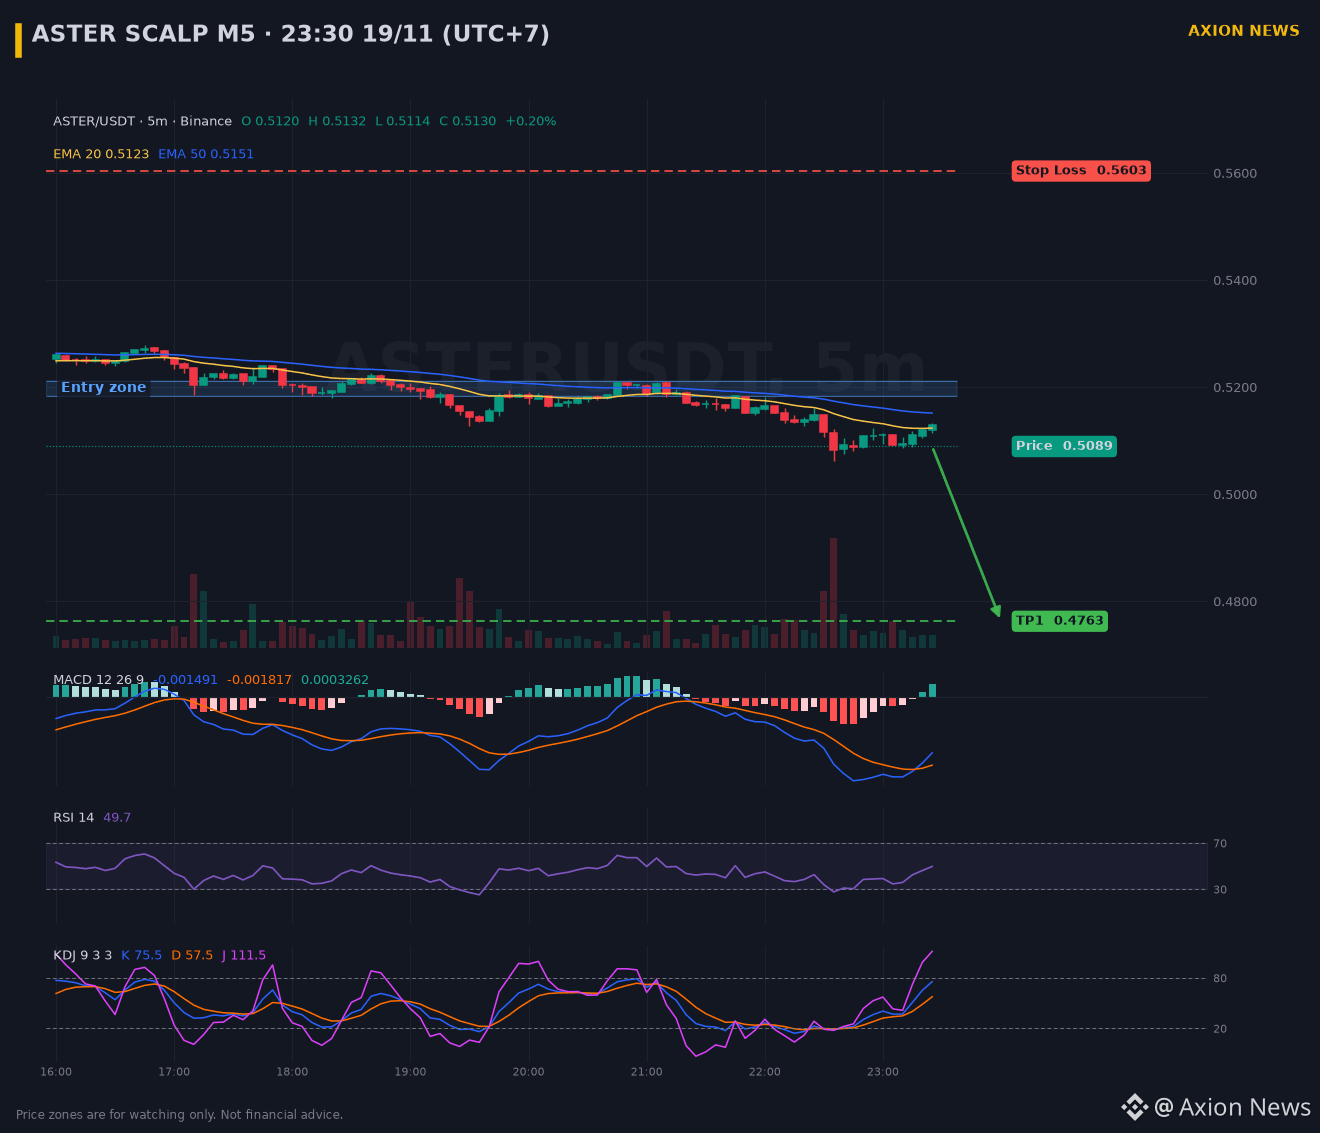
$ASTER lên không nổi, SHORT thử 🔴 R:R 1:1.1
📍 Entry: 0.5183 - 0.5212
🛑 SL: 0.5603 (+7.8%), theo biên độ trung bình một ngày (ADR)
🎯 TP1: 0.4763 (-8.4%) | R:R 1:1.1
ASTER hồi lên vùng này là mình rình short
Scalp M5 19/11, lệnh chờ, không đuổi.
Lý do: Order Block giảm trên M5, H4 giảm, M15 giảm.
Quá 01:15 20/11 chưa khớp thì bỏ, khỏi chờ như chờ crush. SL xa, vốn nhẹ thôi.
Anh em rình cùng không?
Tám cho vui, không phải lời khuyên đầu tư.
#ASTER #BTC
$ASTER lên không nổi, SHORT thử 🔴 R:R 1:1.1
📍 Entry: 0.5183 - 0.5212
🛑 SL: 0.5603 (+7.8%), theo biên độ trung bình một ngày (ADR)
🎯 TP1: 0.4763 (-8.4%) | R:R 1:1.1
ASTER hồi lên vùng này là mình rình short
Scalp M5 19/11, lệnh chờ, không đuổi.
Lý do: Order Block giảm trên M5, H4 giảm, M15 giảm.
Quá 01:15 20/11 chưa khớp thì bỏ, khỏi chờ như chờ crush. SL xa, vốn nhẹ thôi.
Anh em rình cùng không?
Tám cho vui, không phải lời khuyên đầu tư.
#ASTER #BTC
📍 Entry: 0.5183 - 0.5212
🛑 SL: 0.5603 (+7.8%), theo biên độ trung bình một ngày (ADR)
🎯 TP1: 0.4763 (-8.4%) | R:R 1:1.1
ASTER hồi lên vùng này là mình rình short
Scalp M5 19/11, lệnh chờ, không đuổi.
Lý do: Order Block giảm trên M5, H4 giảm, M15 giảm.
Quá 01:15 20/11 chưa khớp thì bỏ, khỏi chờ như chờ crush. SL xa, vốn nhẹ thôi.
Anh em rình cùng không?
Tám cho vui, không phải lời khuyên đầu tư.
#ASTER #BTC
4

·
--
$ASTER đang giữ vững vùng hỗ trợ hiện tại, và bên mua vẫn có lý do để bảo vệ vùng này.
$ASTER – Giá đang cố ổn định gần vùng hỗ trợ, và bên mua đang chờ đà tiếp diễn từ khu vực này.
Kế hoạch giao dịch LONG $ASTER (đòn bẩy tối đa 10x)
🎯 Điểm vào: 0.4918 - 0.4969
🛑 Cắt lỗ: 0.4842
✅ Chốt lời 1: 0.5042
✅ Chốt lời 2: 0.5114
✅ Chốt lời 3: 0.5197
• Đại học NAILCON tổ chức Hội nghị Prosper & Polish tại Atlanta, kết nối lĩnh vực làm đẹp, kinh doanh và chăm sóc sức khỏe
Bạn sẽ chỉ vào lệnh mua với $ASTER sau khi có xác nhận, hay bắt đầu chia lệnh quanh vùng hỗ trợ?
Giao dịch $ASTER tại đây 👇
#ASTER #HànhĐộngGiá
$ASTER đang giữ vững vùng hỗ trợ hiện tại, và bên mua vẫn có lý do để bảo vệ vùng này.
$ASTER – Giá đang cố ổn định gần vùng hỗ trợ, và bên mua đang chờ đà tiếp diễn từ khu vực này.
Kế hoạch giao dịch LONG $ASTER (đòn bẩy tối đa 10x)
🎯 Điểm vào: 0.4918 - 0.4969
🛑 Cắt lỗ: 0.4842
✅ Chốt lời 1: 0.5042
✅ Chốt lời 2: 0.5114
✅ Chốt lời 3: 0.5197
• Đại học NAILCON tổ chức Hội nghị Prosper & Polish tại Atlanta, kết nối lĩnh vực làm đẹp, kinh doanh và chăm sóc sức khỏe
Bạn sẽ chỉ vào lệnh mua với $ASTER sau khi có xác nhận, hay bắt đầu chia lệnh quanh vùng hỗ trợ?
Giao dịch $ASTER tại đây 👇
#ASTER #HànhĐộngGiá
$ASTER – Giá đang cố ổn định gần vùng hỗ trợ, và bên mua đang chờ đà tiếp diễn từ khu vực này.
Kế hoạch giao dịch LONG $ASTER (đòn bẩy tối đa 10x)
🎯 Điểm vào: 0.4918 - 0.4969
🛑 Cắt lỗ: 0.4842
✅ Chốt lời 1: 0.5042
✅ Chốt lời 2: 0.5114
✅ Chốt lời 3: 0.5197
• Đại học NAILCON tổ chức Hội nghị Prosper & Polish tại Atlanta, kết nối lĩnh vực làm đẹp, kinh doanh và chăm sóc sức khỏe
Bạn sẽ chỉ vào lệnh mua với $ASTER sau khi có xác nhận, hay bắt đầu chia lệnh quanh vùng hỗ trợ?
Giao dịch $ASTER tại đây 👇
#ASTER #HànhĐộngGiá
412

·
--
DỮ LIỆU THEO DÕI VỊ THẾ ĐANG MỞ: $ASTER (BÁN KHỐNG)
Trạng thái: Đã xác nhận độ phân kỳ chênh lệch (9.6%)
• Tài sản: $ASTER Hợp đồng vĩnh cửu (BÁN KHỐNG)
• Lợi nhuận: Biến động tài sản 9.6% │ ROE +53.2% (+$39.76)
• Giá: $0.5320 │ Giá đánh dấu: $0.4809
• Chiến lược: Danh mục phòng hộ gồm 10 đồng coin (Trung lập với thị trường)
• Chất xúc tác: Mức định giá FDV/HoldersRev cao gấp 126.1 lần + TVL giảm -10.01% trong 7 ngày sau vụ khai thác lỗ hổng trị giá 4.56M USD và cú sập giá đột ngột + áp lực bán từ đợt airdrop Giai đoạn 6 trị giá 63.38M + 71.47% vị thế mua đang tập trung đông đúc
Xem danh mục đầu tư trực tiếp đầy đủ trên Binance Copy Trading:
https://www.binance.com/en/copy-trading/lead-details/4483279284065330433?timeRange=30D
#ASTER #BinanceSquare #CopyTrading
DỮ LIỆU THEO DÕI VỊ THẾ ĐANG MỞ: $ASTER (BÁN KHỐNG)
Trạng thái: Đã xác nhận độ phân kỳ chênh lệch (9.6%)
• Tài sản: $ASTER Hợp đồng vĩnh cửu (BÁN KHỐNG)
• Lợi nhuận: Biến động tài sản 9.6% │ ROE +53.2% (+$39.76)
• Giá: $0.5320 │ Giá đánh dấu: $0.4809
• Chiến lược: Danh mục phòng hộ gồm 10 đồng coin (Trung lập với thị trường)
• Chất xúc tác: Mức định giá FDV/HoldersRev cao gấp 126.1 lần + TVL giảm -10.01% trong 7 ngày sau vụ khai thác lỗ hổng trị giá 4.56M USD và cú sập giá đột ngột + áp lực bán từ đợt airdrop Giai đoạn 6 trị giá 63.38M + 71.47% vị thế mua đang tập trung đông đúc
Xem danh mục đầu tư trực tiếp đầy đủ trên Binance Copy Trading:
https://www.binance.com/en/copy-trading/lead-details/4483279284065330433?timeRange=30D
#ASTER #BinanceSquare #CopyTrading
Trạng thái: Đã xác nhận độ phân kỳ chênh lệch (9.6%)
• Tài sản: $ASTER Hợp đồng vĩnh cửu (BÁN KHỐNG)
• Lợi nhuận: Biến động tài sản 9.6% │ ROE +53.2% (+$39.76)
• Giá: $0.5320 │ Giá đánh dấu: $0.4809
• Chiến lược: Danh mục phòng hộ gồm 10 đồng coin (Trung lập với thị trường)
• Chất xúc tác: Mức định giá FDV/HoldersRev cao gấp 126.1 lần + TVL giảm -10.01% trong 7 ngày sau vụ khai thác lỗ hổng trị giá 4.56M USD và cú sập giá đột ngột + áp lực bán từ đợt airdrop Giai đoạn 6 trị giá 63.38M + 71.47% vị thế mua đang tập trung đông đúc
Xem danh mục đầu tư trực tiếp đầy đủ trên Binance Copy Trading:
https://www.binance.com/en/copy-trading/lead-details/4483279284065330433?timeRange=30D
#ASTER #BinanceSquare #CopyTrading
233

·
--
Trong top 50 hôm nay, đồng chống chịu đà giảm tốt nhất không ngờ lại là ASTER. Lúc viết bài, giá là 0,478 USD, chỉ giảm 4,19% trong 24 giờ; Bitcoin giảm 8,82%, Ethereum giảm 9,52%, mức giảm của nó chỉ bằng khoảng một nửa thị trường. Nhưng khoan vội khen nó vững: trong bảy ngày, nó đã giảm 25,70%; trong 30 ngày giảm 33,80%. Rốt cuộc vẫn không thoát khỏi đợt giảm này. Khối lượng giao dịch 24 giờ là 117 triệu USD, vốn hóa thị trường 1,23 tỷ USD. Nói dễ hiểu là: chống chịu tốt trong một ngày không có nghĩa là xu hướng cũng vững, chỉ là hôm nay đến lượt nó giảm chậm hơn thôi. Là một nhà đầu tư nhỏ lẻ lão làng, tôi đã trả học phí thay các bạn rồi: đồng giảm ít nhất hôm nay thường sẽ giảm bù vào ngày mai. Trong tay các bạn có đồng nào hôm nay giảm ít nhất không? Giữ tiếp hay tranh thủ đổi sang đồng khác?
—— Tiểu Khải, nhà đầu tư nhỏ lẻ Web3
Tuyên bố miễn trừ trách nhiệm: Nội dung trên chỉ thể hiện quan điểm cá nhân, không cấu thành lời khuyên đầu tư. Tham gia thị trường có rủi ro, cần thận trọng khi giao dịch.
#ASTER #chốngchịugiảm
Trong top 50 hôm nay, đồng chống chịu đà giảm tốt nhất không ngờ lại là ASTER. Lúc viết bài, giá là 0,478 USD, chỉ giảm 4,19% trong 24 giờ; Bitcoin giảm 8,82%, Ethereum giảm 9,52%, mức giảm của nó chỉ bằng khoảng một nửa thị trường. Nhưng khoan vội khen nó vững: trong bảy ngày, nó đã giảm 25,70%; trong 30 ngày giảm 33,80%. Rốt cuộc vẫn không thoát khỏi đợt giảm này. Khối lượng giao dịch 24 giờ là 117 triệu USD, vốn hóa thị trường 1,23 tỷ USD. Nói dễ hiểu là: chống chịu tốt trong một ngày không có nghĩa là xu hướng cũng vững, chỉ là hôm nay đến lượt nó giảm chậm hơn thôi. Là một nhà đầu tư nhỏ lẻ lão làng, tôi đã trả học phí thay các bạn rồi: đồng giảm ít nhất hôm nay thường sẽ giảm bù vào ngày mai. Trong tay các bạn có đồng nào hôm nay giảm ít nhất không? Giữ tiếp hay tranh thủ đổi sang đồng khác?
—— Tiểu Khải, nhà đầu tư nhỏ lẻ Web3
Tuyên bố miễn trừ trách nhiệm: Nội dung trên chỉ thể hiện quan điểm cá nhân, không cấu thành lời khuyên đầu tư. Tham gia thị trường có rủi ro, cần thận trọng khi giao dịch.
#ASTER #chốngchịugiảm
—— Tiểu Khải, nhà đầu tư nhỏ lẻ Web3
Tuyên bố miễn trừ trách nhiệm: Nội dung trên chỉ thể hiện quan điểm cá nhân, không cấu thành lời khuyên đầu tư. Tham gia thị trường có rủi ro, cần thận trọng khi giao dịch.
#ASTER #chốngchịugiảm
200

·
--
Xem bản dịch
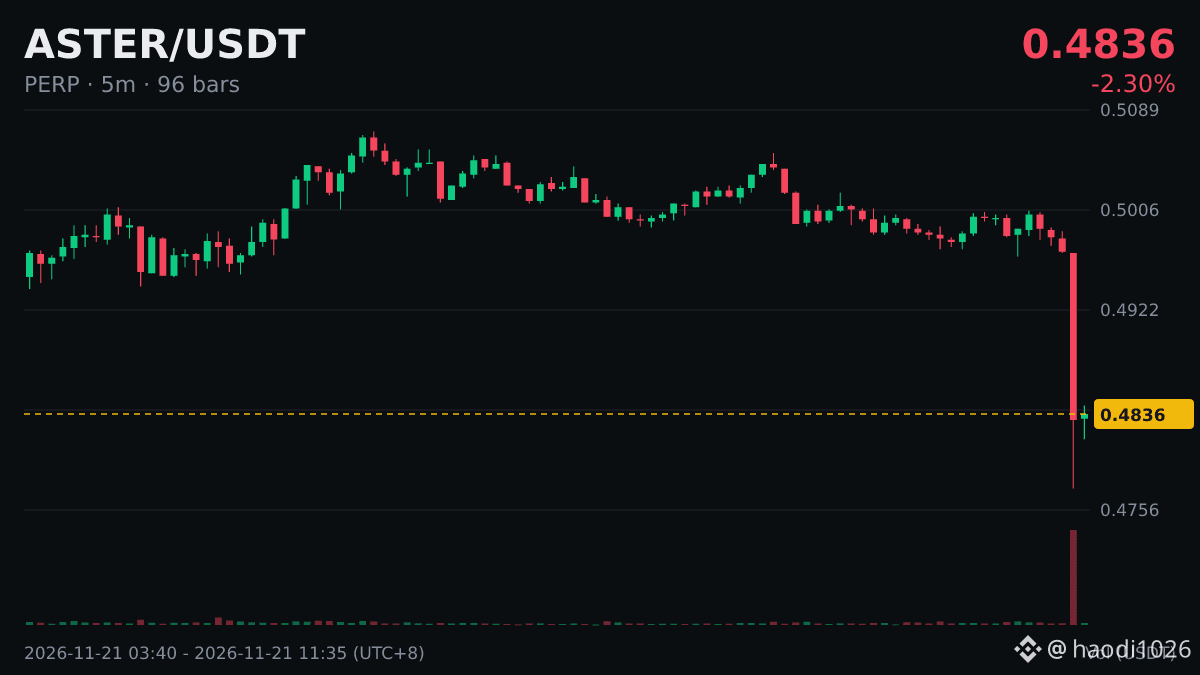
中午盯盘的时候发现 $ASTER 跳水了。
5分钟 -2.76%,价格到了 0.4866。
说实话这种急跌见过不少,有的是插针,有的是真破位。这次 24h 成交额 996万美元,能参考一下量能。
你们怎么看,是哪种?
#ASTER
这些也可能错,别当建议。
中午盯盘的时候发现 $ASTER 跳水了。
5分钟 -2.76%,价格到了 0.4866。
说实话这种急跌见过不少,有的是插针,有的是真破位。这次 24h 成交额 996万美元,能参考一下量能。
你们怎么看,是哪种?
#ASTER
这些也可能错,别当建议。
5分钟 -2.76%,价格到了 0.4866。
说实话这种急跌见过不少,有的是插针,有的是真破位。这次 24h 成交额 996万美元,能参考一下量能。
你们怎么看,是哪种?
#ASTER
这些也可能错,别当建议。
45

Xem bản dịch
ASTER, FET and MMT: Where AI, DeFi and Momentum Narratives Meet a Volatile MarketThe latest market action across Aster, Artificial Superintelligence Alliance and Momentum reveals three very different stories unfolding at once. Aster is attempting to stabilize after a sharp multiweek decline. FET is under significant technical pressure despite positive capital flow. MMT is still carrying strong upside momentum after a rapid rally, but its volatility is now impossible to ignore.
For traders watching the next phase of market rotation, these three assets highlight an important reality: narratives can bring attention, but price structure, volume and liquidity determine whether that attention becomes sustainable momentum.
Aster is trading near $0.4851, down 4.21% over the latest 24 hour session. The token moved between $0.4672 and $0.5099, showing that sellers remain active while buyers are trying to defend the lower end of the range. Aster is currently below its 7 day, 25 day and 99 day moving averages, with the 7 day average near $0.5289, the 25 day average near $0.6294 and the 99 day average near $0.6876. This alignment keeps the daily technical structure bearish.
The MACD remains in bearish territory, with a death cross still active, while the SuperTrend continues to signal downward momentum. Aster’s RSI is near 25.42, which indicates oversold conditions. This does not confirm that the downtrend is complete, but it does show that the market has already absorbed a substantial amount of selling pressure. Aster is trading only 1.40% above its 7 day and 30 day range low of $0.4784, making this area especially important for short term sentiment.
Volume is currently around half of the 7 day average, while daily capital flow remains slightly negative. This suggests the market has not yet shown a strong return of demand. For Aster, the key signal is whether price can form stable acceptance above the recent low range with improving volume. A short bounce can occur in oversold markets, but lasting recovery needs stronger participation and a clear reduction in selling pressure.
FET is trading near $0.1096, down 10.82% in the latest 24 hour session. The price reached $0.1244 before dropping to $0.1039, reflecting significant volatility across the AI sector. FET remains below all major daily moving averages, with the 7 day average near $0.1252, the 25 day average near $0.1448 and the 99 day average near $0.1754. This bearish alignment shows that the broader trend remains fragile.
FET’s RSI is near 14.18, placing it in deeply oversold territory. The MACD has recently confirmed a death cross, and the SuperTrend remains down. Price is now below the previous 7 day and 30 day range low of $0.1121, which increases the importance of how the market behaves around current levels.
However, there is one notable contrast in FET’s data. Daily capital flow is positive, with net inflow of approximately 6.10 million FET and a net inflow rate of 8.24%. This does not erase the bearish chart structure, but it suggests that demand has appeared during a period of heavy price weakness. FET’s latest volume is close to its 7 day average, which means participation remains active. The market will be watching whether this inflow can translate into stabilization, or whether the broader downtrend continues to outweigh emerging demand.
MMT is trading near $0.2382, down 1.77% over the latest 24 hour session. On the surface, that decline appears modest compared with Aster and FET. But MMT’s broader move tells a more dramatic story. The asset is up 104.99% over 7 days and 63.82% over 30 days, making it the strongest momentum asset in this comparison.
MMT recently reached a 7 day and 30 day high of $0.3177 before pulling back toward $0.2382. The daily RSI is near 72.25, which places the asset in overbought territory despite the recent decline. MACD remains bullish with a golden cross active, and the SuperTrend is still pointing up. Price is above the 7 day, 25 day and 99 day moving averages, although the overall moving average alignment remains mixed because of the speed of the recent advance.
The current pullback comes with volume at only 0.28 times the 7 day average, which may indicate that trading intensity has cooled after the surge. Daily capital flow remains positive, with net inflow of approximately 1.34 million MMT. That supports the bullish momentum narrative, but the combination of strong weekly gains, an elevated RSI and sharp intraday movement means volatility risk remains high. MMT is still more than 150% above its recent range low, so the market will be focused on whether it can consolidate rather than simply extend volatility.
The central market message is clear. Aster and FET are technically oversold and remain under bearish pressure, while MMT is still structurally stronger but managing the aftermath of a powerful rally. Aster needs stronger volume and reduced outflow to build a meaningful base. FET needs to show whether its positive capital flow can overcome its weak trend structure. MMT needs to demonstrate that momentum can transition into orderly consolidation rather than unstable price swings.
The next move will be shaped by real participation, not social media noise. Watch volume, capital flow, moving average recovery and how each asset responds around its recent range boundaries. In a high volatility market, disciplined confirmation is more valuable than emotional reaction.
#Aster #FET #MMT #CryptoMarket #CryptoTrading
$ASTER
{spot}(ASTERUSDT)
$FET
{spot}(FETUSDT)
$MMT
{spot}(MMTUSDT)
ASTER, FET and MMT: Where AI, DeFi and Momentum Narratives Meet a Volatile Market
The latest market action across Aster, Artificial Superintelligence Alliance and Momentum reveals three very different stories unfolding at once. Aster is attempting to stabilize after a sharp multiweek decline. FET is under significant technical pressure despite positive capital flow. MMT is still carrying strong upside momentum after a rapid rally, but its volatility is now impossible to ignore.
For traders watching the next phase of market rotation, these three assets highlight an important reality: narratives can bring attention, but price structure, volume and liquidity determine whether that attention becomes sustainable momentum.
Aster is trading near $0.4851, down 4.21% over the latest 24 hour session. The token moved between $0.4672 and $0.5099, showing that sellers remain active while buyers are trying to defend the lower end of the range. Aster is currently below its 7 day, 25 day and 99 day moving averages, with the 7 day average near $0.5289, the 25 day average near $0.6294 and the 99 day average near $0.6876. This alignment keeps the daily technical structure bearish.
The MACD remains in bearish territory, with a death cross still active, while the SuperTrend continues to signal downward momentum. Aster’s RSI is near 25.42, which indicates oversold conditions. This does not confirm that the downtrend is complete, but it does show that the market has already absorbed a substantial amount of selling pressure. Aster is trading only 1.40% above its 7 day and 30 day range low of $0.4784, making this area especially important for short term sentiment.
Volume is currently around half of the 7 day average, while daily capital flow remains slightly negative. This suggests the market has not yet shown a strong return of demand. For Aster, the key signal is whether price can form stable acceptance above the recent low range with improving volume. A short bounce can occur in oversold markets, but lasting recovery needs stronger participation and a clear reduction in selling pressure.
FET is trading near $0.1096, down 10.82% in the latest 24 hour session. The price reached $0.1244 before dropping to $0.1039, reflecting significant volatility across the AI sector. FET remains below all major daily moving averages, with the 7 day average near $0.1252, the 25 day average near $0.1448 and the 99 day average near $0.1754. This bearish alignment shows that the broader trend remains fragile.
FET’s RSI is near 14.18, placing it in deeply oversold territory. The MACD has recently confirmed a death cross, and the SuperTrend remains down. Price is now below the previous 7 day and 30 day range low of $0.1121, which increases the importance of how the market behaves around current levels.
However, there is one notable contrast in FET’s data. Daily capital flow is positive, with net inflow of approximately 6.10 million FET and a net inflow rate of 8.24%. This does not erase the bearish chart structure, but it suggests that demand has appeared during a period of heavy price weakness. FET’s latest volume is close to its 7 day average, which means participation remains active. The market will be watching whether this inflow can translate into stabilization, or whether the broader downtrend continues to outweigh emerging demand.
MMT is trading near $0.2382, down 1.77% over the latest 24 hour session. On the surface, that decline appears modest compared with Aster and FET. But MMT’s broader move tells a more dramatic story. The asset is up 104.99% over 7 days and 63.82% over 30 days, making it the strongest momentum asset in this comparison.
MMT recently reached a 7 day and 30 day high of $0.3177 before pulling back toward $0.2382. The daily RSI is near 72.25, which places the asset in overbought territory despite the recent decline. MACD remains bullish with a golden cross active, and the SuperTrend is still pointing up. Price is above the 7 day, 25 day and 99 day moving averages, although the overall moving average alignment remains mixed because of the speed of the recent advance.
The current pullback comes with volume at only 0.28 times the 7 day average, which may indicate that trading intensity has cooled after the surge. Daily capital flow remains positive, with net inflow of approximately 1.34 million MMT. That supports the bullish momentum narrative, but the combination of strong weekly gains, an elevated RSI and sharp intraday movement means volatility risk remains high. MMT is still more than 150% above its recent range low, so the market will be focused on whether it can consolidate rather than simply extend volatility.
The central market message is clear. Aster and FET are technically oversold and remain under bearish pressure, while MMT is still structurally stronger but managing the aftermath of a powerful rally. Aster needs stronger volume and reduced outflow to build a meaningful base. FET needs to show whether its positive capital flow can overcome its weak trend structure. MMT needs to demonstrate that momentum can transition into orderly consolidation rather than unstable price swings.
The next move will be shaped by real participation, not social media noise. Watch volume, capital flow, moving average recovery and how each asset responds around its recent range boundaries. In a high volatility market, disciplined confirmation is more valuable than emotional reaction.
#Aster #FET #MMT #CryptoMarket #CryptoTrading
$ASTER
$FET
$MMT
For traders watching the next phase of market rotation, these three assets highlight an important reality: narratives can bring attention, but price structure, volume and liquidity determine whether that attention becomes sustainable momentum.
Aster is trading near $0.4851, down 4.21% over the latest 24 hour session. The token moved between $0.4672 and $0.5099, showing that sellers remain active while buyers are trying to defend the lower end of the range. Aster is currently below its 7 day, 25 day and 99 day moving averages, with the 7 day average near $0.5289, the 25 day average near $0.6294 and the 99 day average near $0.6876. This alignment keeps the daily technical structure bearish.
The MACD remains in bearish territory, with a death cross still active, while the SuperTrend continues to signal downward momentum. Aster’s RSI is near 25.42, which indicates oversold conditions. This does not confirm that the downtrend is complete, but it does show that the market has already absorbed a substantial amount of selling pressure. Aster is trading only 1.40% above its 7 day and 30 day range low of $0.4784, making this area especially important for short term sentiment.
Volume is currently around half of the 7 day average, while daily capital flow remains slightly negative. This suggests the market has not yet shown a strong return of demand. For Aster, the key signal is whether price can form stable acceptance above the recent low range with improving volume. A short bounce can occur in oversold markets, but lasting recovery needs stronger participation and a clear reduction in selling pressure.
FET is trading near $0.1096, down 10.82% in the latest 24 hour session. The price reached $0.1244 before dropping to $0.1039, reflecting significant volatility across the AI sector. FET remains below all major daily moving averages, with the 7 day average near $0.1252, the 25 day average near $0.1448 and the 99 day average near $0.1754. This bearish alignment shows that the broader trend remains fragile.
FET’s RSI is near 14.18, placing it in deeply oversold territory. The MACD has recently confirmed a death cross, and the SuperTrend remains down. Price is now below the previous 7 day and 30 day range low of $0.1121, which increases the importance of how the market behaves around current levels.
However, there is one notable contrast in FET’s data. Daily capital flow is positive, with net inflow of approximately 6.10 million FET and a net inflow rate of 8.24%. This does not erase the bearish chart structure, but it suggests that demand has appeared during a period of heavy price weakness. FET’s latest volume is close to its 7 day average, which means participation remains active. The market will be watching whether this inflow can translate into stabilization, or whether the broader downtrend continues to outweigh emerging demand.
MMT is trading near $0.2382, down 1.77% over the latest 24 hour session. On the surface, that decline appears modest compared with Aster and FET. But MMT’s broader move tells a more dramatic story. The asset is up 104.99% over 7 days and 63.82% over 30 days, making it the strongest momentum asset in this comparison.
MMT recently reached a 7 day and 30 day high of $0.3177 before pulling back toward $0.2382. The daily RSI is near 72.25, which places the asset in overbought territory despite the recent decline. MACD remains bullish with a golden cross active, and the SuperTrend is still pointing up. Price is above the 7 day, 25 day and 99 day moving averages, although the overall moving average alignment remains mixed because of the speed of the recent advance.
The current pullback comes with volume at only 0.28 times the 7 day average, which may indicate that trading intensity has cooled after the surge. Daily capital flow remains positive, with net inflow of approximately 1.34 million MMT. That supports the bullish momentum narrative, but the combination of strong weekly gains, an elevated RSI and sharp intraday movement means volatility risk remains high. MMT is still more than 150% above its recent range low, so the market will be focused on whether it can consolidate rather than simply extend volatility.
The central market message is clear. Aster and FET are technically oversold and remain under bearish pressure, while MMT is still structurally stronger but managing the aftermath of a powerful rally. Aster needs stronger volume and reduced outflow to build a meaningful base. FET needs to show whether its positive capital flow can overcome its weak trend structure. MMT needs to demonstrate that momentum can transition into orderly consolidation rather than unstable price swings.
The next move will be shaped by real participation, not social media noise. Watch volume, capital flow, moving average recovery and how each asset responds around its recent range boundaries. In a high volatility market, disciplined confirmation is more valuable than emotional reaction.
#Aster #FET #MMT #CryptoMarket #CryptoTrading
$ASTER
$FET
$MMT
5

Xem bản dịch
**🔥 $ASTER – Bearish Breakdown! Another Dump Incoming?**
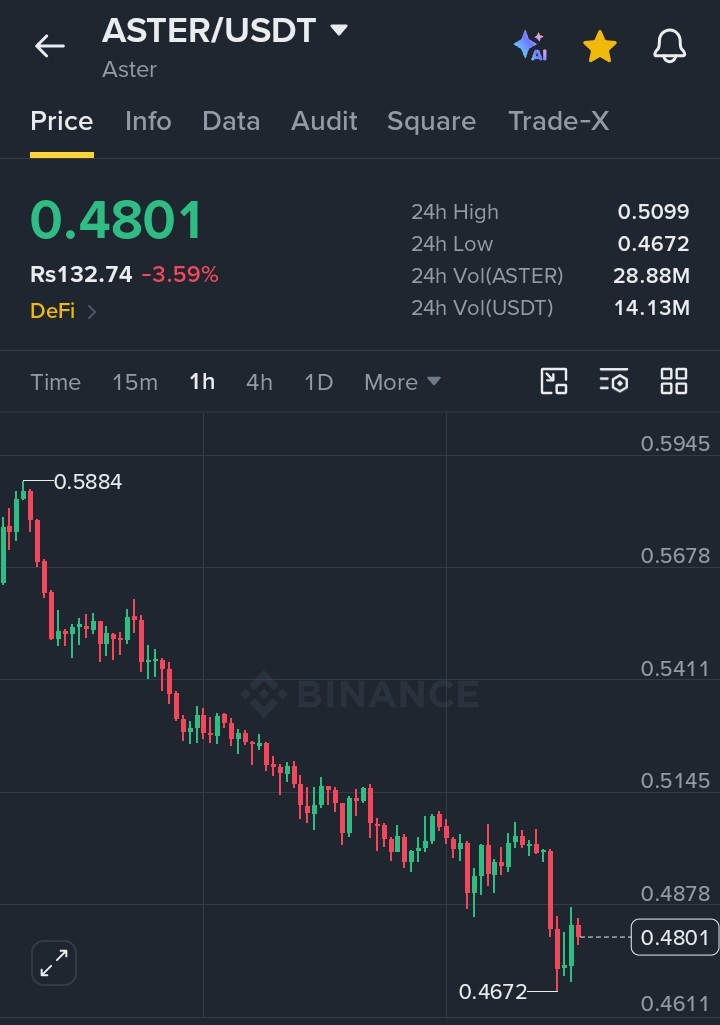
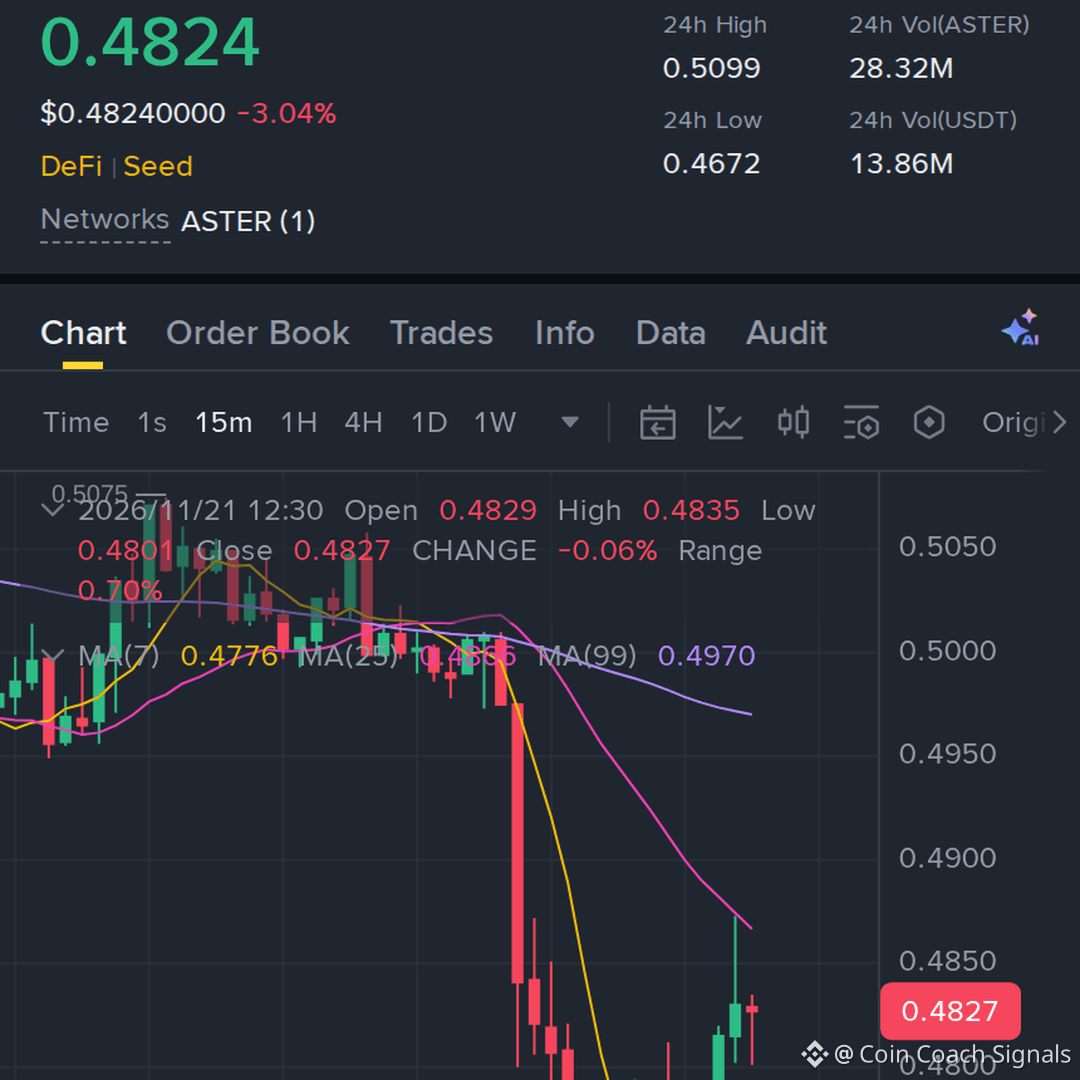
$ASTER /USDT is trading at **$0.4801 (-3.59%)**, showing persistent selling pressure on the 1H timeframe. A clear bearish Break of Structure (BOS), consecutive lower highs, and weak bullish recovery indicate sellers remain in control. With 28.88M ASTER traded in 24 hours, rejection near the resistance zone could trigger another downside move.
**🔴 SHORT TRADE SETUP**
- Entry Zone: $0.4840–$0.4900
- TP1: $0.4750
- TP2: $0.4672
- TP3: $0.4550
- Stop-Loss: $0.5010
**Trading Strategy:** Wait for bearish rejection within the entry zone before executing. A confirmed breakdown below $0.4672 could accelerate selling momentum.
**Don't chase the dump — trade the pullback!**
#ASTER #ShortTrade #BinanceSquare #CryptoTrading
#aster
**🔥 $ASTER – Bearish Breakdown! Another Dump Incoming?**
$ASTER /USDT is trading at **$0.4801 (-3.59%)**, showing persistent selling pressure on the 1H timeframe. A clear bearish Break of Structure (BOS), consecutive lower highs, and weak bullish recovery indicate sellers remain in control. With 28.88M ASTER traded in 24 hours, rejection near the resistance zone could trigger another downside move.
**🔴 SHORT TRADE SETUP**
- Entry Zone: $0.4840–$0.4900
- TP1: $0.4750
- TP2: $0.4672
- TP3: $0.4550
- Stop-Loss: $0.5010
**Trading Strategy:** Wait for bearish rejection within the entry zone before executing. A confirmed breakdown below $0.4672 could accelerate selling momentum.
**Don't chase the dump — trade the pullback!**
#ASTER #ShortTrade #BinanceSquare #CryptoTrading
#aster
$ASTER /USDT is trading at **$0.4801 (-3.59%)**, showing persistent selling pressure on the 1H timeframe. A clear bearish Break of Structure (BOS), consecutive lower highs, and weak bullish recovery indicate sellers remain in control. With 28.88M ASTER traded in 24 hours, rejection near the resistance zone could trigger another downside move.
**🔴 SHORT TRADE SETUP**
- Entry Zone: $0.4840–$0.4900
- TP1: $0.4750
- TP2: $0.4672
- TP3: $0.4550
- Stop-Loss: $0.5010
**Trading Strategy:** Wait for bearish rejection within the entry zone before executing. A confirmed breakdown below $0.4672 could accelerate selling momentum.
**Don't chase the dump — trade the pullback!**
#ASTER #ShortTrade #BinanceSquare #CryptoTrading
#aster

follow for more
Từ Leo Bull Square
3
95



·
--
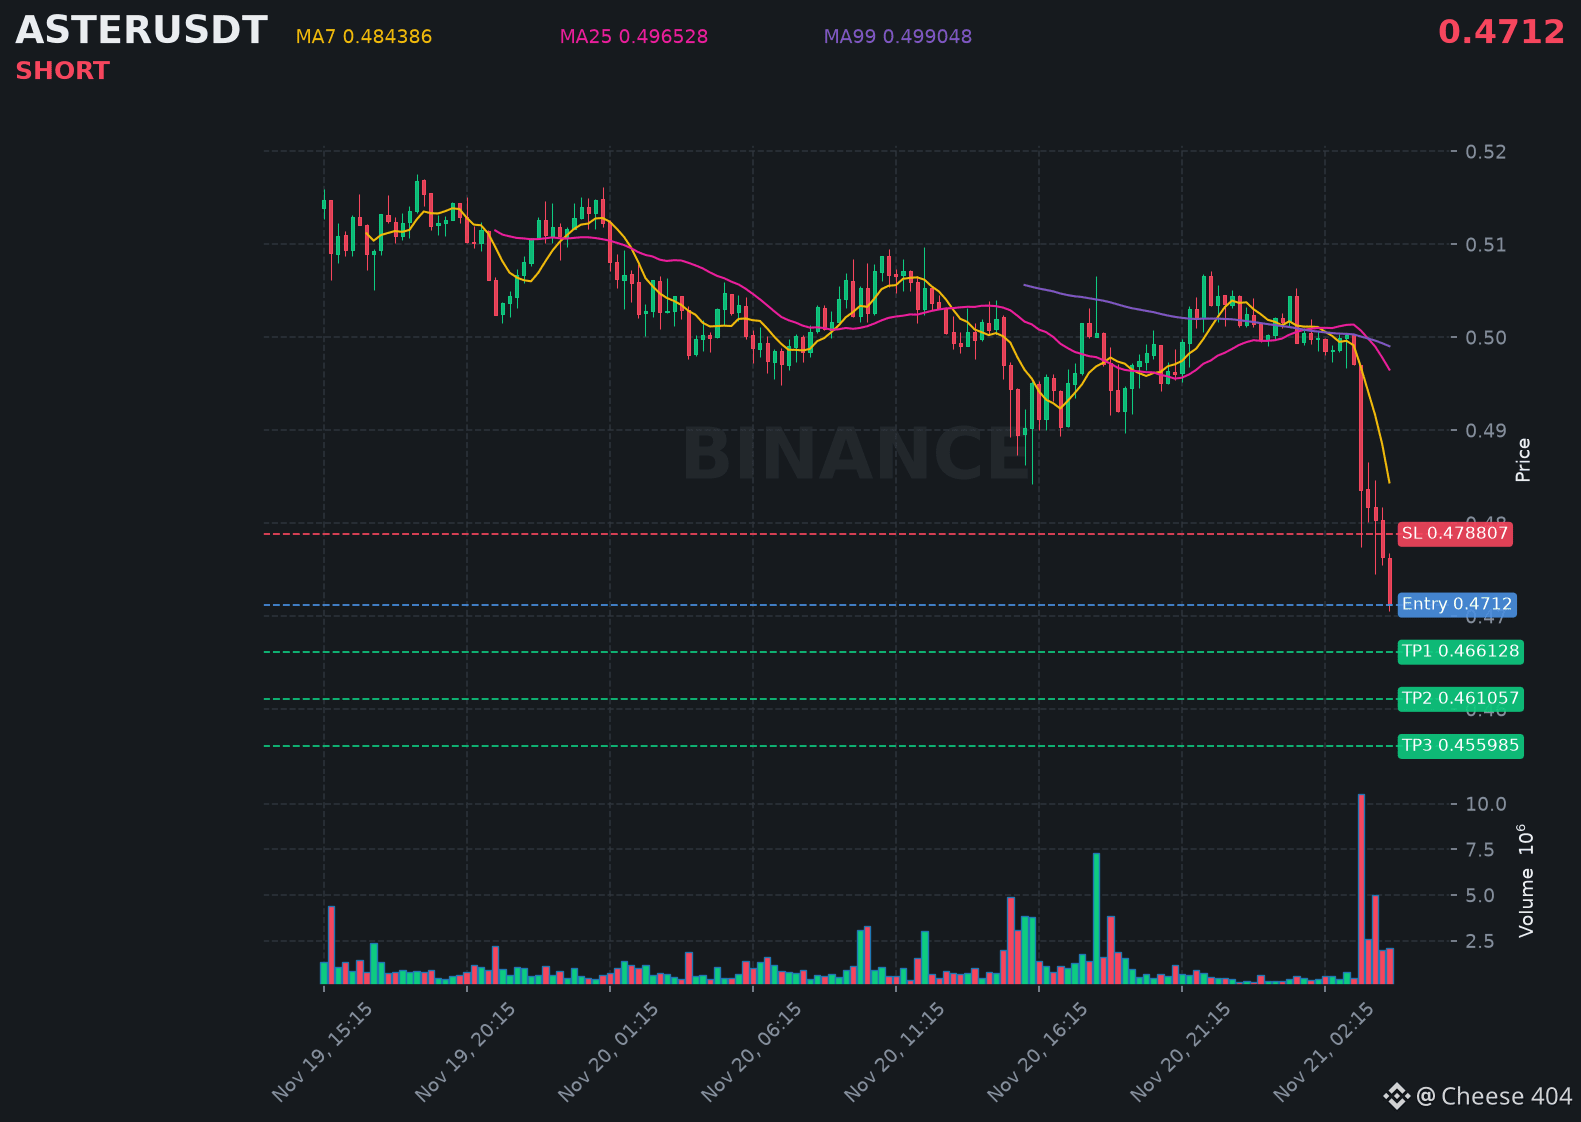
$ASTER đang có xu hướng giảm mạnh, phe bán chặn mọi nhịp hồi trên đường đi.
📍 @ 0.4712 | Khối lượng: 0.99M USD
RSI 18 | EMA20: 0.491382 USD
📈 Kế hoạch giao dịch:
📈 Điểm vào: 0.469679 – 0.472721
🛑 Cắt lỗ: 0.478807
🎯 TP1: 0.466128
🎯 TP2: 0.461057
🎯 TP3: 0.455985
Chờ xác nhận, sau đó theo xu hướng giảm.
👉 $ASTER 👈 Đón bắt nhé
#ASTER
$ASTER đang có xu hướng giảm mạnh, phe bán chặn mọi nhịp hồi trên đường đi.
📍 @ 0.4712 | Khối lượng: 0.99M USD
RSI 18 | EMA20: 0.491382 USD
📈 Kế hoạch giao dịch:
📈 Điểm vào: 0.469679 – 0.472721
🛑 Cắt lỗ: 0.478807
🎯 TP1: 0.466128
🎯 TP2: 0.461057
🎯 TP3: 0.455985
Chờ xác nhận, sau đó theo xu hướng giảm.
👉 $ASTER 👈 Đón bắt nhé
#ASTER
📍 @ 0.4712 | Khối lượng: 0.99M USD
RSI 18 | EMA20: 0.491382 USD
📈 Kế hoạch giao dịch:
📈 Điểm vào: 0.469679 – 0.472721
🛑 Cắt lỗ: 0.478807
🎯 TP1: 0.466128
🎯 TP2: 0.461057
🎯 TP3: 0.455985
Chờ xác nhận, sau đó theo xu hướng giảm.
👉 $ASTER 👈 Đón bắt nhé
#ASTER
69

·
--
Xem bản dịch
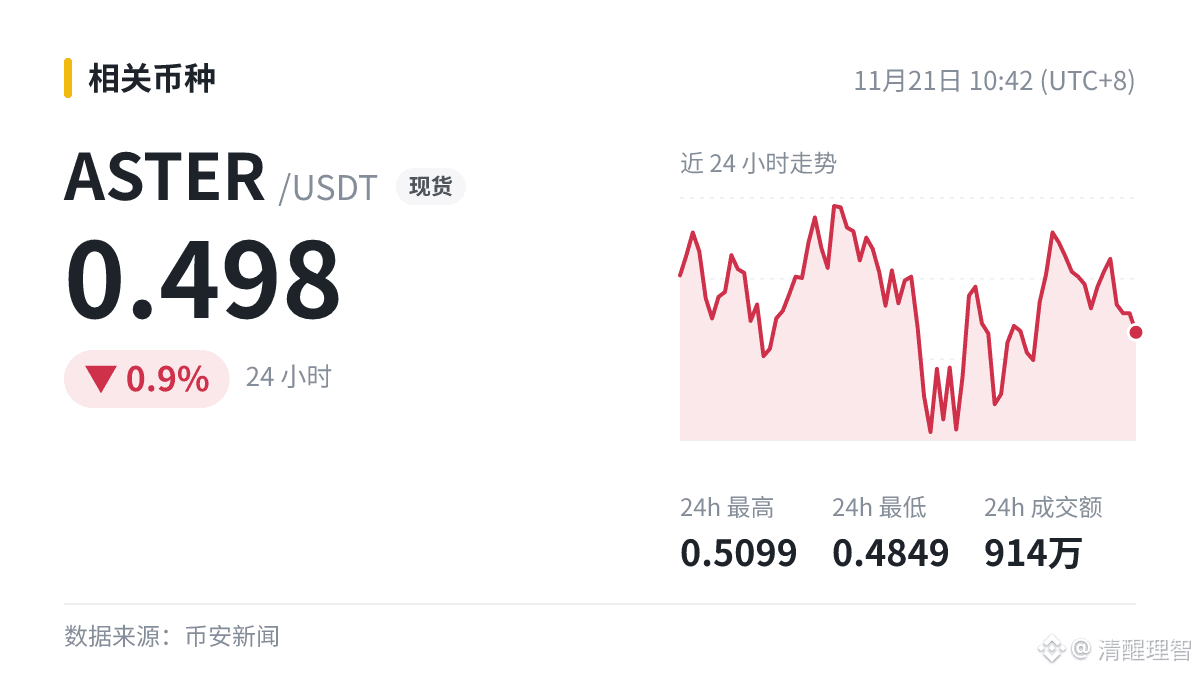
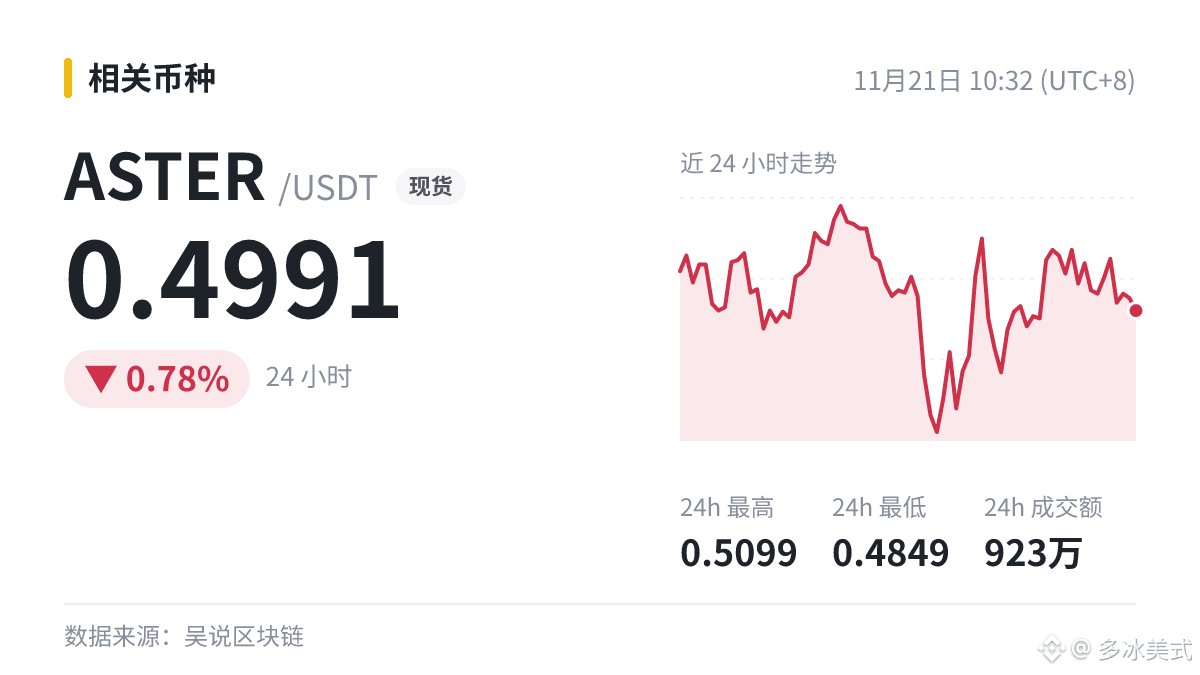
Aster复盘ASTERUSDT异常清算:新账户协同交易致标记价偏离——这类消息之后,我先盯大单,然后看价格。
这条对短线情绪是一种拖累,基本面的影响要等更多细节。消息再热,大单没跟,也只是一阵情绪。
$ASTER 最新 0.498。
#ASTER
Aster复盘ASTERUSDT异常清算:新账户协同交易致标记价偏离——这类消息之后,我先盯大单,然后看价格。
这条对短线情绪是一种拖累,基本面的影响要等更多细节。消息再热,大单没跟,也只是一阵情绪。
$ASTER 最新 0.498。
#ASTER
这条对短线情绪是一种拖累,基本面的影响要等更多细节。消息再热,大单没跟,也只是一阵情绪。
$ASTER 最新 0.498。
#ASTER
31


·
--
Xem bản dịch
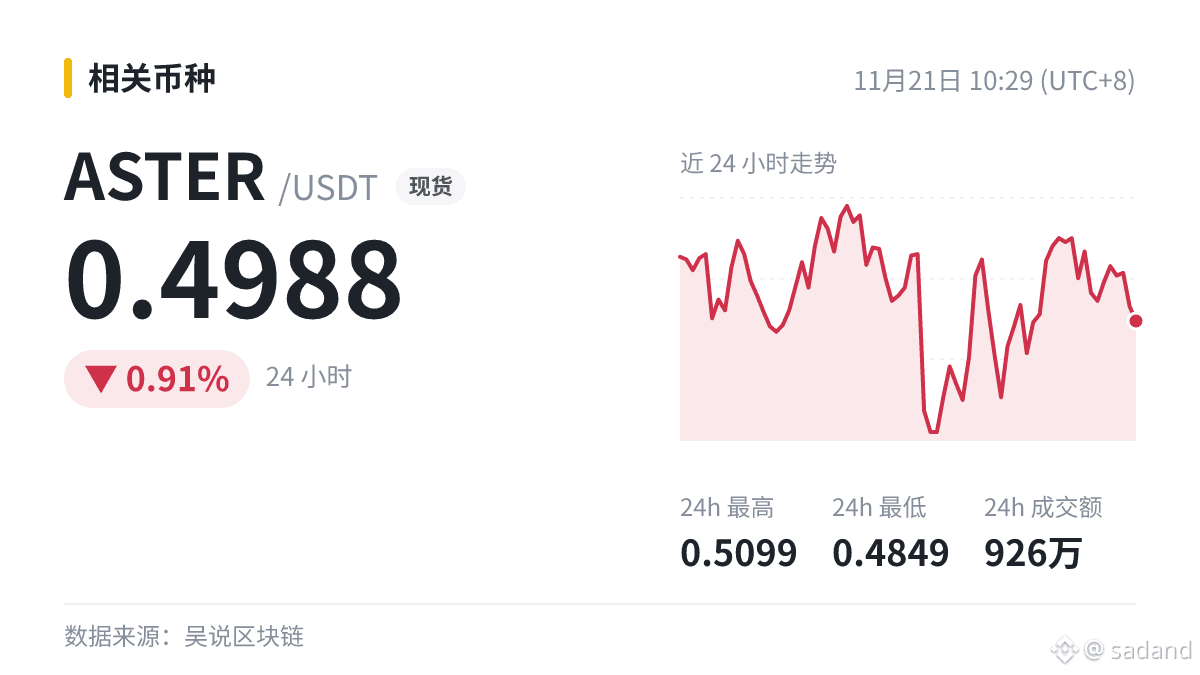
大资金开始布局了?Aster 发布异常事件调查报告,系新账户协同交易致价格偏离
$ASTER 24h 成交额 926万美元,价格 -0.91%。下跌时量放不放大,看出这是恐慌出逃还是正常回调;消息只是导火索,最终起作用的还是钱。
#ASTER
大资金开始布局了?Aster 发布异常事件调查报告,系新账户协同交易致价格偏离
$ASTER 24h 成交额 926万美元,价格 -0.91%。下跌时量放不放大,看出这是恐慌出逃还是正常回调;消息只是导火索,最终起作用的还是钱。
#ASTER
$ASTER 24h 成交额 926万美元,价格 -0.91%。下跌时量放不放大,看出这是恐慌出逃还是正常回调;消息只是导火索,最终起作用的还是钱。
#ASTER
41

·
--
Xem bản dịch
【消息面】Aster复盘ASTERUSDT异常清算:新账户协同交易致标记价偏离
· 信心被打击不代表趋势走坏,关键位能不能守住才是关键。
· 后面我会比一比成交额和平时,看有没有明显变化。
· $ASTER
#ASTER
波动很大,仓位量力而行。
【消息面】Aster复盘ASTERUSDT异常清算:新账户协同交易致标记价偏离
· 信心被打击不代表趋势走坏,关键位能不能守住才是关键。
· 后面我会比一比成交额和平时,看有没有明显变化。
· $ASTER
#ASTER
波动很大,仓位量力而行。
· 信心被打击不代表趋势走坏,关键位能不能守住才是关键。
· 后面我会比一比成交额和平时,看有没有明显变化。
· $ASTER
#ASTER
波动很大,仓位量力而行。
39

·
--
Xem bản dịch
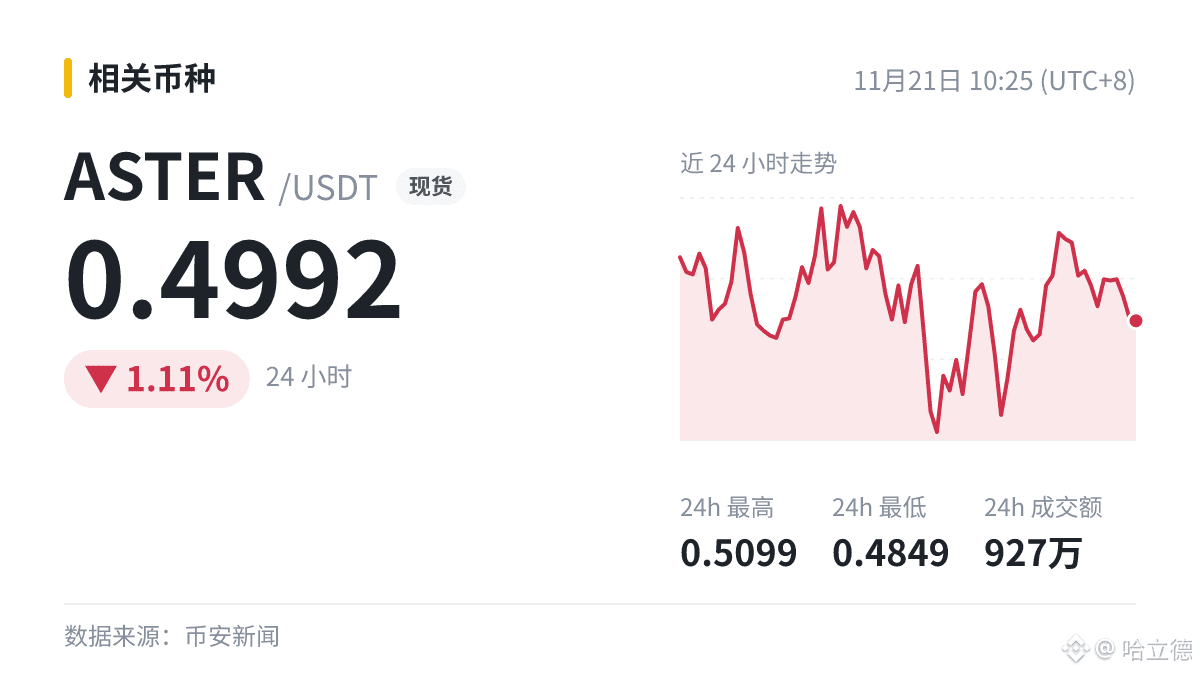
Aster复盘ASTERUSDT异常清算:新账户协同交易致标记价偏离。
我会拿消息发布前的高点当参考线:守住偏强,失守偏弱。
坏消息出来时,最忌讳的是一边恐慌一边加仓,仓位要先理清。
$ASTER 现报 0.4992。
#ASTER
风险自己担,我就是聊聊。
Aster复盘ASTERUSDT异常清算:新账户协同交易致标记价偏离。
我会拿消息发布前的高点当参考线:守住偏强,失守偏弱。
坏消息出来时,最忌讳的是一边恐慌一边加仓,仓位要先理清。
$ASTER 现报 0.4992。
#ASTER
风险自己担,我就是聊聊。
我会拿消息发布前的高点当参考线:守住偏强,失守偏弱。
坏消息出来时,最忌讳的是一边恐慌一边加仓,仓位要先理清。
$ASTER 现报 0.4992。
#ASTER
风险自己担,我就是聊聊。
49

·
--
Xem bản dịch
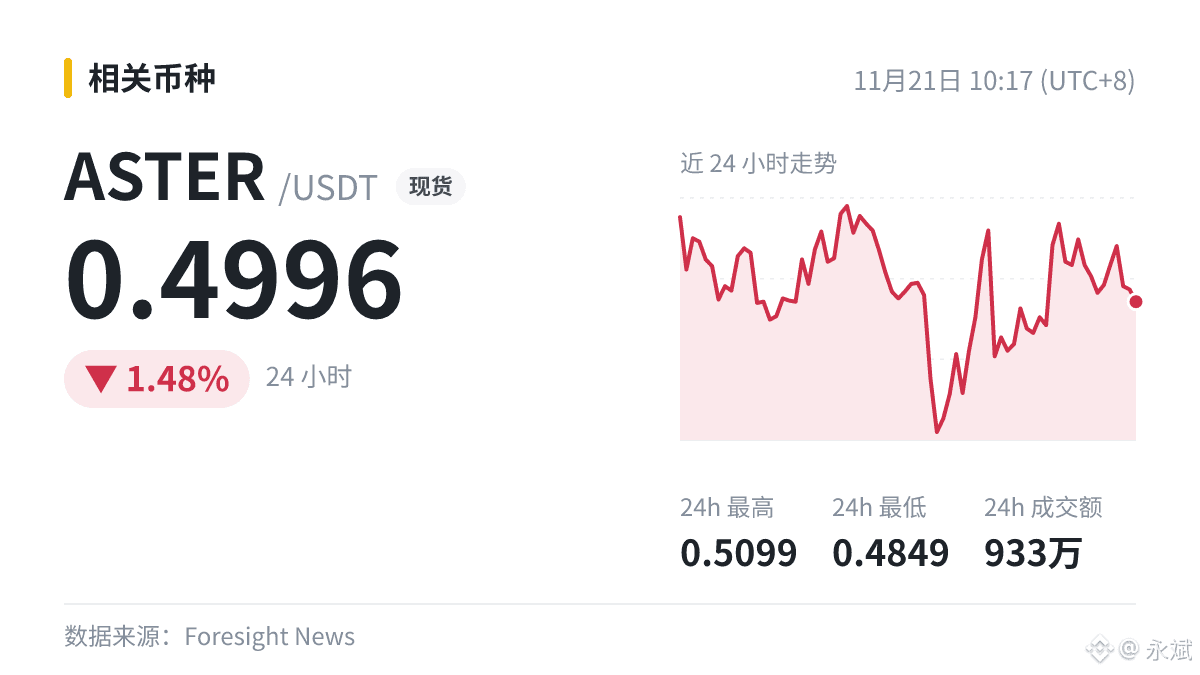
🔔 据Foresight News:Aster 发布 11 月 15 日 ASTERUSDT 标记价格异常事件复盘报告。
$ASTER 先加入观察。单条消息很难改变趋势,不过可能放大波动。你们仓位里有相关的吗?
#ASTER
🔔 据Foresight News:Aster 发布 11 月 15 日 ASTERUSDT 标记价格异常事件复盘报告。
$ASTER 先加入观察。单条消息很难改变趋势,不过可能放大波动。你们仓位里有相关的吗?
#ASTER
$ASTER 先加入观察。单条消息很难改变趋势,不过可能放大波动。你们仓位里有相关的吗?
#ASTER
46

·
--
Xem bản dịch
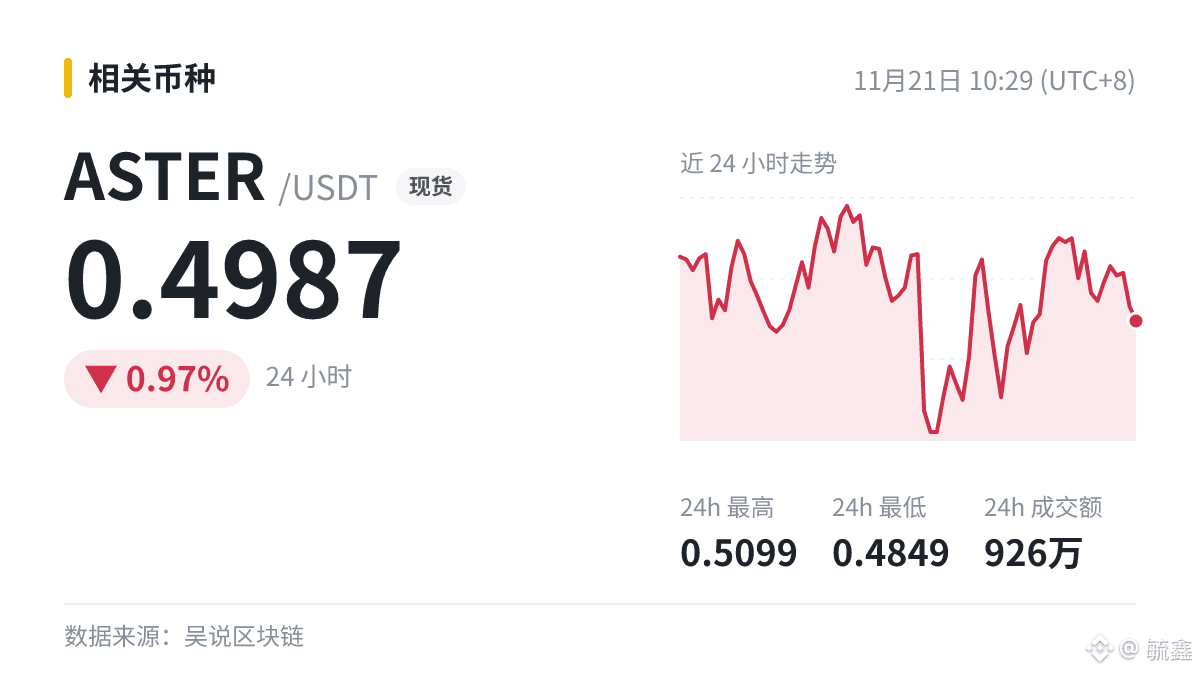
📋 消息+盘面对照
· 事件:Aster 发布异常事件调查报告,系新账户协同交易致价格偏离
· 来源:吴说区块链
· $ASTER 现价:0.4987
· 24h 区间:0.4849 ~ 0.5099
· 24h 涨跌:-0.97%
· 24h 成交额:926万美元
利空会不会把盘面带崩,后面这几天见分晓。
#ASTER
📋 消息+盘面对照
· 事件:Aster 发布异常事件调查报告,系新账户协同交易致价格偏离
· 来源:吴说区块链
· $ASTER 现价:0.4987
· 24h 区间:0.4849 ~ 0.5099
· 24h 涨跌:-0.97%
· 24h 成交额:926万美元
利空会不会把盘面带崩,后面这几天见分晓。
#ASTER
· 事件:Aster 发布异常事件调查报告,系新账户协同交易致价格偏离
· 来源:吴说区块链
· $ASTER 现价:0.4987
· 24h 区间:0.4849 ~ 0.5099
· 24h 涨跌:-0.97%
· 24h 成交额:926万美元
利空会不会把盘面带崩,后面这几天见分晓。
#ASTER
60

·
--
Aster $ASTER hiện đang giao dịch quanh mức 0,50–0,51 USD, chịu áp lực giảm giá trong ngắn hạn và triển vọng thị trường trung lập đến thận trọng.
Các mức quan trọng cần theo dõi. Kháng cự gần nhất nằm ở mức 0,573–0,599, trong khi vùng hỗ trợ cấu trúc chính trong nhiều tháng nằm thấp hơn, quanh mức 0,40.
#ASTER #asteriscoming #ASTERAnalysis
{spot}(ASTERUSDT)
Aster $ASTER hiện đang giao dịch quanh mức 0,50–0,51 USD, chịu áp lực giảm giá trong ngắn hạn và triển vọng thị trường trung lập đến thận trọng.
Các mức quan trọng cần theo dõi. Kháng cự gần nhất nằm ở mức 0,573–0,599, trong khi vùng hỗ trợ cấu trúc chính trong nhiều tháng nằm thấp hơn, quanh mức 0,40.
#ASTER #asteriscoming #ASTERAnalysis
Các mức quan trọng cần theo dõi. Kháng cự gần nhất nằm ở mức 0,573–0,599, trong khi vùng hỗ trợ cấu trúc chính trong nhiều tháng nằm thấp hơn, quanh mức 0,40.
#ASTER #asteriscoming #ASTERAnalysis

1
1
1.2k
Đăng nhập để khám phá thêm nội dung
Tham gia cùng người dùng tiền mã hóa toàn cầu trên Binance Square
⚡️ Nhận thông tin mới nhất và hữu ích về tiền mã hóa.
💬 Được tin cậy bởi sàn giao dịch tiền mã hóa lớn nhất thế giới.
👍 Khám phá những thông tin chuyên sâu thực tế từ những nhà sáng tạo đã xác minh.
Email / Số điện thoại
Chủ đề thịnh hành
1
#TinFed
432,981 lượt xem
1,362 đang thảo luận
2
#TheoDõiFOMC
365,857 lượt xem
1,583 đang thảo luận
3
#CanBTCReboundAfterFallingBelow60K?
365,279 lượt xem
1,521 đang thảo luận
4
#GlobalStocksFaceLongestLosingStreakSince2023
119,016 lượt xem
1,079 đang thảo luận
5
#BlackRockIBITPostsRecord$541MSingleDayOutflow
613 lượt xem
16 đang thảo luận
6
#AnthropicPlungesTowardIPOPriceonDay2
57,449 lượt xem
581 đang thảo luận
7
#TwentyOneCapitalAdds172.25BTC
10,155 lượt xem
157 đang thảo luận
8
#HKBillWouldExcludeTokenizedDepositsFromVirtualAssets
861 lượt xem
14 đang thảo luận
9
#BNBDropsBelow540USDTWith8.46%DailyDecline
30,925 lượt xem
263 đang thảo luận
10
#HKBillProposesHK$100KFineForUnauthorizedCryptoTitles
1,009 lượt xem
14 đang thảo luận