
ZeroBlock
4.9k Postlar

ZeroBlock
Shikoyat qilish
Foydalanuvchini bloklash
BTC LOVER GOLD TRADER , SQUARE CRATOR
Ochiq savdo
Tez-tez savdo qiluvchi
1.2 yil
238 Kuzatilmoqda
25.2K+ Kuzatuvchilar
13.1K Yoqdi
Postlar
Portfel
Barchasi
Videolar
Jonli
·
--
Maqola
XMR Rally Has A Leverage ProblemWhat caught my attention with XMR is not just the 13% move.It isXMR rallyda leverage muammosi bor
XMR bilan bog‘liq menga e’tiborimni tortgan narsa faqat 13% ga ko‘tarilgani emas.
Bu yangi kapital qayerdan kirayotgani.
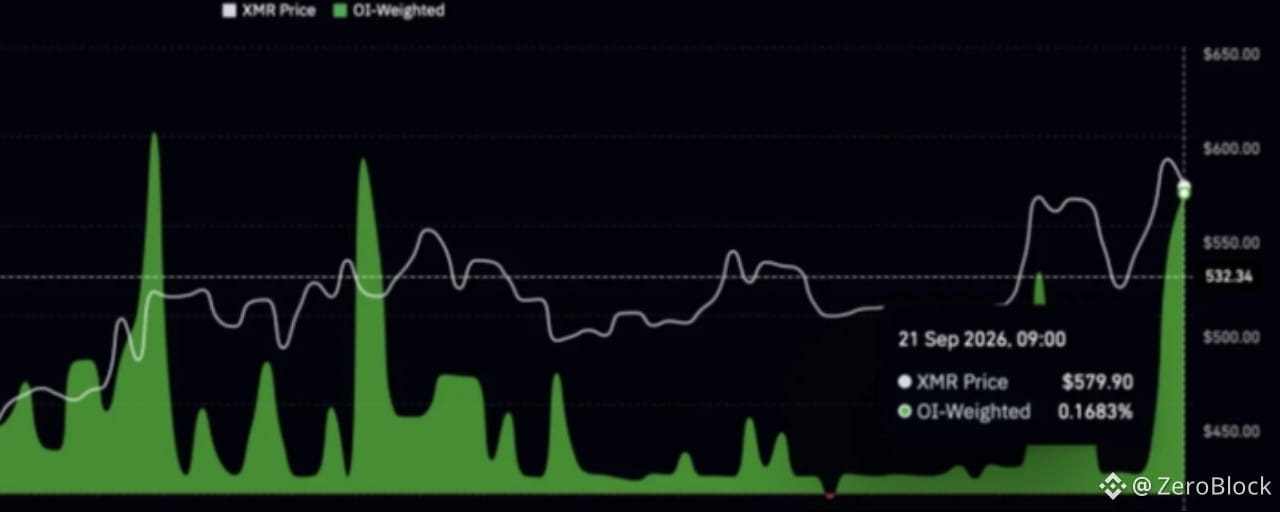
XMR keskin ko‘tarildi, doimiy Open Interest esa qariyb 18% ga sakrab, taxminan $305 mln ga yetdi.
Demak, 24 soat ichida perpetual bozorga taxminan $54,9 mln yangi kapital kirgan.
Funding ham qariyb 0.1683% gacha ko‘tarildi.
Bu longlar tobora ko‘proq agressiv bo‘layotganiga kuchli ishoradir.
Lekin men aynan shu yerda yanada ehtiyot bo‘laman.
Ko‘tarilayotgan Funding Rate kuchli momentum bo‘lsa, rallyni qo‘llab-quvvatlashi mumkin. Shu bilan birga, narx gavjum longlar tomoni uchun kutilmaganda keskin harakat qilsa, bozorni yanada zaifroq qilib qo‘yishi mumkin.
XMR Rally Has A Leverage ProblemWhat caught my attention with XMR is not just the 13% move.It is
XMR rallyda leverage muammosi bor
XMR bilan bog‘liq menga e’tiborimni tortgan narsa faqat 13% ga ko‘tarilgani emas.
Bu yangi kapital qayerdan kirayotgani.
XMR keskin ko‘tarildi, doimiy Open Interest esa qariyb 18% ga sakrab, taxminan $305 mln ga yetdi.
Demak, 24 soat ichida perpetual bozorga taxminan $54,9 mln yangi kapital kirgan.
Funding ham qariyb 0.1683% gacha ko‘tarildi.
Bu longlar tobora ko‘proq agressiv bo‘layotganiga kuchli ishoradir.
Lekin men aynan shu yerda yanada ehtiyot bo‘laman.
Ko‘tarilayotgan Funding Rate kuchli momentum bo‘lsa, rallyni qo‘llab-quvvatlashi mumkin. Shu bilan birga, narx gavjum longlar tomoni uchun kutilmaganda keskin harakat qilsa, bozorni yanada zaifroq qilib qo‘yishi mumkin.
XMR bilan bog‘liq menga e’tiborimni tortgan narsa faqat 13% ga ko‘tarilgani emas.
Bu yangi kapital qayerdan kirayotgani.
XMR keskin ko‘tarildi, doimiy Open Interest esa qariyb 18% ga sakrab, taxminan $305 mln ga yetdi.
Demak, 24 soat ichida perpetual bozorga taxminan $54,9 mln yangi kapital kirgan.
Funding ham qariyb 0.1683% gacha ko‘tarildi.
Bu longlar tobora ko‘proq agressiv bo‘layotganiga kuchli ishoradir.
Lekin men aynan shu yerda yanada ehtiyot bo‘laman.
Ko‘tarilayotgan Funding Rate kuchli momentum bo‘lsa, rallyni qo‘llab-quvvatlashi mumkin. Shu bilan birga, narx gavjum longlar tomoni uchun kutilmaganda keskin harakat qilsa, bozorni yanada zaifroq qilib qo‘yishi mumkin.
1
175
·
--
Maqola
PancakeSwap 10 oylik eng yuqori ko‘rsatkichga chiqdi — Nega $2.80 CAKE’ning keyingi nishoni?CAKE Jiddiy Sinovdan O‘tmoqda
CAKE bilan meni jalb qilgan narsa shunchaki kuniga 9% lik o‘sish emas.
Bu narx harakati va uning tagida sodir bo‘layotgan faollikning uyg‘unligi.
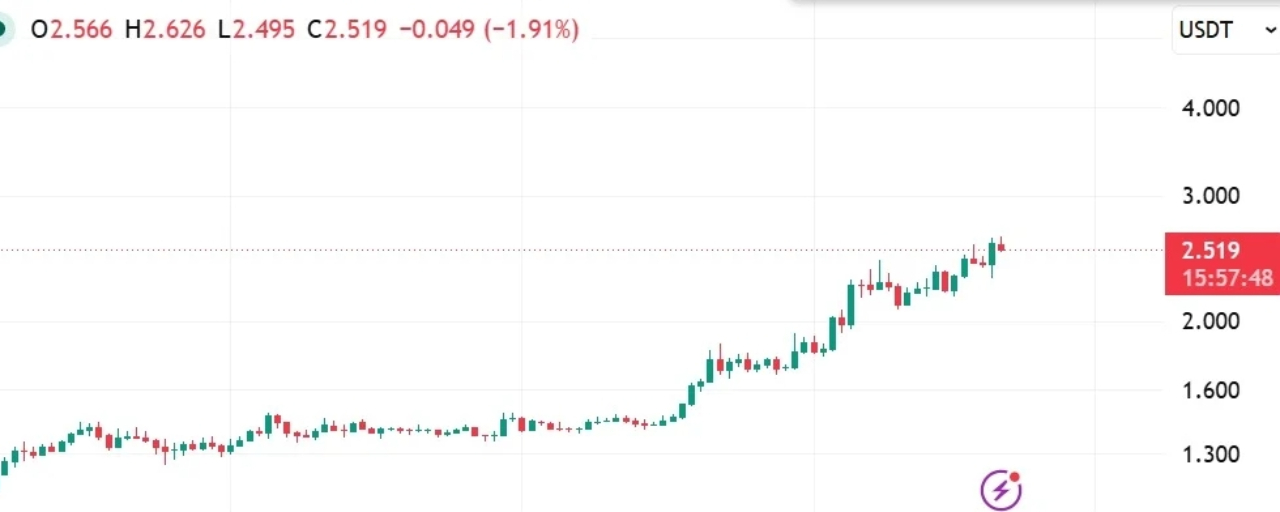
CAKE $2.60 atrofida ko‘tarilib, keyin $2.50 tomon orqaga qaytdi. Bu esa 2025-yil noyabrdan beri ko‘rilgan eng yuqori daraja edi.
Harakat PancakeSwap o‘zining Pre Access Portalini taqdim etganidan keyin boshlandi. U foydalanuvchilarga ommaviy startdan oldin xususiy subyektlarga ta’sir qilish imkonini beradi.
Lekin faqat e’lonning o‘zi mitingni (ko‘tarilishni) ushlab tura oladi, deb o‘ylamayman.
Mening uchun kuchliroq signal — spot (joyida) faollik.
PancakeSwap 10 oylik eng yuqori ko‘rsatkichga chiqdi — Nega $2.80 CAKE’ning keyingi nishoni?
CAKE Jiddiy Sinovdan O‘tmoqda
CAKE bilan meni jalb qilgan narsa shunchaki kuniga 9% lik o‘sish emas.
Bu narx harakati va uning tagida sodir bo‘layotgan faollikning uyg‘unligi.
CAKE $2.60 atrofida ko‘tarilib, keyin $2.50 tomon orqaga qaytdi. Bu esa 2025-yil noyabrdan beri ko‘rilgan eng yuqori daraja edi.
Harakat PancakeSwap o‘zining Pre Access Portalini taqdim etganidan keyin boshlandi. U foydalanuvchilarga ommaviy startdan oldin xususiy subyektlarga ta’sir qilish imkonini beradi.
Lekin faqat e’lonning o‘zi mitingni (ko‘tarilishni) ushlab tura oladi, deb o‘ylamayman.
Mening uchun kuchliroq signal — spot (joyida) faollik.
CAKE bilan meni jalb qilgan narsa shunchaki kuniga 9% lik o‘sish emas.
Bu narx harakati va uning tagida sodir bo‘layotgan faollikning uyg‘unligi.
CAKE $2.60 atrofida ko‘tarilib, keyin $2.50 tomon orqaga qaytdi. Bu esa 2025-yil noyabrdan beri ko‘rilgan eng yuqori daraja edi.
Harakat PancakeSwap o‘zining Pre Access Portalini taqdim etganidan keyin boshlandi. U foydalanuvchilarga ommaviy startdan oldin xususiy subyektlarga ta’sir qilish imkonini beradi.
Lekin faqat e’lonning o‘zi mitingni (ko‘tarilishni) ushlab tura oladi, deb o‘ylamayman.
Mening uchun kuchliroq signal — spot (joyida) faollik.
311
·
--
Maqola
Pump.fun effekti? Platforma faolligi PUMP’ning 10% ga sakrashiga qanday yo‘l ochdiPUMP platforma bo‘yicha faollik testi
PUMP bilan men e’tiborimni tortgan narsa shuki, bu 10% lik harakat real faollikning oshishi bilan birga bo‘layapti.
Pump.fun’dagi faollik kuchaygani sababli PUMP yuqoriga intildi va kapital yana memecoin’lar tomon qayta aylana boshladi.
Savdo hajmi ham qariyb 8,9% ga oshib, taxminan $179M ga yetdi.
Lekin men uchun qiziq narsa faqat hajm emas.
Platforma metrikalari.
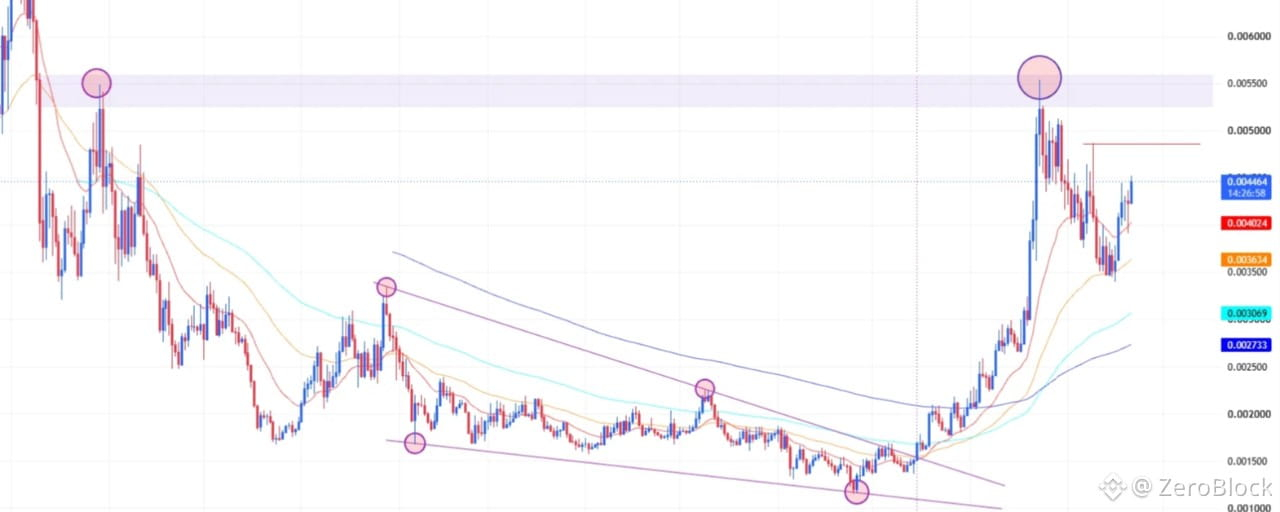
Tarmoq daromadi so‘nggi 24 soat ichida qariyb $761K ga yetdi, faol manzillar esa taxminan 86K ga ko‘tarildi.
Bu menga narx grafigi ostida faqat spekulyativ savdodan ko‘ra ko‘proq narsa sodir bo‘layotganini ko‘rsatadi.
Pump.fun effekti? Platforma faolligi PUMP’ning 10% ga sakrashiga qanday yo‘l ochdi
PUMP platforma bo‘yicha faollik testi
PUMP bilan men e’tiborimni tortgan narsa shuki, bu 10% lik harakat real faollikning oshishi bilan birga bo‘layapti.
Pump.fun’dagi faollik kuchaygani sababli PUMP yuqoriga intildi va kapital yana memecoin’lar tomon qayta aylana boshladi.
Savdo hajmi ham qariyb 8,9% ga oshib, taxminan $179M ga yetdi.
Lekin men uchun qiziq narsa faqat hajm emas.
Platforma metrikalari.
Tarmoq daromadi so‘nggi 24 soat ichida qariyb $761K ga yetdi, faol manzillar esa taxminan 86K ga ko‘tarildi.
Bu menga narx grafigi ostida faqat spekulyativ savdodan ko‘ra ko‘proq narsa sodir bo‘layotganini ko‘rsatadi.
PUMP bilan men e’tiborimni tortgan narsa shuki, bu 10% lik harakat real faollikning oshishi bilan birga bo‘layapti.
Pump.fun’dagi faollik kuchaygani sababli PUMP yuqoriga intildi va kapital yana memecoin’lar tomon qayta aylana boshladi.
Savdo hajmi ham qariyb 8,9% ga oshib, taxminan $179M ga yetdi.
Lekin men uchun qiziq narsa faqat hajm emas.
Platforma metrikalari.
Tarmoq daromadi so‘nggi 24 soat ichida qariyb $761K ga yetdi, faol manzillar esa taxminan 86K ga ko‘tarildi.
Bu menga narx grafigi ostida faqat spekulyativ savdodan ko‘ra ko‘proq narsa sodir bo‘layotganini ko‘rsatadi.
239
·
--
Maqola
Cardano narx $0.24 ni qaytarib oldi: ADA ga xarid bosimi qaytdiADA nihoyat $0.24 miqdorini qaytarib oldi
ADA bilan diqqatimni tortgan narsa 7% lik kunlik o‘sish emas.
Uning ortidagi daraja.
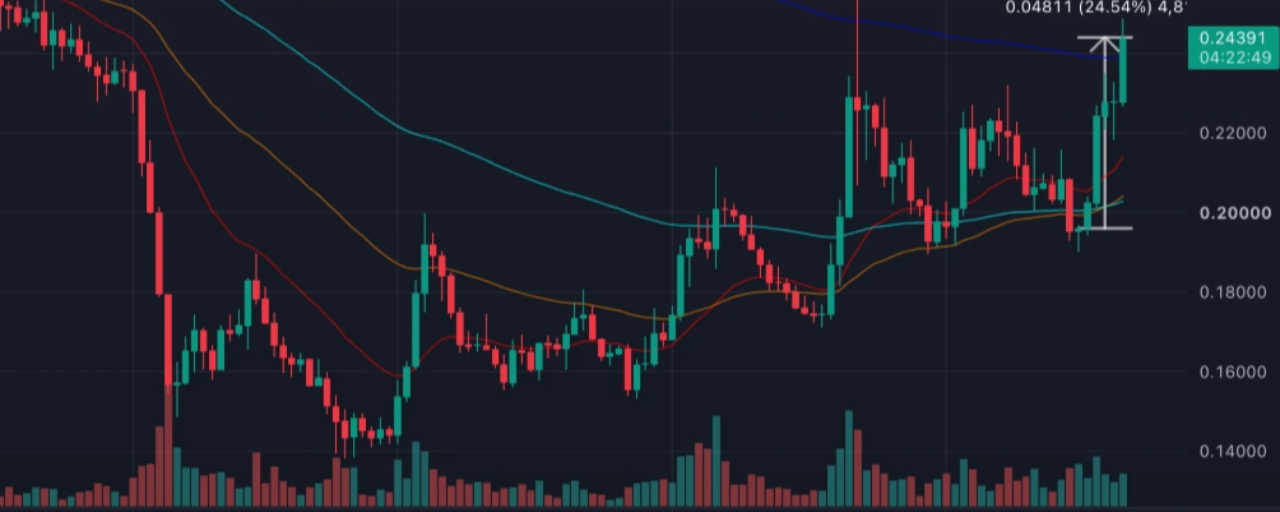
ADA bu oy boshida taxminan $0.196 atrofidan $0.244 gacha ko‘tarildi. Bu taxminan 24% tiklanish va harakat endi narxni $0.239 atrofidagi 200 kunlik o‘rtachadan yuqoriga olib chiqdi.
Lekin buni hali tasdiqlangan trend o‘zgarishi deb atamagan bo‘lardim.
Muhim qismi esa breakautdan keyin nima bo‘lishidir.
$0.239 dan $0.24 gacha bo‘lgan zona oldingi tiklanish urinishlarida shift (yuqori chegara) bo‘lib kelgan. Endi ADA undan yuqoriga chiqqan, shuning uchun bozor eski qarshilik yangi tayanch (support) bo‘la olishini isbotlashi kerak.
Cardano narx $0.24 ni qaytarib oldi: ADA ga xarid bosimi qaytdi
ADA nihoyat $0.24 miqdorini qaytarib oldi
ADA bilan diqqatimni tortgan narsa 7% lik kunlik o‘sish emas.
Uning ortidagi daraja.
ADA bu oy boshida taxminan $0.196 atrofidan $0.244 gacha ko‘tarildi. Bu taxminan 24% tiklanish va harakat endi narxni $0.239 atrofidagi 200 kunlik o‘rtachadan yuqoriga olib chiqdi.
Lekin buni hali tasdiqlangan trend o‘zgarishi deb atamagan bo‘lardim.
Muhim qismi esa breakautdan keyin nima bo‘lishidir.
$0.239 dan $0.24 gacha bo‘lgan zona oldingi tiklanish urinishlarida shift (yuqori chegara) bo‘lib kelgan. Endi ADA undan yuqoriga chiqqan, shuning uchun bozor eski qarshilik yangi tayanch (support) bo‘la olishini isbotlashi kerak.
ADA bilan diqqatimni tortgan narsa 7% lik kunlik o‘sish emas.
Uning ortidagi daraja.
ADA bu oy boshida taxminan $0.196 atrofidan $0.244 gacha ko‘tarildi. Bu taxminan 24% tiklanish va harakat endi narxni $0.239 atrofidagi 200 kunlik o‘rtachadan yuqoriga olib chiqdi.
Lekin buni hali tasdiqlangan trend o‘zgarishi deb atamagan bo‘lardim.
Muhim qismi esa breakautdan keyin nima bo‘lishidir.
$0.239 dan $0.24 gacha bo‘lgan zona oldingi tiklanish urinishlarida shift (yuqori chegara) bo‘lib kelgan. Endi ADA undan yuqoriga chiqqan, shuning uchun bozor eski qarshilik yangi tayanch (support) bo‘la olishini isbotlashi kerak.
1
370
·
--
Maqola
Tarjimani ko‘rish
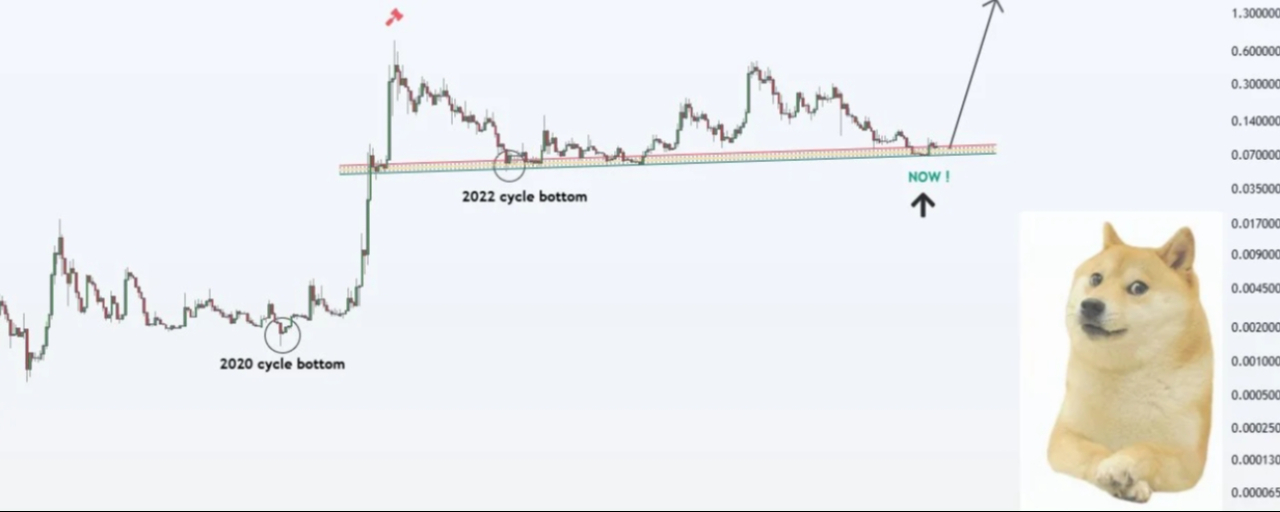
Is Dogecoin’s bottom here? Why DOGE could break above $0.10DOGE Has A Bottoming Test
What caught my attention with DOGE is how much the market has already washed out.
DOGE reached around $0.156 in January and later dropped to roughly $0.067. That is a serious reset from the 2026 high.
Now price has recovered toward $0.092.
The interesting part is that the recovery is happening around several long term signals.
The 10 day RSI reached extremely depressed levels before starting to recover. A crypto researcher also pointed to a CVDD signal after DOGE traded below $0.08.
CVDD is useful because it looks at the movement of older coins and the value destroyed through those transfers. It has historically been used to identify areas where long term holders are transferring coins at stressed valuations.
But I would not treat one indicator as proof that the bottom is confirmed.
The chart still needs to prove it.
DOGE has respected a rising channel that has acted as a major support area since 2021. The recent low near $0.067 also held above that broader structure.
Now price is sitting around the $0.092 area.
That level matters because the short liquidation cluster around it has already been taken out.
The next real test is $0.10.
This is not just a round number. It has also acted as a supply zone where sellers can become active again.
For me the important signal would be volume expanding while DOGE pushes through $0.10.
Without that confirmation a move above the level could simply become another rejection.
On the downside I would keep $0.08 in focus.
A deeper move below $0.08 would weaken the current bottoming argument and bring the previous low back into attention.
So yes the structure is improving.
But there is a difference between a market that looks oversold and a market that has actually confirmed a new trend.
DOGE has recovered from the lows.
Now it needs to prove that buyers can turn $0.10 from resistance into support.
Is Dogecoin’s bottom here? Why DOGE could break above $0.10
DOGE Has A Bottoming Test
What caught my attention with DOGE is how much the market has already washed out.
DOGE reached around $0.156 in January and later dropped to roughly $0.067. That is a serious reset from the 2026 high.
Now price has recovered toward $0.092.
The interesting part is that the recovery is happening around several long term signals.
The 10 day RSI reached extremely depressed levels before starting to recover. A crypto researcher also pointed to a CVDD signal after DOGE traded below $0.08.
CVDD is useful because it looks at the movement of older coins and the value destroyed through those transfers. It has historically been used to identify areas where long term holders are transferring coins at stressed valuations.
But I would not treat one indicator as proof that the bottom is confirmed.
The chart still needs to prove it.
DOGE has respected a rising channel that has acted as a major support area since 2021. The recent low near $0.067 also held above that broader structure.
Now price is sitting around the $0.092 area.
That level matters because the short liquidation cluster around it has already been taken out.
The next real test is $0.10.
This is not just a round number. It has also acted as a supply zone where sellers can become active again.
For me the important signal would be volume expanding while DOGE pushes through $0.10.
Without that confirmation a move above the level could simply become another rejection.
On the downside I would keep $0.08 in focus.
A deeper move below $0.08 would weaken the current bottoming argument and bring the previous low back into attention.
So yes the structure is improving.
But there is a difference between a market that looks oversold and a market that has actually confirmed a new trend.
DOGE has recovered from the lows.
Now it needs to prove that buyers can turn $0.10 from resistance into support.
What caught my attention with DOGE is how much the market has already washed out.
DOGE reached around $0.156 in January and later dropped to roughly $0.067. That is a serious reset from the 2026 high.
Now price has recovered toward $0.092.
The interesting part is that the recovery is happening around several long term signals.
The 10 day RSI reached extremely depressed levels before starting to recover. A crypto researcher also pointed to a CVDD signal after DOGE traded below $0.08.
CVDD is useful because it looks at the movement of older coins and the value destroyed through those transfers. It has historically been used to identify areas where long term holders are transferring coins at stressed valuations.
But I would not treat one indicator as proof that the bottom is confirmed.
The chart still needs to prove it.
DOGE has respected a rising channel that has acted as a major support area since 2021. The recent low near $0.067 also held above that broader structure.
Now price is sitting around the $0.092 area.
That level matters because the short liquidation cluster around it has already been taken out.
The next real test is $0.10.
This is not just a round number. It has also acted as a supply zone where sellers can become active again.
For me the important signal would be volume expanding while DOGE pushes through $0.10.
Without that confirmation a move above the level could simply become another rejection.
On the downside I would keep $0.08 in focus.
A deeper move below $0.08 would weaken the current bottoming argument and bring the previous low back into attention.
So yes the structure is improving.
But there is a difference between a market that looks oversold and a market that has actually confirmed a new trend.
DOGE has recovered from the lows.
Now it needs to prove that buyers can turn $0.10 from resistance into support.
253
·
--
Maqola
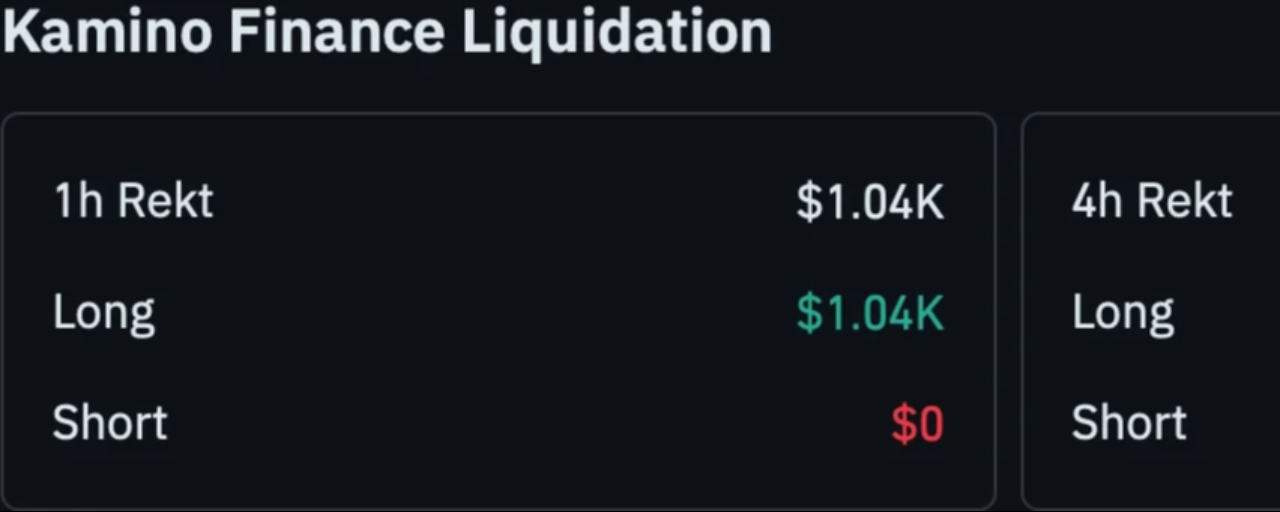
KMNO 24% ga ko‘tarilayotganda Kamino buqalari faol bo‘lib qolmoqda, lekin THESE signallarga e’tibor beringKMNO Rally’da ishtirokni tekshirish
KMNO bilan bog‘liq men e’tiborimni tortgan narsa faqat 24% ga ko‘tarilgani emas.
Harakatni aslida kim boshqarayotgani o‘sha.
KMNO bozor kapitali 189 mln dollarga yaqinlashgani sari keskin ko‘tarildi. Chakana ishtirok kuchli bo‘ldi, shu bilan birga kitlar ham hali ham ishtirok etmoqda.
Whale Retail Delta qiziqarli manzarani ko‘rsatadi.
0.66 dan 0.17 gacha tushdi, lekin baribir ijobiy bo‘lib qoldi. Bu menga shuni ko‘rsatadiki, chakana savdo harakati yanada katta ulushga ega bo‘lgan, lekin kitlar (whale) ishtirokini butunlay yo‘q qilib yubormagan.
Hozircha bu muammo bo‘lishi shart emas.
KMNO 24% ga ko‘tarilayotganda Kamino buqalari faol bo‘lib qolmoqda, lekin THESE signallarga e’tibor bering
KMNO Rally’da ishtirokni tekshirish
KMNO bilan bog‘liq men e’tiborimni tortgan narsa faqat 24% ga ko‘tarilgani emas.
Harakatni aslida kim boshqarayotgani o‘sha.
KMNO bozor kapitali 189 mln dollarga yaqinlashgani sari keskin ko‘tarildi. Chakana ishtirok kuchli bo‘ldi, shu bilan birga kitlar ham hali ham ishtirok etmoqda.
Whale Retail Delta qiziqarli manzarani ko‘rsatadi.
0.66 dan 0.17 gacha tushdi, lekin baribir ijobiy bo‘lib qoldi. Bu menga shuni ko‘rsatadiki, chakana savdo harakati yanada katta ulushga ega bo‘lgan, lekin kitlar (whale) ishtirokini butunlay yo‘q qilib yubormagan.
Hozircha bu muammo bo‘lishi shart emas.
KMNO bilan bog‘liq men e’tiborimni tortgan narsa faqat 24% ga ko‘tarilgani emas.
Harakatni aslida kim boshqarayotgani o‘sha.
KMNO bozor kapitali 189 mln dollarga yaqinlashgani sari keskin ko‘tarildi. Chakana ishtirok kuchli bo‘ldi, shu bilan birga kitlar ham hali ham ishtirok etmoqda.
Whale Retail Delta qiziqarli manzarani ko‘rsatadi.
0.66 dan 0.17 gacha tushdi, lekin baribir ijobiy bo‘lib qoldi. Bu menga shuni ko‘rsatadiki, chakana savdo harakati yanada katta ulushga ega bo‘lgan, lekin kitlar (whale) ishtirokini butunlay yo‘q qilib yubormagan.
Hozircha bu muammo bo‘lishi shart emas.
106
·
--
Maqola
Tarjimani ko‘rish
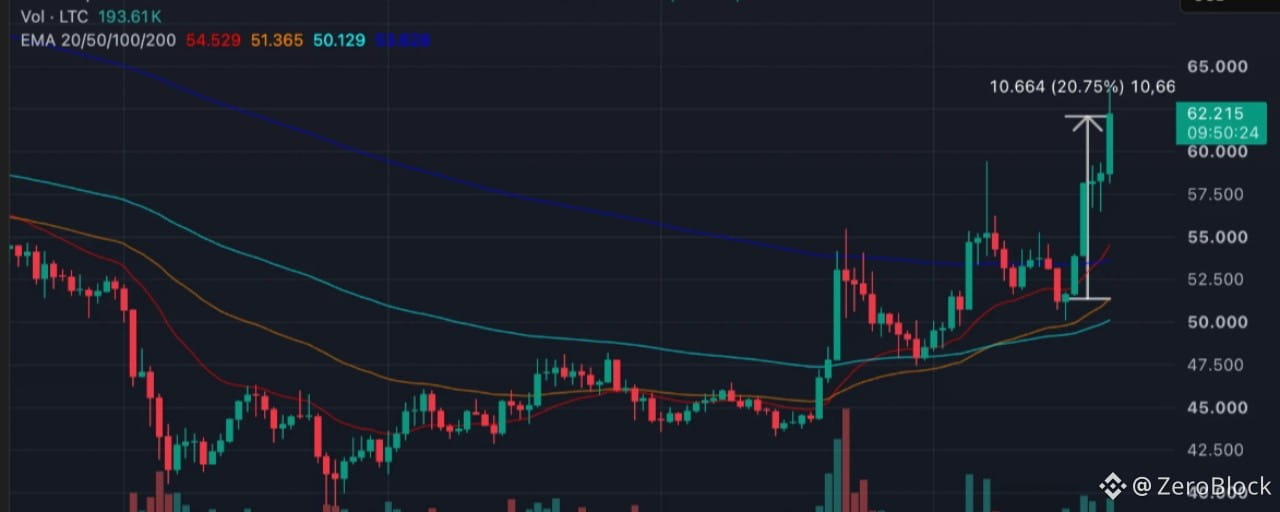
Litecoin price jumps 8%—can LTC break through $65?Litecoin Has One Level To Prove
What caught my attention with LTC is not the 8% move itself.
It is where the move has reached.
Litecoin pushed from below $57 toward $63.80 before cooling back toward $62. That puts price close to an area that has already stopped the recovery once before.
The first level I am watching is $63.80.
Then comes $65.
The interesting part is that trading activity also expanded sharply. 24 hour volume jumped around 93% to more than $520M. When price rises while volume expands it usually tells me that the move has more participation behind it than a simple low liquidity bounce.
But I would still separate participation from confirmation.
LTC has recovered from around $51.50 to above $62. That is close to a 20% move from the recent low. At the same time the broader market is also moving higher with Bitcoin reclaiming $85K.
So Litecoin is getting help from the wider market.
The daily structure is also looking different now. LTC has moved well above the $50 to $55 area that previously acted as resistance. That zone could now become important as support if the breakout develops.
For me the cleanest signal would be a daily close above $65.
Not just a quick wick above it.
If LTC breaks $65 and holds that level then the recent recovery starts looking more established. If buyers fail there then a pullback toward $58 to $60 would not automatically damage the structure.
The bigger warning would come if LTC loses that area and falls back toward $54 to $55.
That would tell me the market is still treating the current move as a bounce rather than a new trend.
Right now I am watching the close above $65 more than the intraday high.
The next move depends on whether buyers can turn $65 from resistance into support.
Litecoin price jumps 8%—can LTC break through $65?
Litecoin Has One Level To Prove
What caught my attention with LTC is not the 8% move itself.
It is where the move has reached.
Litecoin pushed from below $57 toward $63.80 before cooling back toward $62. That puts price close to an area that has already stopped the recovery once before.
The first level I am watching is $63.80.
Then comes $65.
The interesting part is that trading activity also expanded sharply. 24 hour volume jumped around 93% to more than $520M. When price rises while volume expands it usually tells me that the move has more participation behind it than a simple low liquidity bounce.
But I would still separate participation from confirmation.
LTC has recovered from around $51.50 to above $62. That is close to a 20% move from the recent low. At the same time the broader market is also moving higher with Bitcoin reclaiming $85K.
So Litecoin is getting help from the wider market.
The daily structure is also looking different now. LTC has moved well above the $50 to $55 area that previously acted as resistance. That zone could now become important as support if the breakout develops.
For me the cleanest signal would be a daily close above $65.
Not just a quick wick above it.
If LTC breaks $65 and holds that level then the recent recovery starts looking more established. If buyers fail there then a pullback toward $58 to $60 would not automatically damage the structure.
The bigger warning would come if LTC loses that area and falls back toward $54 to $55.
That would tell me the market is still treating the current move as a bounce rather than a new trend.
Right now I am watching the close above $65 more than the intraday high.
The next move depends on whether buyers can turn $65 from resistance into support.
What caught my attention with LTC is not the 8% move itself.
It is where the move has reached.
Litecoin pushed from below $57 toward $63.80 before cooling back toward $62. That puts price close to an area that has already stopped the recovery once before.
The first level I am watching is $63.80.
Then comes $65.
The interesting part is that trading activity also expanded sharply. 24 hour volume jumped around 93% to more than $520M. When price rises while volume expands it usually tells me that the move has more participation behind it than a simple low liquidity bounce.
But I would still separate participation from confirmation.
LTC has recovered from around $51.50 to above $62. That is close to a 20% move from the recent low. At the same time the broader market is also moving higher with Bitcoin reclaiming $85K.
So Litecoin is getting help from the wider market.
The daily structure is also looking different now. LTC has moved well above the $50 to $55 area that previously acted as resistance. That zone could now become important as support if the breakout develops.
For me the cleanest signal would be a daily close above $65.
Not just a quick wick above it.
If LTC breaks $65 and holds that level then the recent recovery starts looking more established. If buyers fail there then a pullback toward $58 to $60 would not automatically damage the structure.
The bigger warning would come if LTC loses that area and falls back toward $54 to $55.
That would tell me the market is still treating the current move as a bounce rather than a new trend.
Right now I am watching the close above $65 more than the intraday high.
The next move depends on whether buyers can turn $65 from resistance into support.
2
872
·
--

Maqola
Tarjimani ko‘rish
CLARITY Act Failed But Crypto Did Not StopWhat caught my attention is that the CLARITY Act did not simply fail because one side voted against it.
The Senate procedural vote ended 50 against and 49 in favor. Four Republicans joined Democrats in blocking the bill from moving forward.
But the more interesting part happened before the vote.
Thousands of hours reportedly went into negotiations between senators and their staff. There were moments when both sides appeared close to agreement. Then some of those compromises fell apart again.
The biggest friction seems to have come from the details.
Democratic aides said crypto industry pressure became part of the problem. Reports also pointed toward disagreements around crypto ethics and several major policy areas.
Coinbase CEO Brian Armstrong became one of the names connected to the debate. His position was more complicated than simply supporting or opposing the bill. He said earlier versions had problems around stablecoin rewards and other issues. He later supported the Senate version after changes were made.
That distinction matters.
The failure of CLARITY does not mean crypto regulation has stopped moving. It means the US still has not reached agreement on how digital assets should fit inside the existing financial system.
And there is another important point.
Crypto adoption is not waiting for Congress.
Banks are still building blockchain infrastructure. Tokenization is still expanding. Stablecoins are still being integrated into financial markets. Institutions are still experimenting with digital assets.
So I would not treat September 15 as the end of the regulatory story.
The bigger question is what comes next.
If lawmakers return with another market structure bill then the details around stablecoins DeFi tokenization and SEC versus CFTC authority will probably remain central.
For the market the immediate reaction may matter less than the eventual framework.
A failed vote creates uncertainty.
But uncertainty is not the same thing as a stopped industry.
The real test now is whether the next attempt produces clearer rules without creating another round of internal industry conflict.
CLARITY Act Failed But Crypto Did Not Stop
What caught my attention is that the CLARITY Act did not simply fail because one side voted against it.
The Senate procedural vote ended 50 against and 49 in favor. Four Republicans joined Democrats in blocking the bill from moving forward.
But the more interesting part happened before the vote.
Thousands of hours reportedly went into negotiations between senators and their staff. There were moments when both sides appeared close to agreement. Then some of those compromises fell apart again.
The biggest friction seems to have come from the details.
Democratic aides said crypto industry pressure became part of the problem. Reports also pointed toward disagreements around crypto ethics and several major policy areas.
Coinbase CEO Brian Armstrong became one of the names connected to the debate. His position was more complicated than simply supporting or opposing the bill. He said earlier versions had problems around stablecoin rewards and other issues. He later supported the Senate version after changes were made.
That distinction matters.
The failure of CLARITY does not mean crypto regulation has stopped moving. It means the US still has not reached agreement on how digital assets should fit inside the existing financial system.
And there is another important point.
Crypto adoption is not waiting for Congress.
Banks are still building blockchain infrastructure. Tokenization is still expanding. Stablecoins are still being integrated into financial markets. Institutions are still experimenting with digital assets.
So I would not treat September 15 as the end of the regulatory story.
The bigger question is what comes next.
If lawmakers return with another market structure bill then the details around stablecoins DeFi tokenization and SEC versus CFTC authority will probably remain central.
For the market the immediate reaction may matter less than the eventual framework.
A failed vote creates uncertainty.
But uncertainty is not the same thing as a stopped industry.
The real test now is whether the next attempt produces clearer rules without creating another round of internal industry conflict.
The Senate procedural vote ended 50 against and 49 in favor. Four Republicans joined Democrats in blocking the bill from moving forward.
But the more interesting part happened before the vote.
Thousands of hours reportedly went into negotiations between senators and their staff. There were moments when both sides appeared close to agreement. Then some of those compromises fell apart again.
The biggest friction seems to have come from the details.
Democratic aides said crypto industry pressure became part of the problem. Reports also pointed toward disagreements around crypto ethics and several major policy areas.
Coinbase CEO Brian Armstrong became one of the names connected to the debate. His position was more complicated than simply supporting or opposing the bill. He said earlier versions had problems around stablecoin rewards and other issues. He later supported the Senate version after changes were made.
That distinction matters.
The failure of CLARITY does not mean crypto regulation has stopped moving. It means the US still has not reached agreement on how digital assets should fit inside the existing financial system.
And there is another important point.
Crypto adoption is not waiting for Congress.
Banks are still building blockchain infrastructure. Tokenization is still expanding. Stablecoins are still being integrated into financial markets. Institutions are still experimenting with digital assets.
So I would not treat September 15 as the end of the regulatory story.
The bigger question is what comes next.
If lawmakers return with another market structure bill then the details around stablecoins DeFi tokenization and SEC versus CFTC authority will probably remain central.
For the market the immediate reaction may matter less than the eventual framework.
A failed vote creates uncertainty.
But uncertainty is not the same thing as a stopped industry.
The real test now is whether the next attempt produces clearer rules without creating another round of internal industry conflict.
2
1.7k
·
--
Maqola
Tarjimani ko‘rish
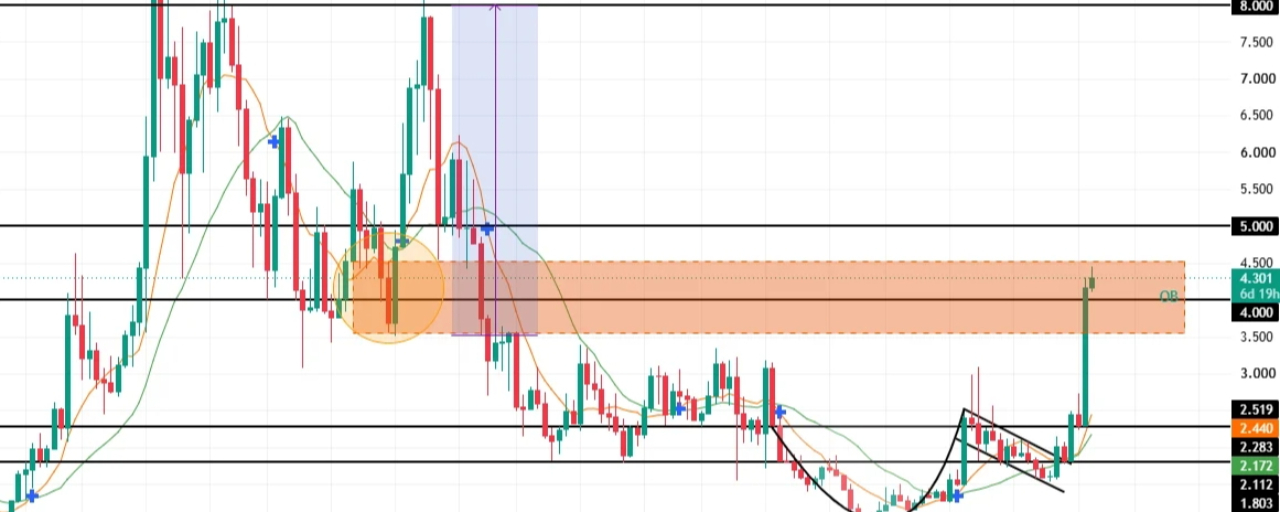
NEAR crypto rallies into historic breakout zone – Is $8 within reach?NEAR’s Rally Has A Real Demand Test
NEAR just moved around 17% and this time the price action is not the only thing catching my attention.
The network data is getting interesting too.
Confidential Intents TVL reached around $90.5M after growing roughly 188% over 90 days.
That is a meaningful increase in capital moving through the ecosystem.
Trading activity also expanded sharply.
NEAR volume jumped around 94% to roughly $2.21B.
But the part I find more important is what happened in the spot market.
The 90 day Spot Taker CVD showed buyers taking control.
Whale sized orders also appeared during the rally.
So unlike a move driven only by derivatives this recovery has evidence of aggressive spot demand behind it.
There is still one problem.
Funding has climbed to around 0.0282%.
That means leveraged longs are becoming more crowded.
If price keeps moving higher this leverage can help accelerate the move.
But if NEAR gets rejected from resistance then those same longs can become forced sellers.
The chart is now entering the $3.60 to $4.50 weekly order block.
This area is important because it previously acted as a major reaction zone.
NEAR rallied around 127% from this region in November 2024 and eventually reached close to $8.
But history does not guarantee the same move again.
The current setup is different and NEAR has approached the zone from below.
For me $4.50 is an important test before thinking about much higher levels.
A clean move through that area would show that buyers are accepting higher prices.
Then $5 becomes the next major level to watch.
If NEAR gets rejected inside the order block then the recent 17% rally could simply turn into consolidation.
The interesting part is that both sides of the market are now visible.
Spot demand is improving.
Whale activity is appearing.
Intents usage is expanding.
But leveraged longs are also increasing.
So I am watching whether spot buyers can keep absorbing supply as NEAR approaches $4.50.
That will tell me much more than the 17% candle itself.
NEAR crypto rallies into historic breakout zone – Is $8 within reach?
NEAR’s Rally Has A Real Demand Test
NEAR just moved around 17% and this time the price action is not the only thing catching my attention.
The network data is getting interesting too.
Confidential Intents TVL reached around $90.5M after growing roughly 188% over 90 days.
That is a meaningful increase in capital moving through the ecosystem.
Trading activity also expanded sharply.
NEAR volume jumped around 94% to roughly $2.21B.
But the part I find more important is what happened in the spot market.
The 90 day Spot Taker CVD showed buyers taking control.
Whale sized orders also appeared during the rally.
So unlike a move driven only by derivatives this recovery has evidence of aggressive spot demand behind it.
There is still one problem.
Funding has climbed to around 0.0282%.
That means leveraged longs are becoming more crowded.
If price keeps moving higher this leverage can help accelerate the move.
But if NEAR gets rejected from resistance then those same longs can become forced sellers.
The chart is now entering the $3.60 to $4.50 weekly order block.
This area is important because it previously acted as a major reaction zone.
NEAR rallied around 127% from this region in November 2024 and eventually reached close to $8.
But history does not guarantee the same move again.
The current setup is different and NEAR has approached the zone from below.
For me $4.50 is an important test before thinking about much higher levels.
A clean move through that area would show that buyers are accepting higher prices.
Then $5 becomes the next major level to watch.
If NEAR gets rejected inside the order block then the recent 17% rally could simply turn into consolidation.
The interesting part is that both sides of the market are now visible.
Spot demand is improving.
Whale activity is appearing.
Intents usage is expanding.
But leveraged longs are also increasing.
So I am watching whether spot buyers can keep absorbing supply as NEAR approaches $4.50.
That will tell me much more than the 17% candle itself.
NEAR just moved around 17% and this time the price action is not the only thing catching my attention.
The network data is getting interesting too.
Confidential Intents TVL reached around $90.5M after growing roughly 188% over 90 days.
That is a meaningful increase in capital moving through the ecosystem.
Trading activity also expanded sharply.
NEAR volume jumped around 94% to roughly $2.21B.
But the part I find more important is what happened in the spot market.
The 90 day Spot Taker CVD showed buyers taking control.
Whale sized orders also appeared during the rally.
So unlike a move driven only by derivatives this recovery has evidence of aggressive spot demand behind it.
There is still one problem.
Funding has climbed to around 0.0282%.
That means leveraged longs are becoming more crowded.
If price keeps moving higher this leverage can help accelerate the move.
But if NEAR gets rejected from resistance then those same longs can become forced sellers.
The chart is now entering the $3.60 to $4.50 weekly order block.
This area is important because it previously acted as a major reaction zone.
NEAR rallied around 127% from this region in November 2024 and eventually reached close to $8.
But history does not guarantee the same move again.
The current setup is different and NEAR has approached the zone from below.
For me $4.50 is an important test before thinking about much higher levels.
A clean move through that area would show that buyers are accepting higher prices.
Then $5 becomes the next major level to watch.
If NEAR gets rejected inside the order block then the recent 17% rally could simply turn into consolidation.
The interesting part is that both sides of the market are now visible.
Spot demand is improving.
Whale activity is appearing.
Intents usage is expanding.
But leveraged longs are also increasing.
So I am watching whether spot buyers can keep absorbing supply as NEAR approaches $4.50.
That will tell me much more than the 17% candle itself.
2
963
·
--
Maqola
Tarjimani ko‘rish
FTX Token’s volume explodes 2,187% as price rallies 33% – Can FTT’s breakout last?FTT’s 33% Rally Has A Volume Problem
FTT just moved 33% in one day and the first thing that caught my attention was not the price.
It was the volume.
Spot volume jumped around 2,187% to roughly $26.6M.
That is an extreme change in activity for a token that had been trading much more quietly.
The problem is that the price did not increase anywhere near as much as the volume.
That usually tells me speculation is playing a major role in the move.
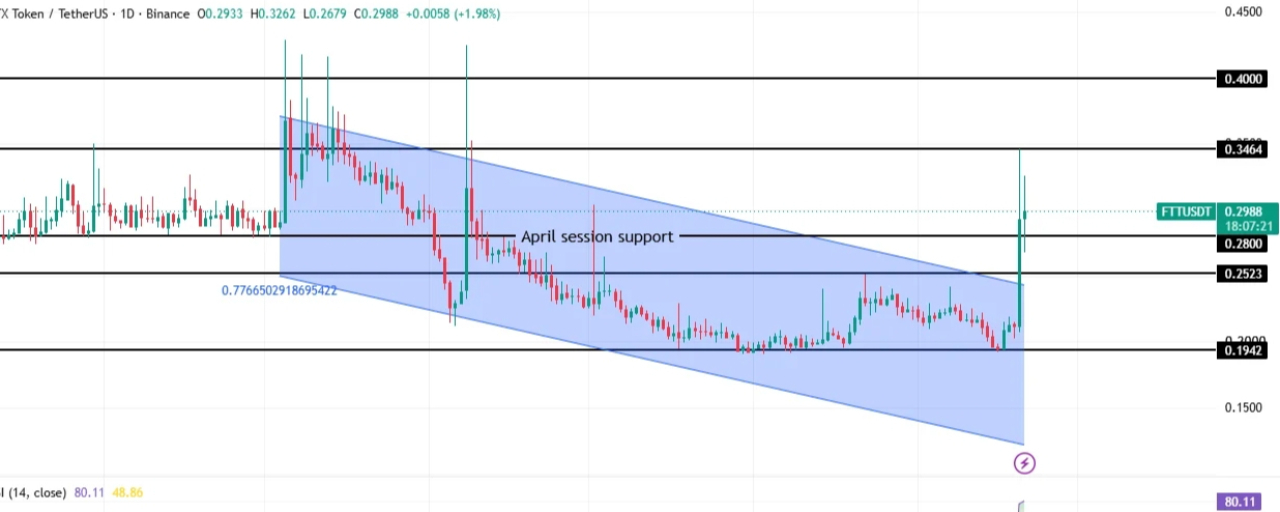
FTT also broke above a multi month descending channel and reclaimed the $0.2523 level.
Then price moved through the $0.28 area and reached close to $0.30.
So technically the structure has improved.
But there is another number I would not ignore.
Spot netflow turned positive around $618K on September 20.
Positive exchange netflow means more FTT entered exchanges than left them.
That does not automatically mean those tokens will be sold.
But it does create potential supply that the market needs to absorb.
So right now there are two competing signals.
Price is rising and the breakout is real.
At the same time more tokens are moving toward exchanges while the rally appears heavily driven by speculative volume.
The RSI makes this even more interesting.
It reached around 80 which puts FTT firmly into overbought territory.
That does not mean the breakout has to fail.
Strong momentum can stay overbought for longer than expected.
But after a 33% move I would rather watch the support levels than chase the candle.
For me $0.28 is the first important level.
If FTT holds there then the breakout structure remains intact and $0.3464 becomes the next major resistance.
If $0.28 fails then $0.2523 becomes important again.
That would tell me the breakout needs more time before it can continue.
The biggest question is not whether FTT can touch $0.3464.
It is whether real demand can keep absorbing the supply while speculative activity cools down.
Right now the chart looks stronger.
But the volume tells me this move still needs to prove itself.
FTX Token’s volume explodes 2,187% as price rallies 33% – Can FTT’s breakout last?
FTT’s 33% Rally Has A Volume Problem
FTT just moved 33% in one day and the first thing that caught my attention was not the price.
It was the volume.
Spot volume jumped around 2,187% to roughly $26.6M.
That is an extreme change in activity for a token that had been trading much more quietly.
The problem is that the price did not increase anywhere near as much as the volume.
That usually tells me speculation is playing a major role in the move.
FTT also broke above a multi month descending channel and reclaimed the $0.2523 level.
Then price moved through the $0.28 area and reached close to $0.30.
So technically the structure has improved.
But there is another number I would not ignore.
Spot netflow turned positive around $618K on September 20.
Positive exchange netflow means more FTT entered exchanges than left them.
That does not automatically mean those tokens will be sold.
But it does create potential supply that the market needs to absorb.
So right now there are two competing signals.
Price is rising and the breakout is real.
At the same time more tokens are moving toward exchanges while the rally appears heavily driven by speculative volume.
The RSI makes this even more interesting.
It reached around 80 which puts FTT firmly into overbought territory.
That does not mean the breakout has to fail.
Strong momentum can stay overbought for longer than expected.
But after a 33% move I would rather watch the support levels than chase the candle.
For me $0.28 is the first important level.
If FTT holds there then the breakout structure remains intact and $0.3464 becomes the next major resistance.
If $0.28 fails then $0.2523 becomes important again.
That would tell me the breakout needs more time before it can continue.
The biggest question is not whether FTT can touch $0.3464.
It is whether real demand can keep absorbing the supply while speculative activity cools down.
Right now the chart looks stronger.
But the volume tells me this move still needs to prove itself.
FTT just moved 33% in one day and the first thing that caught my attention was not the price.
It was the volume.
Spot volume jumped around 2,187% to roughly $26.6M.
That is an extreme change in activity for a token that had been trading much more quietly.
The problem is that the price did not increase anywhere near as much as the volume.
That usually tells me speculation is playing a major role in the move.
FTT also broke above a multi month descending channel and reclaimed the $0.2523 level.
Then price moved through the $0.28 area and reached close to $0.30.
So technically the structure has improved.
But there is another number I would not ignore.
Spot netflow turned positive around $618K on September 20.
Positive exchange netflow means more FTT entered exchanges than left them.
That does not automatically mean those tokens will be sold.
But it does create potential supply that the market needs to absorb.
So right now there are two competing signals.
Price is rising and the breakout is real.
At the same time more tokens are moving toward exchanges while the rally appears heavily driven by speculative volume.
The RSI makes this even more interesting.
It reached around 80 which puts FTT firmly into overbought territory.
That does not mean the breakout has to fail.
Strong momentum can stay overbought for longer than expected.
But after a 33% move I would rather watch the support levels than chase the candle.
For me $0.28 is the first important level.
If FTT holds there then the breakout structure remains intact and $0.3464 becomes the next major resistance.
If $0.28 fails then $0.2523 becomes important again.
That would tell me the breakout needs more time before it can continue.
The biggest question is not whether FTT can touch $0.3464.
It is whether real demand can keep absorbing the supply while speculative activity cools down.
Right now the chart looks stronger.
But the volume tells me this move still needs to prove itself.
3
2.1k
·
--
Maqola
Tarjimani ko‘rish
Bitcoin bounces 9% off $74K as Fed rate hike fails to drown bullsBitcoin Just Reclaimed A Level That Matters
Bitcoin dropping toward $75K last week and then recovering more than 9% in less than a week tells me the market has changed quickly.
But I would not call the entire move a confirmed bull run yet.
The more interesting development is on the weekly chart.
Bitcoin closed above its 52 week moving average for the first time since November 2025.
That is an important technical recovery.
But moving above a long term average does not automatically mean the next major trend has already started.
Price still needs to prove that buyers can defend the breakout.
For me the first major test is around $82.3K.
That was the September high and it is now sitting directly above the current recovery.
Above that level the liquidity structure becomes interesting.
There is a large cluster of short liquidations between roughly $83K and $86K.
If BTC breaks $82.3K with strong spot demand then those short positions could start getting forced out.
That can create additional buying pressure as shorts close.
But liquidation liquidity is not the same thing as organic demand.
If spot buyers disappear then the market can still reject before reaching that zone.
There is also another side to the setup.
The recent bounce has created a strong bullish narrative across the market.
Whenever positioning becomes too one sided I start watching the opposite side more carefully.
A rejection around $82K could send BTC back toward the $76K area.
Below that the short term holder realized price around $72.3K becomes an important reference.
So I would not chase the 9% recovery simply because Bitcoin bounced hard from $75K.
The structure is improving.
The weekly close above the 52 week average matters.
But $82.3K is where the market needs to prove something.
If BTC clears it and holds then the $83K to $86K liquidation cluster becomes a real area of interest.
If it fails there then this could still be another range recovery rather than the start of a new trend.
For now I am watching the breakout rather than predicting it.
Bitcoin bounces 9% off $74K as Fed rate hike fails to drown bulls
Bitcoin Just Reclaimed A Level That Matters
Bitcoin dropping toward $75K last week and then recovering more than 9% in less than a week tells me the market has changed quickly.
But I would not call the entire move a confirmed bull run yet.
The more interesting development is on the weekly chart.
Bitcoin closed above its 52 week moving average for the first time since November 2025.
That is an important technical recovery.
But moving above a long term average does not automatically mean the next major trend has already started.
Price still needs to prove that buyers can defend the breakout.
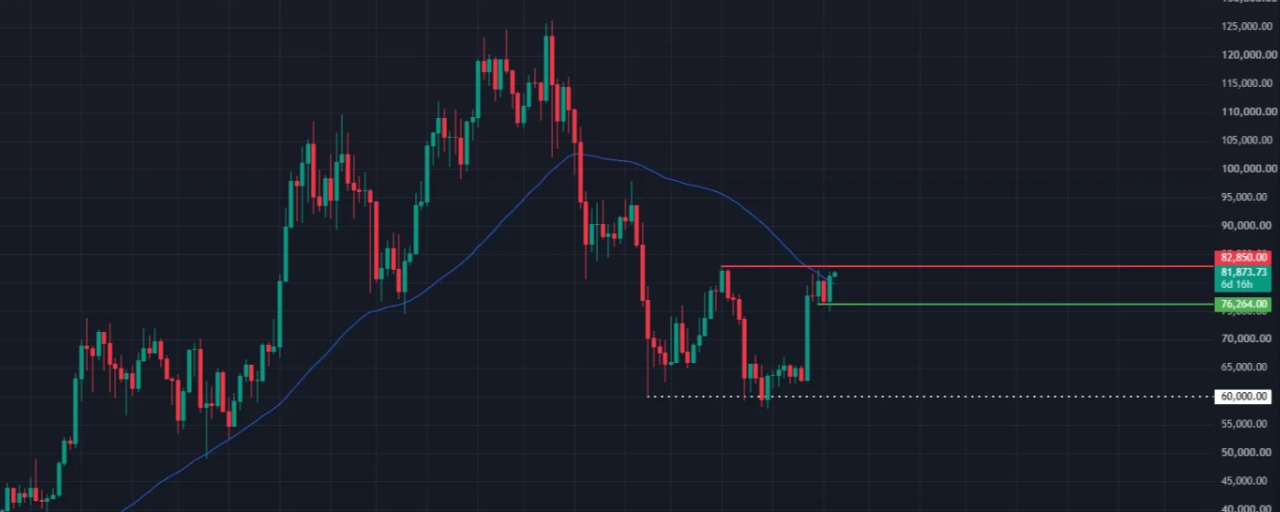
For me the first major test is around $82.3K.
That was the September high and it is now sitting directly above the current recovery.
Above that level the liquidity structure becomes interesting.
There is a large cluster of short liquidations between roughly $83K and $86K.
If BTC breaks $82.3K with strong spot demand then those short positions could start getting forced out.
That can create additional buying pressure as shorts close.
But liquidation liquidity is not the same thing as organic demand.
If spot buyers disappear then the market can still reject before reaching that zone.
There is also another side to the setup.
The recent bounce has created a strong bullish narrative across the market.
Whenever positioning becomes too one sided I start watching the opposite side more carefully.
A rejection around $82K could send BTC back toward the $76K area.
Below that the short term holder realized price around $72.3K becomes an important reference.
So I would not chase the 9% recovery simply because Bitcoin bounced hard from $75K.
The structure is improving.
The weekly close above the 52 week average matters.
But $82.3K is where the market needs to prove something.
If BTC clears it and holds then the $83K to $86K liquidation cluster becomes a real area of interest.
If it fails there then this could still be another range recovery rather than the start of a new trend.
For now I am watching the breakout rather than predicting it.
Bitcoin dropping toward $75K last week and then recovering more than 9% in less than a week tells me the market has changed quickly.
But I would not call the entire move a confirmed bull run yet.
The more interesting development is on the weekly chart.
Bitcoin closed above its 52 week moving average for the first time since November 2025.
That is an important technical recovery.
But moving above a long term average does not automatically mean the next major trend has already started.
Price still needs to prove that buyers can defend the breakout.
For me the first major test is around $82.3K.
That was the September high and it is now sitting directly above the current recovery.
Above that level the liquidity structure becomes interesting.
There is a large cluster of short liquidations between roughly $83K and $86K.
If BTC breaks $82.3K with strong spot demand then those short positions could start getting forced out.
That can create additional buying pressure as shorts close.
But liquidation liquidity is not the same thing as organic demand.
If spot buyers disappear then the market can still reject before reaching that zone.
There is also another side to the setup.
The recent bounce has created a strong bullish narrative across the market.
Whenever positioning becomes too one sided I start watching the opposite side more carefully.
A rejection around $82K could send BTC back toward the $76K area.
Below that the short term holder realized price around $72.3K becomes an important reference.
So I would not chase the 9% recovery simply because Bitcoin bounced hard from $75K.
The structure is improving.
The weekly close above the 52 week average matters.
But $82.3K is where the market needs to prove something.
If BTC clears it and holds then the $83K to $86K liquidation cluster becomes a real area of interest.
If it fails there then this could still be another range recovery rather than the start of a new trend.
For now I am watching the breakout rather than predicting it.
1
604
·
--
Tasdiqlangan
Maqola
Tarjimani ko‘rish
177M XRP floods into Binance in 7 days – And it’s not a sell signal177M XRP Entered Binance But The Data Says More
The 177M XRP moving into Binance over the past week looks scary at first.
But I think the reserve data tells a more interesting story.
Around 91.2M XRP arrived on September 11.
Another 44.5M came on September 16.
Then another 41.7M arrived on September 17.
That is a lot of XRP entering one exchange in a short period.
The easy conclusion would be that someone is preparing to sell.
I would not make that conclusion yet.
Binance still held around 2.63B XRP and its reserve increased only around 0.34% during the same period.
At the same time daily outflows averaged roughly 11.6M XRP.
So a large part of those deposits appears to have been moved out again or redistributed.
That makes the flow more complicated than simply saying exchange inflows equal selling.
The price structure is also worth watching.
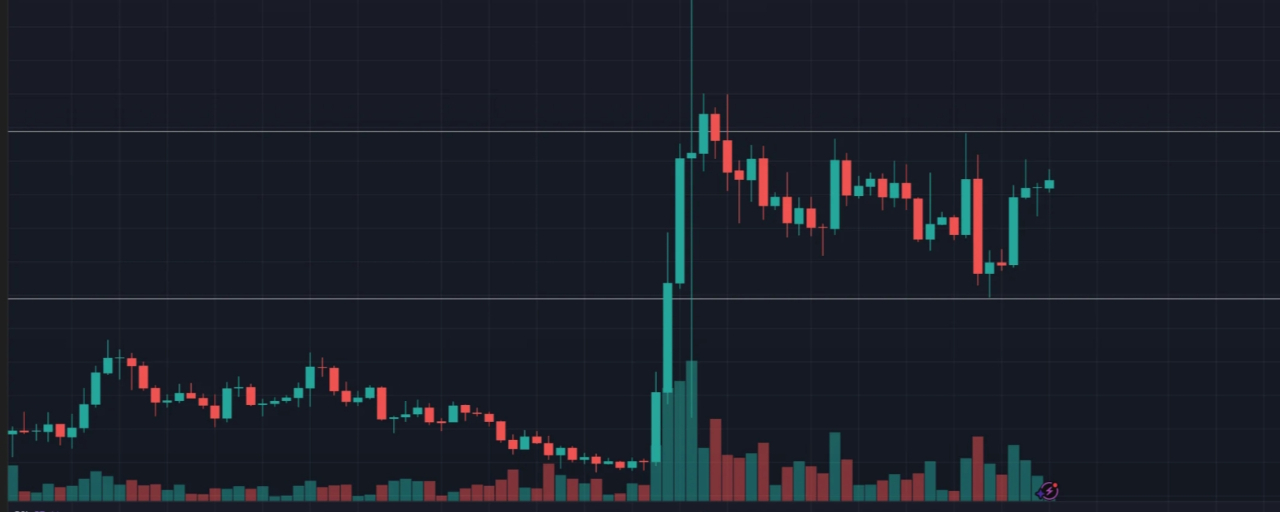
XRP defended around $1.24 and recovered toward $1.42.
Since the September 16 selloff the chart has also been printing higher lows.
That tells me buyers are becoming more active when price moves toward the lower part of the range.
But there is still one level standing directly in front of the recovery.
$1.49.
XRP has already been rejected around this area multiple times.
RSI is around 57.44 which is not yet overbought.
So there is still room for momentum to continue if buyers can absorb the supply around $1.49.
The XRPL upgrade adds another interesting layer.
Batch V1.1 received 30 of 35 validator votes and crossed the 80% activation threshold.
The upgrade allows up to eight dependent transactions to be bundled into one atomic transaction.
With XRPL already processing around 2.08M transactions per day the bigger benefit may be better settlement efficiency rather than simply more raw capacity.
For me the XRP setup now comes down to one question.
Can buyers turn the current recovery into a clean break above $1.49?
If yes then the recent exchange flows become less convincing as a bearish signal.
If XRP gets rejected again then the range structure remains intact.
The deposits are large.
But the reserve data says the story is more complicated than 177M XRP simply waiting to be sold.
177M XRP floods into Binance in 7 days – And it’s not a sell signal
177M XRP Entered Binance But The Data Says More
The 177M XRP moving into Binance over the past week looks scary at first.
But I think the reserve data tells a more interesting story.
Around 91.2M XRP arrived on September 11.
Another 44.5M came on September 16.
Then another 41.7M arrived on September 17.
That is a lot of XRP entering one exchange in a short period.
The easy conclusion would be that someone is preparing to sell.
I would not make that conclusion yet.
Binance still held around 2.63B XRP and its reserve increased only around 0.34% during the same period.
At the same time daily outflows averaged roughly 11.6M XRP.
So a large part of those deposits appears to have been moved out again or redistributed.
That makes the flow more complicated than simply saying exchange inflows equal selling.
The price structure is also worth watching.
XRP defended around $1.24 and recovered toward $1.42.
Since the September 16 selloff the chart has also been printing higher lows.
That tells me buyers are becoming more active when price moves toward the lower part of the range.
But there is still one level standing directly in front of the recovery.
$1.49.
XRP has already been rejected around this area multiple times.
RSI is around 57.44 which is not yet overbought.
So there is still room for momentum to continue if buyers can absorb the supply around $1.49.
The XRPL upgrade adds another interesting layer.
Batch V1.1 received 30 of 35 validator votes and crossed the 80% activation threshold.
The upgrade allows up to eight dependent transactions to be bundled into one atomic transaction.
With XRPL already processing around 2.08M transactions per day the bigger benefit may be better settlement efficiency rather than simply more raw capacity.
For me the XRP setup now comes down to one question.
Can buyers turn the current recovery into a clean break above $1.49?
If yes then the recent exchange flows become less convincing as a bearish signal.
If XRP gets rejected again then the range structure remains intact.
The deposits are large.
But the reserve data says the story is more complicated than 177M XRP simply waiting to be sold.
The 177M XRP moving into Binance over the past week looks scary at first.
But I think the reserve data tells a more interesting story.
Around 91.2M XRP arrived on September 11.
Another 44.5M came on September 16.
Then another 41.7M arrived on September 17.
That is a lot of XRP entering one exchange in a short period.
The easy conclusion would be that someone is preparing to sell.
I would not make that conclusion yet.
Binance still held around 2.63B XRP and its reserve increased only around 0.34% during the same period.
At the same time daily outflows averaged roughly 11.6M XRP.
So a large part of those deposits appears to have been moved out again or redistributed.
That makes the flow more complicated than simply saying exchange inflows equal selling.
The price structure is also worth watching.
XRP defended around $1.24 and recovered toward $1.42.
Since the September 16 selloff the chart has also been printing higher lows.
That tells me buyers are becoming more active when price moves toward the lower part of the range.
But there is still one level standing directly in front of the recovery.
$1.49.
XRP has already been rejected around this area multiple times.
RSI is around 57.44 which is not yet overbought.
So there is still room for momentum to continue if buyers can absorb the supply around $1.49.
The XRPL upgrade adds another interesting layer.
Batch V1.1 received 30 of 35 validator votes and crossed the 80% activation threshold.
The upgrade allows up to eight dependent transactions to be bundled into one atomic transaction.
With XRPL already processing around 2.08M transactions per day the bigger benefit may be better settlement efficiency rather than simply more raw capacity.
For me the XRP setup now comes down to one question.
Can buyers turn the current recovery into a clean break above $1.49?
If yes then the recent exchange flows become less convincing as a bearish signal.
If XRP gets rejected again then the range structure remains intact.
The deposits are large.
But the reserve data says the story is more complicated than 177M XRP simply waiting to be sold.
3
1.6k
·
--
Maqola
Tarjimani ko‘rish
CASHCAT falls 30% – But this same support level has historically triggered ralliesCASHCAT Just Hit Its Most Important Level
CASHCAT falling 30% in one day looks ugly on the chart.
But the more interesting part is where the drop has taken the price.
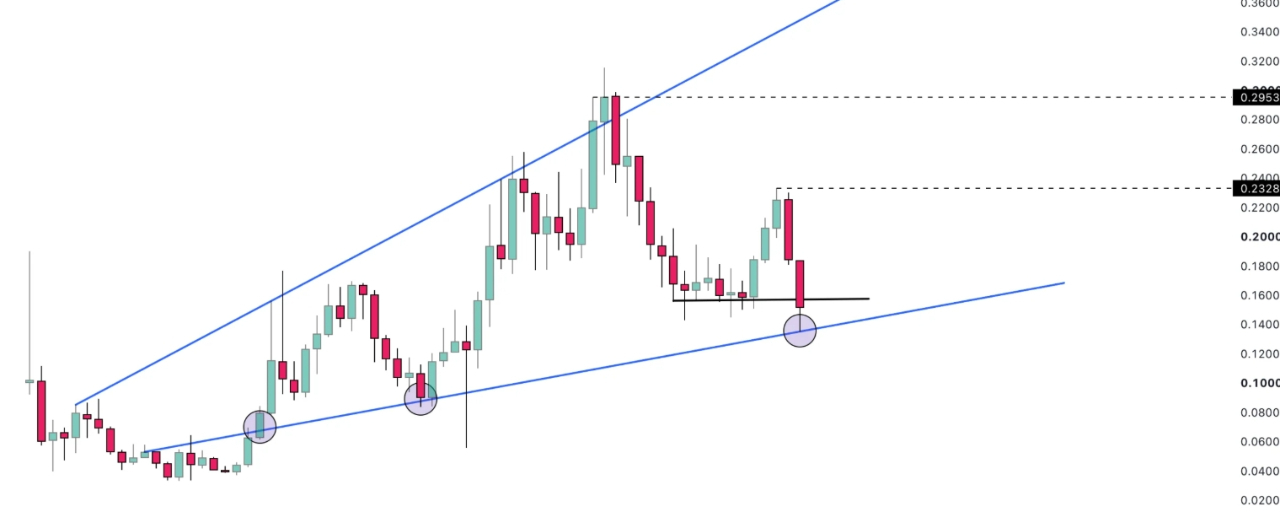
The selloff pushed CASHCAT into the lower boundary of a broader rising channel.
This same area has previously acted as a reaction zone where buyers stepped in and pushed price higher.
That does not mean another rally has to happen.
It only means this is now a level worth watching closely.
The short term indicators are giving a mixed picture.
Bull Bear Power is still clearly showing seller control.
The bearish histogram is also at one of its strongest levels since September 10.
So buyers have not taken control yet.
But the Money Flow Index is telling a slightly different story.
MFI has climbed toward 35.5 while price moved into channel support.
That suggests some capital is starting to flow back into the market instead of everyone simply exiting.
The funding rate is also still positive around 0.0078%.
That means long positions remain more dominant in the derivatives market.
Spot netflow is showing net buying as well.
This is important because a recovery supported by spot buying is very different from a bounce created only by leveraged traders.
But there is also a risk here.
Positive funding means longs are already paying to stay positioned.
If CASHCAT fails to hold this support then those longs can become additional selling pressure as traders close positions.
So I would not call this a confirmed bottom yet.
For me the key question is simple.
Can CASHCAT hold the rising channel support and turn the current buying activity into an actual price recovery?
If buyers defend this zone then the historical reaction pattern becomes relevant again.
If support breaks then the entire bullish channel structure becomes much weaker.
After a 30% drop the chart is at an important decision point.
The next move will tell us whether this was a liquidation event into support or the beginning of a deeper trend change.
CASHCAT falls 30% – But this same support level has historically triggered rallies
CASHCAT Just Hit Its Most Important Level
CASHCAT falling 30% in one day looks ugly on the chart.
But the more interesting part is where the drop has taken the price.
The selloff pushed CASHCAT into the lower boundary of a broader rising channel.
This same area has previously acted as a reaction zone where buyers stepped in and pushed price higher.
That does not mean another rally has to happen.
It only means this is now a level worth watching closely.
The short term indicators are giving a mixed picture.
Bull Bear Power is still clearly showing seller control.
The bearish histogram is also at one of its strongest levels since September 10.
So buyers have not taken control yet.
But the Money Flow Index is telling a slightly different story.
MFI has climbed toward 35.5 while price moved into channel support.
That suggests some capital is starting to flow back into the market instead of everyone simply exiting.
The funding rate is also still positive around 0.0078%.
That means long positions remain more dominant in the derivatives market.
Spot netflow is showing net buying as well.
This is important because a recovery supported by spot buying is very different from a bounce created only by leveraged traders.
But there is also a risk here.
Positive funding means longs are already paying to stay positioned.
If CASHCAT fails to hold this support then those longs can become additional selling pressure as traders close positions.
So I would not call this a confirmed bottom yet.
For me the key question is simple.
Can CASHCAT hold the rising channel support and turn the current buying activity into an actual price recovery?
If buyers defend this zone then the historical reaction pattern becomes relevant again.
If support breaks then the entire bullish channel structure becomes much weaker.
After a 30% drop the chart is at an important decision point.
The next move will tell us whether this was a liquidation event into support or the beginning of a deeper trend change.
CASHCAT falling 30% in one day looks ugly on the chart.
But the more interesting part is where the drop has taken the price.
The selloff pushed CASHCAT into the lower boundary of a broader rising channel.
This same area has previously acted as a reaction zone where buyers stepped in and pushed price higher.
That does not mean another rally has to happen.
It only means this is now a level worth watching closely.
The short term indicators are giving a mixed picture.
Bull Bear Power is still clearly showing seller control.
The bearish histogram is also at one of its strongest levels since September 10.
So buyers have not taken control yet.
But the Money Flow Index is telling a slightly different story.
MFI has climbed toward 35.5 while price moved into channel support.
That suggests some capital is starting to flow back into the market instead of everyone simply exiting.
The funding rate is also still positive around 0.0078%.
That means long positions remain more dominant in the derivatives market.
Spot netflow is showing net buying as well.
This is important because a recovery supported by spot buying is very different from a bounce created only by leveraged traders.
But there is also a risk here.
Positive funding means longs are already paying to stay positioned.
If CASHCAT fails to hold this support then those longs can become additional selling pressure as traders close positions.
So I would not call this a confirmed bottom yet.
For me the key question is simple.
Can CASHCAT hold the rising channel support and turn the current buying activity into an actual price recovery?
If buyers defend this zone then the historical reaction pattern becomes relevant again.
If support breaks then the entire bullish channel structure becomes much weaker.
After a 30% drop the chart is at an important decision point.
The next move will tell us whether this was a liquidation event into support or the beginning of a deeper trend change.
3k
·
--
Maqola
Bitcoin Qishi Tugayapti, Lekin $82K MuhimBitcoin yana $80K ustiga qaytishi muhim ko‘rinadi.
Lekin menga yanada qiziqroq savol shuki, bu haqiqatan ham yangi siklning boshlanishimi yoki hozirgi oraliq ichidagi yana bir kuchli tiklanishmi.
Fidelity’ning Jurrien Timmer fikricha, BTC qariyb bir yil davomida $60K ustida ushlanib turganidan keyin Bitcoin qishining tugashi mumkin.
U shuningdek, bozor rejimi o‘zgarayotgan bo‘lishi mumkinligining yana bir belgisi sifatida Bitcoin va oltin o‘rtasidagi munosabatlarning yaxshilanayotganini ham ko‘rsatadi.
Bu qiziqarli nazariya.
Ammo men baribir narx buni tasdiqlashini xohlardim.
Bitcoin Qishi Tugayapti, Lekin $82K Muhim
Bitcoin yana $80K ustiga qaytishi muhim ko‘rinadi.
Lekin menga yanada qiziqroq savol shuki, bu haqiqatan ham yangi siklning boshlanishimi yoki hozirgi oraliq ichidagi yana bir kuchli tiklanishmi.
Fidelity’ning Jurrien Timmer fikricha, BTC qariyb bir yil davomida $60K ustida ushlanib turganidan keyin Bitcoin qishining tugashi mumkin.
U shuningdek, bozor rejimi o‘zgarayotgan bo‘lishi mumkinligining yana bir belgisi sifatida Bitcoin va oltin o‘rtasidagi munosabatlarning yaxshilanayotganini ham ko‘rsatadi.
Bu qiziqarli nazariya.
Ammo men baribir narx buni tasdiqlashini xohlardim.
Lekin menga yanada qiziqroq savol shuki, bu haqiqatan ham yangi siklning boshlanishimi yoki hozirgi oraliq ichidagi yana bir kuchli tiklanishmi.
Fidelity’ning Jurrien Timmer fikricha, BTC qariyb bir yil davomida $60K ustida ushlanib turganidan keyin Bitcoin qishining tugashi mumkin.
U shuningdek, bozor rejimi o‘zgarayotgan bo‘lishi mumkinligining yana bir belgisi sifatida Bitcoin va oltin o‘rtasidagi munosabatlarning yaxshilanayotganini ham ko‘rsatadi.
Bu qiziqarli nazariya.
Ammo men baribir narx buni tasdiqlashini xohlardim.
277
·
--

Maqola
Tarjimani ko‘rish
ETH’s $2,500 Reclaim Has A Supply StoryETH getting back above $2,500 is interesting.
But I think the more important part is happening away from the price chart.
The amount of ETH sitting on exchanges has been falling for a long time.
Since May 2025 exchange balances reportedly dropped from around 14.8 million ETH to roughly 25.7 million ETH.
The numbers in the data are worth checking carefully because the direction matters more than the exact figure.
Less ETH immediately available on exchanges means there can be less liquid supply when demand suddenly increases.
Staking is adding another layer to this.
Around 29.8% of ETH was staked in September 2025.
By September 18 2026 that figure had reached roughly 35.56%.
That is a meaningful shift.
More ETH being staked means a larger portion of supply is not actively moving through spot markets.
Then there are the ETFs.
US spot ETH ETFs have reportedly accumulated around $13.25 billion in total inflows with assets around $16.7 billion.
That creates another destination for ETH outside normal exchange liquidity.
But this is where I would avoid the easy conclusion that lower supply automatically means higher price.
It does not.
Supply becomes important only when there is enough demand to interact with it.
And ETF flows have not been consistent every day.
Some sessions have seen large outflows while another recent day recorded around $143.8 million in inflows.
So the real test for ETH is still demand.
If buyers keep absorbing available supply while more ETH moves into staking and long term holdings then price can become more sensitive to relatively small changes in spot demand.
But if buyers disappear then thin liquidity can work in the opposite direction.
That is the part I would watch around $2,500.
Holding above it would show that the market can accept higher prices despite the recent volatility.
Losing it would tell me that tighter supply alone is not enough.
For now ETH has a stronger supply structure than the price chart alone suggests.
The next move depends on whether demand can actually take advantage of it.
ETH’s $2,500 Reclaim Has A Supply Story
ETH getting back above $2,500 is interesting.
But I think the more important part is happening away from the price chart.
The amount of ETH sitting on exchanges has been falling for a long time.
Since May 2025 exchange balances reportedly dropped from around 14.8 million ETH to roughly 25.7 million ETH.
The numbers in the data are worth checking carefully because the direction matters more than the exact figure.
Less ETH immediately available on exchanges means there can be less liquid supply when demand suddenly increases.
Staking is adding another layer to this.
Around 29.8% of ETH was staked in September 2025.
By September 18 2026 that figure had reached roughly 35.56%.
That is a meaningful shift.
More ETH being staked means a larger portion of supply is not actively moving through spot markets.
Then there are the ETFs.
US spot ETH ETFs have reportedly accumulated around $13.25 billion in total inflows with assets around $16.7 billion.
That creates another destination for ETH outside normal exchange liquidity.
But this is where I would avoid the easy conclusion that lower supply automatically means higher price.
It does not.
Supply becomes important only when there is enough demand to interact with it.
And ETF flows have not been consistent every day.
Some sessions have seen large outflows while another recent day recorded around $143.8 million in inflows.
So the real test for ETH is still demand.
If buyers keep absorbing available supply while more ETH moves into staking and long term holdings then price can become more sensitive to relatively small changes in spot demand.
But if buyers disappear then thin liquidity can work in the opposite direction.
That is the part I would watch around $2,500.
Holding above it would show that the market can accept higher prices despite the recent volatility.
Losing it would tell me that tighter supply alone is not enough.
For now ETH has a stronger supply structure than the price chart alone suggests.
The next move depends on whether demand can actually take advantage of it.
But I think the more important part is happening away from the price chart.
The amount of ETH sitting on exchanges has been falling for a long time.
Since May 2025 exchange balances reportedly dropped from around 14.8 million ETH to roughly 25.7 million ETH.
The numbers in the data are worth checking carefully because the direction matters more than the exact figure.
Less ETH immediately available on exchanges means there can be less liquid supply when demand suddenly increases.
Staking is adding another layer to this.
Around 29.8% of ETH was staked in September 2025.
By September 18 2026 that figure had reached roughly 35.56%.
That is a meaningful shift.
More ETH being staked means a larger portion of supply is not actively moving through spot markets.
Then there are the ETFs.
US spot ETH ETFs have reportedly accumulated around $13.25 billion in total inflows with assets around $16.7 billion.
That creates another destination for ETH outside normal exchange liquidity.
But this is where I would avoid the easy conclusion that lower supply automatically means higher price.
It does not.
Supply becomes important only when there is enough demand to interact with it.
And ETF flows have not been consistent every day.
Some sessions have seen large outflows while another recent day recorded around $143.8 million in inflows.
So the real test for ETH is still demand.
If buyers keep absorbing available supply while more ETH moves into staking and long term holdings then price can become more sensitive to relatively small changes in spot demand.
But if buyers disappear then thin liquidity can work in the opposite direction.
That is the part I would watch around $2,500.
Holding above it would show that the market can accept higher prices despite the recent volatility.
Losing it would tell me that tighter supply alone is not enough.
For now ETH has a stronger supply structure than the price chart alone suggests.
The next move depends on whether demand can actually take advantage of it.
60
·
--

Maqola
Tarjimani ko‘rish
SOL Has More Than Just A Chart SetupI have been watching Solana more closely after the recent altcoin rotation.
The interesting part is that SOL is not only moving with the market.
There are a few numbers underneath the move that make the October setup more interesting.
SOL gained around 9% this week and reached roughly $114.
At the same time the SOL to ETH ratio moved higher by around 4%.
That tells me capital is not simply returning to altcoins.
Some of it is showing a preference for Solana.
The network data is even more interesting.
Solana processed around 5.2 billion non vote transactions in August.
That was a new record and around 19% higher than the previous record from July.
There was also strong activity in spot markets with weekly volume around $5.2 billion.
But I would not automatically treat every transaction as fundamental demand.
Solana has always had a large amount of activity coming from speculative and memecoin markets.
That activity can disappear quickly when liquidity changes.
What makes the current setup different is the combination of network activity and institutional flows.
Solana spot ETFs recorded around $47.62 million in net inflows on September 18.
That gives the rally another source of demand beyond retail rotation.
Technically SOL also managed to move above important resistance while Bitcoin was reclaiming $80K.
For me the next question is not whether SOL can print another green candle.
It is whether this relative strength survives the next Bitcoin pullback.
If SOL keeps holding above the breakout area while network activity and ETF inflows remain strong then October starts with a much more interesting structure.
But if the activity fades and SOL falls back into its previous range then this could turn out to be another rotation trade.
Right now the data is improving.
The part I would watch most is whether real demand keeps following the price.
SOL Has More Than Just A Chart Setup
I have been watching Solana more closely after the recent altcoin rotation.
The interesting part is that SOL is not only moving with the market.
There are a few numbers underneath the move that make the October setup more interesting.
SOL gained around 9% this week and reached roughly $114.
At the same time the SOL to ETH ratio moved higher by around 4%.
That tells me capital is not simply returning to altcoins.
Some of it is showing a preference for Solana.
The network data is even more interesting.
Solana processed around 5.2 billion non vote transactions in August.
That was a new record and around 19% higher than the previous record from July.
There was also strong activity in spot markets with weekly volume around $5.2 billion.
But I would not automatically treat every transaction as fundamental demand.
Solana has always had a large amount of activity coming from speculative and memecoin markets.
That activity can disappear quickly when liquidity changes.
What makes the current setup different is the combination of network activity and institutional flows.
Solana spot ETFs recorded around $47.62 million in net inflows on September 18.
That gives the rally another source of demand beyond retail rotation.
Technically SOL also managed to move above important resistance while Bitcoin was reclaiming $80K.
For me the next question is not whether SOL can print another green candle.
It is whether this relative strength survives the next Bitcoin pullback.
If SOL keeps holding above the breakout area while network activity and ETF inflows remain strong then October starts with a much more interesting structure.
But if the activity fades and SOL falls back into its previous range then this could turn out to be another rotation trade.
Right now the data is improving.
The part I would watch most is whether real demand keeps following the price.
The interesting part is that SOL is not only moving with the market.
There are a few numbers underneath the move that make the October setup more interesting.
SOL gained around 9% this week and reached roughly $114.
At the same time the SOL to ETH ratio moved higher by around 4%.
That tells me capital is not simply returning to altcoins.
Some of it is showing a preference for Solana.
The network data is even more interesting.
Solana processed around 5.2 billion non vote transactions in August.
That was a new record and around 19% higher than the previous record from July.
There was also strong activity in spot markets with weekly volume around $5.2 billion.
But I would not automatically treat every transaction as fundamental demand.
Solana has always had a large amount of activity coming from speculative and memecoin markets.
That activity can disappear quickly when liquidity changes.
What makes the current setup different is the combination of network activity and institutional flows.
Solana spot ETFs recorded around $47.62 million in net inflows on September 18.
That gives the rally another source of demand beyond retail rotation.
Technically SOL also managed to move above important resistance while Bitcoin was reclaiming $80K.
For me the next question is not whether SOL can print another green candle.
It is whether this relative strength survives the next Bitcoin pullback.
If SOL keeps holding above the breakout area while network activity and ETF inflows remain strong then October starts with a much more interesting structure.
But if the activity fades and SOL falls back into its previous range then this could turn out to be another rotation trade.
Right now the data is improving.
The part I would watch most is whether real demand keeps following the price.
302
·
--

Maqola
XRP va Solana va Cardano — qaysi altkoin sentabrda eng yaxshi natija ko‘rsatadi?SOLda momentum bor, lekin XRP va ADA uchun ham joy (salohiyat) mavjud
Bu yerda diqqatimni tortgani qaysi altkoin eng bullish ko‘rinayotgani emas.
So‘nggi bozor harakatidan keyin mana shu uchalasi qanday turlicha o‘zini tutayotgani.
Solana guruh ichida eng kuchlisi bo‘ldi.
Chorshanbadan beri SOL qariyb 16% ga, ADA esa taxminan 14% ga, XRP esa taxminan 11% ga oshdi.
Eng muhimi, SOL avgust o‘rtalaridagi eng yuqorilardan yuqoriga allaqachon chiqib bo‘ldi.
Bu muhim, chunki o‘sha eng yuqorilar Bitcoin orqaga chekingan va ko‘p altkoinlar bozorini pastga tortib ketganidan oldin shakllangan.
XRP va Solana va Cardano — qaysi altkoin sentabrda eng yaxshi natija ko‘rsatadi?
SOLda momentum bor, lekin XRP va ADA uchun ham joy (salohiyat) mavjud
Bu yerda diqqatimni tortgani qaysi altkoin eng bullish ko‘rinayotgani emas.
So‘nggi bozor harakatidan keyin mana shu uchalasi qanday turlicha o‘zini tutayotgani.
Solana guruh ichida eng kuchlisi bo‘ldi.
Chorshanbadan beri SOL qariyb 16% ga, ADA esa taxminan 14% ga, XRP esa taxminan 11% ga oshdi.
Eng muhimi, SOL avgust o‘rtalaridagi eng yuqorilardan yuqoriga allaqachon chiqib bo‘ldi.
Bu muhim, chunki o‘sha eng yuqorilar Bitcoin orqaga chekingan va ko‘p altkoinlar bozorini pastga tortib ketganidan oldin shakllangan.
Bu yerda diqqatimni tortgani qaysi altkoin eng bullish ko‘rinayotgani emas.
So‘nggi bozor harakatidan keyin mana shu uchalasi qanday turlicha o‘zini tutayotgani.
Solana guruh ichida eng kuchlisi bo‘ldi.
Chorshanbadan beri SOL qariyb 16% ga, ADA esa taxminan 14% ga, XRP esa taxminan 11% ga oshdi.
Eng muhimi, SOL avgust o‘rtalaridagi eng yuqorilardan yuqoriga allaqachon chiqib bo‘ldi.
Bu muhim, chunki o‘sha eng yuqorilar Bitcoin orqaga chekingan va ko‘p altkoinlar bozorini pastga tortib ketganidan oldin shakllangan.
169
·
--
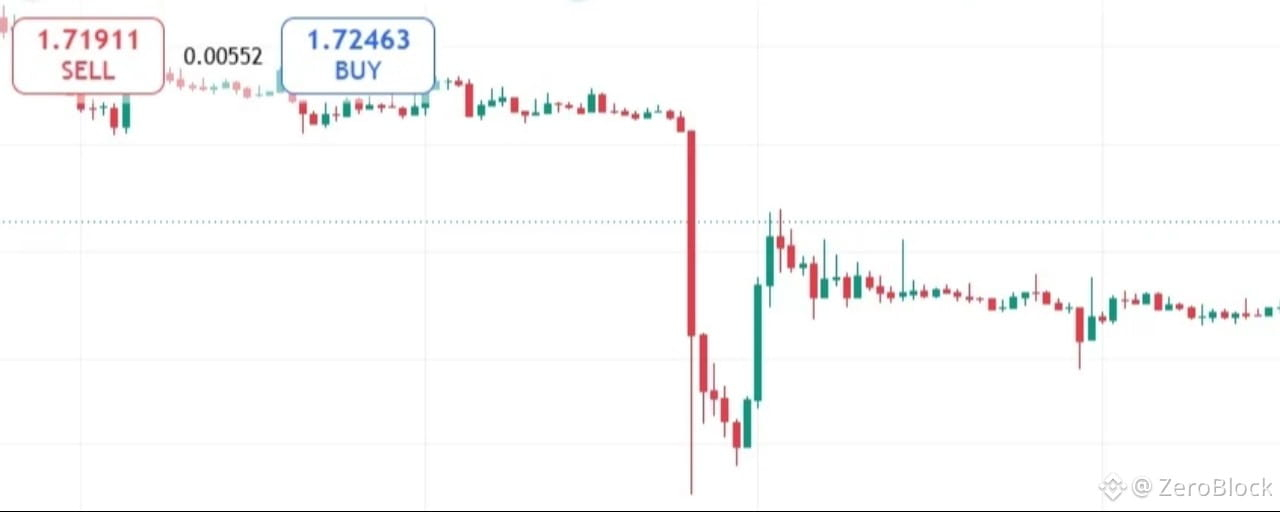
Maqola
MemeCore 35% lik sakrash bilan memecoin’larni yana zo‘r qilib qo‘ydi — Uni nima harakatga keltiryapti?MemeCore bir kunda 35% ga ko‘tarildi va diagramma birinchi qarashdayoq kuchli ko‘rinadi.
M 1,70 dollar atrofida burilib, 1,77 ga yetdi, shu bilan birga uning haftalik o‘sishini ham qariyb 43% gacha uzaytirdi.
Lekin buni faqat shu harakatning o‘zi bilan baholamaslik kerak.
Eng qiziq qismi — kapital qayerdan kelayotgani.
Ochiq foiz 44% ga sakrab, qariyb 25,7 mln dollar atrofida bo‘ldi, hosilaviylar (derivativlar) hajmi esa 91% ga oshib, taxminan 39 mln dollarga yetdi.
Bu treyderlar ishtirokida jiddiy o‘sish.
Bitta yirik platformada Long Short ko‘rsatkichi 1,89 ga yetdi, bu esa treyderlar long (uzoq) pozitsiyalar tomon juda kuchli og‘ib ketayotganini ko‘rsatadi.
MemeCore 35% lik sakrash bilan memecoin’larni yana zo‘r qilib qo‘ydi — Uni nima harakatga keltiryapti?
MemeCore bir kunda 35% ga ko‘tarildi va diagramma birinchi qarashdayoq kuchli ko‘rinadi.
M 1,70 dollar atrofida burilib, 1,77 ga yetdi, shu bilan birga uning haftalik o‘sishini ham qariyb 43% gacha uzaytirdi.
Lekin buni faqat shu harakatning o‘zi bilan baholamaslik kerak.
Eng qiziq qismi — kapital qayerdan kelayotgani.
Ochiq foiz 44% ga sakrab, qariyb 25,7 mln dollar atrofida bo‘ldi, hosilaviylar (derivativlar) hajmi esa 91% ga oshib, taxminan 39 mln dollarga yetdi.
Bu treyderlar ishtirokida jiddiy o‘sish.
Bitta yirik platformada Long Short ko‘rsatkichi 1,89 ga yetdi, bu esa treyderlar long (uzoq) pozitsiyalar tomon juda kuchli og‘ib ketayotganini ko‘rsatadi.
M 1,70 dollar atrofida burilib, 1,77 ga yetdi, shu bilan birga uning haftalik o‘sishini ham qariyb 43% gacha uzaytirdi.
Lekin buni faqat shu harakatning o‘zi bilan baholamaslik kerak.
Eng qiziq qismi — kapital qayerdan kelayotgani.
Ochiq foiz 44% ga sakrab, qariyb 25,7 mln dollar atrofida bo‘ldi, hosilaviylar (derivativlar) hajmi esa 91% ga oshib, taxminan 39 mln dollarga yetdi.
Bu treyderlar ishtirokida jiddiy o‘sish.
Bitta yirik platformada Long Short ko‘rsatkichi 1,89 ga yetdi, bu esa treyderlar long (uzoq) pozitsiyalar tomon juda kuchli og‘ib ketayotganini ko‘rsatadi.
1
238
Ko‘proq kontentni ko‘rish uchun tizimga kiring
Binance Square'da global kriptovalyuta foydalanuvchilariga qo‘shiling
⚡️ Kriptovalyuta haqida eng so‘nggi va foydali ma’lumotlarni oling.
💬 Dunyoning eng yirik kriptovalyuta birjasi tomonidan ishonchli deb topilgan.
👍 Tasdiqlangan mualliflardan haqiqiy tahlillarni kashf eting.
Email / telefon raqami
Trenddagi mavzular
CardanoAddedToX402KitForADAPayments
2 marta koʻrilgan
16 muhokama qilmoqda
#cardanoaddedtox402kitforadapayments
🚨 CARDANO AI TO'LOV STARTAP ZAMONIGA KIRDI! 🤖🔥
$ADA endi rasmiy x402 SDK tarkibida bo‘lib, ilovalar va AI agentlar uchun yangi to‘lov yo‘lagini ochmoqda.
💥 Nima o‘zgardi?
• Ilovalar ADA yoki Cardano’ning native tokenlari yordamida API chaqiriqlari uchun to‘lov qilishlari mumkin
• To‘lovlar bevosita oddiy veb-so‘rovlar orqali amalga oshiriladi
• Hisob (account), API kaliti yoki an’anaviy checkout talab etilmaydi
• Cardano rivojlanayotgan mashina-to-mashina (M2M) to‘lov ekotizimiga qo‘shildi
• x402 fasilitatori Cardano’ning pre-production tarmog‘ida real tranzaksiyani hali ham yakunlab bo‘lgan
Bu $ADA a uchun yangi AI + to‘lovlar amaliyoti haqidagi rivoyatni kuchaytirishi mumkin, chunki avtonom agentlar ma’lumot va onlayn xizmatlar uchun tobora ko‘proq to‘lashga muhtoj bo‘ladi.
⚠️ Mainnet’da qabul qilish va real to‘lov hajmi hali shakllanishi kerak.
🔥 Bu yangi ADA rivoyatining boshlanishimi?
#Cardano #ADA #AI
Faizan Crypto Learner
·0 ta layk
·10 marta koʻrilgan
XRPRises8%
5,644 marta koʻrilgan
361 muhokama qilmoqda
AMDHits$1TrillionMarketCap
4 marta koʻrilgan
7 muhokama qilmoqda