
Night King Official
10.8k Postlar

Night King Official
 Square Verified+
Shikoyat qilish
Foydalanuvchini bloklash
Chief Strategist | Market Flow Analyst | Expert Content Creator | GEN KOL & Holder | High Stakes Trader
337 Kuzatilmoqda
33.4K+ Kuzatuvchilar
12.3K+ Yoqdi
Postlar
Portfel
·
--
O‘suvchi
Tarjimani ko‘rish
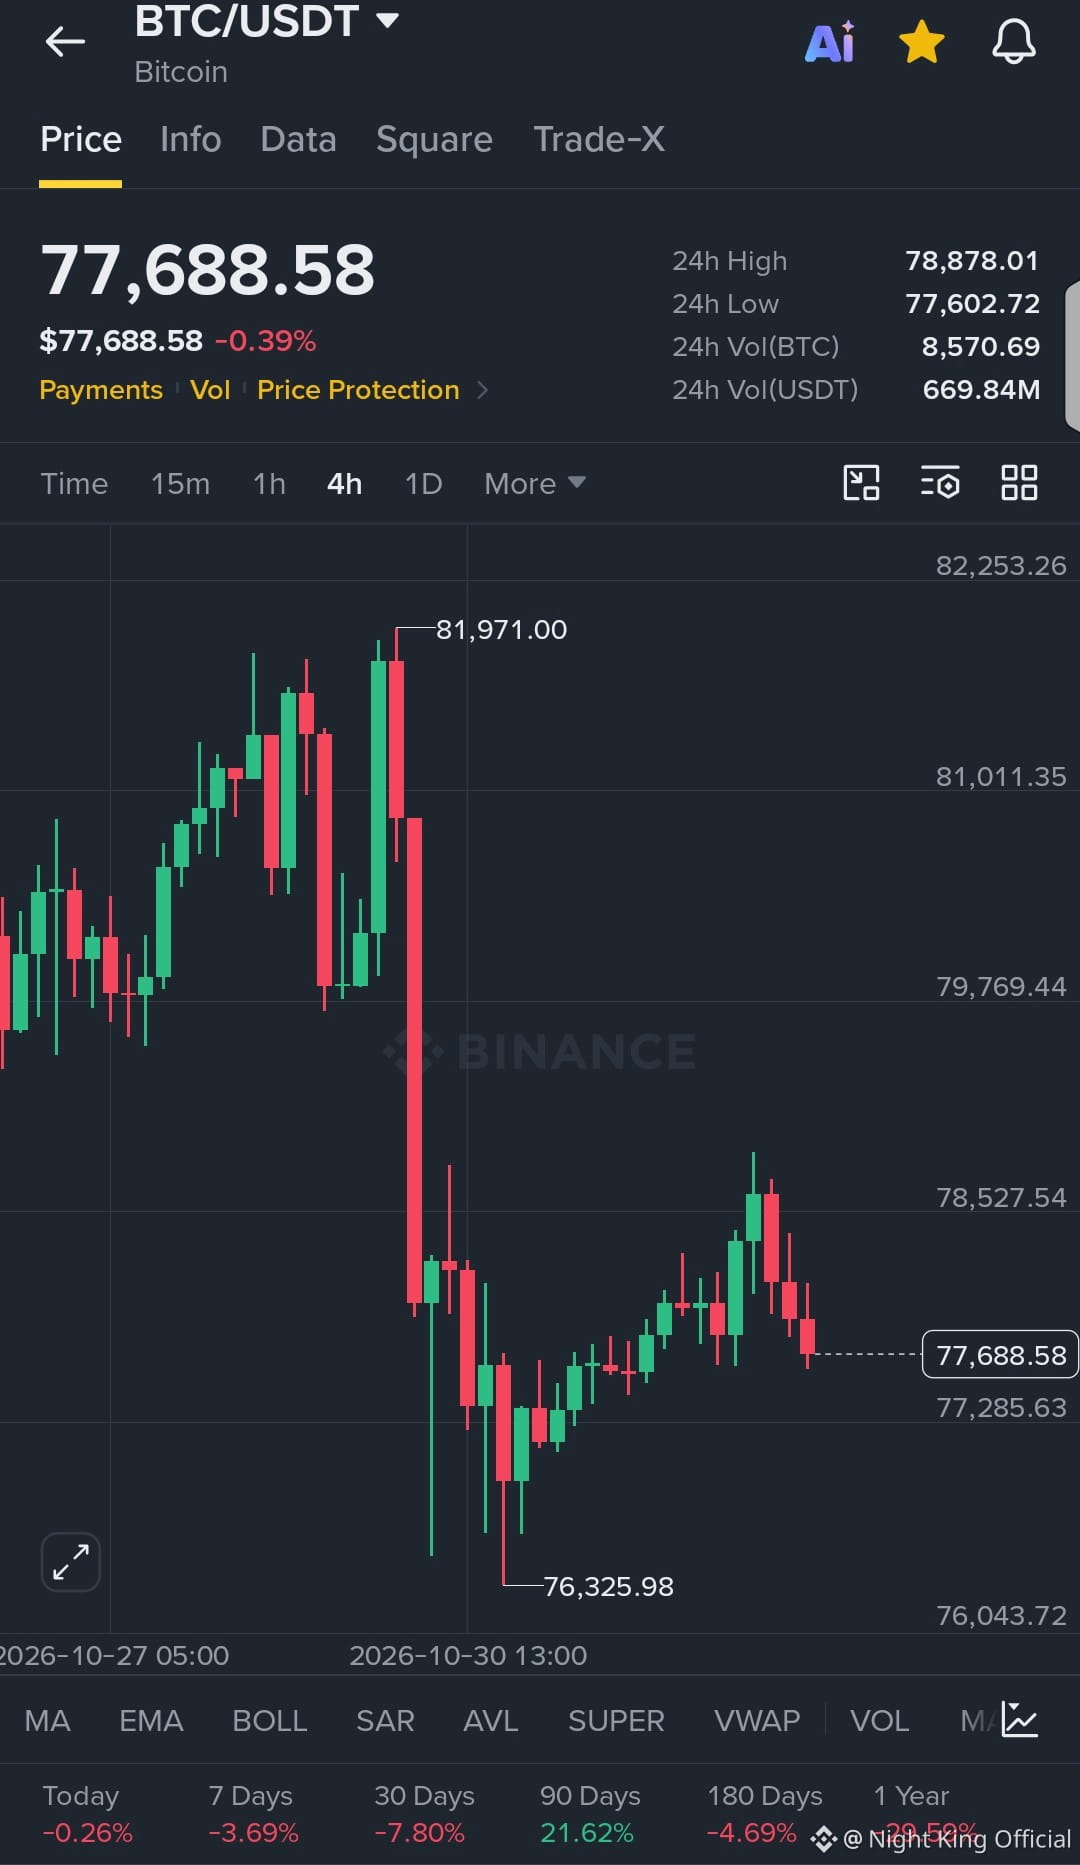
$BTC Signal Update 📊
Action: Long
Entry Range: 77,602.72 - 77,688.58
TP1: 78,527.54
TP2: 79,769.44
TP3: 81,011.35
Stop Loss: 77,285.63
Technical Analysis: Price is currently trading near 77,688.58, holding above the 24h Low of 77,602.72 with visible support levels nearby on the chart.
Engagement Question: Kya $BTC yahan se mazeed ooper jaye ga ya mazeed correction ayegi?
Risk note: Not financial advice. DYOR.
#BTC #Crypto #BinanceSquare #TradingSignals #Bitcoin
{spot}(BTCUSDT)
$BTC Signal Update 📊
Action: Long
Entry Range: 77,602.72 - 77,688.58
TP1: 78,527.54
TP2: 79,769.44
TP3: 81,011.35
Stop Loss: 77,285.63
Technical Analysis: Price is currently trading near 77,688.58, holding above the 24h Low of 77,602.72 with visible support levels nearby on the chart.
Engagement Question: Kya $BTC yahan se mazeed ooper jaye ga ya mazeed correction ayegi?
Risk note: Not financial advice. DYOR.
#BTC #Crypto #BinanceSquare #TradingSignals #Bitcoin
Action: Long
Entry Range: 77,602.72 - 77,688.58
TP1: 78,527.54
TP2: 79,769.44
TP3: 81,011.35
Stop Loss: 77,285.63
Technical Analysis: Price is currently trading near 77,688.58, holding above the 24h Low of 77,602.72 with visible support levels nearby on the chart.
Engagement Question: Kya $BTC yahan se mazeed ooper jaye ga ya mazeed correction ayegi?
Risk note: Not financial advice. DYOR.
#BTC #Crypto #BinanceSquare #TradingSignals #Bitcoin
1
139
·
--
O‘suvchi
Tarjimani ko‘rish
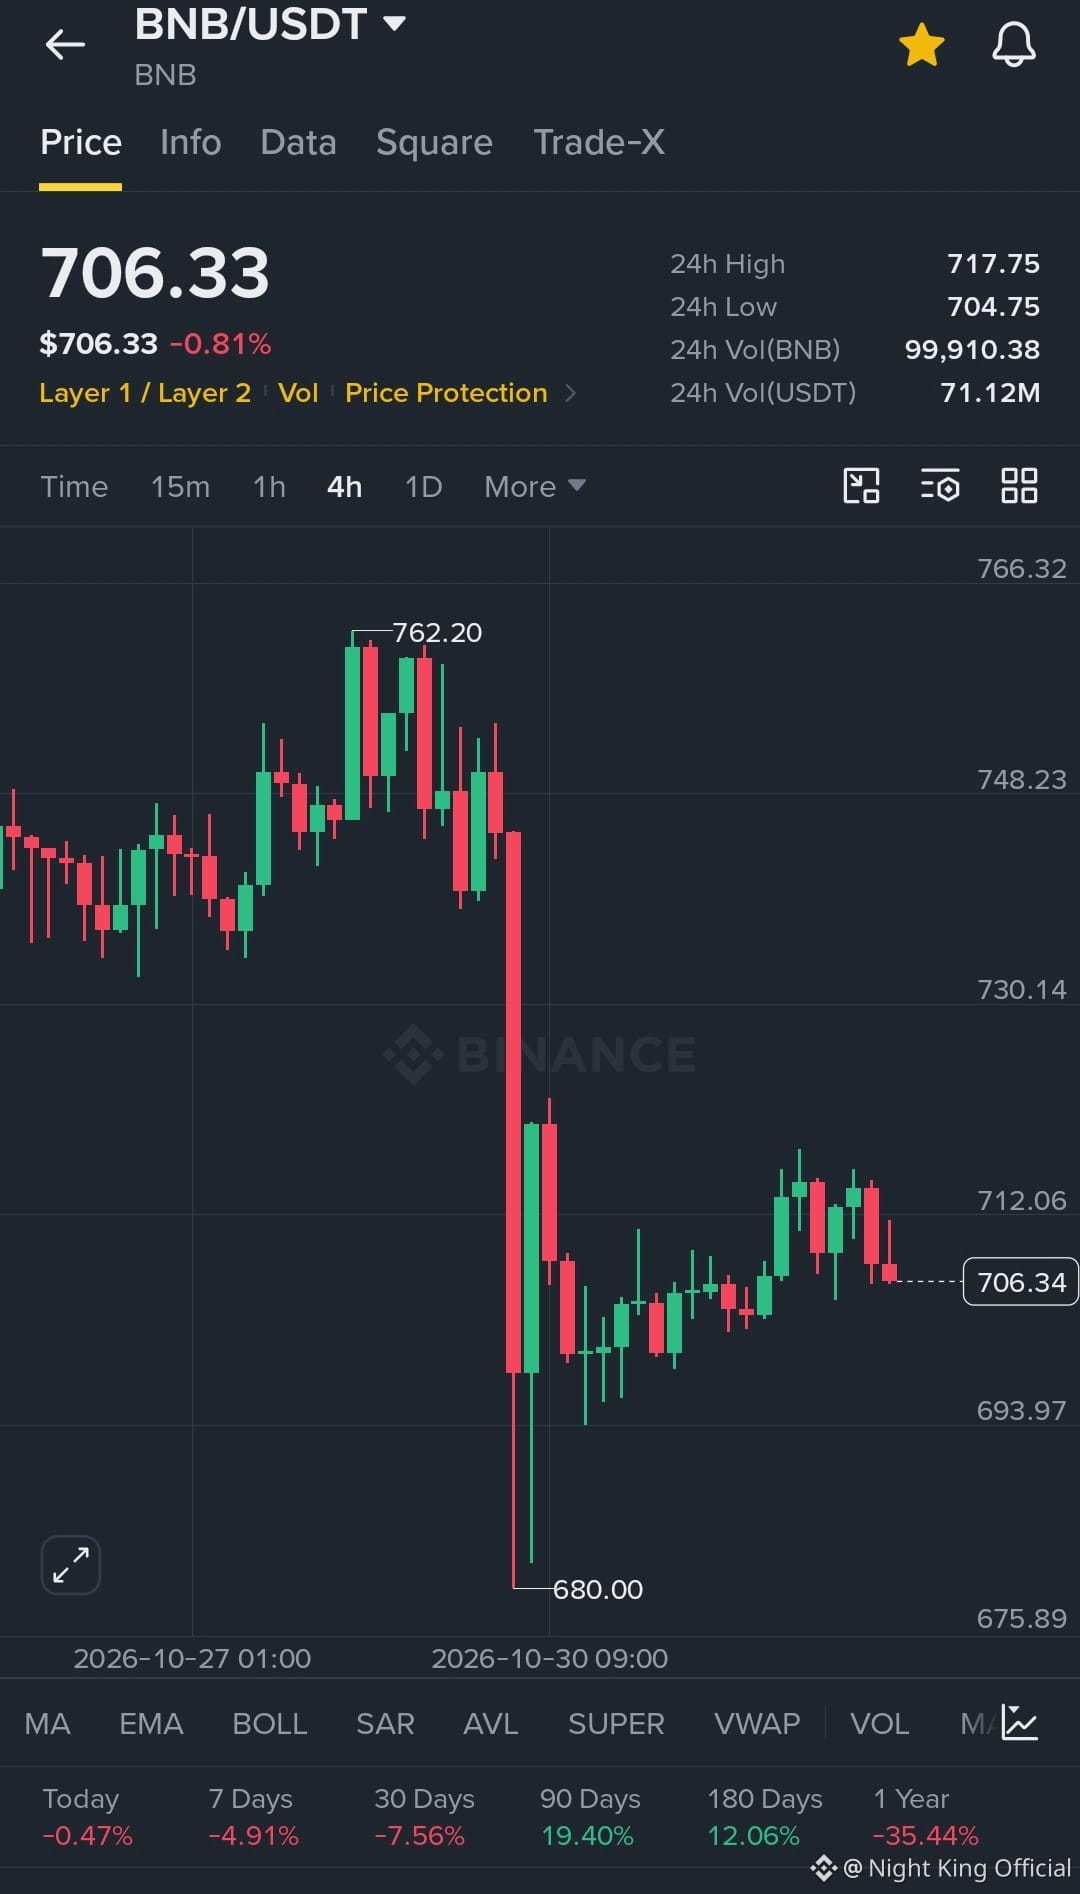
$BNB Testing the 24h Low at 704.75 After a Rejection Near 712.06 🛡️
Plan: Long
Entry Range: 704.75 – 706.34
TP1: 712.06
TP2: 717.75
TP3: 730.14
SL: 4H close below 693.97
Direct take: $BNB is back near the 24h Low of 704.75 after the latest red 4H candles, while the 680.00 low from the earlier flush is still well below, so this level needs to hold before any upside makes sense.
Would you take this dip near 704.75, or wait for a stronger 4H candle first? Tell me your plan.
Not financial advice. DYOR.
#BNB #CryptoTrading #TradePlan #WriteToEarn
{spot}(BNBUSDT)
$BNB Testing the 24h Low at 704.75 After a Rejection Near 712.06 🛡️
Plan: Long
Entry Range: 704.75 – 706.34
TP1: 712.06
TP2: 717.75
TP3: 730.14
SL: 4H close below 693.97
Direct take: $BNB is back near the 24h Low of 704.75 after the latest red 4H candles, while the 680.00 low from the earlier flush is still well below, so this level needs to hold before any upside makes sense.
Would you take this dip near 704.75, or wait for a stronger 4H candle first? Tell me your plan.
Not financial advice. DYOR.
#BNB #CryptoTrading #TradePlan #WriteToEarn
Plan: Long
Entry Range: 704.75 – 706.34
TP1: 712.06
TP2: 717.75
TP3: 730.14
SL: 4H close below 693.97
Direct take: $BNB is back near the 24h Low of 704.75 after the latest red 4H candles, while the 680.00 low from the earlier flush is still well below, so this level needs to hold before any upside makes sense.
Would you take this dip near 704.75, or wait for a stronger 4H candle first? Tell me your plan.
Not financial advice. DYOR.
#BNB #CryptoTrading #TradePlan #WriteToEarn
1
1
260
·
--
O‘suvchi
Tarjimani ko‘rish
💥SURPRISE GIVEAWAY IS LIVE! 🎁
🔥 3,000 RED PACKETS UP FOR GRABS!
Comment "666" to join!
Follow
Repost
Comment "666"
Claim your reward 🎉
⏳ Don't miss out! Your surprise gift is waiting!
💥SURPRISE GIVEAWAY IS LIVE! 🎁
🔥 3,000 RED PACKETS UP FOR GRABS!
Comment "666" to join!
Follow
Repost
Comment "666"
Claim your reward 🎉
⏳ Don't miss out! Your surprise gift is waiting!
🔥 3,000 RED PACKETS UP FOR GRABS!
Comment "666" to join!
Follow
Repost
Comment "666"
Claim your reward 🎉
⏳ Don't miss out! Your surprise gift is waiting!

320
1
22
610
·
--
O‘suvchi
Tarjimani ko‘rish
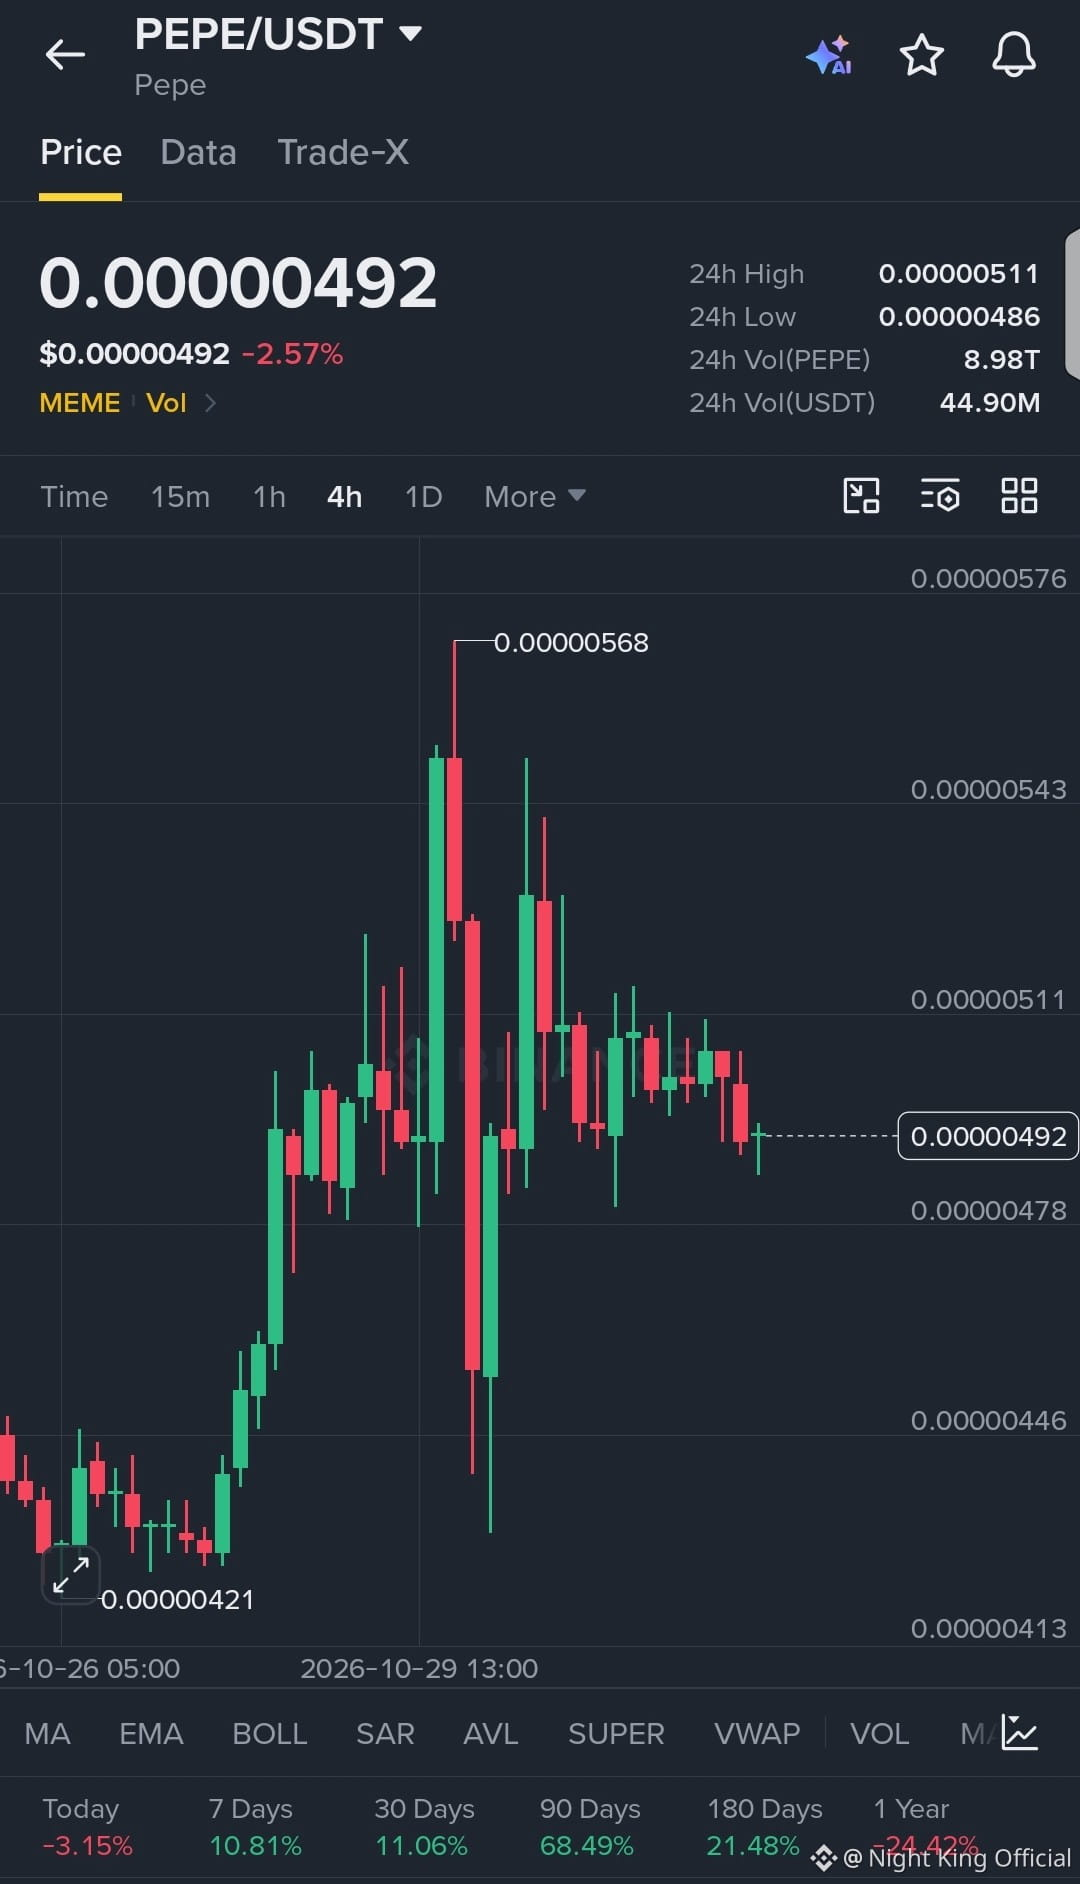
$PEPE Drifting Lower Under the 0.00000511 24h High 📉
Bias: Short
Entry Range: 0.00000492 – 0.00000511
TP1: 0.00000486
TP2: 0.00000478
TP3: 0.00000446
SL: 0.00000543
Chart check: After the 0.00000568 swing high, $PEPE has been printing smaller 4H candles and now trades below the 0.00000511 24h High, near the 24h Low at 0.00000486, with no clear bounce yet.
Does the 24h Low at 0.00000486 give way next, or is a rebound coming first? Drop your view below.
Not financial advice. DYOR.
#PEPE #MemeCoins #CryptoSignals #BinanceSquare #WriteToEarn
{spot}(PEPEUSDT)
$PEPE Drifting Lower Under the 0.00000511 24h High 📉
Bias: Short
Entry Range: 0.00000492 – 0.00000511
TP1: 0.00000486
TP2: 0.00000478
TP3: 0.00000446
SL: 0.00000543
Chart check: After the 0.00000568 swing high, $PEPE has been printing smaller 4H candles and now trades below the 0.00000511 24h High, near the 24h Low at 0.00000486, with no clear bounce yet.
Does the 24h Low at 0.00000486 give way next, or is a rebound coming first? Drop your view below.
Not financial advice. DYOR.
#PEPE #MemeCoins #CryptoSignals #BinanceSquare #WriteToEarn
Bias: Short
Entry Range: 0.00000492 – 0.00000511
TP1: 0.00000486
TP2: 0.00000478
TP3: 0.00000446
SL: 0.00000543
Chart check: After the 0.00000568 swing high, $PEPE has been printing smaller 4H candles and now trades below the 0.00000511 24h High, near the 24h Low at 0.00000486, with no clear bounce yet.
Does the 24h Low at 0.00000486 give way next, or is a rebound coming first? Drop your view below.
Not financial advice. DYOR.
#PEPE #MemeCoins #CryptoSignals #BinanceSquare #WriteToEarn
1
291
·
--
O‘suvchi
Tarjimani ko‘rish
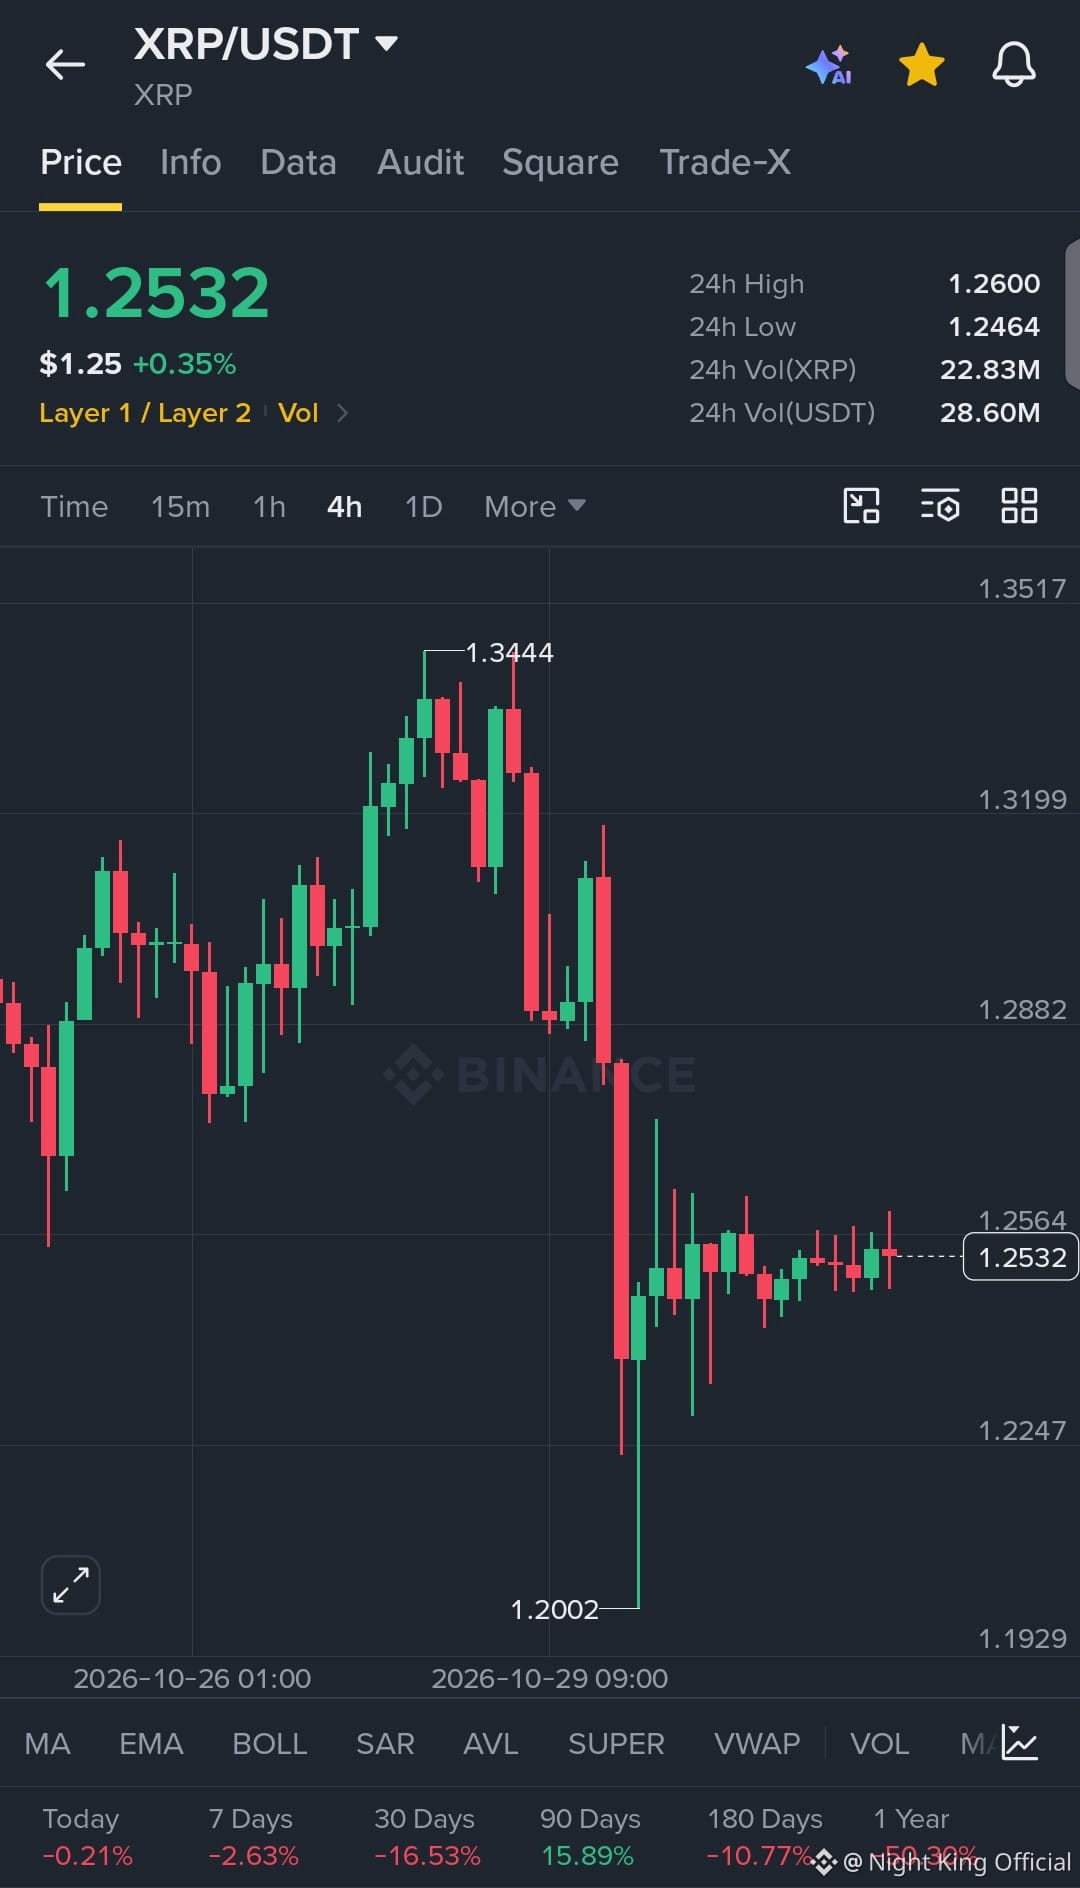
$XRP Flat Near 1.2532 After the Big 4H Drop 🧊
Setup: Short
Entry Range: 1.2532 – 1.2564
TP1: 1.2464
TP2: 1.2247
TP3: 1.2002
SL: 1.2600
Market read: $XRP fell hard from the 1.3444 swing high, wicked down to 1.2002, and has since traded sideways in small 4H candles between the 24h Low at 1.2464 and the 24h High at 1.2600.
Is this a pause before a break lower, or are buyers quietly building a base? Share what you think.
Not financial advice. DYOR.
#XRP #Ripple #CryptoSignals #ShortSetup #WriteToEarn
$XRP Flat Near 1.2532 After the Big 4H Drop 🧊
Setup: Short
Entry Range: 1.2532 – 1.2564
TP1: 1.2464
TP2: 1.2247
TP3: 1.2002
SL: 1.2600
Market read: $XRP fell hard from the 1.3444 swing high, wicked down to 1.2002, and has since traded sideways in small 4H candles between the 24h Low at 1.2464 and the 24h High at 1.2600.
Is this a pause before a break lower, or are buyers quietly building a base? Share what you think.
Not financial advice. DYOR.
#XRP #Ripple #CryptoSignals #ShortSetup #WriteToEarn
Setup: Short
Entry Range: 1.2532 – 1.2564
TP1: 1.2464
TP2: 1.2247
TP3: 1.2002
SL: 1.2600
Market read: $XRP fell hard from the 1.3444 swing high, wicked down to 1.2002, and has since traded sideways in small 4H candles between the 24h Low at 1.2464 and the 24h High at 1.2600.
Is this a pause before a break lower, or are buyers quietly building a base? Share what you think.
Not financial advice. DYOR.
#XRP #Ripple #CryptoSignals #ShortSetup #WriteToEarn
1
174
·
--
O‘suvchi
Tarjimani ko‘rish
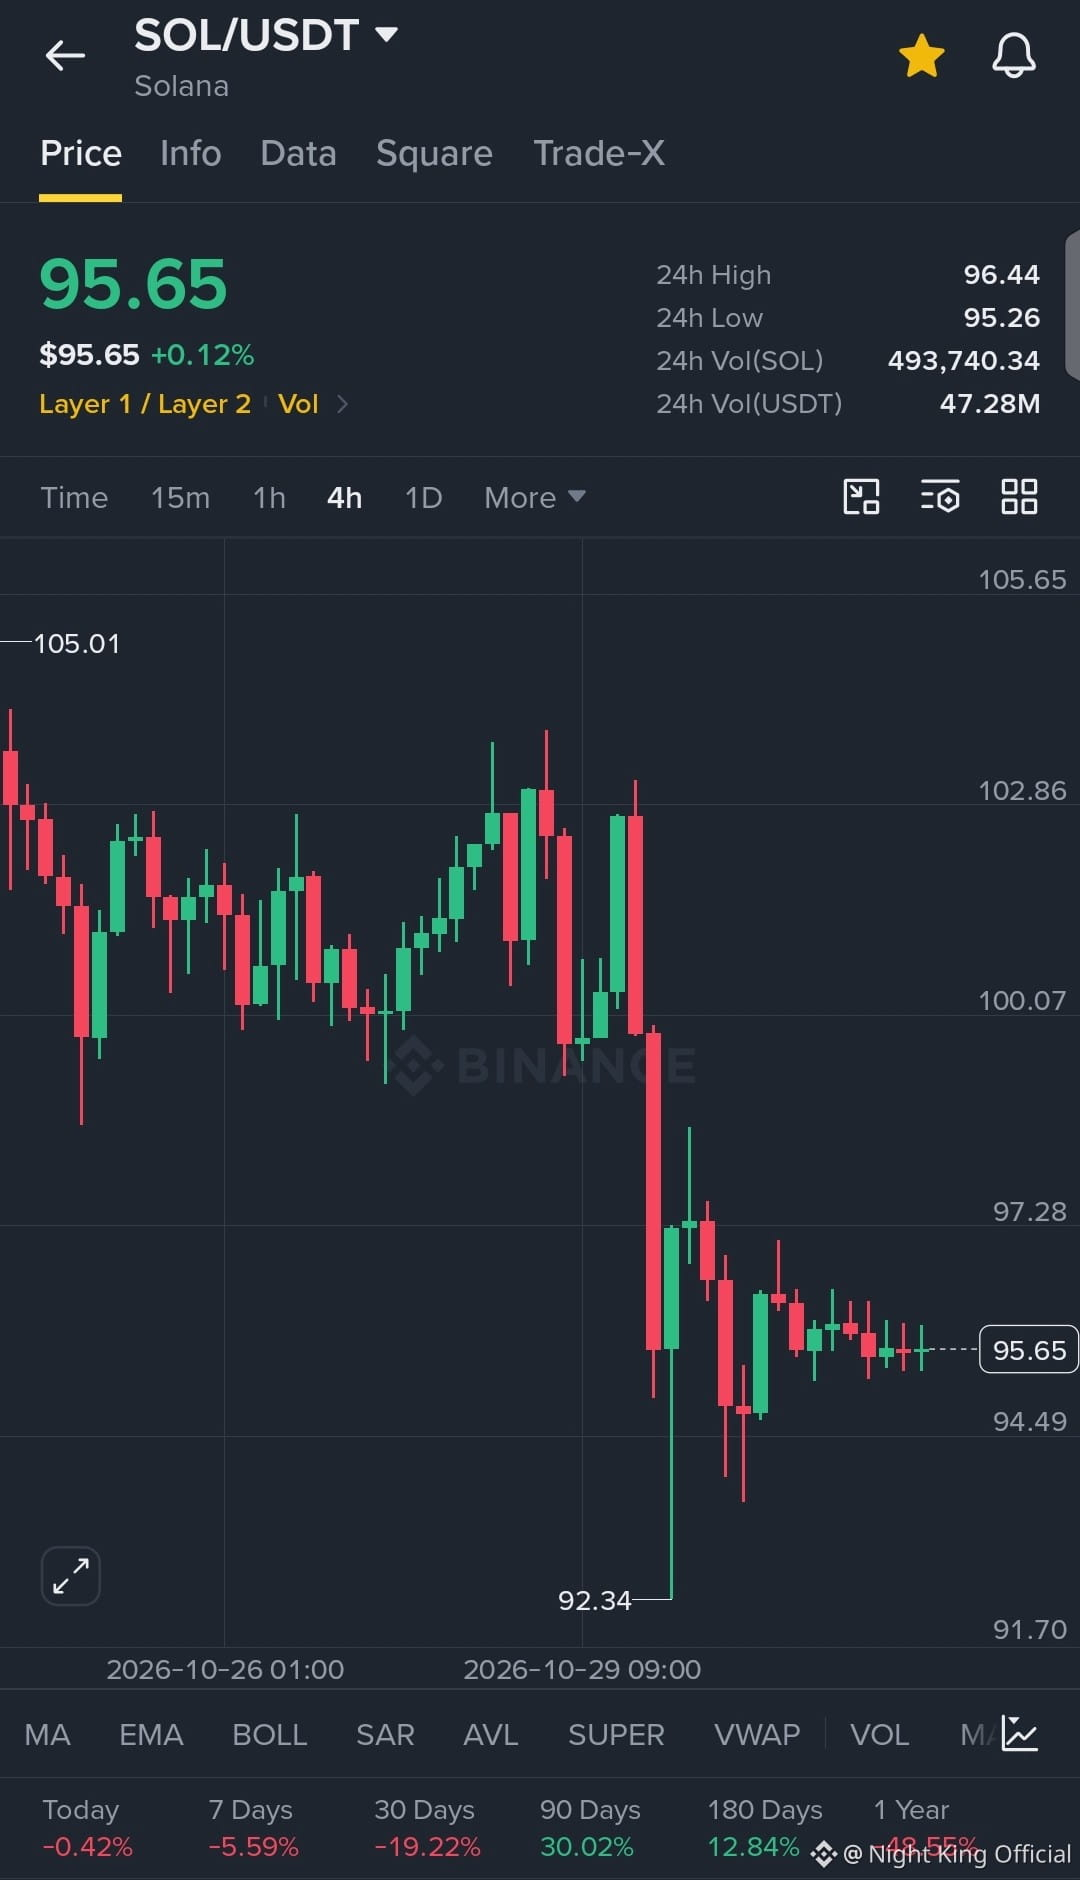
Solana Holds Its Ground After the Sell-Off 📉
$SOL USDT 4H
Action: Long
Entry Range: 95.26 – 95.65
TP1: 97.28
TP2: 100.07
TP3: 102.86
SL: 4H close below 94.49
The 4H candles show a sharp drop to the 92.34 low, followed by small-bodied candles ranging near the 24h Low of 95.26 and 24h High of 96.44.
If SOL reclaims 97.28, would you expect 100.07 to be the next stop, or does the range hold it back?
Not financial advice. DYOR.
#SOL #Solana #CryptoSignals #BinanceSquare
Solana Holds Its Ground After the Sell-Off 📉
$SOL USDT 4H
Action: Long
Entry Range: 95.26 – 95.65
TP1: 97.28
TP2: 100.07
TP3: 102.86
SL: 4H close below 94.49
The 4H candles show a sharp drop to the 92.34 low, followed by small-bodied candles ranging near the 24h Low of 95.26 and 24h High of 96.44.
If SOL reclaims 97.28, would you expect 100.07 to be the next stop, or does the range hold it back?
Not financial advice. DYOR.
#SOL #Solana #CryptoSignals #BinanceSquare
$SOL USDT 4H
Action: Long
Entry Range: 95.26 – 95.65
TP1: 97.28
TP2: 100.07
TP3: 102.86
SL: 4H close below 94.49
The 4H candles show a sharp drop to the 92.34 low, followed by small-bodied candles ranging near the 24h Low of 95.26 and 24h High of 96.44.
If SOL reclaims 97.28, would you expect 100.07 to be the next stop, or does the range hold it back?
Not financial advice. DYOR.
#SOL #Solana #CryptoSignals #BinanceSquare
244
·
--
O‘suvchi
Tarjimani ko‘rish
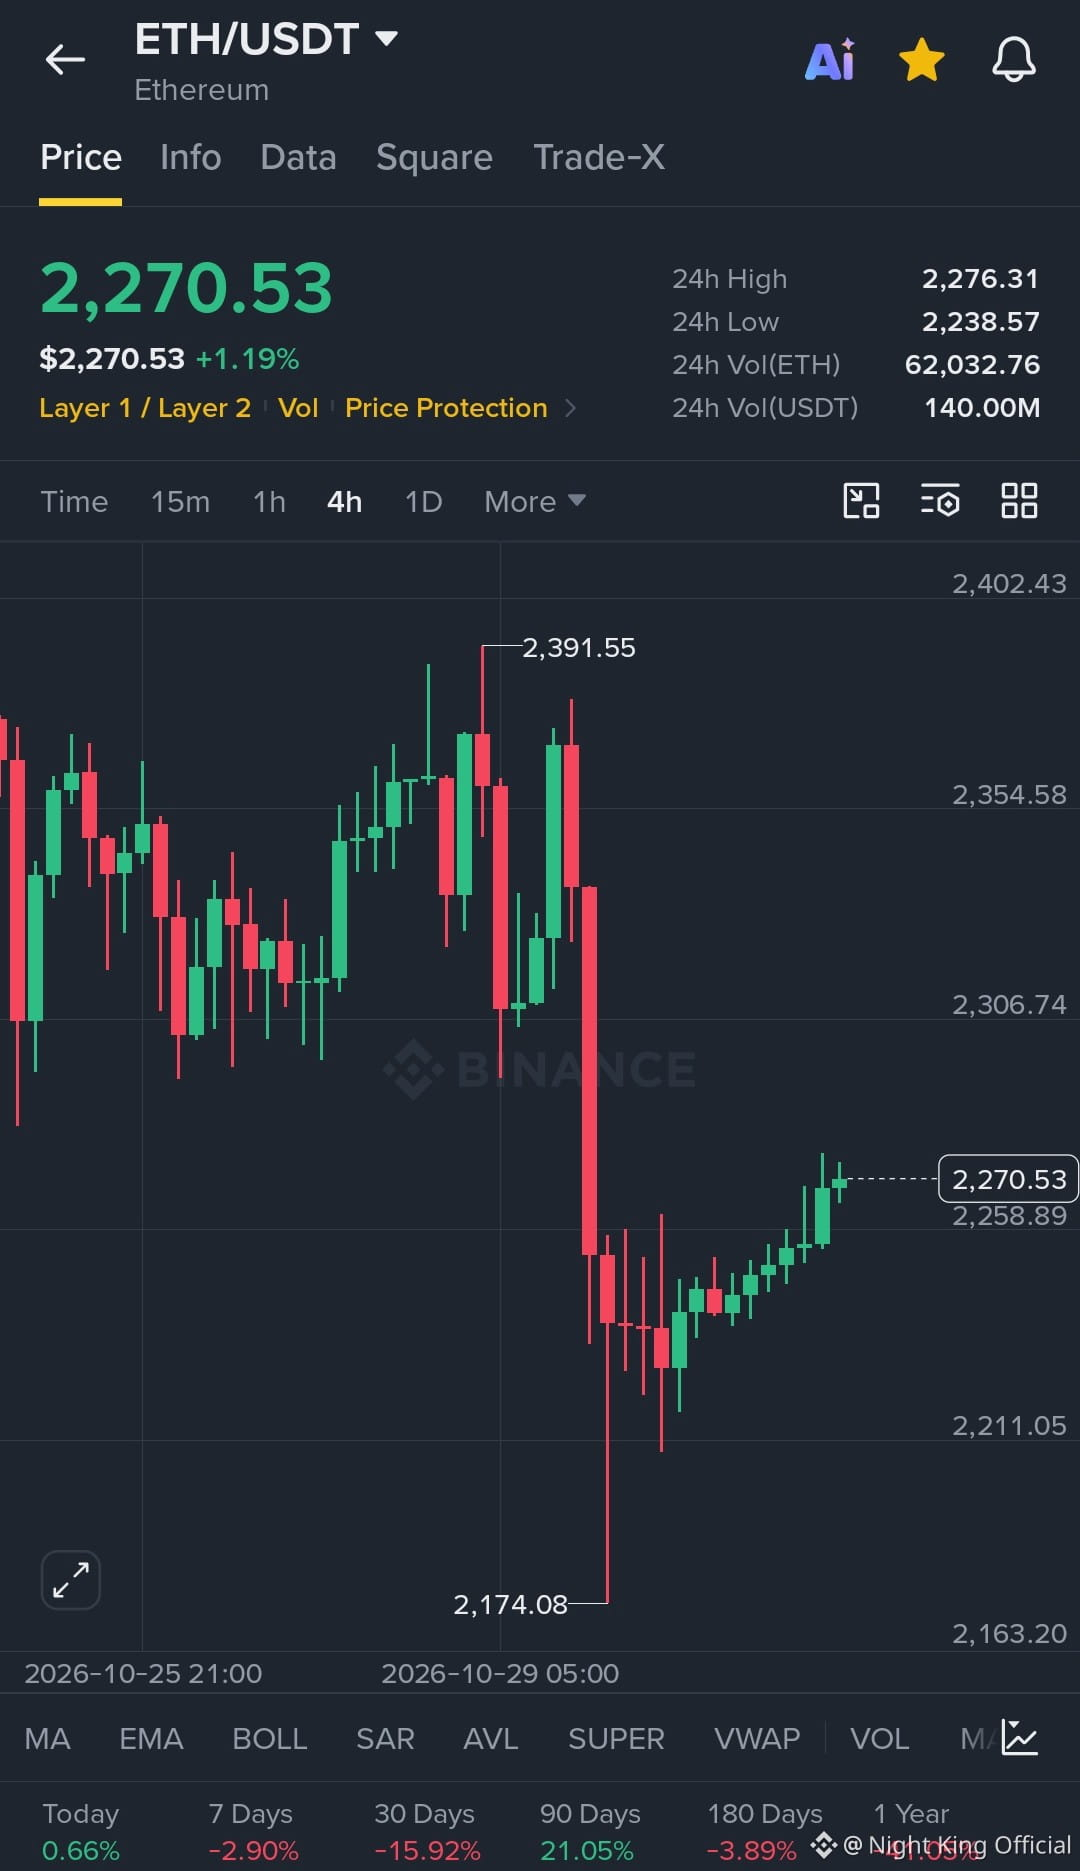
$ETH Recovery Holds Above 2,258.89 After the 2,174.08 Wick 🌱
Direction: Long
Entry Range: 2,258.89 – 2,270.53
TP1: 2,306.74
TP2: 2,354.58
TP3: 2,391.55
SL: 4H close below 2,238.57
Technical view: Following the large red 4H candle that wicked down to 2,174.08, $ETH has printed mostly green 4H candles and is trading near the 24h High of 2,276.31, but it is still below the 2,391.55 swing high.
Which level matters more here, 2,276.31 or 2,306.74? Tell me which one you're watching.
Not financial advice. DYOR.
#ETH #4HAnalysis #CryptoSignals #WriteToEarn
{future}(ETHUSDT)
$ETH Recovery Holds Above 2,258.89 After the 2,174.08 Wick 🌱
Direction: Long
Entry Range: 2,258.89 – 2,270.53
TP1: 2,306.74
TP2: 2,354.58
TP3: 2,391.55
SL: 4H close below 2,238.57
Technical view: Following the large red 4H candle that wicked down to 2,174.08, $ETH has printed mostly green 4H candles and is trading near the 24h High of 2,276.31, but it is still below the 2,391.55 swing high.
Which level matters more here, 2,276.31 or 2,306.74? Tell me which one you're watching.
Not financial advice. DYOR.
#ETH #4HAnalysis #CryptoSignals #WriteToEarn
Direction: Long
Entry Range: 2,258.89 – 2,270.53
TP1: 2,306.74
TP2: 2,354.58
TP3: 2,391.55
SL: 4H close below 2,238.57
Technical view: Following the large red 4H candle that wicked down to 2,174.08, $ETH has printed mostly green 4H candles and is trading near the 24h High of 2,276.31, but it is still below the 2,391.55 swing high.
Which level matters more here, 2,276.31 or 2,306.74? Tell me which one you're watching.
Not financial advice. DYOR.
#ETH #4HAnalysis #CryptoSignals #WriteToEarn
2
312
·
--
O‘suvchi
Tarjimani ko‘rish
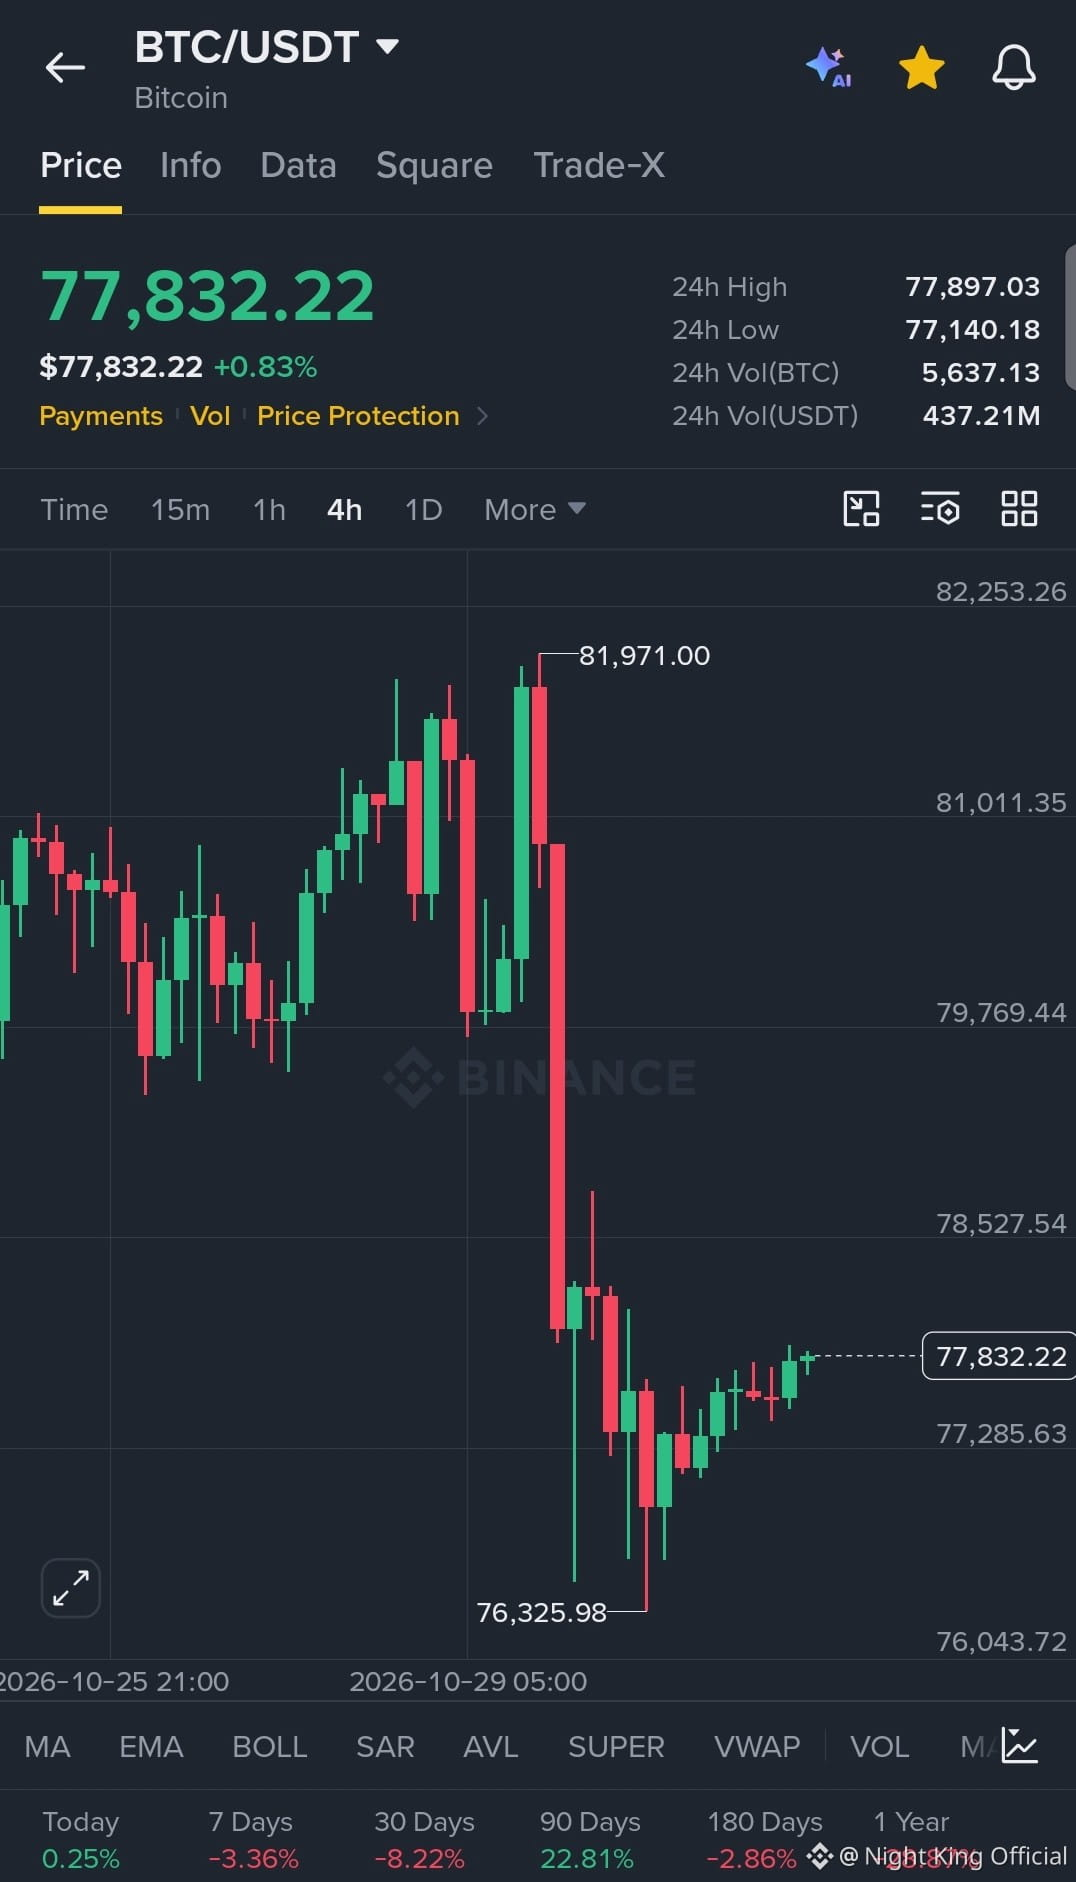
$BTC Climbing Back Step by Step From 76,325.98 🚀
Side: Long
Entry: 77,285.63 – 77,832.22
TP1: 78,527.54
TP2: 79,769.44
TP3: 81,011.35
SL: 4H close below 77,140.18
Momentum check: after the sharp drop from the 81,971.00 swing high, $BTC has printed a run of rising 4H candles and now sits near the 24h High of 77,897.03, though it is still far below the swing high.
Can this recovery keep climbing toward 78,527.54, or does it stall here? Tell me what you see.
Not financial advice. DYOR.
#BTC #CryptoMomentum #BinanceSquare #WriteToEarn
{spot}(BTCUSDT)
$BTC Climbing Back Step by Step From 76,325.98 🚀
Side: Long
Entry: 77,285.63 – 77,832.22
TP1: 78,527.54
TP2: 79,769.44
TP3: 81,011.35
SL: 4H close below 77,140.18
Momentum check: after the sharp drop from the 81,971.00 swing high, $BTC has printed a run of rising 4H candles and now sits near the 24h High of 77,897.03, though it is still far below the swing high.
Can this recovery keep climbing toward 78,527.54, or does it stall here? Tell me what you see.
Not financial advice. DYOR.
#BTC #CryptoMomentum #BinanceSquare #WriteToEarn
Side: Long
Entry: 77,285.63 – 77,832.22
TP1: 78,527.54
TP2: 79,769.44
TP3: 81,011.35
SL: 4H close below 77,140.18
Momentum check: after the sharp drop from the 81,971.00 swing high, $BTC has printed a run of rising 4H candles and now sits near the 24h High of 77,897.03, though it is still far below the swing high.
Can this recovery keep climbing toward 78,527.54, or does it stall here? Tell me what you see.
Not financial advice. DYOR.
#BTC #CryptoMomentum #BinanceSquare #WriteToEarn
2
142
·
--
O‘suvchi
Tarjimani ko‘rish
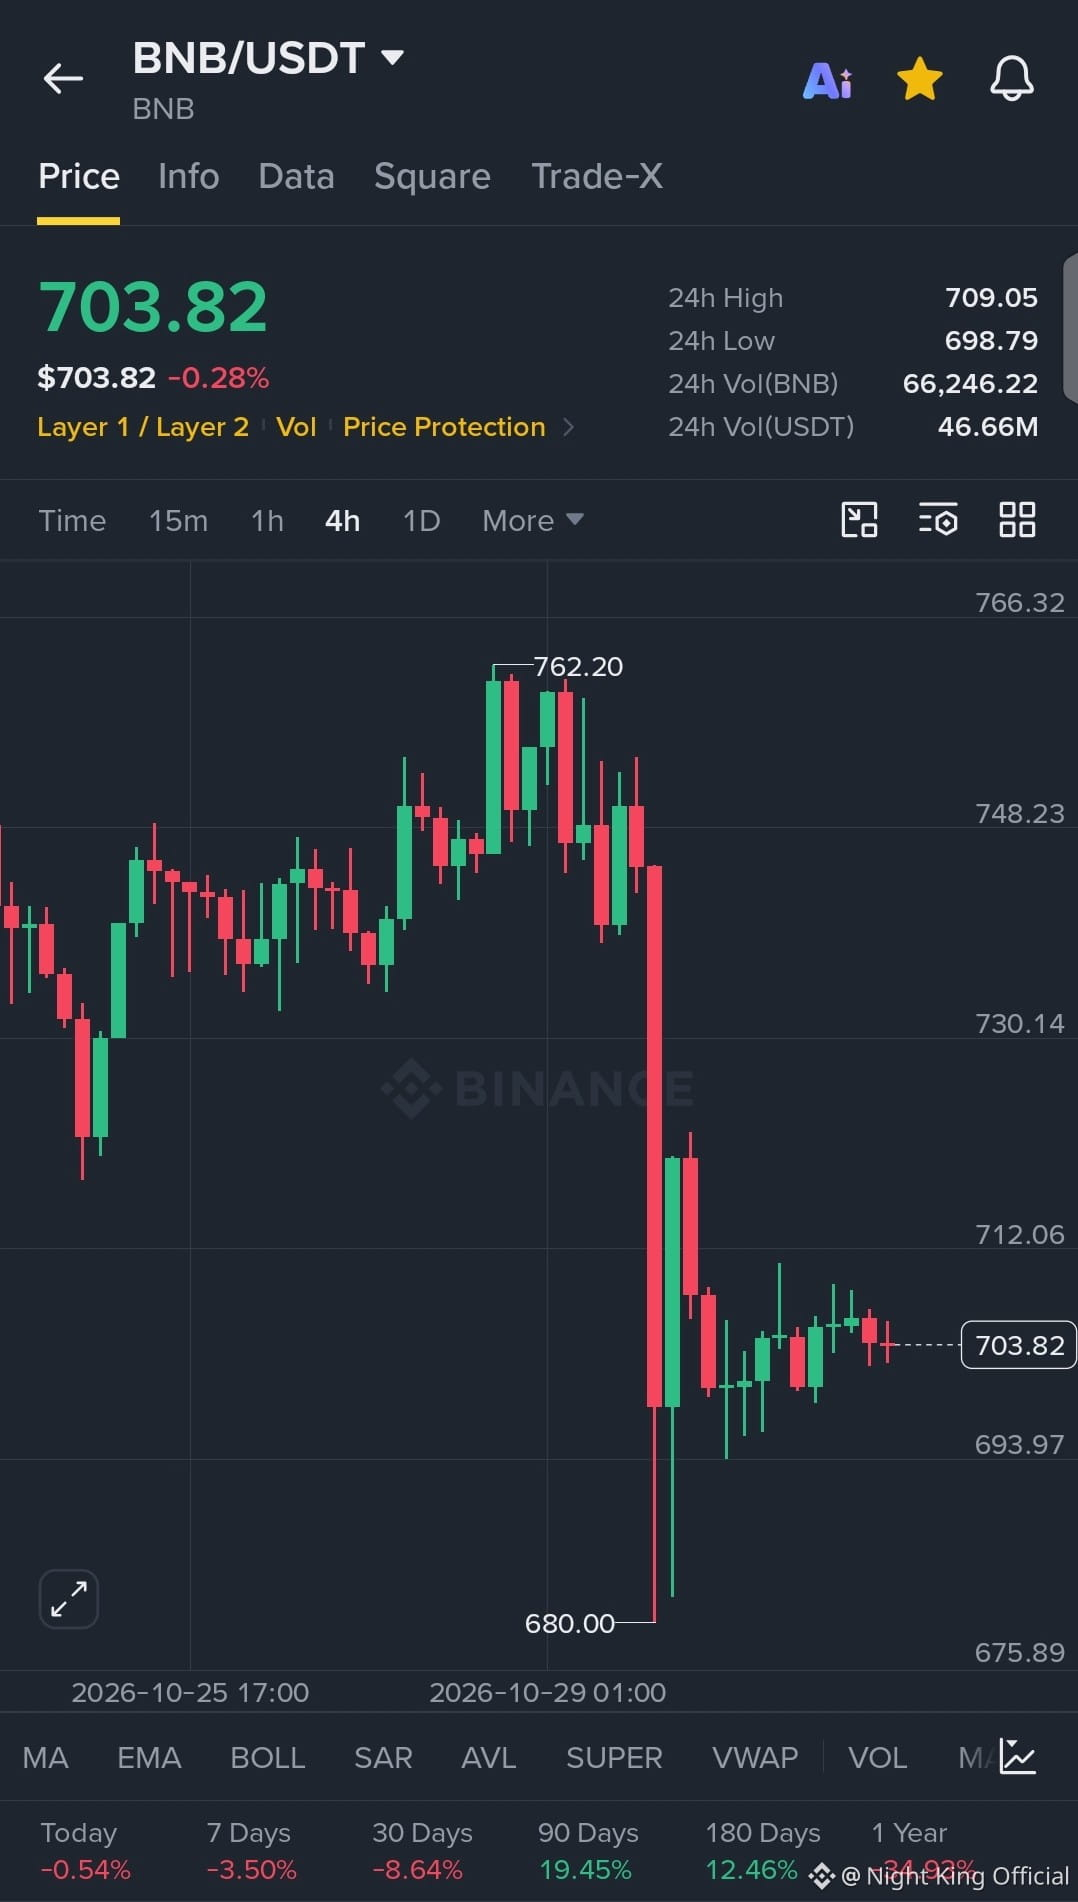
$BNB Consolidating Above 693.97 After the 680.00 Dip 🔍
Call: Long
Buy Zone: 698.79 – 703.82
TP1: 709.05
TP2: 712.06
TP3: 730.14
SL: 4H close below 693.97
Chart note: Since the big red 4H candle that wicked down to 680.00, $BNB has printed smaller 4H candles between 693.97 and 712.06, which looks like consolidation rather than a confirmed breakout.
Is this tight range building up for a move higher, or are traders waiting for a clearer signal? Comment your take.
Not financial advice. DYOR.
#BNB #CryptoAnalysis #SwingTrade #WriteToEarn
{future}(BNBUSDT)
$BNB Consolidating Above 693.97 After the 680.00 Dip 🔍
Call: Long
Buy Zone: 698.79 – 703.82
TP1: 709.05
TP2: 712.06
TP3: 730.14
SL: 4H close below 693.97
Chart note: Since the big red 4H candle that wicked down to 680.00, $BNB has printed smaller 4H candles between 693.97 and 712.06, which looks like consolidation rather than a confirmed breakout.
Is this tight range building up for a move higher, or are traders waiting for a clearer signal? Comment your take.
Not financial advice. DYOR.
#BNB #CryptoAnalysis #SwingTrade #WriteToEarn
Call: Long
Buy Zone: 698.79 – 703.82
TP1: 709.05
TP2: 712.06
TP3: 730.14
SL: 4H close below 693.97
Chart note: Since the big red 4H candle that wicked down to 680.00, $BNB has printed smaller 4H candles between 693.97 and 712.06, which looks like consolidation rather than a confirmed breakout.
Is this tight range building up for a move higher, or are traders waiting for a clearer signal? Comment your take.
Not financial advice. DYOR.
#BNB #CryptoAnalysis #SwingTrade #WriteToEarn
2
281
·
--
O‘suvchi
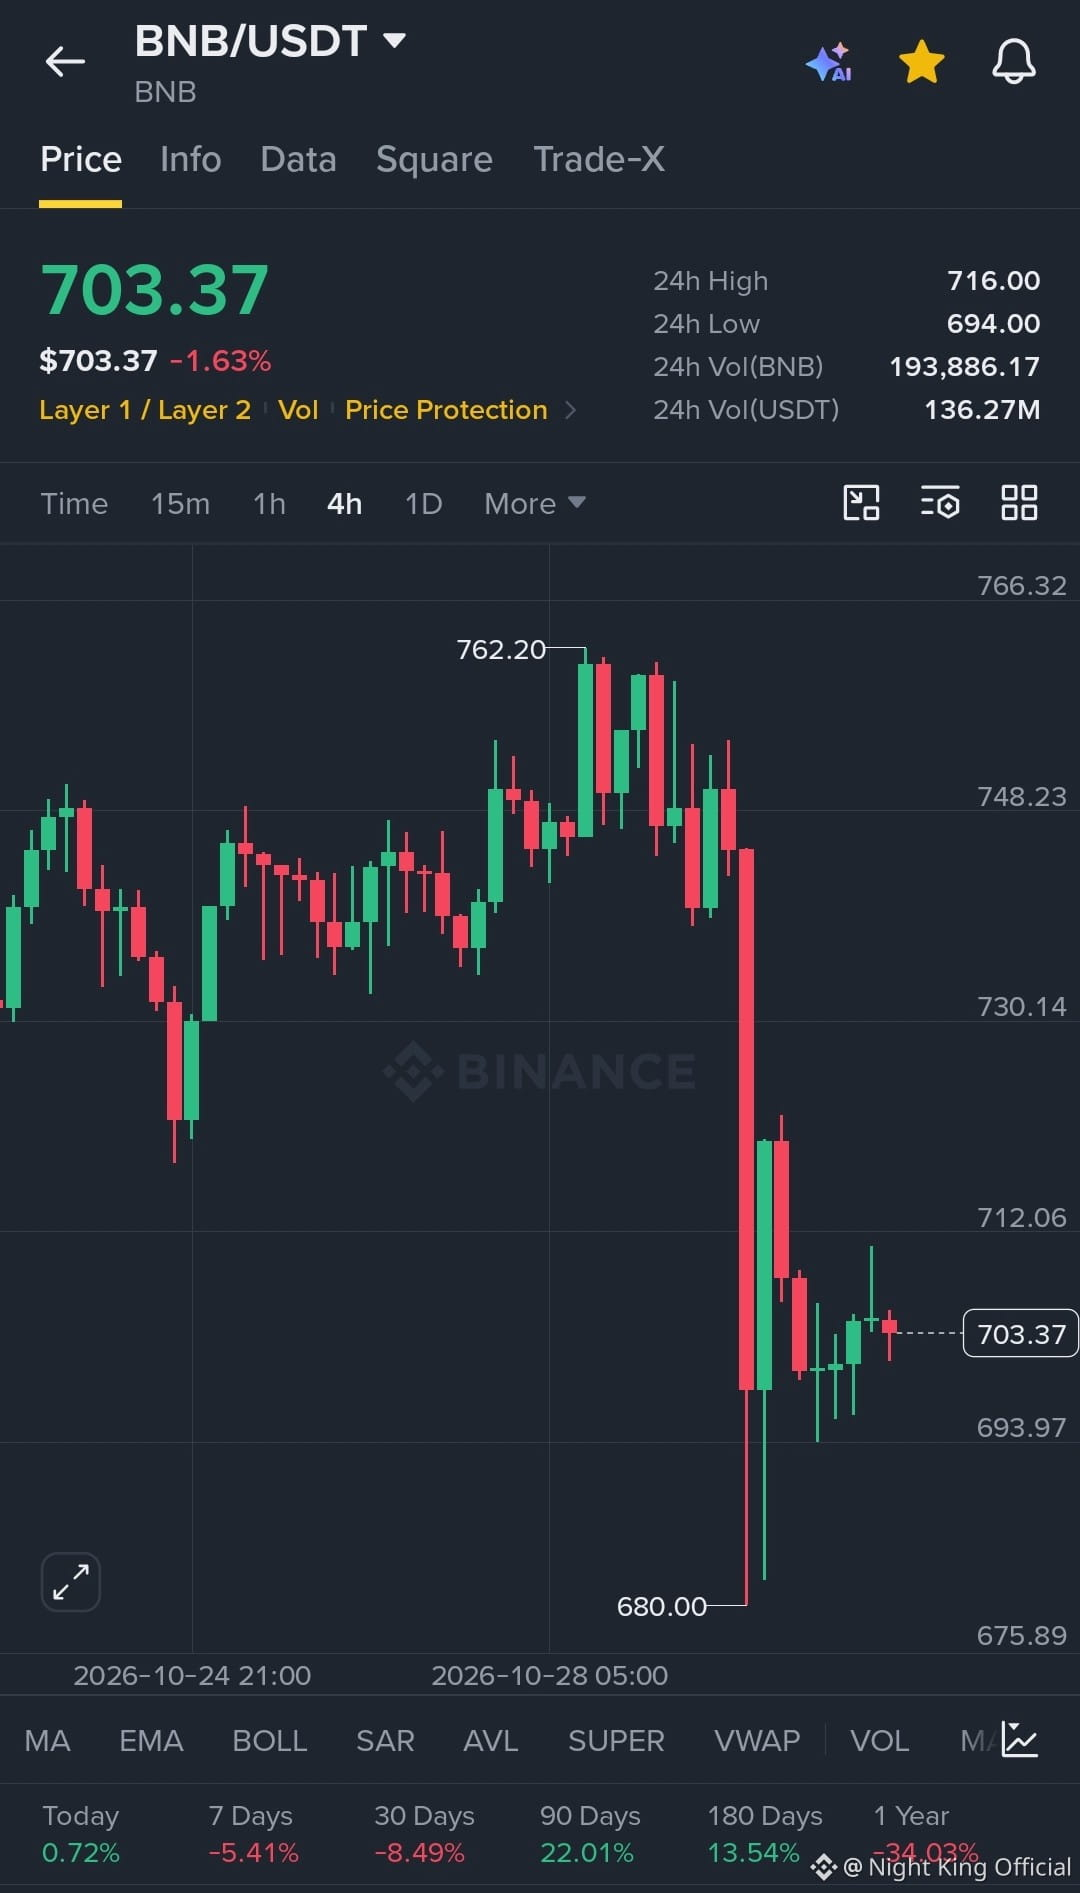
$BNB 716.00 dan pastda qolib ketdi, sotuvchilar hali ham faol 🧭
Savdo: Qisqa pozitsiya
Kirish diapazoni: 703.37 – 712.06
TP1: 693.97
TP2: 680.00
TP3: 675.89
SL: 716.00 (24 soatlik maksimum)
Vaziyatga bevosita nazar: 762.20 dagi mahalliy maksimumdan keyin 4H grafigida keskin pasayish kuzatildi. $BNB 24 soatlik minimum bo‘lgan 694.00 va 24 soatlik maksimum bo‘lgan 716.00 oralig‘idagi tor diapazonda yonlama harakatlanmoqda va 712.06 darajasini qayta egallay olmadi.
Bu safar 694.00 darajasi buziladimi yoki narx shu diapazonda qoladimi? Sizning fikringiz qanday?
Bu moliyaviy maslahat emas. O‘zingiz izlaning.
#BNB #ShortSetup #CryptoTrading #WriteToEarn
{future}(BNBUSDT)
$BNB 716.00 dan pastda qolib ketdi, sotuvchilar hali ham faol 🧭
Savdo: Qisqa pozitsiya
Kirish diapazoni: 703.37 – 712.06
TP1: 693.97
TP2: 680.00
TP3: 675.89
SL: 716.00 (24 soatlik maksimum)
Vaziyatga bevosita nazar: 762.20 dagi mahalliy maksimumdan keyin 4H grafigida keskin pasayish kuzatildi. $BNB 24 soatlik minimum bo‘lgan 694.00 va 24 soatlik maksimum bo‘lgan 716.00 oralig‘idagi tor diapazonda yonlama harakatlanmoqda va 712.06 darajasini qayta egallay olmadi.
Bu safar 694.00 darajasi buziladimi yoki narx shu diapazonda qoladimi? Sizning fikringiz qanday?
Bu moliyaviy maslahat emas. O‘zingiz izlaning.
#BNB #ShortSetup #CryptoTrading #WriteToEarn
Savdo: Qisqa pozitsiya
Kirish diapazoni: 703.37 – 712.06
TP1: 693.97
TP2: 680.00
TP3: 675.89
SL: 716.00 (24 soatlik maksimum)
Vaziyatga bevosita nazar: 762.20 dagi mahalliy maksimumdan keyin 4H grafigida keskin pasayish kuzatildi. $BNB 24 soatlik minimum bo‘lgan 694.00 va 24 soatlik maksimum bo‘lgan 716.00 oralig‘idagi tor diapazonda yonlama harakatlanmoqda va 712.06 darajasini qayta egallay olmadi.
Bu safar 694.00 darajasi buziladimi yoki narx shu diapazonda qoladimi? Sizning fikringiz qanday?
Bu moliyaviy maslahat emas. O‘zingiz izlaning.
#BNB #ShortSetup #CryptoTrading #WriteToEarn
1
2
242
·
--
O‘suvchi
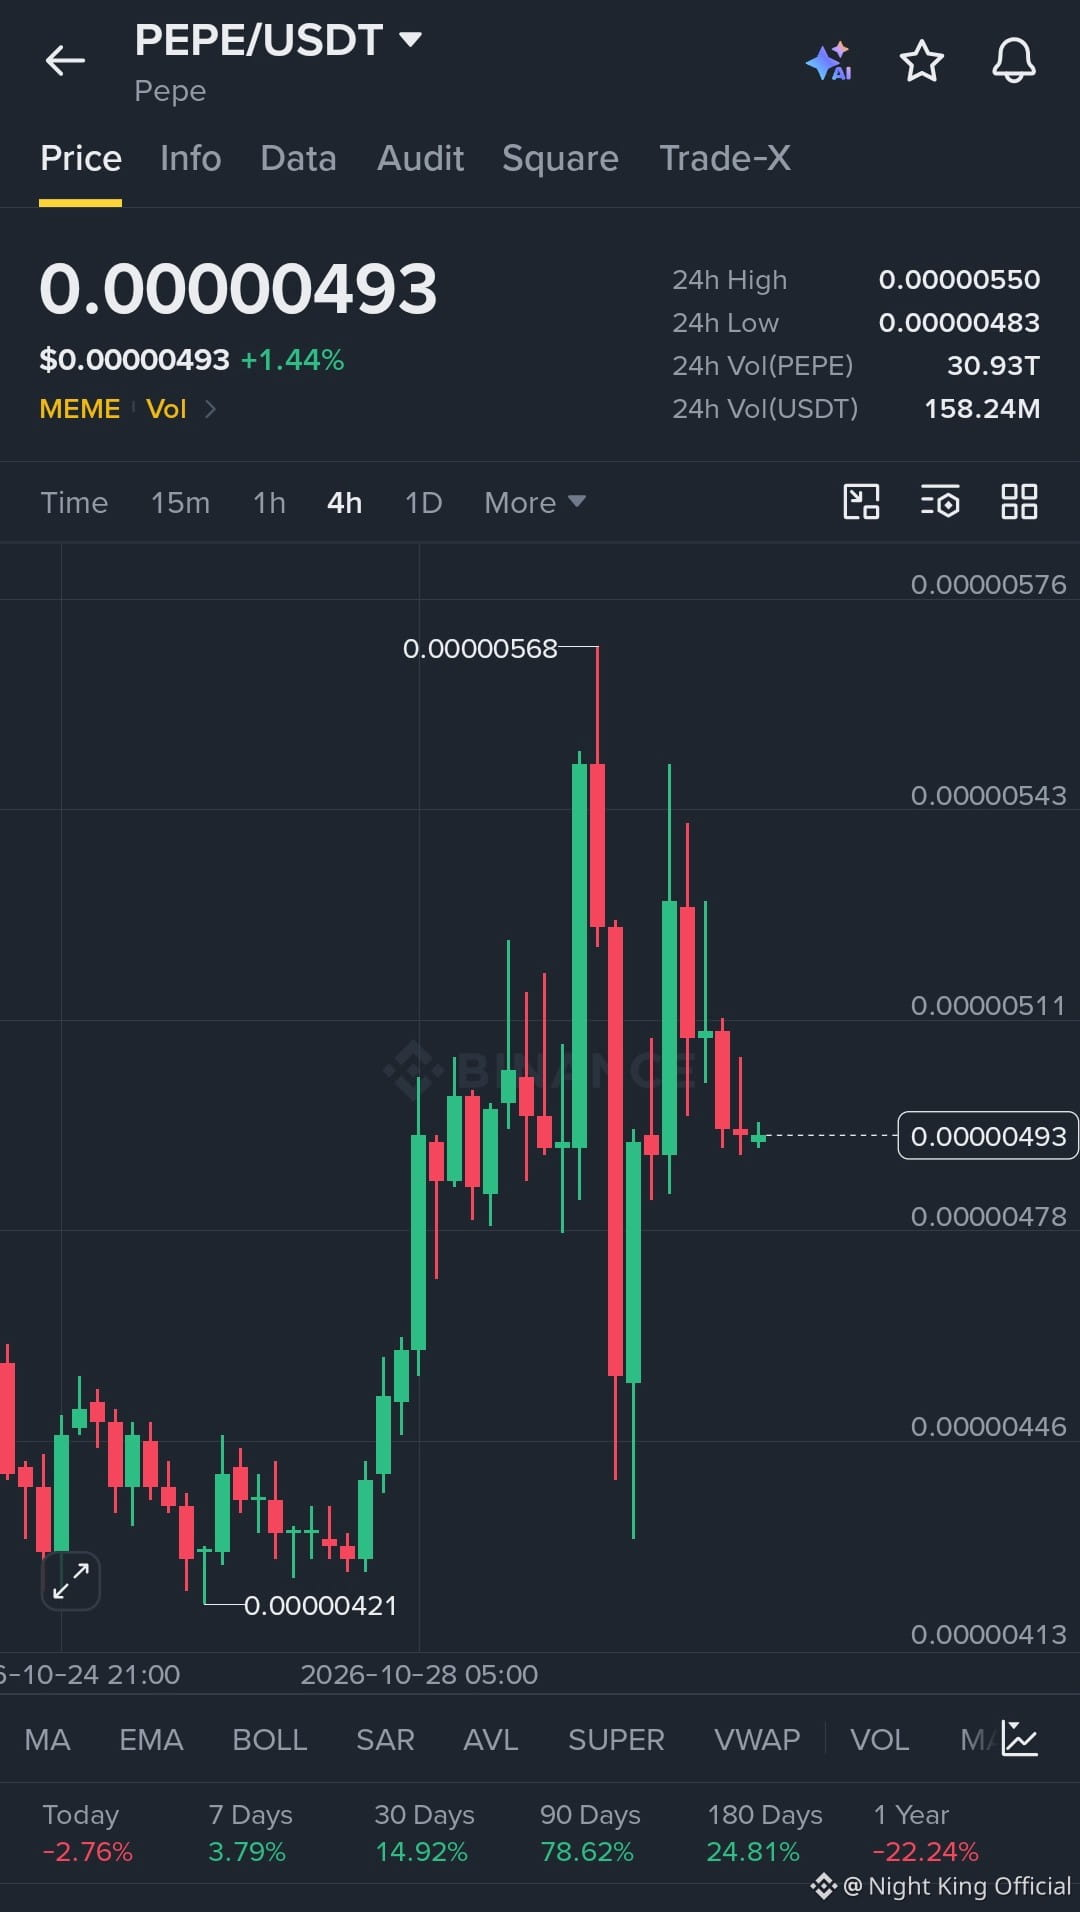
$PEPE 24 soatlik eng past daraja yaqinida sovimoqda 🐸
Sozlama: Long
Kirish diapazoni: 0.00000483 – 0.00000493
TP1: 0.00000511
TP2: 0.00000543
TP3: 0.00000568
SL: 4H sham yopilishi 0.00000478 dan pastda
Qisqacha: $PEPE 0.00000568 dagi tebranish cho‘qqisidan pasaydi, so‘nggi 4H shamlar esa 0.00000483 dagi 24 soatlik eng past darajadan biroz yuqorida kichik va tor diapazonda turibdi. Demak, xaridorlar hali faollik ko‘rsatishi kerak.
Qaysi biri avval bo‘ladi: narx 0.00000511 ga qaytadimi yoki 0.00000478 dan pastga tushadimi? Tanlovingizni ulashing.
Bu moliyaviy maslahat emas. O‘zingiz izlanish olib boring (DYOR).
#PEPE #CryptoSetup #BinanceSquare #WriteToEarn
{spot}(PEPEUSDT)
$PEPE 24 soatlik eng past daraja yaqinida sovimoqda 🐸
Sozlama: Long
Kirish diapazoni: 0.00000483 – 0.00000493
TP1: 0.00000511
TP2: 0.00000543
TP3: 0.00000568
SL: 4H sham yopilishi 0.00000478 dan pastda
Qisqacha: $PEPE 0.00000568 dagi tebranish cho‘qqisidan pasaydi, so‘nggi 4H shamlar esa 0.00000483 dagi 24 soatlik eng past darajadan biroz yuqorida kichik va tor diapazonda turibdi. Demak, xaridorlar hali faollik ko‘rsatishi kerak.
Qaysi biri avval bo‘ladi: narx 0.00000511 ga qaytadimi yoki 0.00000478 dan pastga tushadimi? Tanlovingizni ulashing.
Bu moliyaviy maslahat emas. O‘zingiz izlanish olib boring (DYOR).
#PEPE #CryptoSetup #BinanceSquare #WriteToEarn
Sozlama: Long
Kirish diapazoni: 0.00000483 – 0.00000493
TP1: 0.00000511
TP2: 0.00000543
TP3: 0.00000568
SL: 4H sham yopilishi 0.00000478 dan pastda
Qisqacha: $PEPE 0.00000568 dagi tebranish cho‘qqisidan pasaydi, so‘nggi 4H shamlar esa 0.00000483 dagi 24 soatlik eng past darajadan biroz yuqorida kichik va tor diapazonda turibdi. Demak, xaridorlar hali faollik ko‘rsatishi kerak.
Qaysi biri avval bo‘ladi: narx 0.00000511 ga qaytadimi yoki 0.00000478 dan pastga tushadimi? Tanlovingizni ulashing.
Bu moliyaviy maslahat emas. O‘zingiz izlanish olib boring (DYOR).
#PEPE #CryptoSetup #BinanceSquare #WriteToEarn
5
918
·
--
O‘suvchi
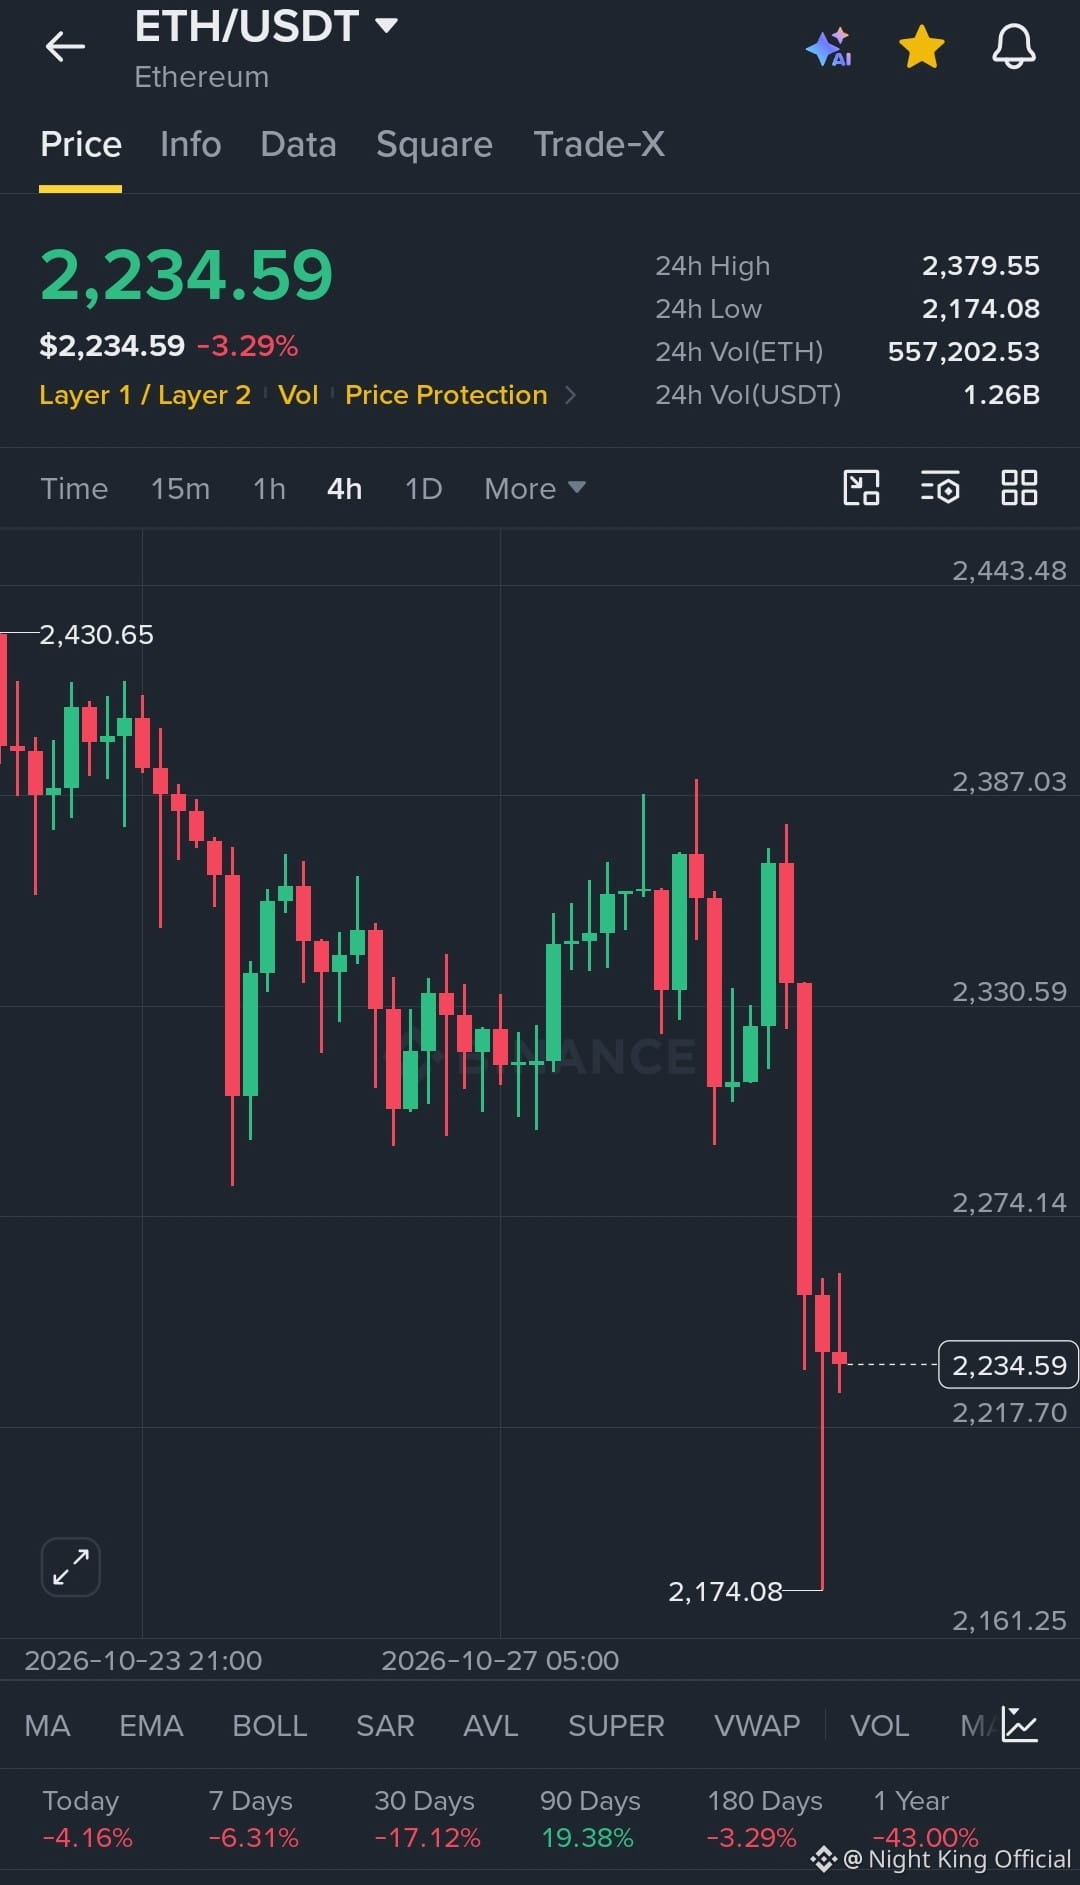
$ETH Katta 4H pasayishidan keyin ham bosim ostida 🔻
Yo‘nalish: Qisqa
Kirish diapazoni: 2,234.59 – 2,274.14
TP1: 2,217.70
TP2: 2,174.08
TP3: 2,161.25
SL: 2,330.59
Grafik tahlili: $ETH katta qizil 4H shamda keskin tushib ketdi. Undan keyingi shamlar kichik va qizil bo‘lib, tiklanishni tasdiqlaydigan yashil 4H sham hali ko‘rinmadi.
2,174.08 24 soatlik eng past daraja sifatida saqlanib qoladimi yoki undan ham pastga tushadimi? Fikringizni quyida yozing.
Bu moliyaviy maslahat emas. O‘zingiz izlanish olib boring.
#ETH #CryptoSignals #4HChart #WriteToEarn
{spot}(ETHUSDT)
$ETH Katta 4H pasayishidan keyin ham bosim ostida 🔻
Yo‘nalish: Qisqa
Kirish diapazoni: 2,234.59 – 2,274.14
TP1: 2,217.70
TP2: 2,174.08
TP3: 2,161.25
SL: 2,330.59
Grafik tahlili: $ETH katta qizil 4H shamda keskin tushib ketdi. Undan keyingi shamlar kichik va qizil bo‘lib, tiklanishni tasdiqlaydigan yashil 4H sham hali ko‘rinmadi.
2,174.08 24 soatlik eng past daraja sifatida saqlanib qoladimi yoki undan ham pastga tushadimi? Fikringizni quyida yozing.
Bu moliyaviy maslahat emas. O‘zingiz izlanish olib boring.
#ETH #CryptoSignals #4HChart #WriteToEarn
Yo‘nalish: Qisqa
Kirish diapazoni: 2,234.59 – 2,274.14
TP1: 2,217.70
TP2: 2,174.08
TP3: 2,161.25
SL: 2,330.59
Grafik tahlili: $ETH katta qizil 4H shamda keskin tushib ketdi. Undan keyingi shamlar kichik va qizil bo‘lib, tiklanishni tasdiqlaydigan yashil 4H sham hali ko‘rinmadi.
2,174.08 24 soatlik eng past daraja sifatida saqlanib qoladimi yoki undan ham pastga tushadimi? Fikringizni quyida yozing.
Bu moliyaviy maslahat emas. O‘zingiz izlanish olib boring.
#ETH #CryptoSignals #4HChart #WriteToEarn
2
242
·
--
O‘suvchi
Tarjimani ko‘rish
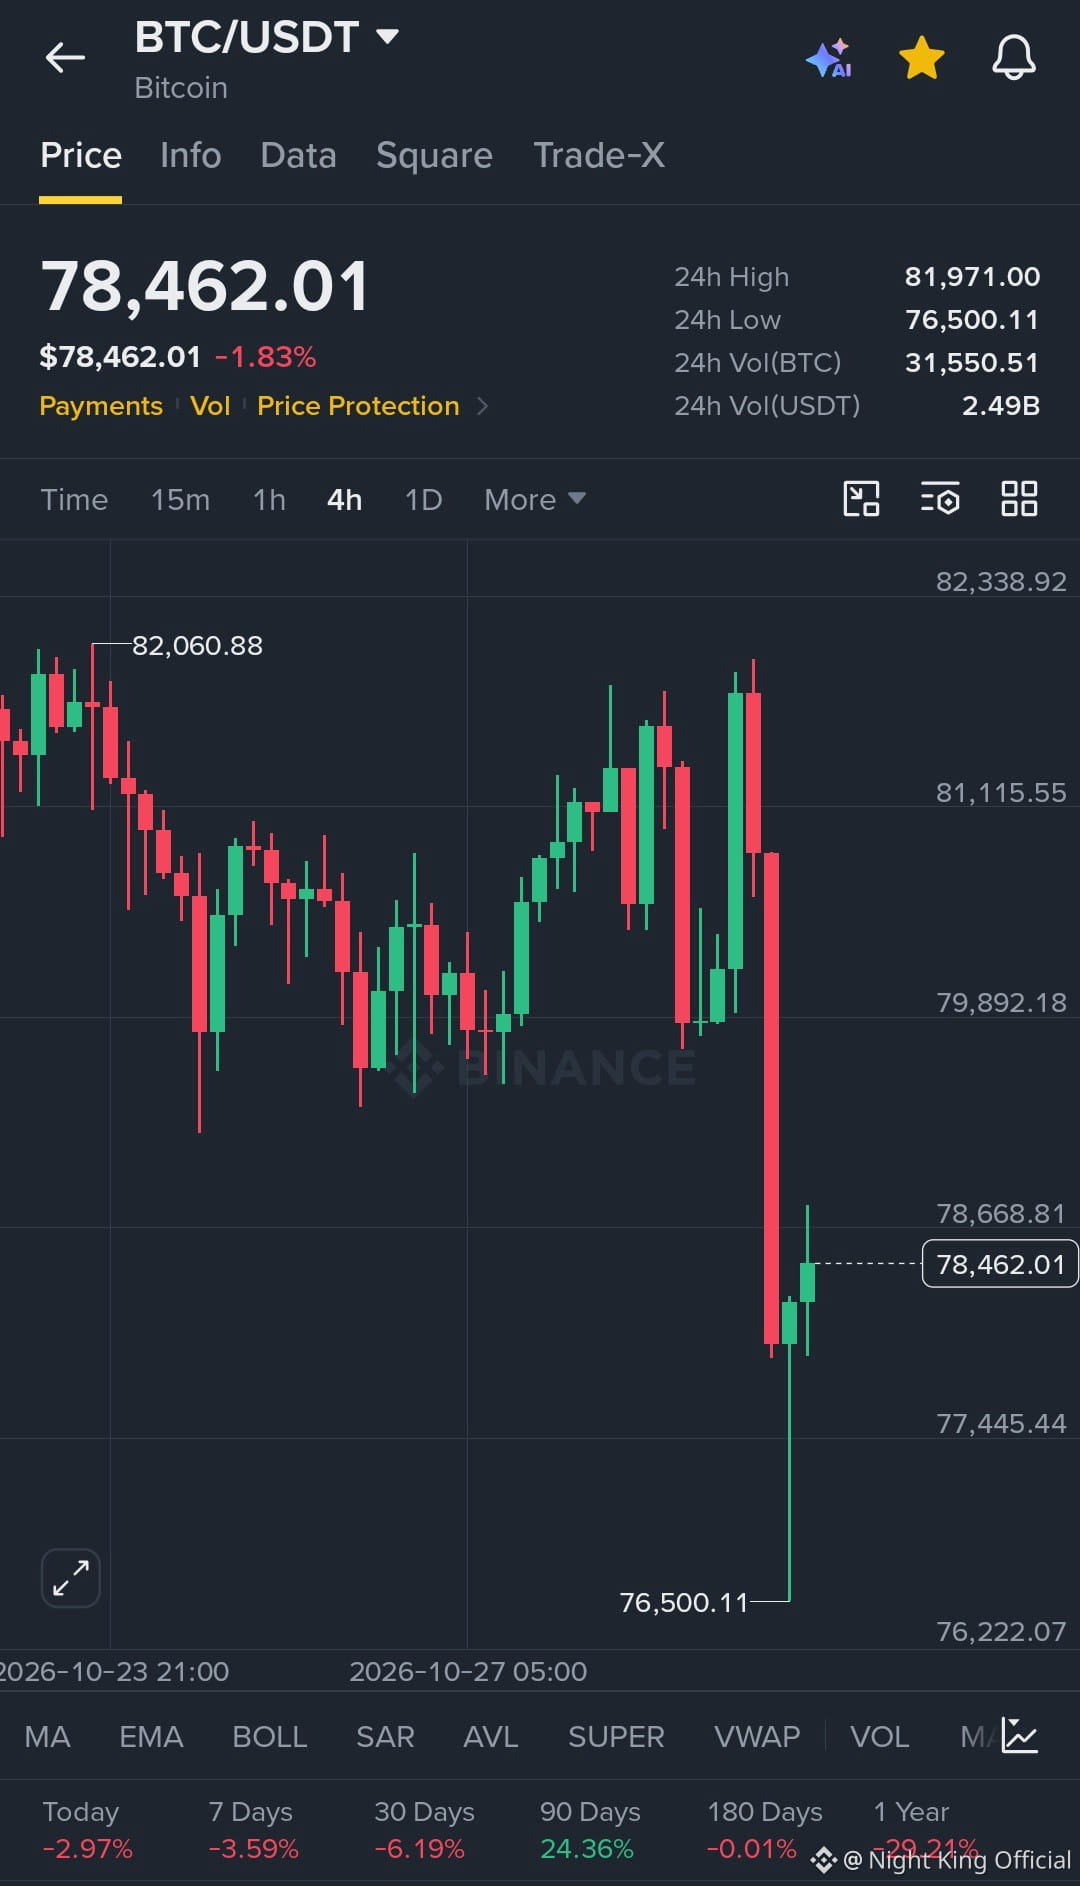
$BTC Snaps Back From the 76,500.11 Flush ⚡
Bias: Long
Entry Zone: 77,445.44 – 78,462.01
TP1: 79,892.18
TP2: 81,115.55
TP3: 82,060.88
SL: 4H close below 76,500.11
Read: A large red 4H candle took $BTC down to 76,500.11, the 24h Low. Two green 4H candles have followed, but price is still well below the 24h High at 81,971.00, so the recovery is not yet confirmed.
Is this a real bounce, or just a pause before another test of the 24h Low? Tell me your view below.
Not financial advice. DYOR.
#BTC #BinanceSquare #CryptoTrading #WriteToEarn
{spot}(BTCUSDT)
$BTC Snaps Back From the 76,500.11 Flush ⚡
Bias: Long
Entry Zone: 77,445.44 – 78,462.01
TP1: 79,892.18
TP2: 81,115.55
TP3: 82,060.88
SL: 4H close below 76,500.11
Read: A large red 4H candle took $BTC down to 76,500.11, the 24h Low. Two green 4H candles have followed, but price is still well below the 24h High at 81,971.00, so the recovery is not yet confirmed.
Is this a real bounce, or just a pause before another test of the 24h Low? Tell me your view below.
Not financial advice. DYOR.
#BTC #BinanceSquare #CryptoTrading #WriteToEarn
Bias: Long
Entry Zone: 77,445.44 – 78,462.01
TP1: 79,892.18
TP2: 81,115.55
TP3: 82,060.88
SL: 4H close below 76,500.11
Read: A large red 4H candle took $BTC down to 76,500.11, the 24h Low. Two green 4H candles have followed, but price is still well below the 24h High at 81,971.00, so the recovery is not yet confirmed.
Is this a real bounce, or just a pause before another test of the 24h Low? Tell me your view below.
Not financial advice. DYOR.
#BTC #BinanceSquare #CryptoTrading #WriteToEarn
1
226
·
--
O‘suvchi
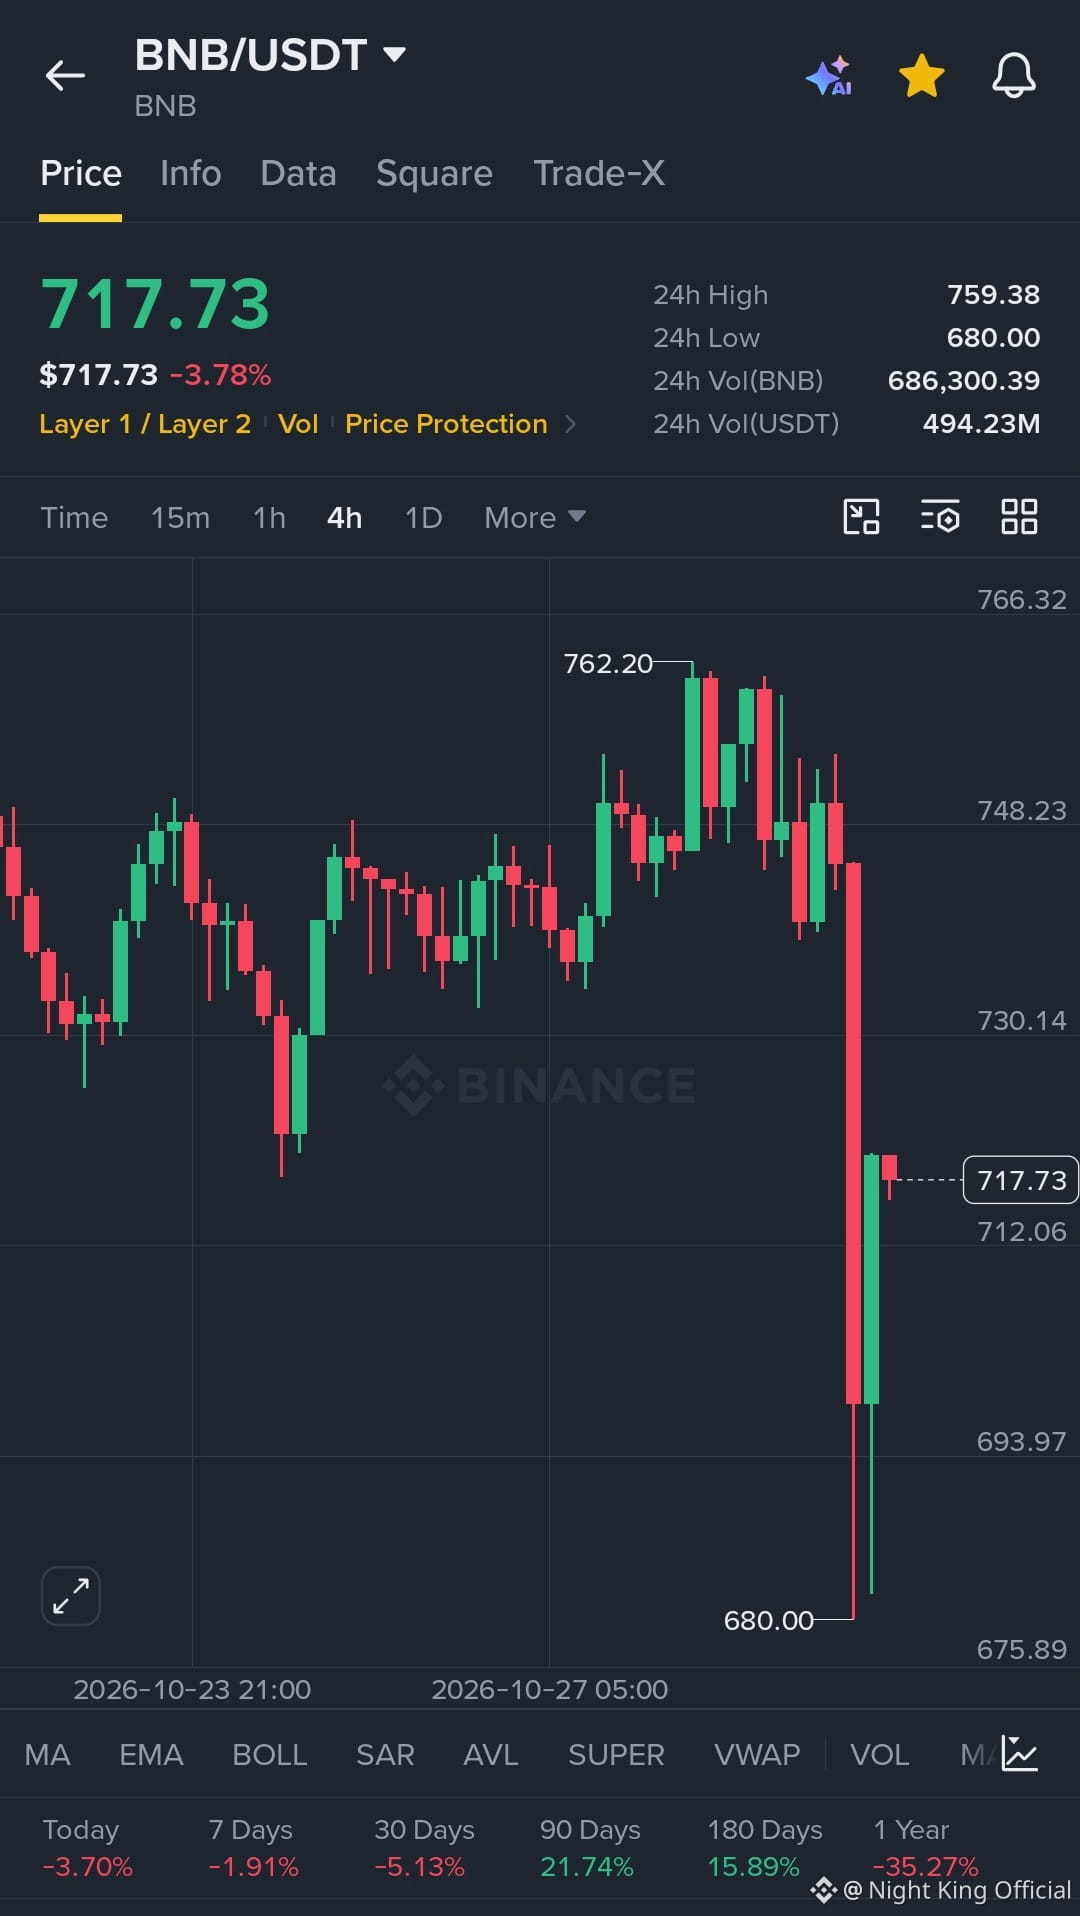
$BNB 24 soatlik eng past 680.00 darajadan qaytdi 📊
Harakat: Long
Kirish diapazoni: 712.06 – 717.73
TP1: 730.14
TP2: 748.23
TP3: 759.38 (24 soatlik eng yuqori daraja)
SL: 693.97
Tahlil: $BNB 4 soatlik grafikda keskin tushib, 24 soatlik eng past 680.00 darajaga yetdi, keyingi 4 soatlik sham esa pastki soyasi uzun bo‘lgan holda tiklandi. So‘nggi sham yana qizil rangda, shuning uchun bu qaytish hali tasdiqlanishi kerak.
Sizningcha, 4 soatlik xaridorlar 712.06 dan yuqoridagi zonani ushlab tura oladimi yoki avval 693.97 darajasi sinab ko‘riladimi?
Bu moliyaviy maslahat emas. O‘zingiz ham tadqiqot qiling.
#BNB #Binance #CryptoSignals #TradingSetup #WriteToEarn
{spot}(BNBUSDT)
$BNB 24 soatlik eng past 680.00 darajadan qaytdi 📊
Harakat: Long
Kirish diapazoni: 712.06 – 717.73
TP1: 730.14
TP2: 748.23
TP3: 759.38 (24 soatlik eng yuqori daraja)
SL: 693.97
Tahlil: $BNB 4 soatlik grafikda keskin tushib, 24 soatlik eng past 680.00 darajaga yetdi, keyingi 4 soatlik sham esa pastki soyasi uzun bo‘lgan holda tiklandi. So‘nggi sham yana qizil rangda, shuning uchun bu qaytish hali tasdiqlanishi kerak.
Sizningcha, 4 soatlik xaridorlar 712.06 dan yuqoridagi zonani ushlab tura oladimi yoki avval 693.97 darajasi sinab ko‘riladimi?
Bu moliyaviy maslahat emas. O‘zingiz ham tadqiqot qiling.
#BNB #Binance #CryptoSignals #TradingSetup #WriteToEarn
Harakat: Long
Kirish diapazoni: 712.06 – 717.73
TP1: 730.14
TP2: 748.23
TP3: 759.38 (24 soatlik eng yuqori daraja)
SL: 693.97
Tahlil: $BNB 4 soatlik grafikda keskin tushib, 24 soatlik eng past 680.00 darajaga yetdi, keyingi 4 soatlik sham esa pastki soyasi uzun bo‘lgan holda tiklandi. So‘nggi sham yana qizil rangda, shuning uchun bu qaytish hali tasdiqlanishi kerak.
Sizningcha, 4 soatlik xaridorlar 712.06 dan yuqoridagi zonani ushlab tura oladimi yoki avval 693.97 darajasi sinab ko‘riladimi?
Bu moliyaviy maslahat emas. O‘zingiz ham tadqiqot qiling.
#BNB #Binance #CryptoSignals #TradingSetup #WriteToEarn
1
245
·
--
O‘suvchi
Tarjimani ko‘rish
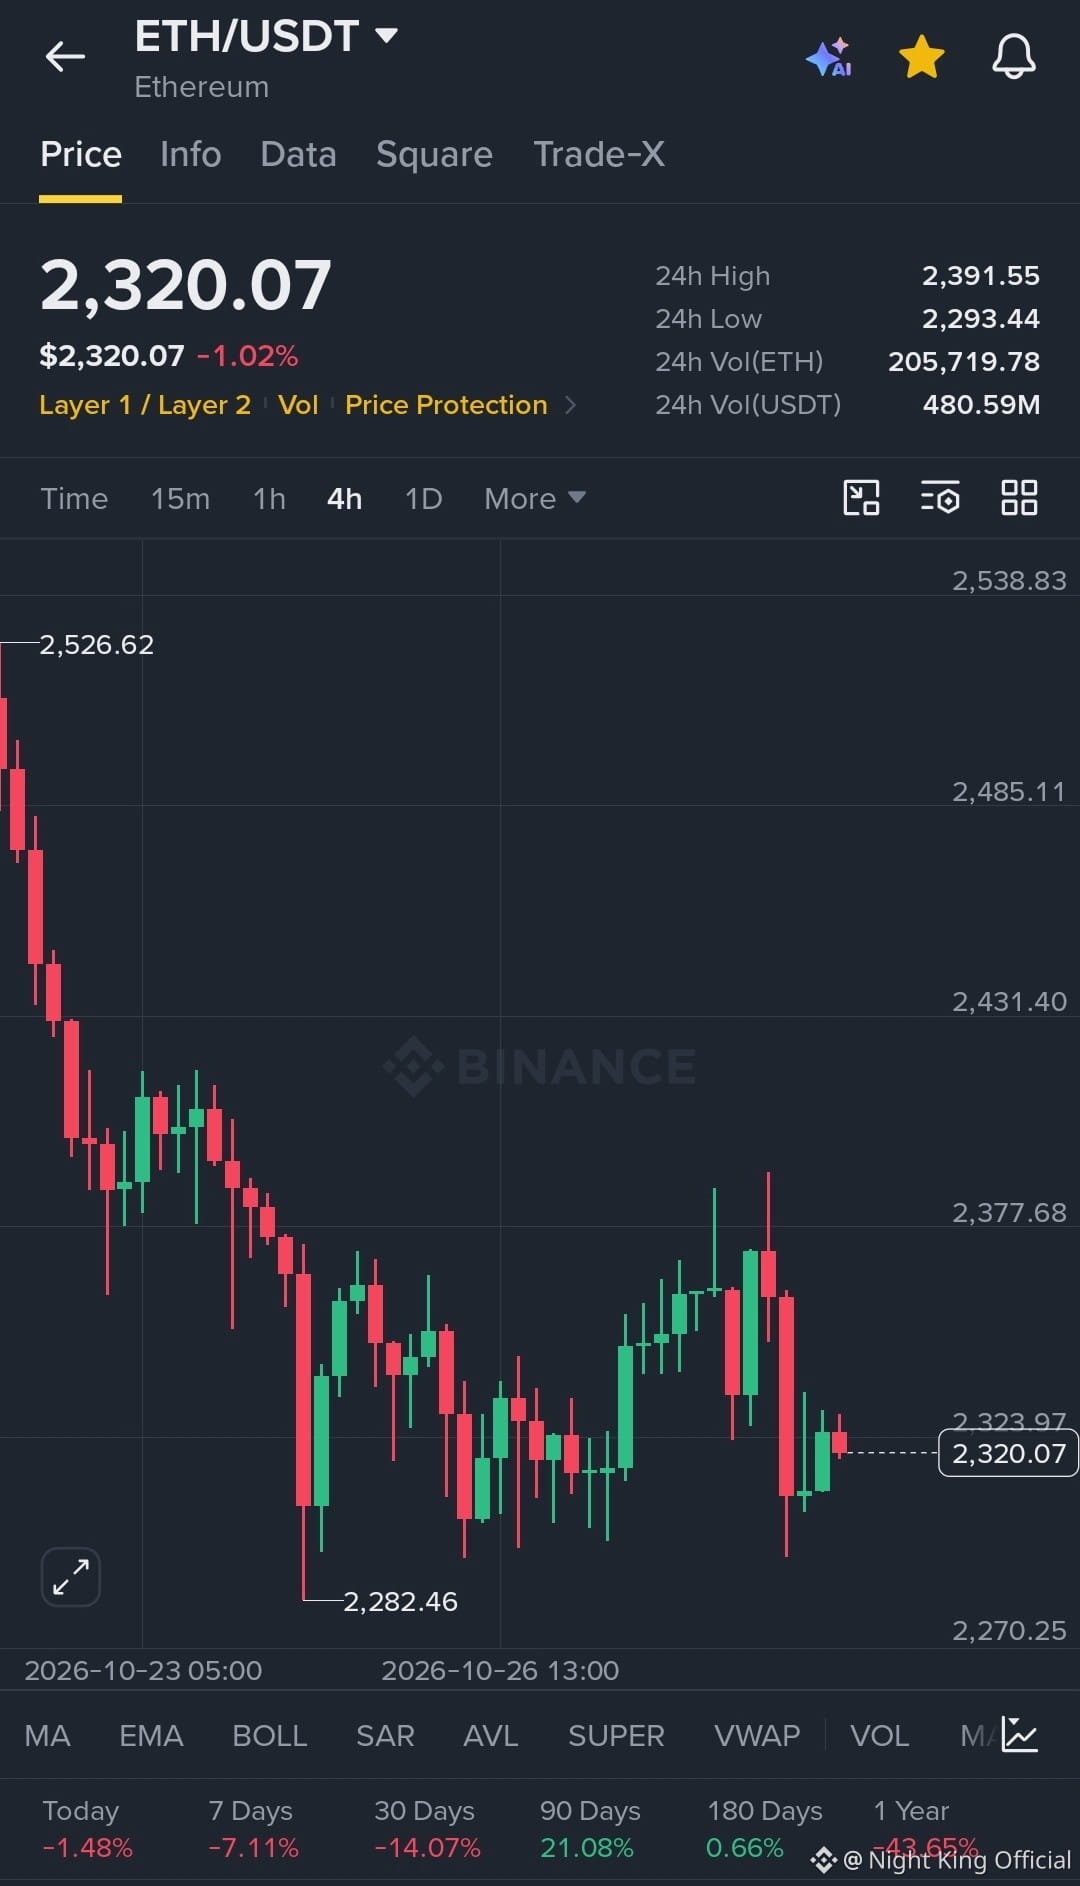
ETH Sellers Still Pressing the 4H ⚡
Action: Short
Entry Range: 2,320.07 – 2,323.97
TP1: 2,293.44
TP2: 2,282.46
TP3: 2,270.25
SL: 2,377.68
Analysis: $ETH keeps printing lower highs on the 4H after the 2,526.62 swing high and is sitting just above the 24h Low of 2,293.44, so the next candles show whether that level gives way.
Do you expect the 2,282.46 swing low to hold, or does it break first?
Not financial advice. DYOR.
#ETH #CryptoTrading #BinanceSquare
{spot}(ETHUSDT)
ETH Sellers Still Pressing the 4H ⚡
Action: Short
Entry Range: 2,320.07 – 2,323.97
TP1: 2,293.44
TP2: 2,282.46
TP3: 2,270.25
SL: 2,377.68
Analysis: $ETH keeps printing lower highs on the 4H after the 2,526.62 swing high and is sitting just above the 24h Low of 2,293.44, so the next candles show whether that level gives way.
Do you expect the 2,282.46 swing low to hold, or does it break first?
Not financial advice. DYOR.
#ETH #CryptoTrading #BinanceSquare
Action: Short
Entry Range: 2,320.07 – 2,323.97
TP1: 2,293.44
TP2: 2,282.46
TP3: 2,270.25
SL: 2,377.68
Analysis: $ETH keeps printing lower highs on the 4H after the 2,526.62 swing high and is sitting just above the 24h Low of 2,293.44, so the next candles show whether that level gives way.
Do you expect the 2,282.46 swing low to hold, or does it break first?
Not financial advice. DYOR.
#ETH #CryptoTrading #BinanceSquare
3
219
·
--
Pasayuvchi
Tarjimani ko‘rish
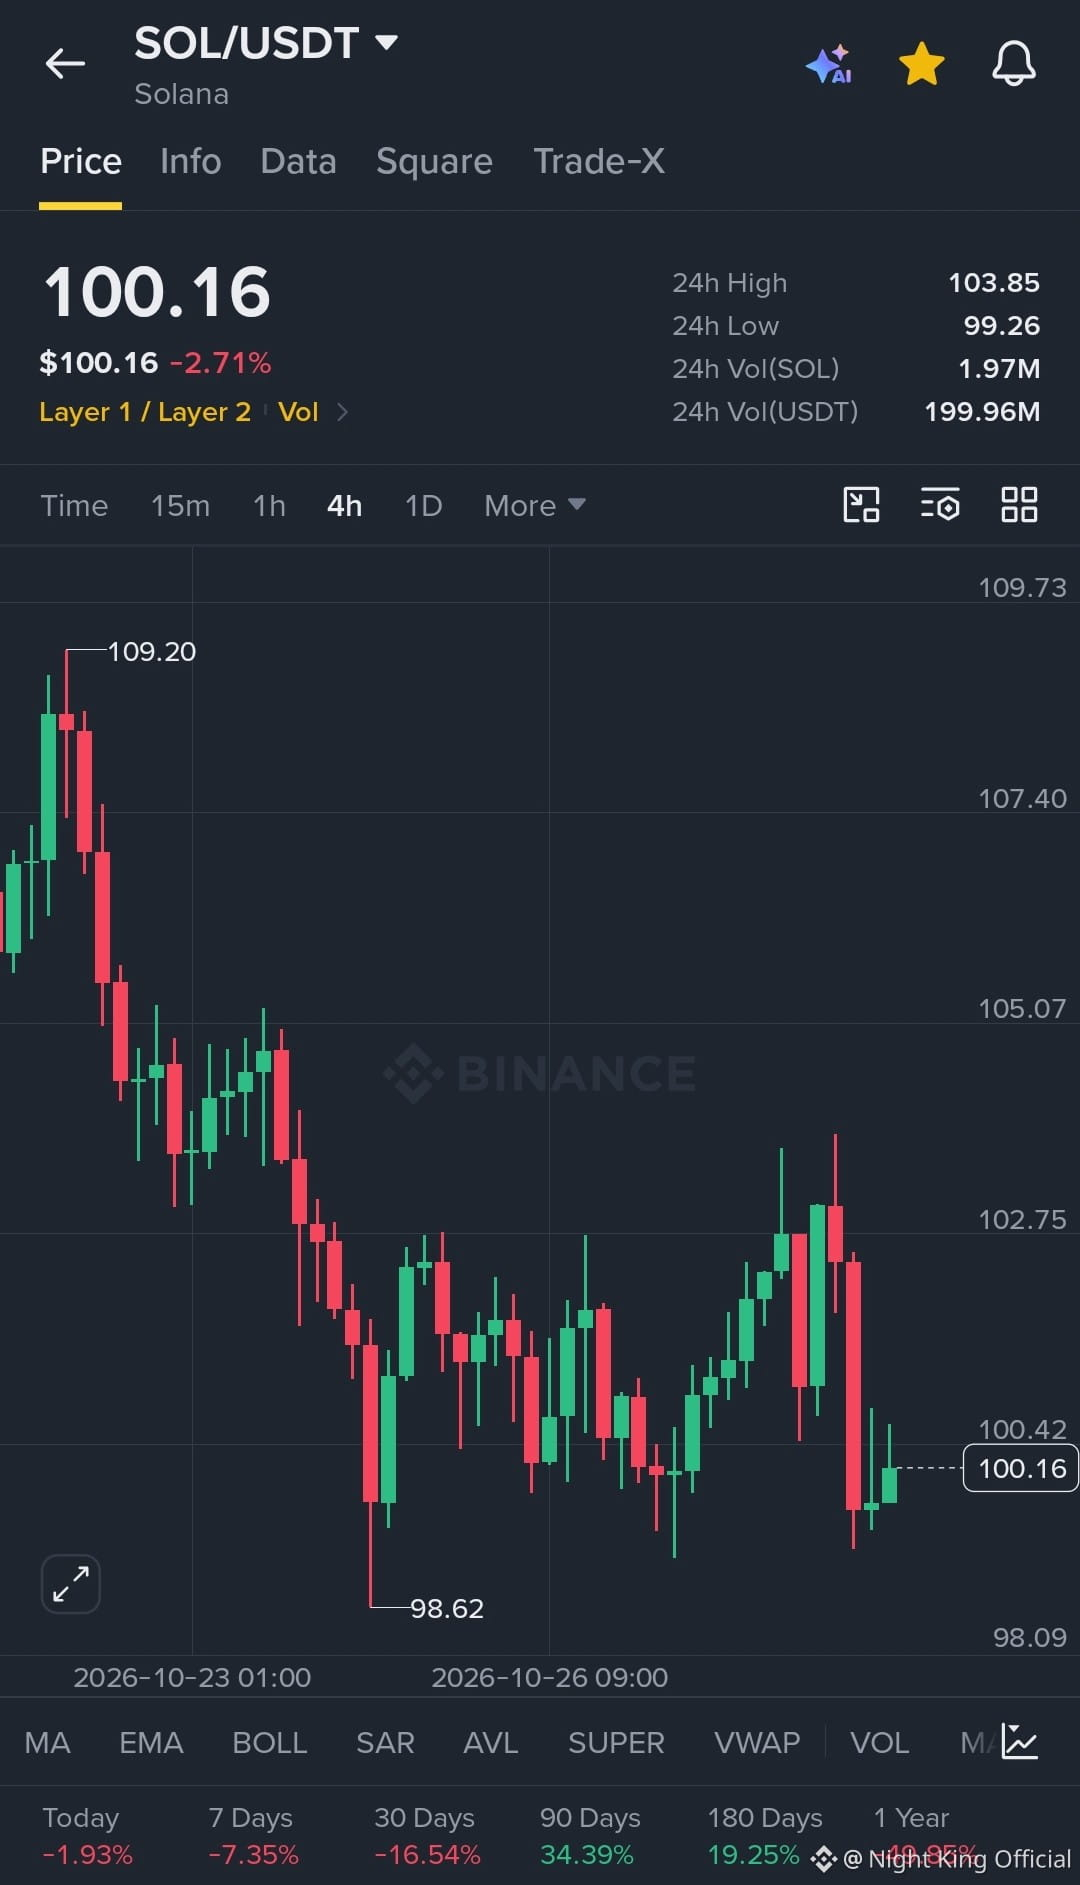
$SOL Faces Resistance Near 100.42 📉
Action: Short
Entry Range: 100.16 – 100.42
TP1: 99.26
TP2: 98.62
TP3: 98.09
SL: 102.75
Price has slid from the 109.20 swing high to the 98.62 swing low on the 4H, and $SOL is now trading around 100.16 on only a small green candle, so a failure to hold above 100.42 is what this setup watches.
Where do you see $SOL heading next, a retest of 98.62 or a push back toward 102.75?
Not financial advice. DYOR.
#SOL #CryptoSignals
{future}(SOLUSDT)
$SOL Faces Resistance Near 100.42 📉
Action: Short
Entry Range: 100.16 – 100.42
TP1: 99.26
TP2: 98.62
TP3: 98.09
SL: 102.75
Price has slid from the 109.20 swing high to the 98.62 swing low on the 4H, and $SOL is now trading around 100.16 on only a small green candle, so a failure to hold above 100.42 is what this setup watches.
Where do you see $SOL heading next, a retest of 98.62 or a push back toward 102.75?
Not financial advice. DYOR.
#SOL #CryptoSignals
Action: Short
Entry Range: 100.16 – 100.42
TP1: 99.26
TP2: 98.62
TP3: 98.09
SL: 102.75
Price has slid from the 109.20 swing high to the 98.62 swing low on the 4H, and $SOL is now trading around 100.16 on only a small green candle, so a failure to hold above 100.42 is what this setup watches.
Where do you see $SOL heading next, a retest of 98.62 or a push back toward 102.75?
Not financial advice. DYOR.
#SOL #CryptoSignals
2
330
·
--
Pasayuvchi
Tarjimani ko‘rish
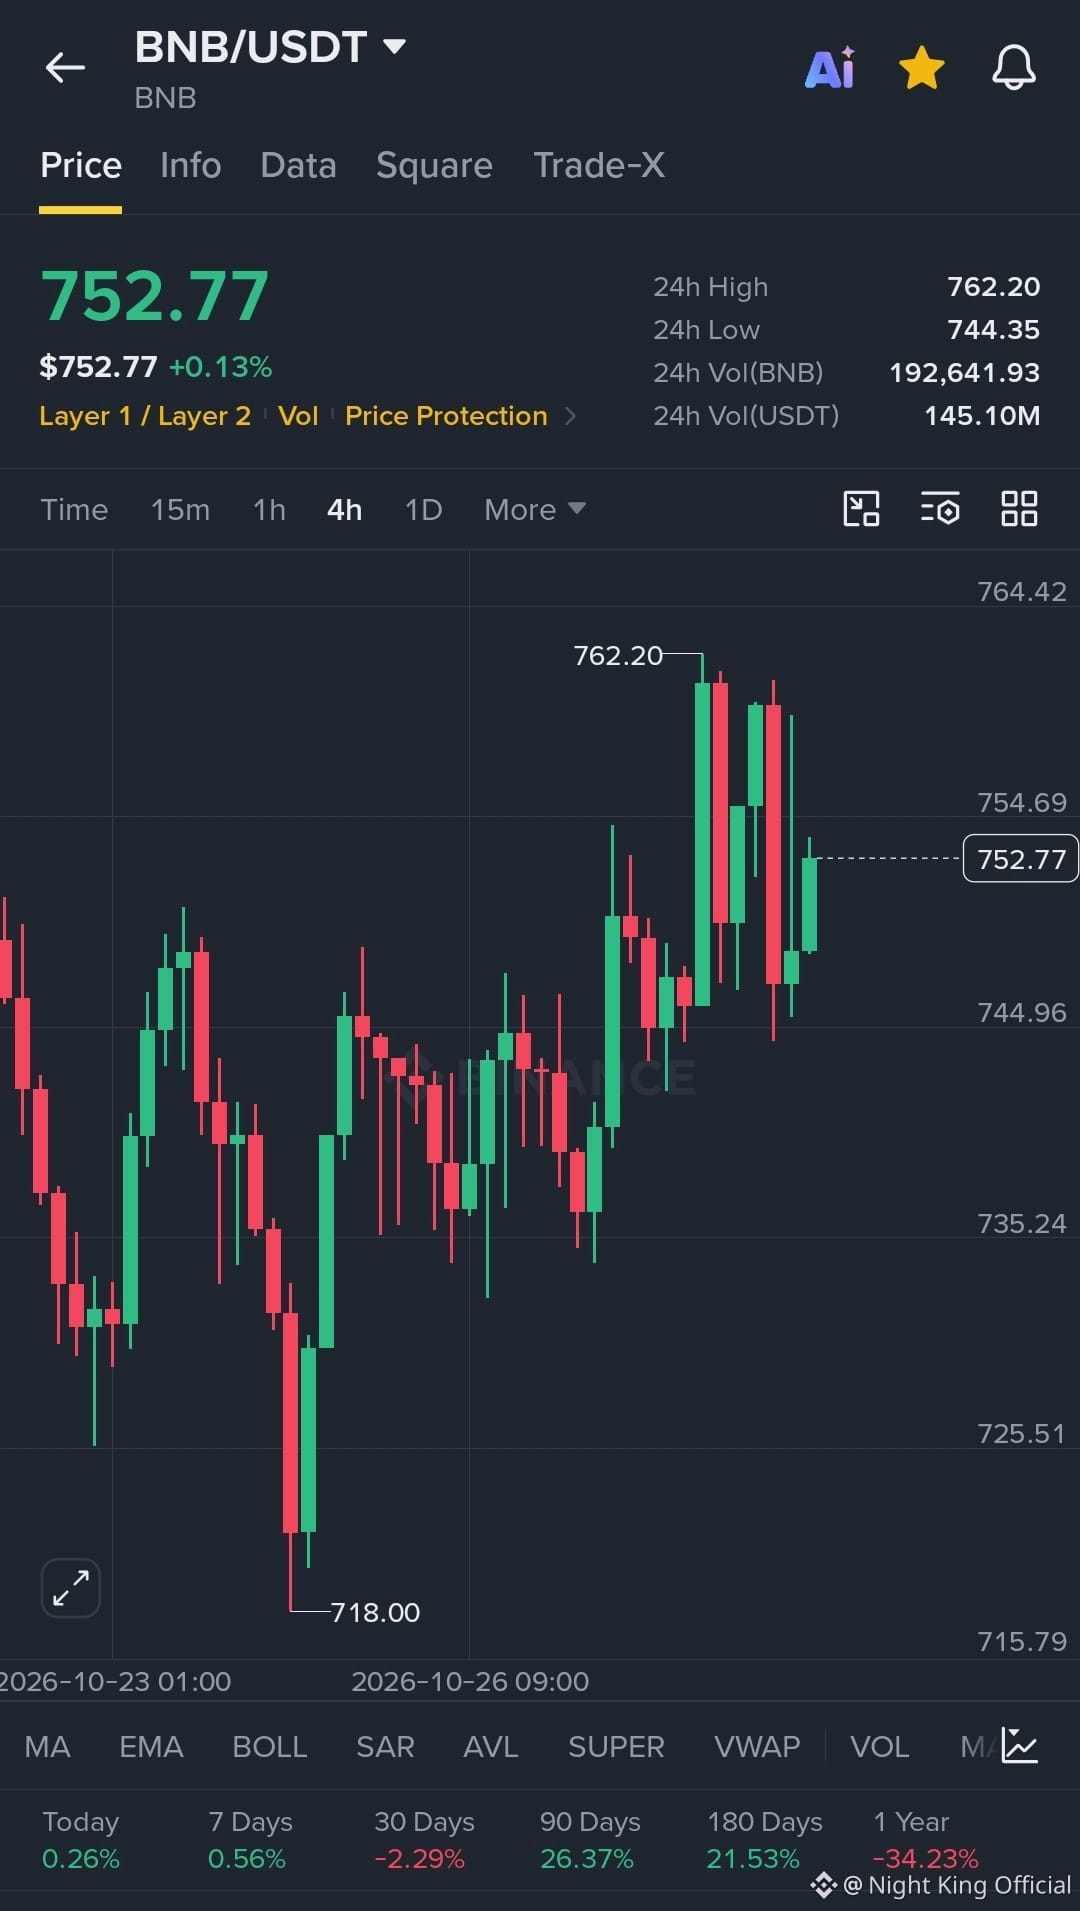
$BNB Holding Above the 24h Low 📈
Action: Long
Entry Range: 744.96 – 752.77
TP1: 754.69
TP2: 762.20
TP3: 764.42
SL: 4H close below 744.35
Analysis: $BNB pulled back from the 762.20 24h High and is now printing a green 4H candle at 752.77, so the bounce needs to hold above the 24h Low to stay constructive.
Which level are you watching first on BNB, 754.69 or 762.20?
Not financial advice. DYOR.
#BNB #CryptoSignals #BinanceSquare
{future}(BNBUSDT)
$BNB Holding Above the 24h Low 📈
Action: Long
Entry Range: 744.96 – 752.77
TP1: 754.69
TP2: 762.20
TP3: 764.42
SL: 4H close below 744.35
Analysis: $BNB pulled back from the 762.20 24h High and is now printing a green 4H candle at 752.77, so the bounce needs to hold above the 24h Low to stay constructive.
Which level are you watching first on BNB, 754.69 or 762.20?
Not financial advice. DYOR.
#BNB #CryptoSignals #BinanceSquare
Action: Long
Entry Range: 744.96 – 752.77
TP1: 754.69
TP2: 762.20
TP3: 764.42
SL: 4H close below 744.35
Analysis: $BNB pulled back from the 762.20 24h High and is now printing a green 4H candle at 752.77, so the bounce needs to hold above the 24h Low to stay constructive.
Which level are you watching first on BNB, 754.69 or 762.20?
Not financial advice. DYOR.
#BNB #CryptoSignals #BinanceSquare
1
1
237
·
--
Pasayuvchi
Tarjimani ko‘rish
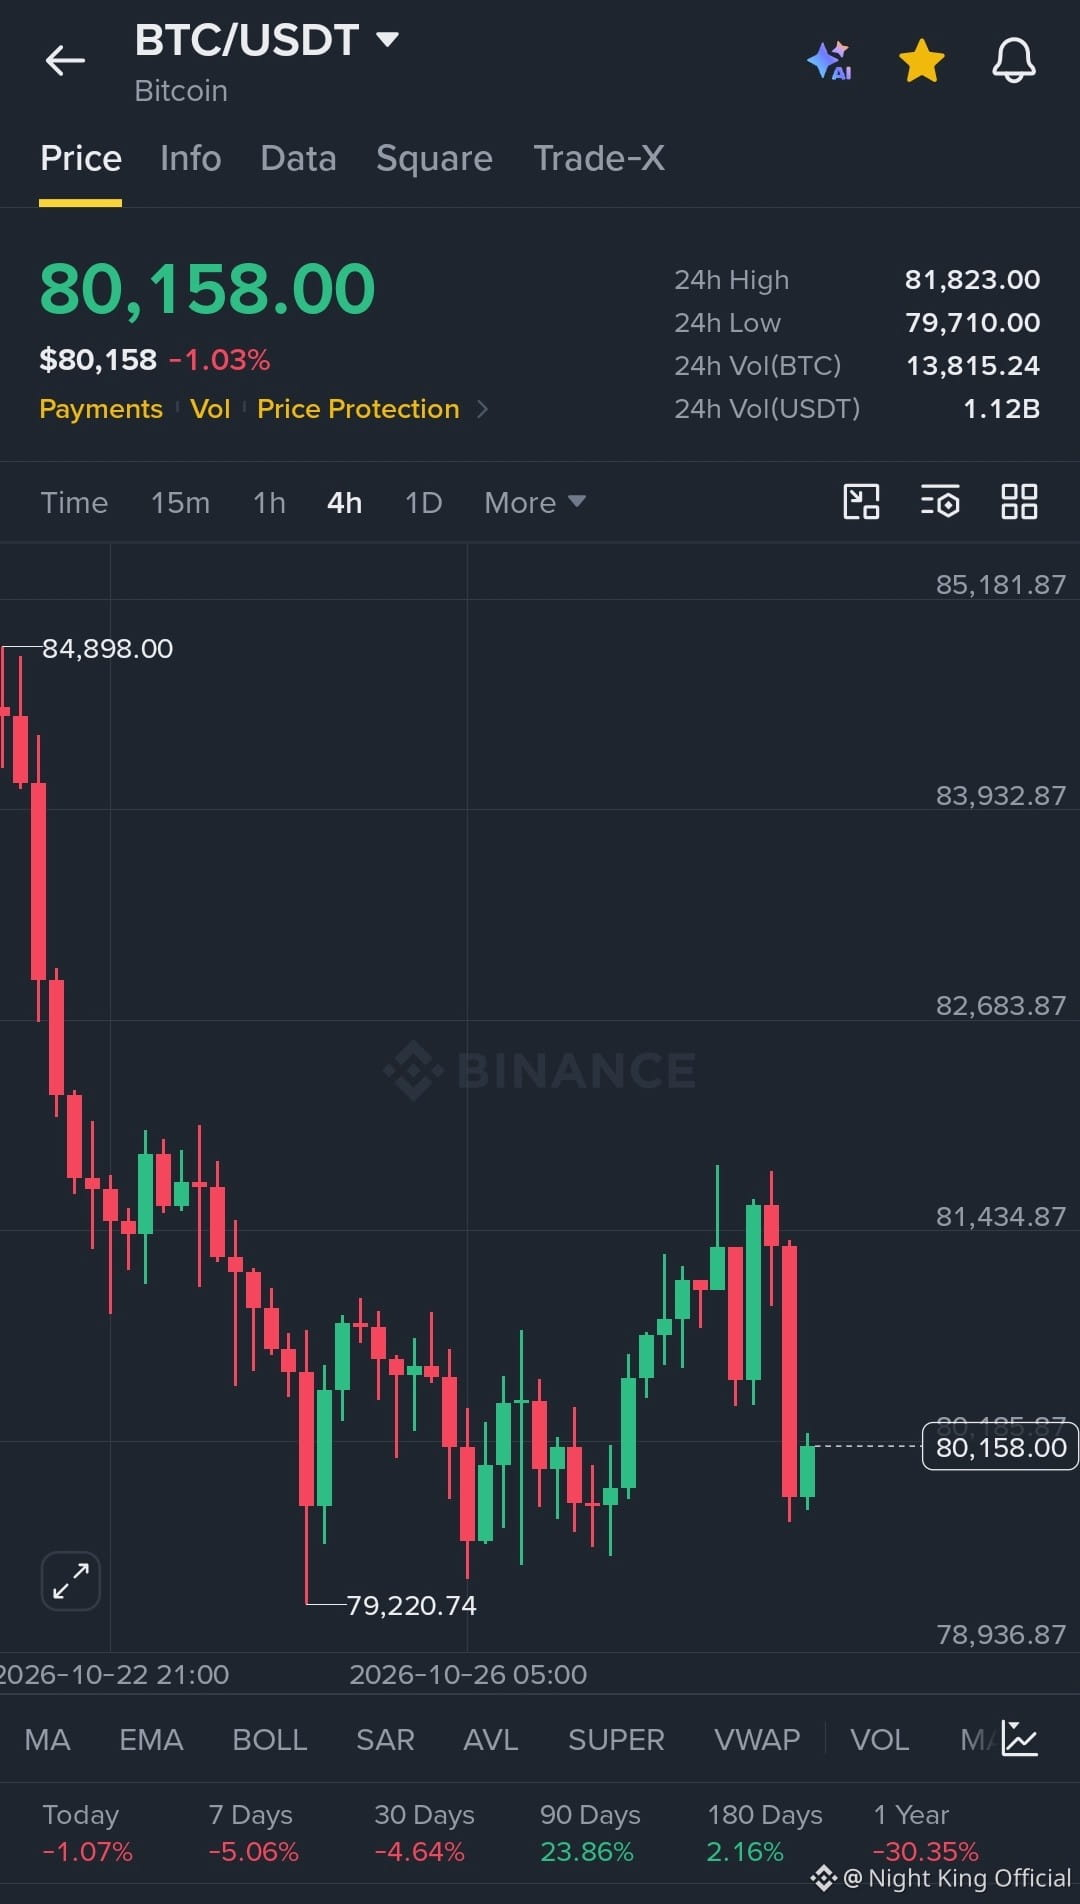
$BTC Near Key Support: 4H Setup Under Pressure 📉
Action: Short
Entry Range: 80,158.00 – 81,434.87
TP1: 79,710.00
TP2: 79,220.74
TP3: 78,936.87
SL: 81,823.00
Technical Analysis: BTC remains under visible selling pressure on the 4H chart after rejection near the 81,434.87 area, with 79,710.00 and the marked swing low at 79,220.74 as key downside levels to watch.
Do you expect BTC to break below support or recover toward the 24h high? Share your view on $BTC .
Not financial advice. DYOR.
#BTC #Bitcoin #CryptoTrading #BinanceSquare #TechnicalAnalysis
{future}(BTCUSDT)
$BTC Near Key Support: 4H Setup Under Pressure 📉
Action: Short
Entry Range: 80,158.00 – 81,434.87
TP1: 79,710.00
TP2: 79,220.74
TP3: 78,936.87
SL: 81,823.00
Technical Analysis: BTC remains under visible selling pressure on the 4H chart after rejection near the 81,434.87 area, with 79,710.00 and the marked swing low at 79,220.74 as key downside levels to watch.
Do you expect BTC to break below support or recover toward the 24h high? Share your view on $BTC .
Not financial advice. DYOR.
#BTC #Bitcoin #CryptoTrading #BinanceSquare #TechnicalAnalysis
Action: Short
Entry Range: 80,158.00 – 81,434.87
TP1: 79,710.00
TP2: 79,220.74
TP3: 78,936.87
SL: 81,823.00
Technical Analysis: BTC remains under visible selling pressure on the 4H chart after rejection near the 81,434.87 area, with 79,710.00 and the marked swing low at 79,220.74 as key downside levels to watch.
Do you expect BTC to break below support or recover toward the 24h high? Share your view on $BTC .
Not financial advice. DYOR.
#BTC #Bitcoin #CryptoTrading #BinanceSquare #TechnicalAnalysis
1
145
·
--
O‘suvchi
Tarjimani ko‘rish
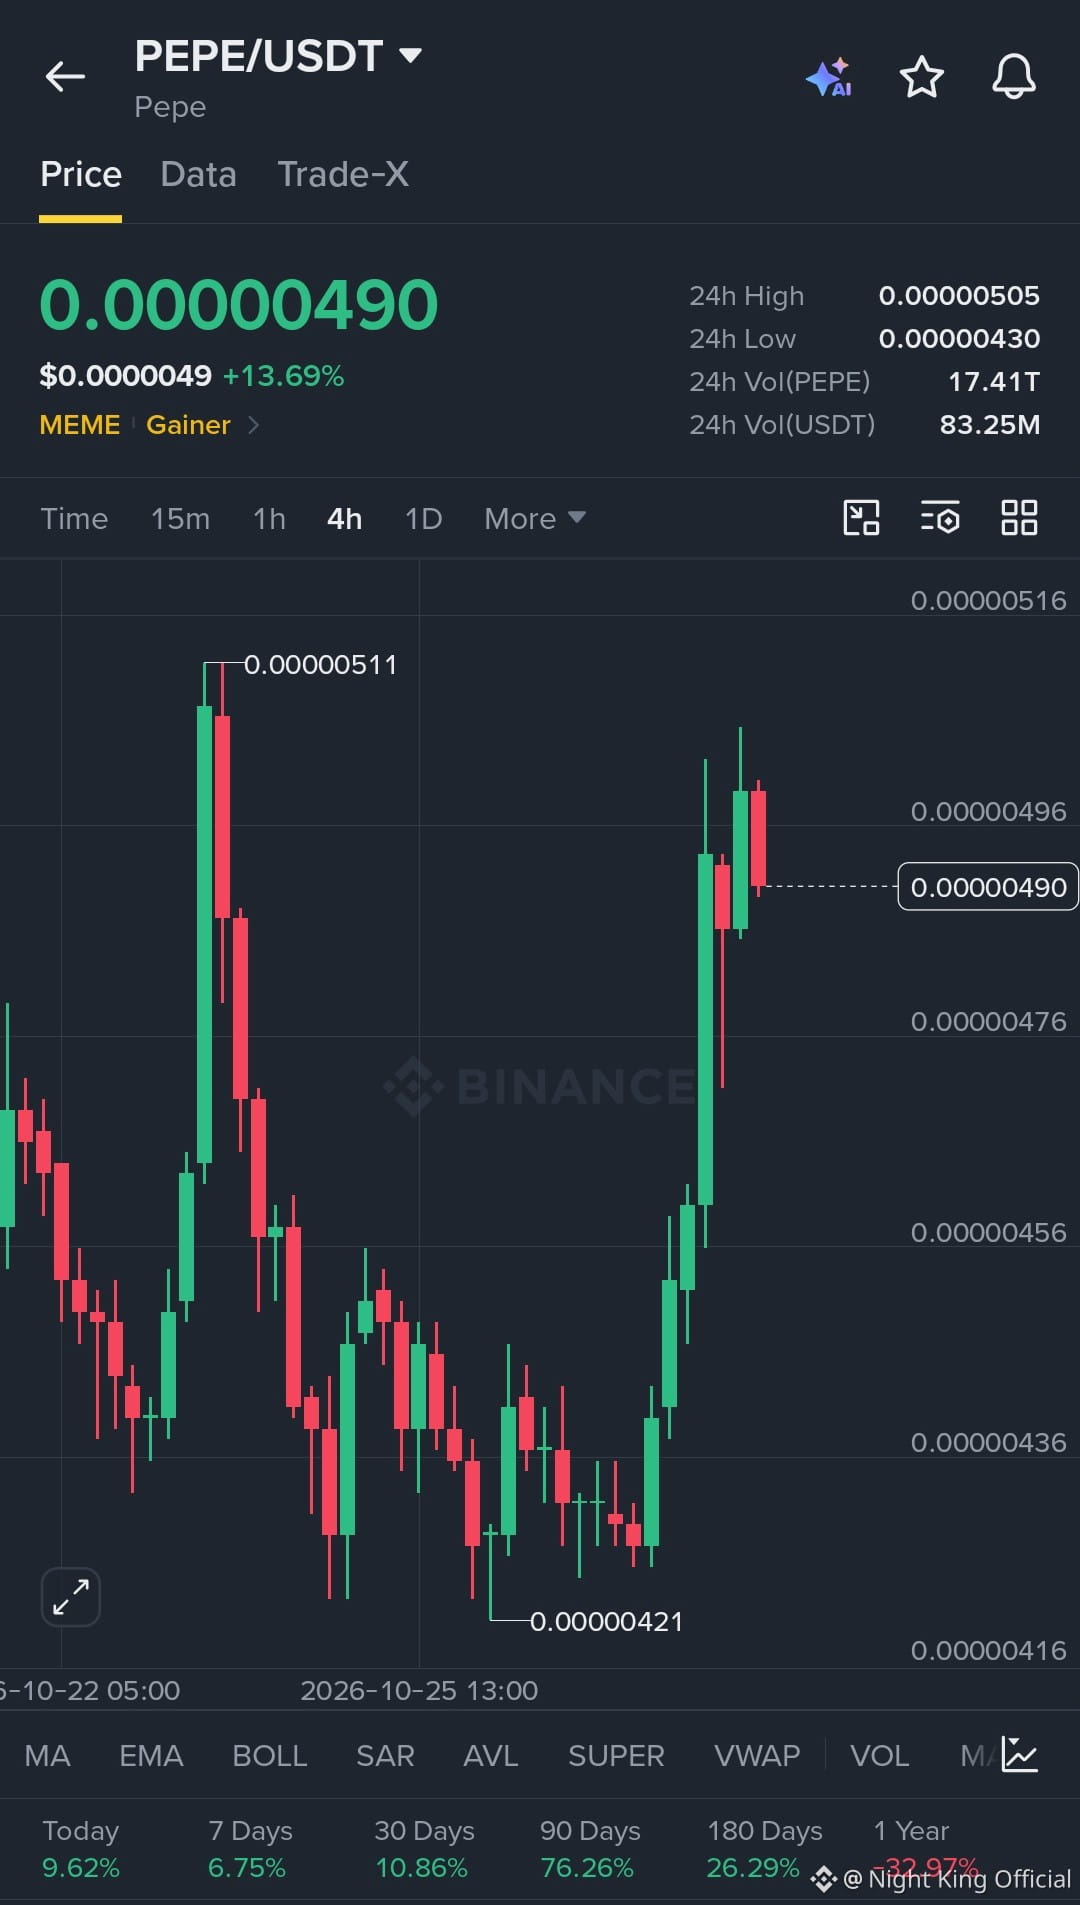
$PEPE /USDT 📈 4H Rebound Faces Resistance
Action: Long
Entry Range: 0.00000476 – 0.00000490
TP1: 0.00000496
TP2: 0.00000505
TP3: 0.00000511
Stop Loss (SL): 4H close below 0.00000430
Technical Analysis: $PEPE has rebounded from the labeled swing low of 0.00000421 on the 4H chart, but the latest candle is red near 0.00000490, with resistance around the 24h High of 0.00000505.
Would you enter this 4H rebound, or wait for confirmation above resistance?
Not financial advice. DYOR.
#PEPE #CryptoSignals #BinanceSquare
{spot}(PEPEUSDT)
$PEPE /USDT 📈 4H Rebound Faces Resistance
Action: Long
Entry Range: 0.00000476 – 0.00000490
TP1: 0.00000496
TP2: 0.00000505
TP3: 0.00000511
Stop Loss (SL): 4H close below 0.00000430
Technical Analysis: $PEPE has rebounded from the labeled swing low of 0.00000421 on the 4H chart, but the latest candle is red near 0.00000490, with resistance around the 24h High of 0.00000505.
Would you enter this 4H rebound, or wait for confirmation above resistance?
Not financial advice. DYOR.
#PEPE #CryptoSignals #BinanceSquare
Action: Long
Entry Range: 0.00000476 – 0.00000490
TP1: 0.00000496
TP2: 0.00000505
TP3: 0.00000511
Stop Loss (SL): 4H close below 0.00000430
Technical Analysis: $PEPE has rebounded from the labeled swing low of 0.00000421 on the 4H chart, but the latest candle is red near 0.00000490, with resistance around the 24h High of 0.00000505.
Would you enter this 4H rebound, or wait for confirmation above resistance?
Not financial advice. DYOR.
#PEPE #CryptoSignals #BinanceSquare
1
78
·
--
O‘suvchi
Tarjimani ko‘rish
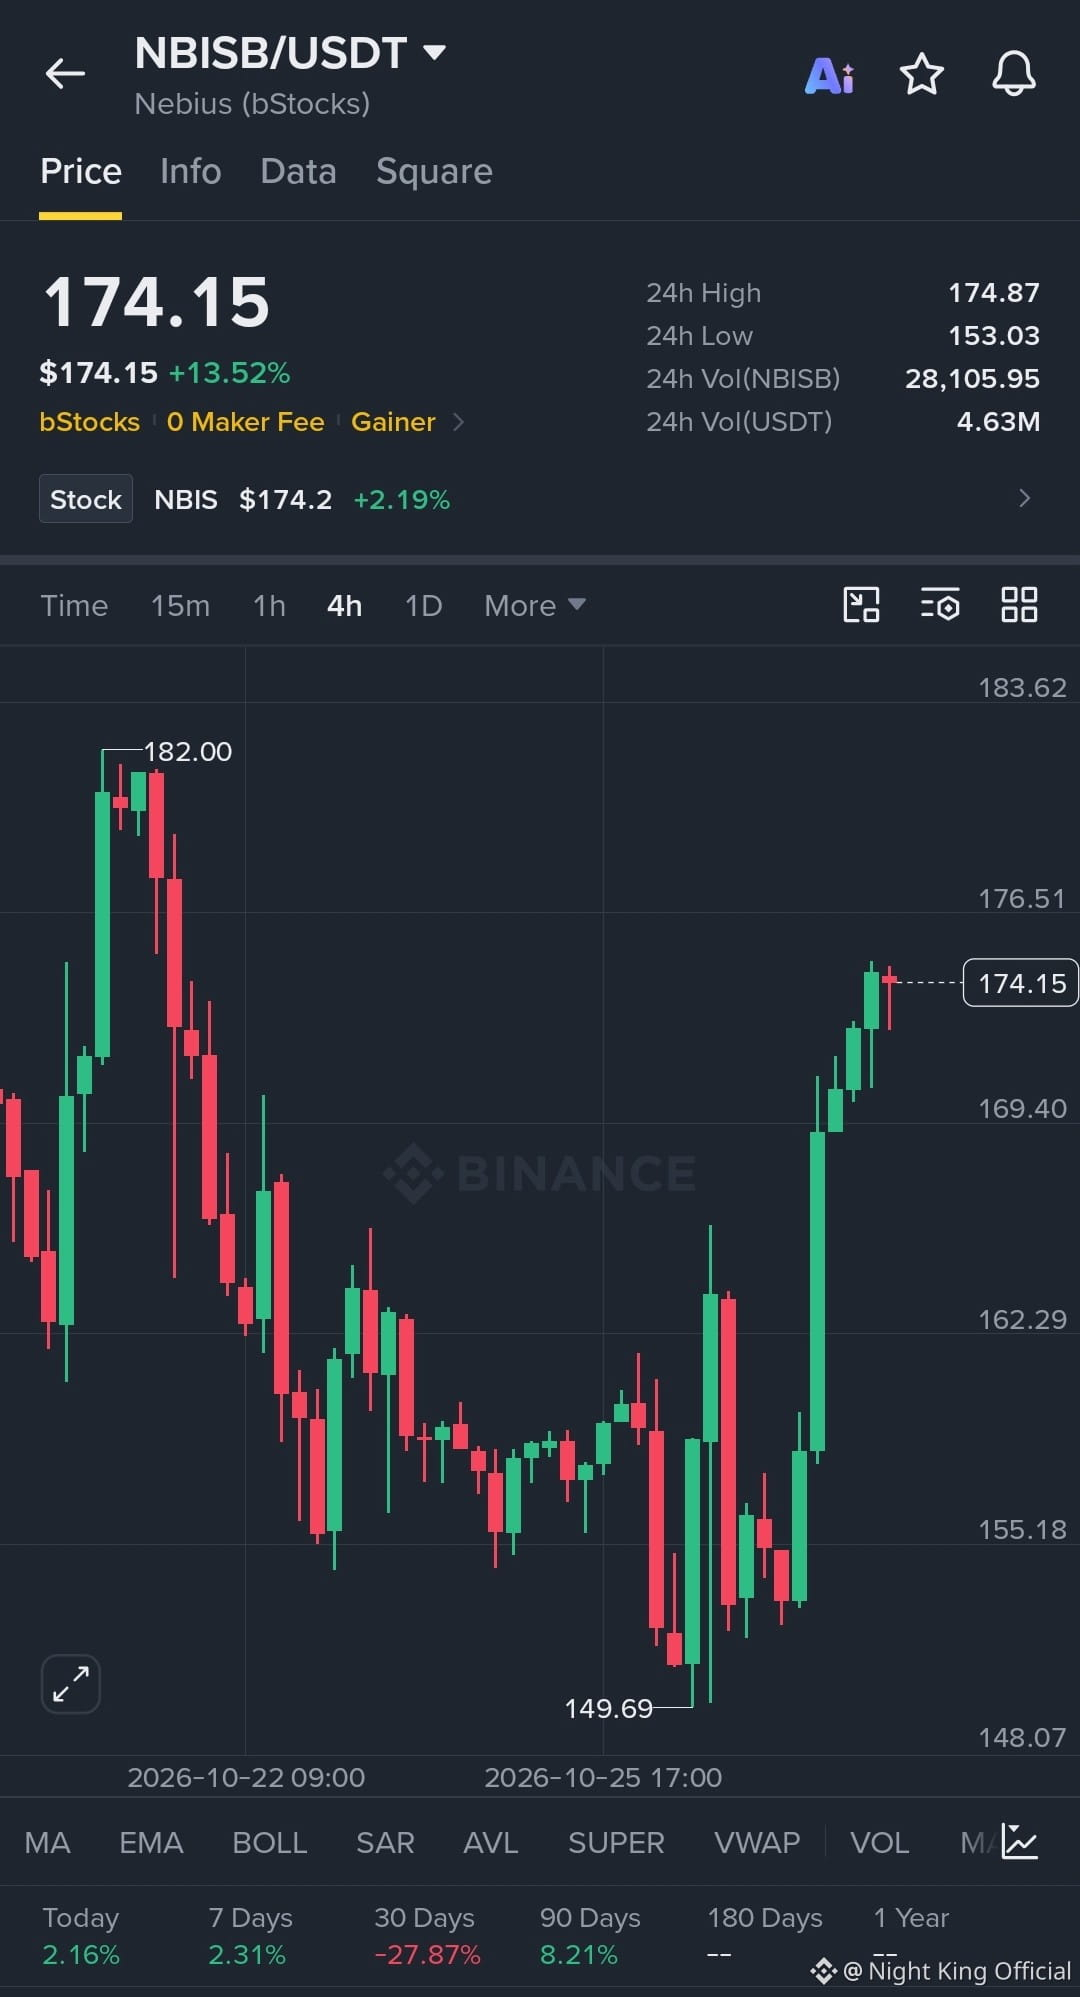
$NBISB Strong Rally Meets the 24h High
Long Plan
Entry Range: 169.40 – 174.15
TP1: 174.87
TP2: 176.51
TP3: 182.00
SL: 4H close below 162.29
Price rallied on the 4H from the 149.69 swing low to just under the 24h High of 174.87, so a pullback toward the 169.40 area would not be surprising before any continuation.
Will $NBISB build above 174.87, or does it cool off first and revisit 169.40?
Not financial advice. DYOR.
#NBISB #BinanceSquare #CryptoSignals
{spot}(NBISBUSDT)
$NBISB Strong Rally Meets the 24h High
Long Plan
Entry Range: 169.40 – 174.15
TP1: 174.87
TP2: 176.51
TP3: 182.00
SL: 4H close below 162.29
Price rallied on the 4H from the 149.69 swing low to just under the 24h High of 174.87, so a pullback toward the 169.40 area would not be surprising before any continuation.
Will $NBISB build above 174.87, or does it cool off first and revisit 169.40?
Not financial advice. DYOR.
#NBISB #BinanceSquare #CryptoSignals
Long Plan
Entry Range: 169.40 – 174.15
TP1: 174.87
TP2: 176.51
TP3: 182.00
SL: 4H close below 162.29
Price rallied on the 4H from the 149.69 swing low to just under the 24h High of 174.87, so a pullback toward the 169.40 area would not be surprising before any continuation.
Will $NBISB build above 174.87, or does it cool off first and revisit 169.40?
Not financial advice. DYOR.
#NBISB #BinanceSquare #CryptoSignals
1
142
Ko‘proq kontentni ko‘rish uchun tizimga kiring
Binance Square'da global kriptovalyuta foydalanuvchilariga qo‘shiling
⚡️ Kriptovalyuta haqida eng so‘nggi va foydali ma’lumotlarni oling.
💬 Dunyoning eng yirik kriptovalyuta birjasi tomonidan ishonchli deb topilgan.
👍 Tasdiqlangan mualliflardan haqiqiy tahlillarni kashf eting.
Email / telefon raqami
Trenddagi mavzular
BinanceWithdrawalScamWarning
51,080 marta koʻrilgan
713 muhokama qilmoqda
Xizmatlar qayta tiklanar ekan, Binance foydalanuvchilarni pul yechish bilan bog‘liq firibgarliklardan ogohlantirdi: u hech qachon haq olmaydi, navbatdagi o‘rinlarni sotmaydi yoki mablag‘larni “seyf”ga ko‘chirishni so‘ramaydi
Binance News
·15 ta layk
·8.5k marta koʻrilgan
USMidtermElections
620,929 marta koʻrilgan
3,281 muhokama qilmoqda
USOctoberNFP-AreRateCutsStillPossible
56,008 marta koʻrilgan
571 muhokama qilmoqda