
Nayeem Apan
618 Postlar

Nayeem Apan
Shikoyat qilish
Foydalanuvchini bloklash
Professional Trader Since 2021 | ICT & SMC Trader | DYOR | X-@nayeem_apan_ | Join My Trade Room |
Ochiq savdo
Tez-tez savdo qiluvchi
5 yil
28 Kuzatilmoqda
1.8K+ Kuzatuvchilar
2.5K+ Yoqdi
Postlar
Portfel
Barchasi
Iqtiboslar
Videolar
Jonli
·
--
O‘suvchi
Tarjimani ko‘rish
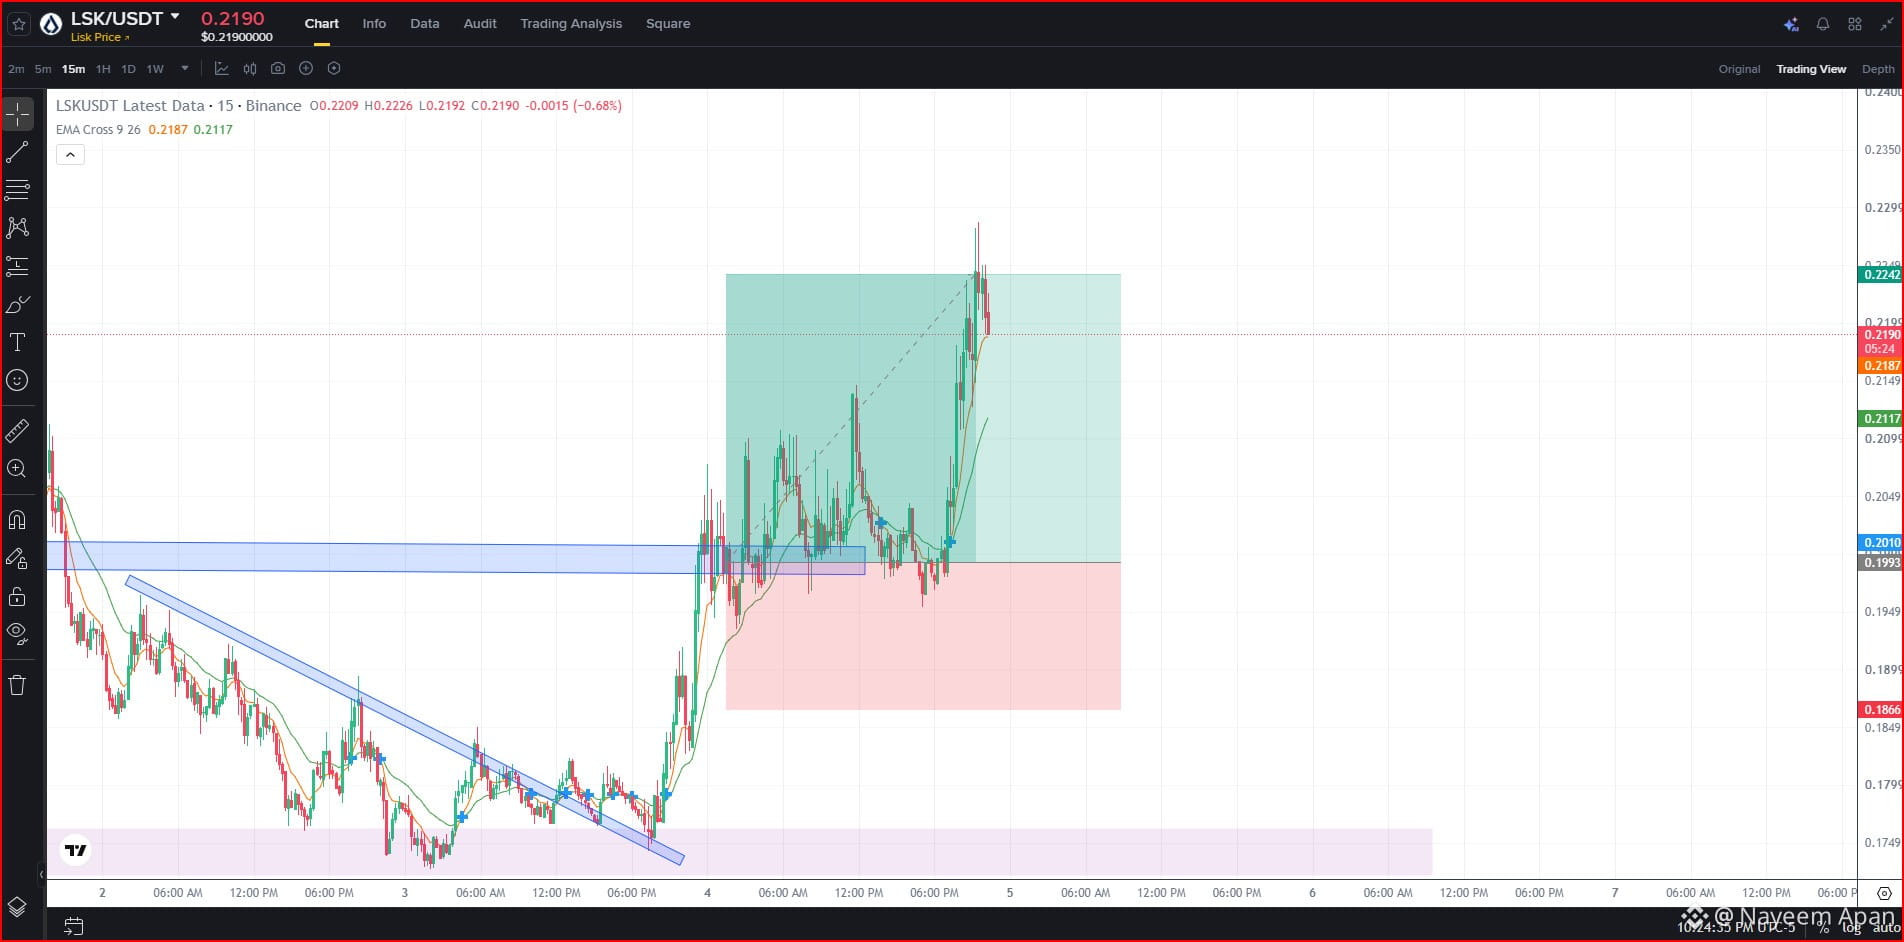
🎯 SIGNAL UPDATE: TAKE PROFIT HIT! ✅
Our previous #LSKUSDT trade has successfully reached TP ! 🚀
📌 Previous Signal Details:
Pair: #LSKUSD
Direction: LONG
Entry: 0.1987
Take Profit Hit: 0.22442
Stop Loss: 0.1866
Result: 12.49% 🔥🔥
📈 Market Follow-Through:
Price moved in our expected direction after the setup was shared. The planned take-profit level has now been reached.
💡 A quick reminder: Every trade carries risk. Always manage position size, protect your capital, and avoid chasing a move after it has already happened.
Another setup successfully completed! More market opportunities ahead. 🔍
Did you catch this move? Let me know below! 👇
#TPHit #cryptotrading #TradingSignals $LSK
{future}(LSKUSDT)
🎯 SIGNAL UPDATE: TAKE PROFIT HIT! ✅
Our previous #LSKUSDT trade has successfully reached TP ! 🚀
📌 Previous Signal Details:
Pair: #LSKUSD
Direction: LONG
Entry: 0.1987
Take Profit Hit: 0.22442
Stop Loss: 0.1866
Result: 12.49% 🔥🔥
📈 Market Follow-Through:
Price moved in our expected direction after the setup was shared. The planned take-profit level has now been reached.
💡 A quick reminder: Every trade carries risk. Always manage position size, protect your capital, and avoid chasing a move after it has already happened.
Another setup successfully completed! More market opportunities ahead. 🔍
Did you catch this move? Let me know below! 👇
#TPHit #cryptotrading #TradingSignals $LSK
Our previous #LSKUSDT trade has successfully reached TP ! 🚀
📌 Previous Signal Details:
Pair: #LSKUSD
Direction: LONG
Entry: 0.1987
Take Profit Hit: 0.22442
Stop Loss: 0.1866
Result: 12.49% 🔥🔥
📈 Market Follow-Through:
Price moved in our expected direction after the setup was shared. The planned take-profit level has now been reached.
💡 A quick reminder: Every trade carries risk. Always manage position size, protect your capital, and avoid chasing a move after it has already happened.
Another setup successfully completed! More market opportunities ahead. 🔍
Did you catch this move? Let me know below! 👇
#TPHit #cryptotrading #TradingSignals $LSK
Nayeem Apan
·
--
LSKUSDT PUMPS HIGH!!
💥💥HUGE VOLATILE COIN! ONLY EXPERIENCED ONES CAN TAKE THIS SETUP!!💥💥
Coin- #LSKUSDT Setup- Long
We can see price is consolidating on the resistance , still less sellers are being trap, price can consolidate a little bit for more fuel. It can also give a wick from a little downside. But it will go UP for Sure according to my Analysis. MACD showing huge upward curves meaning a Bullish hit on the above.
Liquidation heatmap confirms us the bullish movement by showing us the how much quantity of Liquidity is resting above there.
Entry-0.1987👈
SL-0.1866$👈
Leverage- 4x👈
TP-0.2242👈
Coin- #LSKUSDT Setup- Long
We can see price is consolidating on the resistance , still less sellers are being trap, price can consolidate a little bit for more fuel. It can also give a wick from a little downside. But it will go UP for Sure according to my Analysis. MACD showing huge upward curves meaning a Bullish hit on the above.
Liquidation heatmap confirms us the bullish movement by showing us the how much quantity of Liquidity is resting above there.
Entry-0.1987👈
SL-0.1866$👈
Leverage- 4x👈
TP-0.2242👈
67
·
--
O‘suvchi
Tarjimani ko‘rish
🎯 SIGNAL UPDATE: TAKE PROFIT HIT! ✅
Our previous #NEARUSDT trade has successfully reached TP ! 🚀
📌 Previous Signal Details:
Pair: #nearusdt.
Direction: LONG
Entry: 3.871
Take Profit Hit: 4.054
Stop Loss: 3.871
Result: 4.72%
📈 Market Follow-Through:
Price moved in our expected direction after the setup was shared. The planned take-profit level has now been reached.
💡 A quick reminder: Every trade carries risk. Always manage position size, protect your capital, and avoid chasing a move after it has already happened.
Another setup successfully completed! More market opportunities ahead. 🔍
Did you catch this move? Let me know below! 👇
#TPHit #cryptotrading $NEAR
{future}(NEARUSDT)
🎯 SIGNAL UPDATE: TAKE PROFIT HIT! ✅
Our previous #NEARUSDT trade has successfully reached TP ! 🚀
📌 Previous Signal Details:
Pair: #nearusdt.
Direction: LONG
Entry: 3.871
Take Profit Hit: 4.054
Stop Loss: 3.871
Result: 4.72%
📈 Market Follow-Through:
Price moved in our expected direction after the setup was shared. The planned take-profit level has now been reached.
💡 A quick reminder: Every trade carries risk. Always manage position size, protect your capital, and avoid chasing a move after it has already happened.
Another setup successfully completed! More market opportunities ahead. 🔍
Did you catch this move? Let me know below! 👇
#TPHit #cryptotrading $NEAR
Our previous #NEARUSDT trade has successfully reached TP ! 🚀
📌 Previous Signal Details:
Pair: #nearusdt.
Direction: LONG
Entry: 3.871
Take Profit Hit: 4.054
Stop Loss: 3.871
Result: 4.72%
📈 Market Follow-Through:
Price moved in our expected direction after the setup was shared. The planned take-profit level has now been reached.
💡 A quick reminder: Every trade carries risk. Always manage position size, protect your capital, and avoid chasing a move after it has already happened.
Another setup successfully completed! More market opportunities ahead. 🔍
Did you catch this move? Let me know below! 👇
#TPHit #cryptotrading $NEAR
Nayeem Apan
·
--
NEAR MARKET UPDATE!!
#NEARUSDT.P Signal- Long
This Coin will rise up. WHy ? Because price has broke the support will the confirmation from EMA CROSS ribbon- that shows us that price is now hunting for the liquidity that are resting above. On the correction we can take LONG entry. The setup is given down to my post !
Liquidation heatmap just shows us the liquidity levels, so that we can know how much market can go to that direction if it is on the way of the move.
Entry- 3.871
SL-3.781
TP-4.054
Leverage- 6x
$NEAR
This Coin will rise up. WHy ? Because price has broke the support will the confirmation from EMA CROSS ribbon- that shows us that price is now hunting for the liquidity that are resting above. On the correction we can take LONG entry. The setup is given down to my post !
Liquidation heatmap just shows us the liquidity levels, so that we can know how much market can go to that direction if it is on the way of the move.
Entry- 3.871
SL-3.781
TP-4.054
Leverage- 6x
$NEAR
109
·
--
O‘suvchi
🎯 SIGNAL YANGILANISHI: TAKE PROFIT ISHLADI! ✅
Oldingi #BNBUSDT savdomiz TP darajasiga muvaffaqiyatli yetdi! 🚀
📌 Oldingi signal tafsilotlari:
Juftlik: #bnb
Yo‘nalish: LONG
Kirish: 697
Take Profit ishga tushdi: 717.50
Stop Loss: 691
Natija: 2.92% (SKALPING)
📈 Bozor harakati:
Signal ulashilgandan so‘ng narx biz kutgan yo‘nalishda harakatlandi. Rejalashtirilgan take-profit darajasiga yetildi.
💡 Eslatma: Har bir savdo xavf bilan bog‘liq. Har doim pozitsiya hajmini boshqaring, kapitalingizni himoya qiling va narx harakati allaqachon yuz berganidan keyin uning ortidan quvmang.
🔗 Asl signal: [BNB SIGNAL](https://www.binance.com/en/square/post/384533881673050)
Yana bir savdo rejasi muvaffaqiyatli yakunlandi! Oldinda bozorning yana ko‘plab imkoniyatlari bor. 🔍
Bu harakatni qo‘lga kiritdingizmi? Quyida menga xabar bering! 👇
#TPHit #smc #BinanceSquar $BNB
{future}(BNBUSDT)
🎯 SIGNAL YANGILANISHI: TAKE PROFIT ISHLADI! ✅
Oldingi #BNBUSDT savdomiz TP darajasiga muvaffaqiyatli yetdi! 🚀
📌 Oldingi signal tafsilotlari:
Juftlik: #bnb
Yo‘nalish: LONG
Kirish: 697
Take Profit ishga tushdi: 717.50
Stop Loss: 691
Natija: 2.92% (SKALPING)
📈 Bozor harakati:
Signal ulashilgandan so‘ng narx biz kutgan yo‘nalishda harakatlandi. Rejalashtirilgan take-profit darajasiga yetildi.
💡 Eslatma: Har bir savdo xavf bilan bog‘liq. Har doim pozitsiya hajmini boshqaring, kapitalingizni himoya qiling va narx harakati allaqachon yuz berganidan keyin uning ortidan quvmang.
🔗 Asl signal: BNB SIGNAL
Yana bir savdo rejasi muvaffaqiyatli yakunlandi! Oldinda bozorning yana ko‘plab imkoniyatlari bor. 🔍
Bu harakatni qo‘lga kiritdingizmi? Quyida menga xabar bering! 👇
#TPHit #smc #BinanceSquar $BNB
Oldingi #BNBUSDT savdomiz TP darajasiga muvaffaqiyatli yetdi! 🚀
📌 Oldingi signal tafsilotlari:
Juftlik: #bnb
Yo‘nalish: LONG
Kirish: 697
Take Profit ishga tushdi: 717.50
Stop Loss: 691
Natija: 2.92% (SKALPING)
📈 Bozor harakati:
Signal ulashilgandan so‘ng narx biz kutgan yo‘nalishda harakatlandi. Rejalashtirilgan take-profit darajasiga yetildi.
💡 Eslatma: Har bir savdo xavf bilan bog‘liq. Har doim pozitsiya hajmini boshqaring, kapitalingizni himoya qiling va narx harakati allaqachon yuz berganidan keyin uning ortidan quvmang.
🔗 Asl signal: BNB SIGNAL
Yana bir savdo rejasi muvaffaqiyatli yakunlandi! Oldinda bozorning yana ko‘plab imkoniyatlari bor. 🔍
Bu harakatni qo‘lga kiritdingizmi? Quyida menga xabar bering! 👇
#TPHit #smc #BinanceSquar $BNB
Nayeem Apan
·
--
BNB NARXI KESKIN KO‘TARILADI!!
#BNBUSDT Signal- Long👆👆
👉👉POSTIMNI DIQQAT BILAN O‘QING👈👈
👇👇👇👇👇👇👇👇👇👇👇👇
Narx SSL va MSS darajalarini yuqoriga yorib o‘tganini ko‘rishimiz mumkin. Narx tuzatish kiritib, biroz pasayishi mumkin. Shu tuzatish vaqtida Long pozitsiyasiga kiramiz.
MACD ham kuchli o‘sish momentumini ko‘rsatmoqda.
Likvidatsiya xaritasida BNB’ning 720 narxidan yuqorida katta likvidlik to‘planib turganini ko‘rishimiz mumkin. Shu sababli bozor bu narxdan yuqoriga keskin harakat qilishi mumkin. Bizga aynan shunday skalping harakati kerak. Pastki tomonda esa deyarli umuman likvidlik yo‘q.
👉👉POSTIMNI DIQQAT BILAN O‘QING👈👈
👇👇👇👇👇👇👇👇👇👇👇👇
Narx SSL va MSS darajalarini yuqoriga yorib o‘tganini ko‘rishimiz mumkin. Narx tuzatish kiritib, biroz pasayishi mumkin. Shu tuzatish vaqtida Long pozitsiyasiga kiramiz.
MACD ham kuchli o‘sish momentumini ko‘rsatmoqda.
Likvidatsiya xaritasida BNB’ning 720 narxidan yuqorida katta likvidlik to‘planib turganini ko‘rishimiz mumkin. Shu sababli bozor bu narxdan yuqoriga keskin harakat qilishi mumkin. Bizga aynan shunday skalping harakati kerak. Pastki tomonda esa deyarli umuman likvidlik yo‘q.

73
·
--
Maqola
Tarjimani ko‘rish
NEAR MARKET UPDATE!!#NEARUSDT.P Signal- Long
This Coin will rise up. WHy ? Because price has broke the support will the confirmation from EMA CROSS ribbon- that shows us that price is now hunting for the liquidity that are resting above. On the correction we can take LONG entry. The setup is given down to my post !
Liquidation heatmap just shows us the liquidity levels, so that we can know how much market can go to that direction if it is on the way of the move.
Entry- 3.871
SL-3.781
TP-4.054
Leverage- 6x
$NEAR
{future}(NEARUSDT)
NEAR MARKET UPDATE!!
#NEARUSDT.P Signal- Long
This Coin will rise up. WHy ? Because price has broke the support will the confirmation from EMA CROSS ribbon- that shows us that price is now hunting for the liquidity that are resting above. On the correction we can take LONG entry. The setup is given down to my post !
Liquidation heatmap just shows us the liquidity levels, so that we can know how much market can go to that direction if it is on the way of the move.
Entry- 3.871
SL-3.781
TP-4.054
Leverage- 6x
$NEAR
This Coin will rise up. WHy ? Because price has broke the support will the confirmation from EMA CROSS ribbon- that shows us that price is now hunting for the liquidity that are resting above. On the correction we can take LONG entry. The setup is given down to my post !
Liquidation heatmap just shows us the liquidity levels, so that we can know how much market can go to that direction if it is on the way of the move.
Entry- 3.871
SL-3.781
TP-4.054
Leverage- 6x
$NEAR
1
2
105
·
--
Maqola
Tarjimani ko‘rish
LSKUSDT PUMPS HIGH!!💥💥HUGE VOLATILE COIN! ONLY EXPERIENCED ONES CAN TAKE THIS SETUP!!💥💥
Coin- #LSKUSDT Setup- Long
We can see price is consolidating on the resistance , still less sellers are being trap, price can consolidate a little bit for more fuel. It can also give a wick from a little downside. But it will go UP for Sure according to my Analysis. MACD showing huge upward curves meaning a Bullish hit on the above.
Liquidation heatmap confirms us the bullish movement by showing us the how much quantity of Liquidity is resting above there.
Entry-0.1987👈
SL-0.1866$👈
Leverage- 4x👈
TP-0.2242👈
LSKUSDT PUMPS HIGH!!
💥💥HUGE VOLATILE COIN! ONLY EXPERIENCED ONES CAN TAKE THIS SETUP!!💥💥
Coin- #LSKUSDT Setup- Long
We can see price is consolidating on the resistance , still less sellers are being trap, price can consolidate a little bit for more fuel. It can also give a wick from a little downside. But it will go UP for Sure according to my Analysis. MACD showing huge upward curves meaning a Bullish hit on the above.
Liquidation heatmap confirms us the bullish movement by showing us the how much quantity of Liquidity is resting above there.
Entry-0.1987👈
SL-0.1866$👈
Leverage- 4x👈
TP-0.2242👈
Coin- #LSKUSDT Setup- Long
We can see price is consolidating on the resistance , still less sellers are being trap, price can consolidate a little bit for more fuel. It can also give a wick from a little downside. But it will go UP for Sure according to my Analysis. MACD showing huge upward curves meaning a Bullish hit on the above.
Liquidation heatmap confirms us the bullish movement by showing us the how much quantity of Liquidity is resting above there.
Entry-0.1987👈
SL-0.1866$👈
Leverage- 4x👈
TP-0.2242👈
1
2
260
·
--
Maqola
BNB NARXI KESKIN KO‘TARILADI!!#BNBUSDT Signal- Long👆👆
👉👉POSTIMNI DIQQAT BILAN O‘QING👈👈
👇👇👇👇👇👇👇👇👇👇👇👇
Narx SSL va MSS darajalarini yuqoriga yorib o‘tganini ko‘rishimiz mumkin. Narx tuzatish kiritib, biroz pasayishi mumkin. Shu tuzatish vaqtida Long pozitsiyasiga kiramiz.
MACD ham kuchli o‘sish momentumini ko‘rsatmoqda.
Likvidatsiya xaritasida BNB’ning 720 narxidan yuqorida katta likvidlik to‘planib turganini ko‘rishimiz mumkin. Shu sababli bozor bu narxdan yuqoriga keskin harakat qilishi mumkin. Bizga aynan shunday skalping harakati kerak. Pastki tomonda esa deyarli umuman likvidlik yo‘q.
BNB NARXI KESKIN KO‘TARILADI!!
#BNBUSDT Signal- Long👆👆
👉👉POSTIMNI DIQQAT BILAN O‘QING👈👈
👇👇👇👇👇👇👇👇👇👇👇👇
Narx SSL va MSS darajalarini yuqoriga yorib o‘tganini ko‘rishimiz mumkin. Narx tuzatish kiritib, biroz pasayishi mumkin. Shu tuzatish vaqtida Long pozitsiyasiga kiramiz.
MACD ham kuchli o‘sish momentumini ko‘rsatmoqda.
Likvidatsiya xaritasida BNB’ning 720 narxidan yuqorida katta likvidlik to‘planib turganini ko‘rishimiz mumkin. Shu sababli bozor bu narxdan yuqoriga keskin harakat qilishi mumkin. Bizga aynan shunday skalping harakati kerak. Pastki tomonda esa deyarli umuman likvidlik yo‘q.
👉👉POSTIMNI DIQQAT BILAN O‘QING👈👈
👇👇👇👇👇👇👇👇👇👇👇👇
Narx SSL va MSS darajalarini yuqoriga yorib o‘tganini ko‘rishimiz mumkin. Narx tuzatish kiritib, biroz pasayishi mumkin. Shu tuzatish vaqtida Long pozitsiyasiga kiramiz.
MACD ham kuchli o‘sish momentumini ko‘rsatmoqda.
Likvidatsiya xaritasida BNB’ning 720 narxidan yuqorida katta likvidlik to‘planib turganini ko‘rishimiz mumkin. Shu sababli bozor bu narxdan yuqoriga keskin harakat qilishi mumkin. Bizga aynan shunday skalping harakati kerak. Pastki tomonda esa deyarli umuman likvidlik yo‘q.
1
2
113
·
--
Pasayuvchi
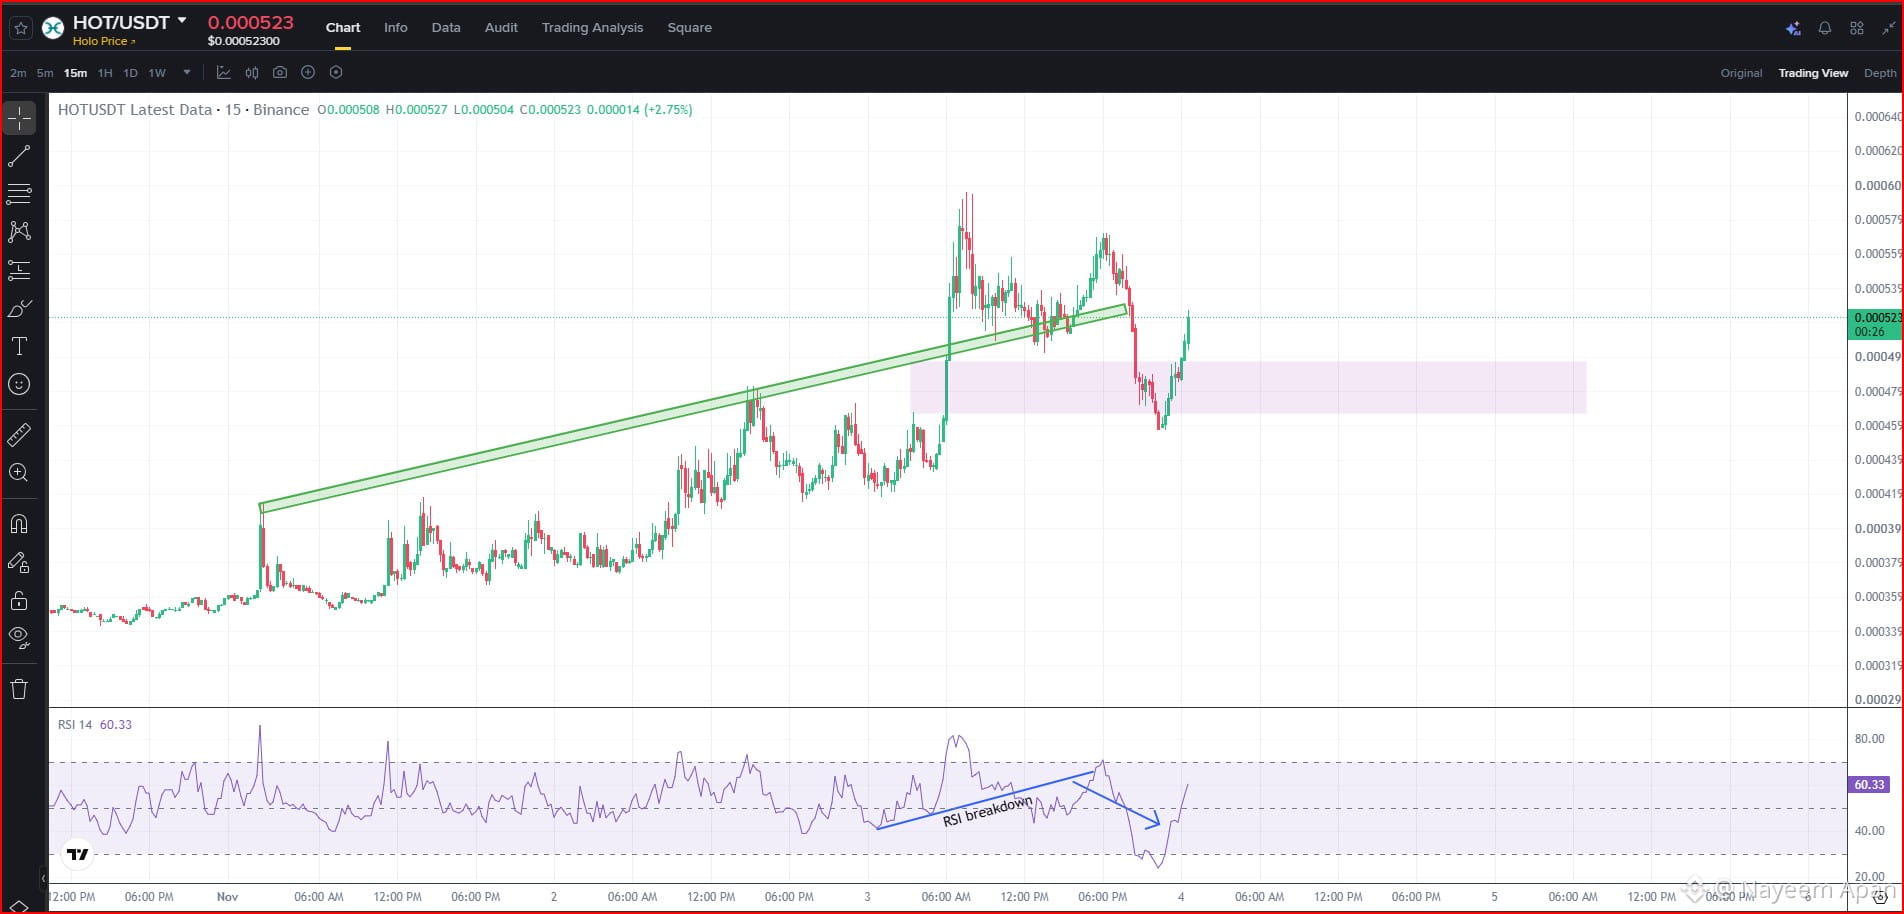
#hotusdt Aytganimdek, 11 soat oldin bu token keskin tushishini aytgandim. Ko‘rib turganingizdek, narx 12% dan ko‘proq tushdi. 💪💪
KO‘PROQ YANGILIKLAR UCHUN MENI KUZATIB BORING!!👈👈
$HOT
{future}(HOTUSDT)
#hotusdt Aytganimdek, 11 soat oldin bu token keskin tushishini aytgandim. Ko‘rib turganingizdek, narx 12% dan ko‘proq tushdi. 💪💪
KO‘PROQ YANGILIKLAR UCHUN MENI KUZATIB BORING!!👈👈
$HOT
KO‘PROQ YANGILIKLAR UCHUN MENI KUZATIB BORING!!👈👈
$HOT
Nayeem Apan
·
--
HOTUSDT YANGILANISHI!!
#hotusdt Bu coin kuchli pasayish signalini ko‘rsatmoqda. Bu coin tushadi. U xaridorlar uchun tuzoq qo‘ymoqda va istalgan vaqtda keskin qulab tushishi mumkin.
RSI — kuchli pasayish signali!👇👇
Likvidatsiya issiqlik xaritasida yuqori tomonda umuman likvidlik yo‘qligini ko‘rishimiz mumkin. Ammo likvidlik hosil qilish uchun narx yana biroz yonlama harakatlanishi mumkin.
$HOT
👈
RSI — kuchli pasayish signali!👇👇
Likvidatsiya issiqlik xaritasida yuqori tomonda umuman likvidlik yo‘qligini ko‘rishimiz mumkin. Ammo likvidlik hosil qilish uchun narx yana biroz yonlama harakatlanishi mumkin.
$HOT
👈
2
355
·
--
O‘suvchi
Tarjimani ko‘rish
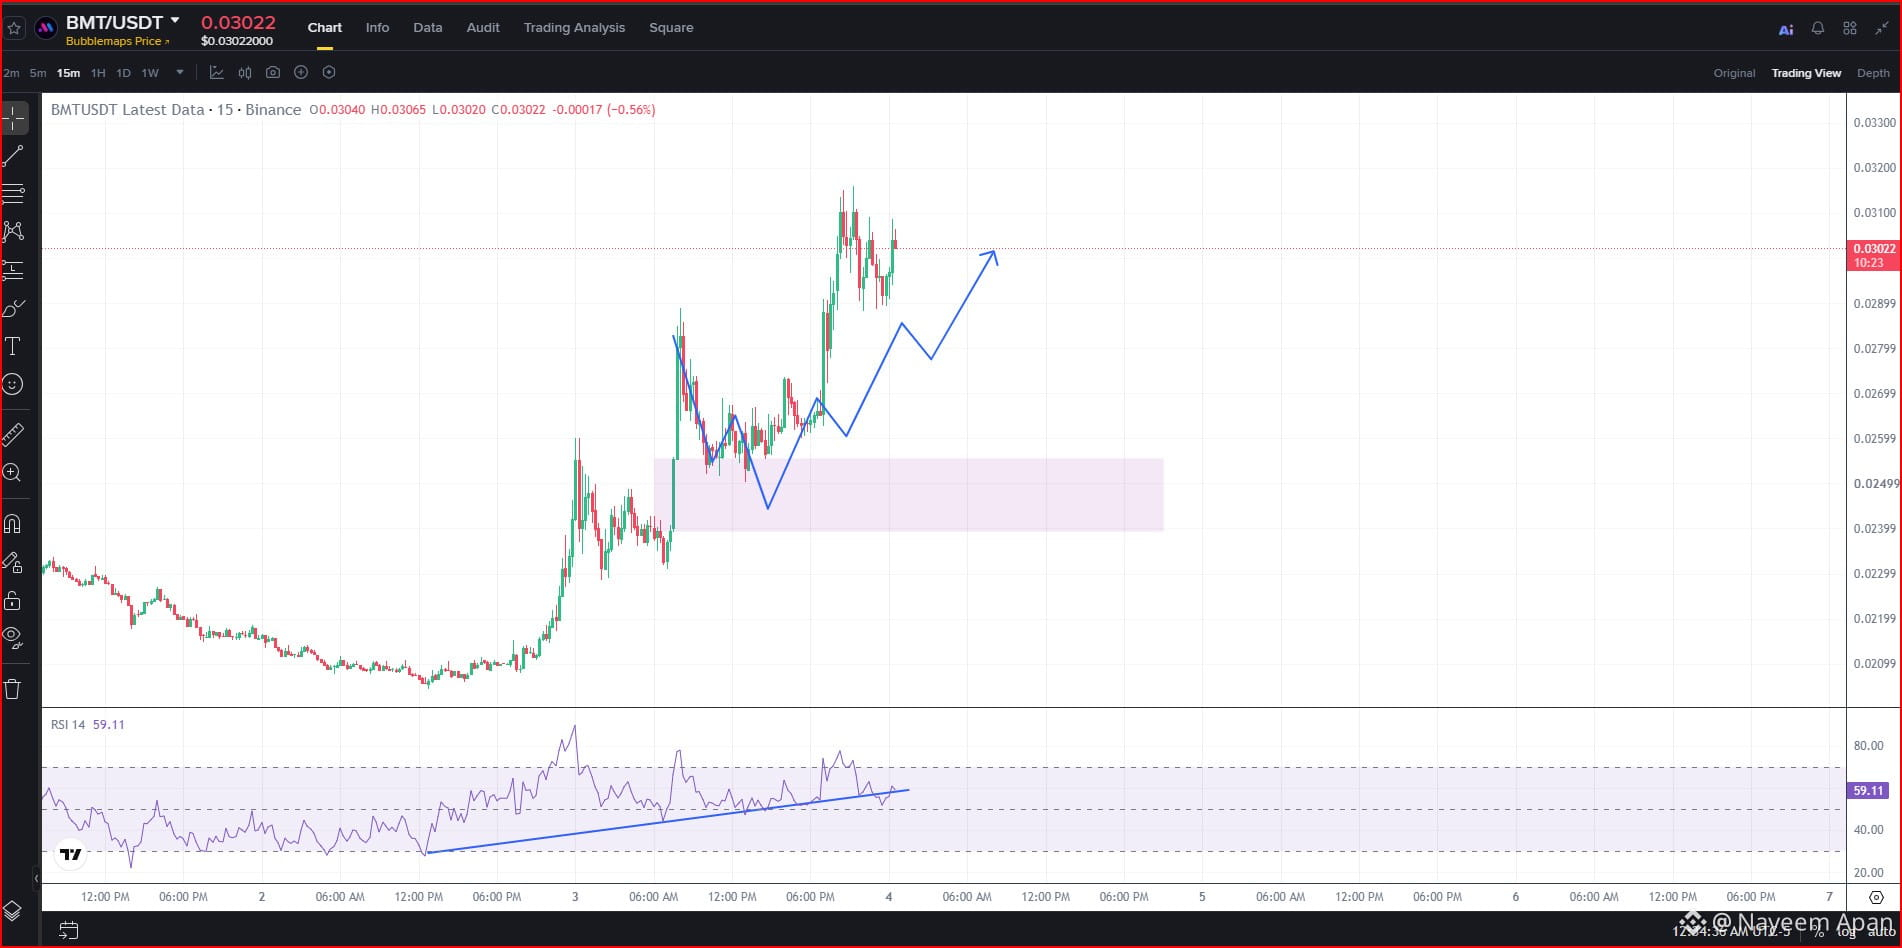
#BMTUSDT I told you guys that price will jump form this zone! And as you can already see that price did exactly what I said.
$BMT
{future}(BMTUSDT)
#BMTUSDT I told you guys that price will jump form this zone! And as you can already see that price did exactly what I said.
$BMT
$BMT
Nayeem Apan
·
--
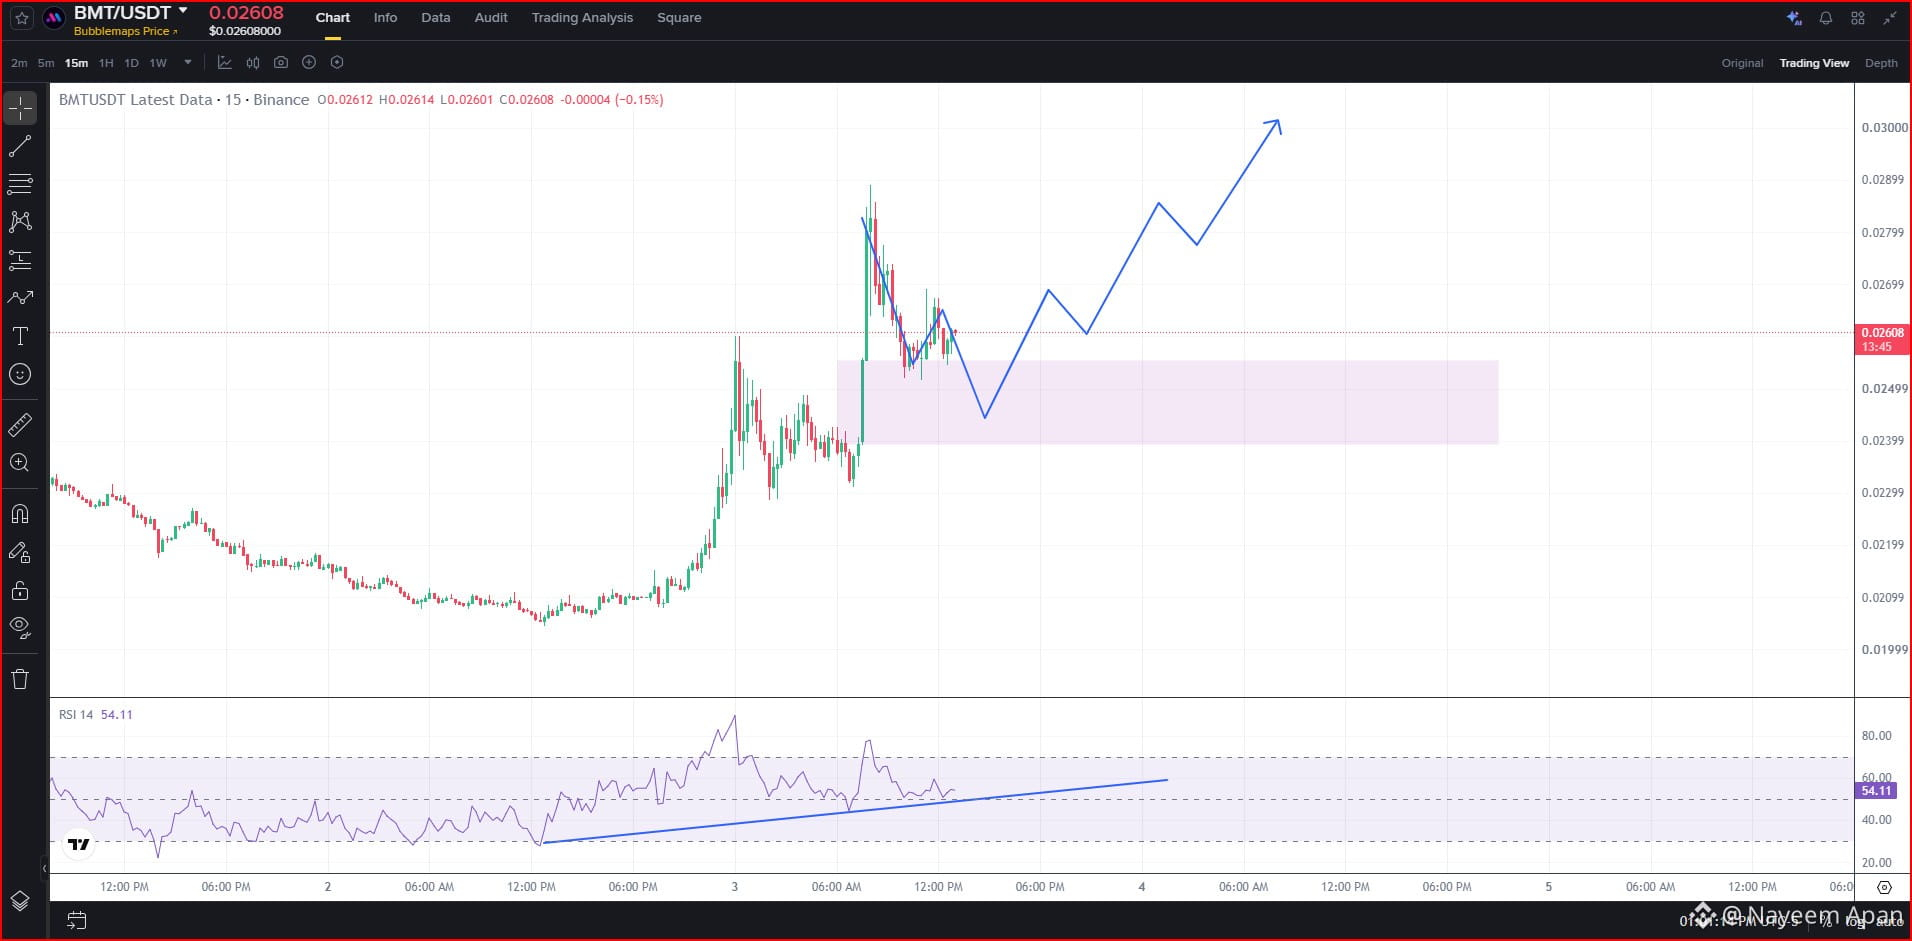
O‘suvchiCoin- #BMTUSDT Volatile Coin. Anytime this coin come a little bit closer.
RSI has already showing Bullishness.
Signal- Long 👈👈 #Bubblemaps
$BMT
RSI has already showing Bullishness.
Signal- Long 👈👈 #Bubblemaps
$BMT
111
·
--
O‘suvchi
Tarjimani ko‘rish
Coin- #BMTUSDT Volatile Coin. Anytime this coin come a little bit closer.
RSI has already showing Bullishness.
Signal- Long 👈👈 #Bubblemaps
$BMT
{future}(BMTUSDT)
Coin- #BMTUSDT Volatile Coin. Anytime this coin come a little bit closer.
RSI has already showing Bullishness.
Signal- Long 👈👈 #Bubblemaps
$BMT
RSI has already showing Bullishness.
Signal- Long 👈👈 #Bubblemaps
$BMT
1
1
239
·
--
Pasayuvchi
Tarjimani ko‘rish
Take Profit Hit Guys!!💥💥
Take Profit Hit Guys!!💥💥
Nayeem Apan
·
--
SOLV TOKEN WILL CRASH!!
#SOLVUSDT Signal- SHORT!!
Entry- 0.004691
SL-0.004875
Leverage- 5x-8x.
TP- 0.004247
This coin will fall more, the cut is so deep that the bleeding will take time to stop!! It has taken a lot of Liquidity from above & also price gave a Bearish MSS. I do not see any rejection or I do not see any buyers pushing it at all.
In the Liquidation Heatmap, we can also see that a lot of liquidity is left in the lower price of the chart. No buyers at all.
$SOLV
💥💥
Entry- 0.004691
SL-0.004875
Leverage- 5x-8x.
TP- 0.004247
This coin will fall more, the cut is so deep that the bleeding will take time to stop!! It has taken a lot of Liquidity from above & also price gave a Bearish MSS. I do not see any rejection or I do not see any buyers pushing it at all.
In the Liquidation Heatmap, we can also see that a lot of liquidity is left in the lower price of the chart. No buyers at all.
$SOLV
💥💥

29
·
--

Maqola
HOTUSDT YANGILANISHI!!#hotusdt Bu coin kuchli pasayish signalini ko‘rsatmoqda. Bu coin tushadi. U xaridorlar uchun tuzoq qo‘ymoqda va istalgan vaqtda keskin qulab tushishi mumkin.
RSI — kuchli pasayish signali!👇👇
Likvidatsiya issiqlik xaritasida yuqori tomonda umuman likvidlik yo‘qligini ko‘rishimiz mumkin. Ammo likvidlik hosil qilish uchun narx yana biroz yonlama harakatlanishi mumkin.
$HOT
👈
HOTUSDT YANGILANISHI!!
#hotusdt Bu coin kuchli pasayish signalini ko‘rsatmoqda. Bu coin tushadi. U xaridorlar uchun tuzoq qo‘ymoqda va istalgan vaqtda keskin qulab tushishi mumkin.
RSI — kuchli pasayish signali!👇👇
Likvidatsiya issiqlik xaritasida yuqori tomonda umuman likvidlik yo‘qligini ko‘rishimiz mumkin. Ammo likvidlik hosil qilish uchun narx yana biroz yonlama harakatlanishi mumkin.
$HOT
👈
RSI — kuchli pasayish signali!👇👇
Likvidatsiya issiqlik xaritasida yuqori tomonda umuman likvidlik yo‘qligini ko‘rishimiz mumkin. Ammo likvidlik hosil qilish uchun narx yana biroz yonlama harakatlanishi mumkin.
$HOT
👈
1
1
244
·
--
Maqola
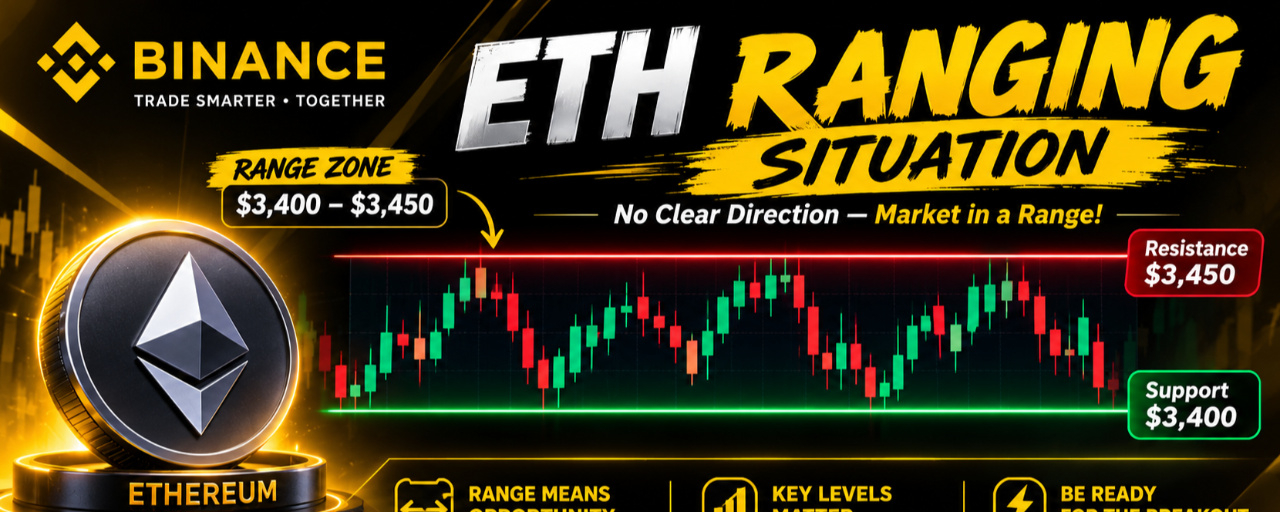
Ethereum yangilanishi!Holat: diapazonda harakat!!
Menimcha, narx hozir diapazonda harakatlanyapti. Narx ko‘tarilishi mumkin deb o‘ylagandim, ammo men kutgan darajada emas. Shuning uchun hozircha grafikdan chetda turaman. Nyu-York sessiyasi allaqachon anchagina likvidlikni yig‘ib oldi, lekin biz bu imkoniyatdan foydalana olmadik. Hechqisi yo‘q, keyinroq imkoniyatlar tez-tez uchrab turadi. Ungacha grafikdan chetda turamiz.
Likvidatsiyalar issiqlik xaritasi likvidlik allaqachon olinganini ko‘rsatadi, ammo biz kutgan usulda emas.
$ETH
Ethereum yangilanishi!
Holat: diapazonda harakat!!
Menimcha, narx hozir diapazonda harakatlanyapti. Narx ko‘tarilishi mumkin deb o‘ylagandim, ammo men kutgan darajada emas. Shuning uchun hozircha grafikdan chetda turaman. Nyu-York sessiyasi allaqachon anchagina likvidlikni yig‘ib oldi, lekin biz bu imkoniyatdan foydalana olmadik. Hechqisi yo‘q, keyinroq imkoniyatlar tez-tez uchrab turadi. Ungacha grafikdan chetda turamiz.
Likvidatsiyalar issiqlik xaritasi likvidlik allaqachon olinganini ko‘rsatadi, ammo biz kutgan usulda emas.
$ETH
Menimcha, narx hozir diapazonda harakatlanyapti. Narx ko‘tarilishi mumkin deb o‘ylagandim, ammo men kutgan darajada emas. Shuning uchun hozircha grafikdan chetda turaman. Nyu-York sessiyasi allaqachon anchagina likvidlikni yig‘ib oldi, lekin biz bu imkoniyatdan foydalana olmadik. Hechqisi yo‘q, keyinroq imkoniyatlar tez-tez uchrab turadi. Ungacha grafikdan chetda turamiz.
Likvidatsiyalar issiqlik xaritasi likvidlik allaqachon olinganini ko‘rsatadi, ammo biz kutgan usulda emas.
$ETH
176
·
--

Maqola
Tarjimani ko‘rish
SCALPING SETUP FOR ETCUSDT!#ETCUSDT Signal-LONG!!
Entry- 7.44😉
Leverage-8x💥
READ MY POST CAREFULLY
SL-7.31(Don't forget to trial your SL)👻
TP-7.73⭐
As we can see on the chart that price has given a breakout on the Long side by trapping the sellers. Now buyers are in control. A little rejection can come but eventually price will rise up. This is a Scalping setup. We can also the volume of the candles that price did broke that resistance with buyers control/pressure.
Heatmap shows us the position of the resting liquidity, we just need that rushed movement. Everything else is a Distraction.
$ETC
{future}(ETCUSDT)
SCALPING SETUP FOR ETCUSDT!
#ETCUSDT Signal-LONG!!
Entry- 7.44😉
Leverage-8x💥
READ MY POST CAREFULLY
SL-7.31(Don't forget to trial your SL)👻
TP-7.73⭐
As we can see on the chart that price has given a breakout on the Long side by trapping the sellers. Now buyers are in control. A little rejection can come but eventually price will rise up. This is a Scalping setup. We can also the volume of the candles that price did broke that resistance with buyers control/pressure.
Heatmap shows us the position of the resting liquidity, we just need that rushed movement. Everything else is a Distraction.
$ETC
Entry- 7.44😉
Leverage-8x💥
READ MY POST CAREFULLY
SL-7.31(Don't forget to trial your SL)👻
TP-7.73⭐
As we can see on the chart that price has given a breakout on the Long side by trapping the sellers. Now buyers are in control. A little rejection can come but eventually price will rise up. This is a Scalping setup. We can also the volume of the candles that price did broke that resistance with buyers control/pressure.
Heatmap shows us the position of the resting liquidity, we just need that rushed movement. Everything else is a Distraction.
$ETC
73
·
--
Maqola
Tarjimani ko‘rish
SOLV TOKEN WILL CRASH!!#SOLVUSDT Signal- SHORT!!
Entry- 0.004691
SL-0.004875
Leverage- 5x-8x.
TP- 0.004247
This coin will fall more, the cut is so deep that the bleeding will take time to stop!! It has taken a lot of Liquidity from above & also price gave a Bearish MSS. I do not see any rejection or I do not see any buyers pushing it at all.
In the Liquidation Heatmap, we can also see that a lot of liquidity is left in the lower price of the chart. No buyers at all.
$SOLV
💥💥
{future}(SOLVUSDT)
SOLV TOKEN WILL CRASH!!
#SOLVUSDT Signal- SHORT!!
Entry- 0.004691
SL-0.004875
Leverage- 5x-8x.
TP- 0.004247
This coin will fall more, the cut is so deep that the bleeding will take time to stop!! It has taken a lot of Liquidity from above & also price gave a Bearish MSS. I do not see any rejection or I do not see any buyers pushing it at all.
In the Liquidation Heatmap, we can also see that a lot of liquidity is left in the lower price of the chart. No buyers at all.
$SOLV
💥💥
Entry- 0.004691
SL-0.004875
Leverage- 5x-8x.
TP- 0.004247
This coin will fall more, the cut is so deep that the bleeding will take time to stop!! It has taken a lot of Liquidity from above & also price gave a Bearish MSS. I do not see any rejection or I do not see any buyers pushing it at all.
In the Liquidation Heatmap, we can also see that a lot of liquidity is left in the lower price of the chart. No buyers at all.
$SOLV
💥💥
1
87
·
--
Tarjimani ko‘rish
269
·
--
🎙️ Murakkab foizlash 2-kuni | 30$ dan 50 000 $ gacha | Hozir qo‘shiling | Ethereum |

Tugashi
02 soat 31 daqiqa 26 soniya
564
4
1
·
--
🎙️ Murakkab foiz 1-kun | 30$ dan 50, 000 $ gacha | Hozir qo‘shiling | Ethereum |

Tugashi
04 soat 35 daqiqa 52 soniya
893
4
1
·
--

Maqola
Tarjimani ko‘rish
IBMB bStockIBMB (IBM Tokenized bStock)
IBMB is Binance’s tokenized version of IBM stock. It moves with the actual IBM share price, trades 24/7, and you can convert it 1:1 back to the underlying stock on the platform (subject to the usual rules). Right now it’s sitting around the 230–250 area.
It’s been fairly quiet the last few days. Nothing explosive, just the usual slow movement you see on these tokenized names when the real stock isn’t doing much. Volume is decent but not heavy.
A couple of things I’m watching:
Yesterday’s high is still open above. If price sweeps that and then shows a clean shift the other way on the lower timeframe, the downside opens up.On the downside, the area under 230 has been holding so far. A clean break under that would bring the next lower pool into play.Dividends get handled as extra IBMB tokens (reinvested after taxes/fees), which is nice if you’re holding, but it doesn’t change the short-term price action much.
These bStocks can stay range-bound for a while, so I’m not forcing trades. Just marking the outside highs and lows and waiting for a real sweep instead of chasing the small inside moves.
Anyone else tracking both the IBMB chart and the actual IBM stock at the same time? How closely are you seeing them move together lately?
IBMB bStock
IBMB (IBM Tokenized bStock)
IBMB is Binance’s tokenized version of IBM stock. It moves with the actual IBM share price, trades 24/7, and you can convert it 1:1 back to the underlying stock on the platform (subject to the usual rules). Right now it’s sitting around the 230–250 area.
It’s been fairly quiet the last few days. Nothing explosive, just the usual slow movement you see on these tokenized names when the real stock isn’t doing much. Volume is decent but not heavy.
A couple of things I’m watching:
Yesterday’s high is still open above. If price sweeps that and then shows a clean shift the other way on the lower timeframe, the downside opens up.On the downside, the area under 230 has been holding so far. A clean break under that would bring the next lower pool into play.Dividends get handled as extra IBMB tokens (reinvested after taxes/fees), which is nice if you’re holding, but it doesn’t change the short-term price action much.
These bStocks can stay range-bound for a while, so I’m not forcing trades. Just marking the outside highs and lows and waiting for a real sweep instead of chasing the small inside moves.
Anyone else tracking both the IBMB chart and the actual IBM stock at the same time? How closely are you seeing them move together lately?
IBMB is Binance’s tokenized version of IBM stock. It moves with the actual IBM share price, trades 24/7, and you can convert it 1:1 back to the underlying stock on the platform (subject to the usual rules). Right now it’s sitting around the 230–250 area.
It’s been fairly quiet the last few days. Nothing explosive, just the usual slow movement you see on these tokenized names when the real stock isn’t doing much. Volume is decent but not heavy.
A couple of things I’m watching:
Yesterday’s high is still open above. If price sweeps that and then shows a clean shift the other way on the lower timeframe, the downside opens up.On the downside, the area under 230 has been holding so far. A clean break under that would bring the next lower pool into play.Dividends get handled as extra IBMB tokens (reinvested after taxes/fees), which is nice if you’re holding, but it doesn’t change the short-term price action much.
These bStocks can stay range-bound for a while, so I’m not forcing trades. Just marking the outside highs and lows and waiting for a real sweep instead of chasing the small inside moves.
Anyone else tracking both the IBMB chart and the actual IBM stock at the same time? How closely are you seeing them move together lately?
84
·
--
Tarjimani ko‘rish
#EarningsSeason
Earnings season is always messy. One day a company beats and the stock rips, next day another one misses and everything cools off. Crypto feels it too — especially the tokenized stocks and the bigger names that move with the Nasdaq.
Right now it feels like people are waiting more than trading. A lot of eyes on the big reports this week. Some names already moved hard after hours, others are still sitting in the same range they were in last week. The hard part is knowing which reaction is real and which one is just noise before the next print.
I’ve been keeping the charts simple during this period. Mark the obvious highs and lows from before the earnings, then see if price actually sweeps them after the numbers come out. A lot of the time the first move is the trap. The second move, once the dust settles, is usually cleaner. Doesn’t always work, but it’s better than chasing the first candle.
Volume has been higher than usual on a few of the tokenized names too. Not sure if that’s people positioning ahead of the reports or just normal flow. Either way, the outside levels matter more than the small inside swings while these numbers are dropping.
How are you playing this earnings season? Sitting it out, or looking for the reaction after the reports? Any name you’re watching more than the others right now?
#EarningsSeason
Earnings season is always messy. One day a company beats and the stock rips, next day another one misses and everything cools off. Crypto feels it too — especially the tokenized stocks and the bigger names that move with the Nasdaq.
Right now it feels like people are waiting more than trading. A lot of eyes on the big reports this week. Some names already moved hard after hours, others are still sitting in the same range they were in last week. The hard part is knowing which reaction is real and which one is just noise before the next print.
I’ve been keeping the charts simple during this period. Mark the obvious highs and lows from before the earnings, then see if price actually sweeps them after the numbers come out. A lot of the time the first move is the trap. The second move, once the dust settles, is usually cleaner. Doesn’t always work, but it’s better than chasing the first candle.
Volume has been higher than usual on a few of the tokenized names too. Not sure if that’s people positioning ahead of the reports or just normal flow. Either way, the outside levels matter more than the small inside swings while these numbers are dropping.
How are you playing this earnings season? Sitting it out, or looking for the reaction after the reports? Any name you’re watching more than the others right now?
Earnings season is always messy. One day a company beats and the stock rips, next day another one misses and everything cools off. Crypto feels it too — especially the tokenized stocks and the bigger names that move with the Nasdaq.
Right now it feels like people are waiting more than trading. A lot of eyes on the big reports this week. Some names already moved hard after hours, others are still sitting in the same range they were in last week. The hard part is knowing which reaction is real and which one is just noise before the next print.
I’ve been keeping the charts simple during this period. Mark the obvious highs and lows from before the earnings, then see if price actually sweeps them after the numbers come out. A lot of the time the first move is the trap. The second move, once the dust settles, is usually cleaner. Doesn’t always work, but it’s better than chasing the first candle.
Volume has been higher than usual on a few of the tokenized names too. Not sure if that’s people positioning ahead of the reports or just normal flow. Either way, the outside levels matter more than the small inside swings while these numbers are dropping.
How are you playing this earnings season? Sitting it out, or looking for the reaction after the reports? Any name you’re watching more than the others right now?
764
·
--
Maqola
Tarjimani ko‘rish
My Opinion On CRMBCRMB has been pretty quiet the last few days. Still hanging around the 240–250 zone. Nothing crazy, just the usual slow grind these tokenized stocks do when the real Salesforce stock isn’t moving much.
I’ve been watching two things at the same time: the CRMB chart and the actual CRM stock. Sometimes the tokenized version lags a bit, sometimes it moves first. Right now it feels like it’s just following.
A couple of levels I’m keeping an eye on:
Yesterday’s high is still open above. If price sweeps that and then shows a clean shift down on the lower timeframe, the other side becomes interesting.
On the downside, the area under 240 has been holding so far. If that breaks with strength, then the next lower pool comes into play.
Volume has been decent but not explosive. These bStocks can stay range-bound for a while, so I’m not forcing anything. Just marking the outside highs and lows and waiting for a real sweep.
Anyone else tracking both the tokenized version and the actual stock at the same time? Curious how you’re seeing the correlation lately.
#CRMB
My Opinion On CRMB
CRMB has been pretty quiet the last few days. Still hanging around the 240–250 zone. Nothing crazy, just the usual slow grind these tokenized stocks do when the real Salesforce stock isn’t moving much.
I’ve been watching two things at the same time: the CRMB chart and the actual CRM stock. Sometimes the tokenized version lags a bit, sometimes it moves first. Right now it feels like it’s just following.
A couple of levels I’m keeping an eye on:
Yesterday’s high is still open above. If price sweeps that and then shows a clean shift down on the lower timeframe, the other side becomes interesting.
On the downside, the area under 240 has been holding so far. If that breaks with strength, then the next lower pool comes into play.
Volume has been decent but not explosive. These bStocks can stay range-bound for a while, so I’m not forcing anything. Just marking the outside highs and lows and waiting for a real sweep.
Anyone else tracking both the tokenized version and the actual stock at the same time? Curious how you’re seeing the correlation lately.
#CRMB
I’ve been watching two things at the same time: the CRMB chart and the actual CRM stock. Sometimes the tokenized version lags a bit, sometimes it moves first. Right now it feels like it’s just following.
A couple of levels I’m keeping an eye on:
Yesterday’s high is still open above. If price sweeps that and then shows a clean shift down on the lower timeframe, the other side becomes interesting.
On the downside, the area under 240 has been holding so far. If that breaks with strength, then the next lower pool comes into play.
Volume has been decent but not explosive. These bStocks can stay range-bound for a while, so I’m not forcing anything. Just marking the outside highs and lows and waiting for a real sweep.
Anyone else tracking both the tokenized version and the actual stock at the same time? Curious how you’re seeing the correlation lately.
#CRMB
110
Ko‘proq kontentni ko‘rish uchun tizimga kiring
Binance Square'da global kriptovalyuta foydalanuvchilariga qo‘shiling
⚡️ Kriptovalyuta haqida eng so‘nggi va foydali ma’lumotlarni oling.
💬 Dunyoning eng yirik kriptovalyuta birjasi tomonidan ishonchli deb topilgan.
👍 Tasdiqlangan mualliflardan haqiqiy tahlillarni kashf eting.
Email / telefon raqami
Trenddagi mavzular
BinanceReopensWithdrawalsForMoreAssets
646,157 marta koʻrilgan
3,173 muhokama qilmoqda
Xavfsizlik hodisasi | Tiklanish bo‘yicha yangilanish #8: Yana ko‘proq aktivlar uchun pul yechish qayta ochiladi (2026-11-05)
Binance Announcement
·184 ta layk
·633.2k marta koʻrilgan
BTCRebounds80K
151,926 marta koʻrilgan
1,454 muhokama qilmoqda
Binance98PercentReplenished
77,511 marta koʻrilgan
995 muhokama qilmoqda