
CryptoTradeMask
10k Postlar
CryptoTradeMask
Shikoyat qilish
Foydalanuvchini bloklash
Cryptocurrency market news, financial reviews, courses and training, all about cryptocurrencies and blockchain | 📊Technical analyses, Trading Strategy | 🦈
Ochiq savdo
Tez-tez savdo qiluvchi
8.4 yil
234 Kuzatilmoqda
1.8K+ Kuzatuvchilar
12.4K+ Yoqdi
Postlar
Portfel
Barchasi
Iqtiboslar
Videolar
QADAB QO‘YILGAN

Maqola
Tarjimani ko‘rish
🧠Розумний трейдинг на Binance: Повний гід по інструментах для максимального прибутку📈У сучасному криптосвіті успіх залежить не лише від інтуїції, а й від якості інструментів, які ви використовуєте. Платформа Binance надає потужну базу, але для справжньої переваги над ринком варто поєднувати її з професійними зовнішніми сервісами.
У цій статті ми розберемо екосистему інструментів, які допоможуть вам автоматизувати процеси, аналізувати дані та мінімізувати ризики.
{future}(BNBUSDT)
1. Фундамент: Вбудовані можливості Binance
Перш ніж шукати сторонні сервіси, важливо на 100% використовувати потенціал самої біржі.
• Розширений інтерфейс графіків: Забудьте про спрощені вікна. "Advanced" режим дає доступ до глибини ринку та інтеграції з технічним інструментарієм.
• OCO-ордери (One-Cancels-the-Other): Страховка вашого капіталу. Дозволяє одночасно виставити ордер на фіксацію прибутку та обмеження збитків. Якщо спрацьовує один — інший скасовується автоматично.
• Торгові боти Binance: У розділі "Trading Bots" можна налаштувати Grid Trading (сіткову торгівлю). Це ідеальний інструмент для "флету" (бокового руху ринку), коли ціна коливається у певному діапазоні.
• API-інтеграція: Ключ до автоматизації. Дозволяє безпечно підключати ваші торгові дані до зовнішніх терміналів без права на вивід коштів.
{future}(ETHUSDT)
2. Зовнішня аналітика: Бачити те, що не бачать інші
Щоб розуміти логіку руху ціни, потрібно виходити за межі графіка біржі.
[Технічний аналіз](https://app.binance.com/uni-qr/cart/34017215415633?r=ho8lubrb&l=uk-ua&uco=5vkgl9tq36cfnvkodfwkkw&uc=app_square_share_link&us=copylink)
TradingView залишається стандартом індустрії. Його головна перевага — можливість створювати власні індикатори та налаштовувати складні сповіщення, які прийдуть вам на телефон або пошту, навіть якщо додаток Binance закрито.
[Ончейн-аналітика (On-chain data)](https://app.binance.com/uni-qr/cart/35565266873793?r=ho8lubrb&l=uk-ua&uco=5vkgl9tq36cfnvkodfwkkw&uc=app_square_share_link&us=copylink)
Крипта — це відкрита книга. Такі сервіси як CryptoQuant або Glassnode дозволяють бачити:
• Чи переводять "кити" біткоїни з гаманців на біржі (ознака можливого продажу).
• Резерви майнерів.
• Активність нових адрес.
[Психологія ринку](https://app.binance.com/uni-qr/cart/35397880999081?r=ho8lubrb&l=uk-ua&uco=5vkgl9tq36cfnvkodfwkkw&uc=app_square_share_link&us=copylink)
Ринок рухають емоції. LunarCrush аналізує згадки монет у соцмережах (X, Telegram), а Індекс страху та жадібності підкаже, коли ринок перегрітий (час продавати) або надто наляканий (час купувати).
{future}(XRPUSDT)
3. Управління портфелем та автоматизація
Якщо у вас більше 5 активів, відстежувати їх вручну стає важко.
• Трекери портфеля: CoinStats або Delta підключаються через API до Binance і показують вашу чисту прибутковість (PNL) у реальному часі.
• Просунуті боти: 3Commas та CryptoHopper пропонують значно гнучкіші налаштування, ніж вбудовані боти бірж, включаючи копітрейдинг та складні алгоритми DCA (усереднення вартості).
4. Ризик-менеджмент: Головний секрет виживання
Найбільша помилка новачків — заходити в угоду "на око".
Золоте правило: Перед входом в угоду ви повинні знати свій [Risk/Reward Ratio](https://app.binance.com/uni-qr/cart/34936701777065?r=ho8lubrb&l=uk-ua&uco=5vkgl9tq36cfnvkodfwkkw&uc=app_square_share_link&us=copylink) (співвідношення ризику до прибутку). Оптимально — не менше 1:3.
Використовуйте Калькулятор розміру позиції, щоб визначити, якою частиною депозиту можна ризикнути, виходячи з відстані до вашого [стоп-лоссу](https://app.binance.com/uni-qr/cart/34489046348682?r=ho8lubrb&l=uk-ua&uco=5vkgl9tq36cfnvkodfwkkw&uc=app_square_share_link&us=copylink).
💡 Чек-лист для старту: Поради експертів
1. Синхронізація: Налаштуйте сповіщення на TradingView за ціновими рівнями, які ви визначили на Binance.
2. Безпека: Перед покупкою щиткоїнів (маловідомих монет) завжди копіюйте контракт із CoinGecko та перевіряйте його, щоб не потрапити на скам.
3. Податки та звітність: Якщо ви торгуєте активно, використовуйте Koinly. Це заощадить десятки годин під час підрахунку річного звіту.
Резюме для початківця
Не намагайтеся опанувати все одразу. Почніть із трьох кроків:
1. Опануйте TradingView для малювання рівнів.
2. Навчіться ставити Stop-Loss та Take-Profit через OCO-ордери.
3. Встановіть цінові сповіщення, щоб не "залипати" в монітор 24/7.
[Тейк-профіт: як вчасно забрати гроші з ринку і не шкодувати про це](https://app.binance.com/uni-qr/cart/34464387895977?r=ho8lubrb&l=uk-ua&uco=5vkgl9tq36cfnvkodfwkkw&uc=app_square_share_link&us=copylink)
🧠Розумний трейдинг на Binance: Повний гід по інструментах для максимального прибутку📈
У сучасному криптосвіті успіх залежить не лише від інтуїції, а й від якості інструментів, які ви використовуєте. Платформа Binance надає потужну базу, але для справжньої переваги над ринком варто поєднувати її з професійними зовнішніми сервісами.
У цій статті ми розберемо екосистему інструментів, які допоможуть вам автоматизувати процеси, аналізувати дані та мінімізувати ризики.
1. Фундамент: Вбудовані можливості Binance
Перш ніж шукати сторонні сервіси, важливо на 100% використовувати потенціал самої біржі.
• Розширений інтерфейс графіків: Забудьте про спрощені вікна. "Advanced" режим дає доступ до глибини ринку та інтеграції з технічним інструментарієм.
• OCO-ордери (One-Cancels-the-Other): Страховка вашого капіталу. Дозволяє одночасно виставити ордер на фіксацію прибутку та обмеження збитків. Якщо спрацьовує один — інший скасовується автоматично.
• Торгові боти Binance: У розділі "Trading Bots" можна налаштувати Grid Trading (сіткову торгівлю). Це ідеальний інструмент для "флету" (бокового руху ринку), коли ціна коливається у певному діапазоні.
• API-інтеграція: Ключ до автоматизації. Дозволяє безпечно підключати ваші торгові дані до зовнішніх терміналів без права на вивід коштів.
2. Зовнішня аналітика: Бачити те, що не бачать інші
Щоб розуміти логіку руху ціни, потрібно виходити за межі графіка біржі.
Технічний аналіз
TradingView залишається стандартом індустрії. Його головна перевага — можливість створювати власні індикатори та налаштовувати складні сповіщення, які прийдуть вам на телефон або пошту, навіть якщо додаток Binance закрито.
Ончейн-аналітика (On-chain data)
Крипта — це відкрита книга. Такі сервіси як CryptoQuant або Glassnode дозволяють бачити:
• Чи переводять "кити" біткоїни з гаманців на біржі (ознака можливого продажу).
• Резерви майнерів.
• Активність нових адрес.
Психологія ринку
Ринок рухають емоції. LunarCrush аналізує згадки монет у соцмережах (X, Telegram), а Індекс страху та жадібності підкаже, коли ринок перегрітий (час продавати) або надто наляканий (час купувати).
3. Управління портфелем та автоматизація
Якщо у вас більше 5 активів, відстежувати їх вручну стає важко.
• Трекери портфеля: CoinStats або Delta підключаються через API до Binance і показують вашу чисту прибутковість (PNL) у реальному часі.
• Просунуті боти: 3Commas та CryptoHopper пропонують значно гнучкіші налаштування, ніж вбудовані боти бірж, включаючи копітрейдинг та складні алгоритми DCA (усереднення вартості).
4. Ризик-менеджмент: Головний секрет виживання
Найбільша помилка новачків — заходити в угоду "на око".
Золоте правило: Перед входом в угоду ви повинні знати свій Risk/Reward Ratio (співвідношення ризику до прибутку). Оптимально — не менше 1:3.
Використовуйте Калькулятор розміру позиції, щоб визначити, якою частиною депозиту можна ризикнути, виходячи з відстані до вашого стоп-лоссу.
💡 Чек-лист для старту: Поради експертів
1. Синхронізація: Налаштуйте сповіщення на TradingView за ціновими рівнями, які ви визначили на Binance.
2. Безпека: Перед покупкою щиткоїнів (маловідомих монет) завжди копіюйте контракт із CoinGecko та перевіряйте його, щоб не потрапити на скам.
3. Податки та звітність: Якщо ви торгуєте активно, використовуйте Koinly. Це заощадить десятки годин під час підрахунку річного звіту.
Резюме для початківця
Не намагайтеся опанувати все одразу. Почніть із трьох кроків:
1. Опануйте TradingView для малювання рівнів.
2. Навчіться ставити Stop-Loss та Take-Profit через OCO-ордери.
3. Встановіть цінові сповіщення, щоб не "залипати" в монітор 24/7.
Тейк-профіт: як вчасно забрати гроші з ринку і не шкодувати про це
У цій статті ми розберемо екосистему інструментів, які допоможуть вам автоматизувати процеси, аналізувати дані та мінімізувати ризики.
1. Фундамент: Вбудовані можливості Binance
Перш ніж шукати сторонні сервіси, важливо на 100% використовувати потенціал самої біржі.
• Розширений інтерфейс графіків: Забудьте про спрощені вікна. "Advanced" режим дає доступ до глибини ринку та інтеграції з технічним інструментарієм.
• OCO-ордери (One-Cancels-the-Other): Страховка вашого капіталу. Дозволяє одночасно виставити ордер на фіксацію прибутку та обмеження збитків. Якщо спрацьовує один — інший скасовується автоматично.
• Торгові боти Binance: У розділі "Trading Bots" можна налаштувати Grid Trading (сіткову торгівлю). Це ідеальний інструмент для "флету" (бокового руху ринку), коли ціна коливається у певному діапазоні.
• API-інтеграція: Ключ до автоматизації. Дозволяє безпечно підключати ваші торгові дані до зовнішніх терміналів без права на вивід коштів.
2. Зовнішня аналітика: Бачити те, що не бачать інші
Щоб розуміти логіку руху ціни, потрібно виходити за межі графіка біржі.
Технічний аналіз
TradingView залишається стандартом індустрії. Його головна перевага — можливість створювати власні індикатори та налаштовувати складні сповіщення, які прийдуть вам на телефон або пошту, навіть якщо додаток Binance закрито.
Ончейн-аналітика (On-chain data)
Крипта — це відкрита книга. Такі сервіси як CryptoQuant або Glassnode дозволяють бачити:
• Чи переводять "кити" біткоїни з гаманців на біржі (ознака можливого продажу).
• Резерви майнерів.
• Активність нових адрес.
Психологія ринку
Ринок рухають емоції. LunarCrush аналізує згадки монет у соцмережах (X, Telegram), а Індекс страху та жадібності підкаже, коли ринок перегрітий (час продавати) або надто наляканий (час купувати).
3. Управління портфелем та автоматизація
Якщо у вас більше 5 активів, відстежувати їх вручну стає важко.
• Трекери портфеля: CoinStats або Delta підключаються через API до Binance і показують вашу чисту прибутковість (PNL) у реальному часі.
• Просунуті боти: 3Commas та CryptoHopper пропонують значно гнучкіші налаштування, ніж вбудовані боти бірж, включаючи копітрейдинг та складні алгоритми DCA (усереднення вартості).
4. Ризик-менеджмент: Головний секрет виживання
Найбільша помилка новачків — заходити в угоду "на око".
Золоте правило: Перед входом в угоду ви повинні знати свій Risk/Reward Ratio (співвідношення ризику до прибутку). Оптимально — не менше 1:3.
Використовуйте Калькулятор розміру позиції, щоб визначити, якою частиною депозиту можна ризикнути, виходячи з відстані до вашого стоп-лоссу.
💡 Чек-лист для старту: Поради експертів
1. Синхронізація: Налаштуйте сповіщення на TradingView за ціновими рівнями, які ви визначили на Binance.
2. Безпека: Перед покупкою щиткоїнів (маловідомих монет) завжди копіюйте контракт із CoinGecko та перевіряйте його, щоб не потрапити на скам.
3. Податки та звітність: Якщо ви торгуєте активно, використовуйте Koinly. Це заощадить десятки годин під час підрахунку річного звіту.
Резюме для початківця
Не намагайтеся опанувати все одразу. Почніть із трьох кроків:
1. Опануйте TradingView для малювання рівнів.
2. Навчіться ставити Stop-Loss та Take-Profit через OCO-ордери.
3. Встановіть цінові сповіщення, щоб не "залипати" в монітор 24/7.
Тейк-профіт: як вчасно забрати гроші з ринку і не шкодувати про це
4
116
QADAB QO‘YILGAN

Maqola
📖 Zamonaviy treyding ensiklopediyasi: Smart Money konsepsiyalaridan kvant algoritmlarigacha📊Treyding — bu shunchaki sotib olish va sotish emas. Bu intellektual urush bo‘lib, unda har bir ishtirokchi o‘z qurolidan foydalanadi: klassik geometriyadan tortib sun’iy intellektgacha. Ushbu maqolada biz moliyaviy bozorlarni shakllantiradigan usullar xaritasini to‘liq tahlil qilamiz.
🧠 I. KONSEPTUAL USULLAR: Mutaxassislar qanday fikr yuritadi
📖 Zamonaviy treyding ensiklopediyasi: Smart Money konsepsiyalaridan kvant algoritmlarigacha📊
Treyding — bu shunchaki sotib olish va sotish emas. Bu intellektual urush bo‘lib, unda har bir ishtirokchi o‘z qurolidan foydalanadi: klassik geometriyadan tortib sun’iy intellektgacha. Ushbu maqolada biz moliyaviy bozorlarni shakllantiradigan usullar xaritasini to‘liq tahlil qilamiz.
🧠 I. KONSEPTUAL USULLAR: Mutaxassislar qanday fikr yuritadi
🧠 I. KONSEPTUAL USULLAR: Mutaxassislar qanday fikr yuritadi
10
3
42
420
Tarjimani ko‘rish
#bitcoin 🚀
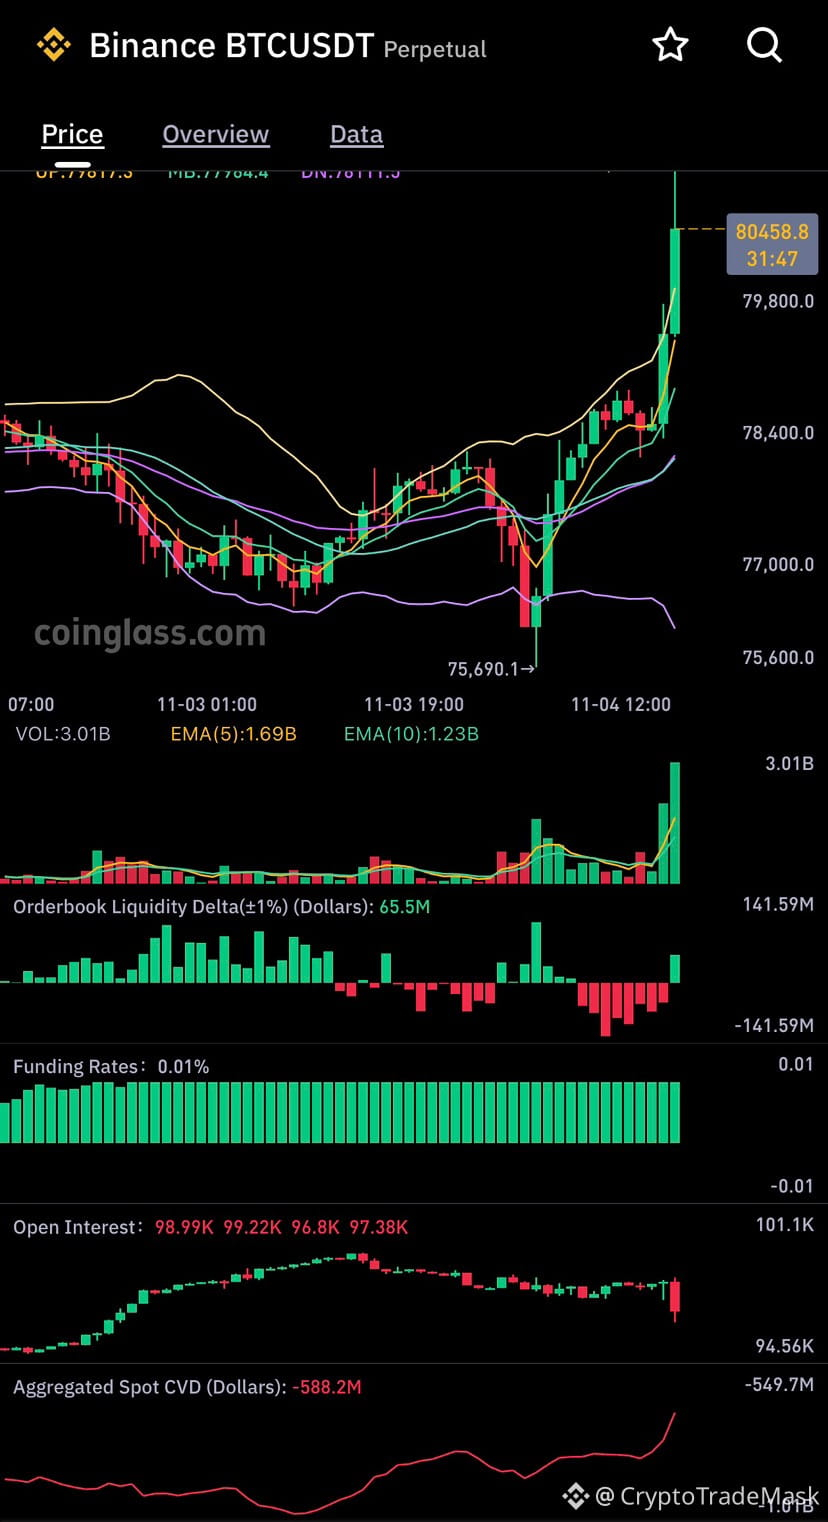
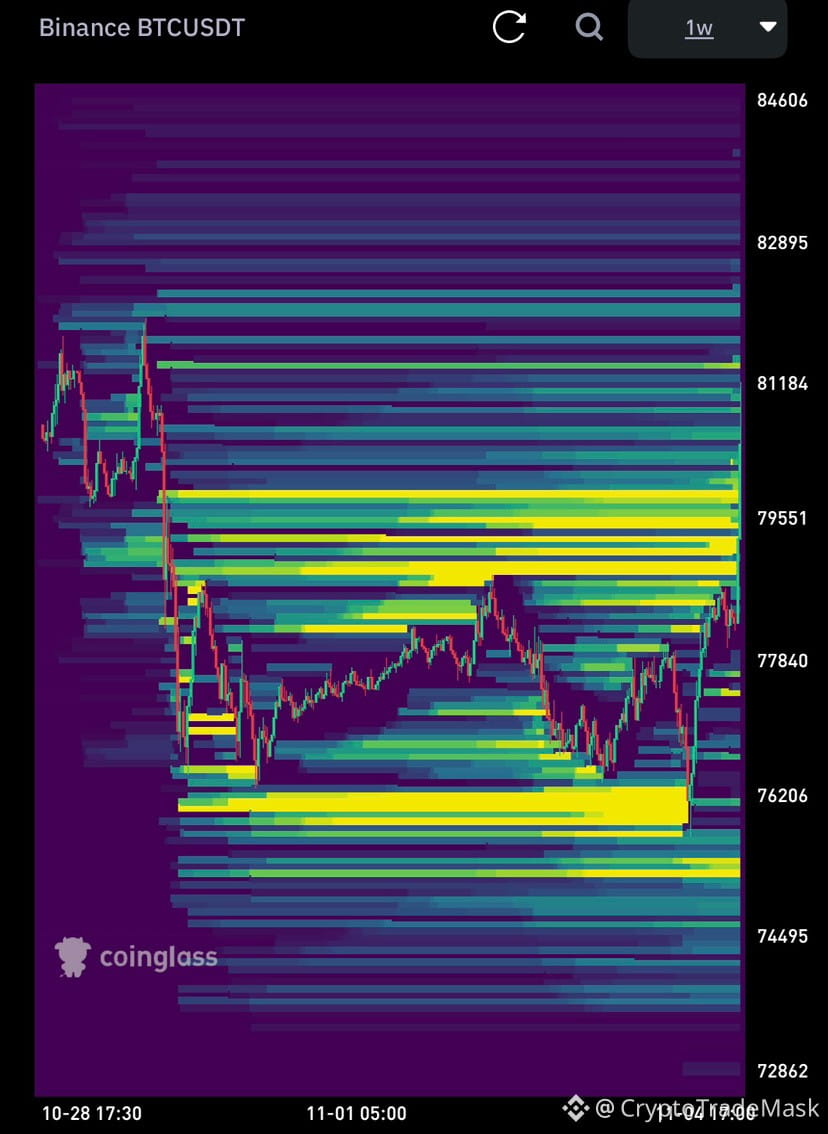
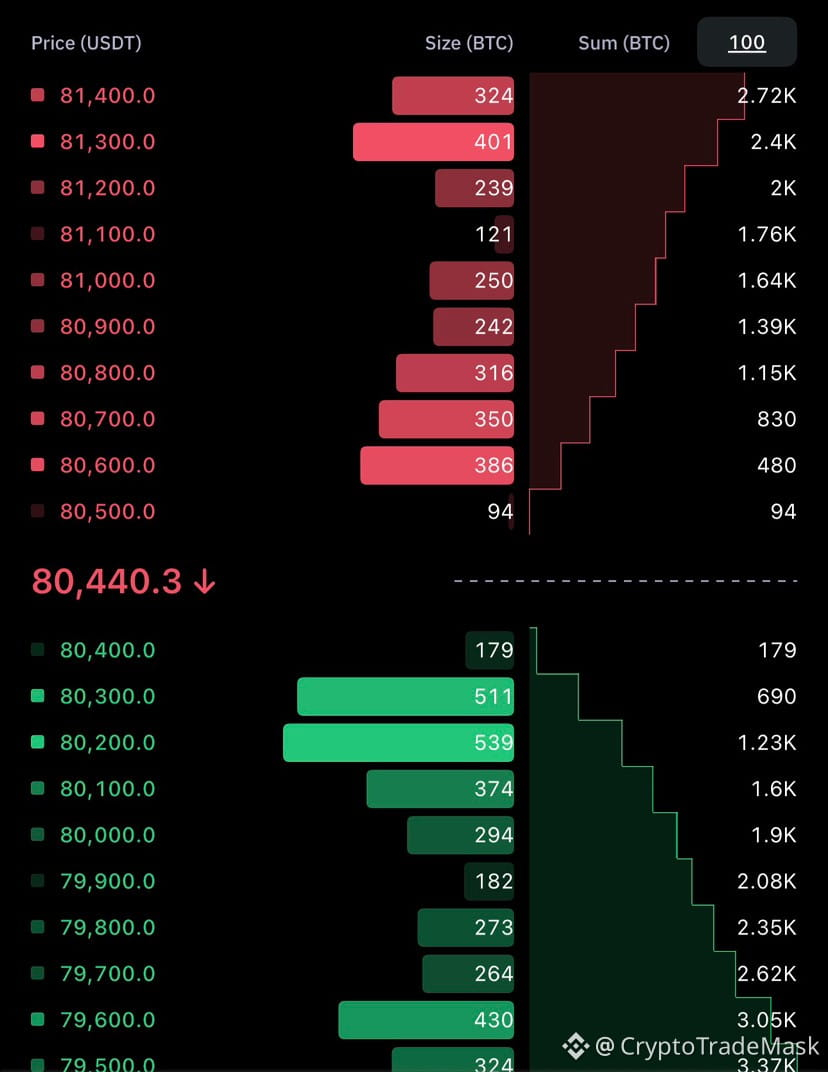
🚀 $BTC пробиває 80k!
На графіку Binance BTCUSDT спостерігається потужний імпульсний рух — ціна стрімко пробила психологічну позначку та сягнула рівня понад 80 450 USDT.
➡️ Short Squeeze: Імпульс спровокував активацію стоп-лосів продавців та каскад ліквідацій у зоні накопичення ліквідності біля 79 500 – 80 000 USDT.
➡️ Об'єми: Зелена гістограма об'ємів підтверджує агресивний приплив купівельної активності на пробої.
➡️ Стакан: Спостерігається щільне перерозподіл ліквідності в стакані вище круглого рівня.
⚠️ Ринок демонструє силу та намагається закріпитися на нових висотах після попередньої консолідації. Слідкуємо за реакцією ціни вище 80 000!
{future}(BTCUSDT)
#bitcoin 🚀
🚀 $BTC пробиває 80k!
На графіку Binance BTCUSDT спостерігається потужний імпульсний рух — ціна стрімко пробила психологічну позначку та сягнула рівня понад 80 450 USDT.
➡️ Short Squeeze: Імпульс спровокував активацію стоп-лосів продавців та каскад ліквідацій у зоні накопичення ліквідності біля 79 500 – 80 000 USDT.
➡️ Об'єми: Зелена гістограма об'ємів підтверджує агресивний приплив купівельної активності на пробої.
➡️ Стакан: Спостерігається щільне перерозподіл ліквідності в стакані вище круглого рівня.
⚠️ Ринок демонструє силу та намагається закріпитися на нових висотах після попередньої консолідації. Слідкуємо за реакцією ціни вище 80 000!
🚀 $BTC пробиває 80k!
На графіку Binance BTCUSDT спостерігається потужний імпульсний рух — ціна стрімко пробила психологічну позначку та сягнула рівня понад 80 450 USDT.
➡️ Short Squeeze: Імпульс спровокував активацію стоп-лосів продавців та каскад ліквідацій у зоні накопичення ліквідності біля 79 500 – 80 000 USDT.
➡️ Об'єми: Зелена гістограма об'ємів підтверджує агресивний приплив купівельної активності на пробої.
➡️ Стакан: Спостерігається щільне перерозподіл ліквідності в стакані вище круглого рівня.
⚠️ Ринок демонструє силу та намагається закріпитися на нових висотах після попередньої консолідації. Слідкуємо за реакцією ціни вище 80 000!
1
8
Tarjimani ko‘rish
#etf
🔴 Is big capital exiting the game?
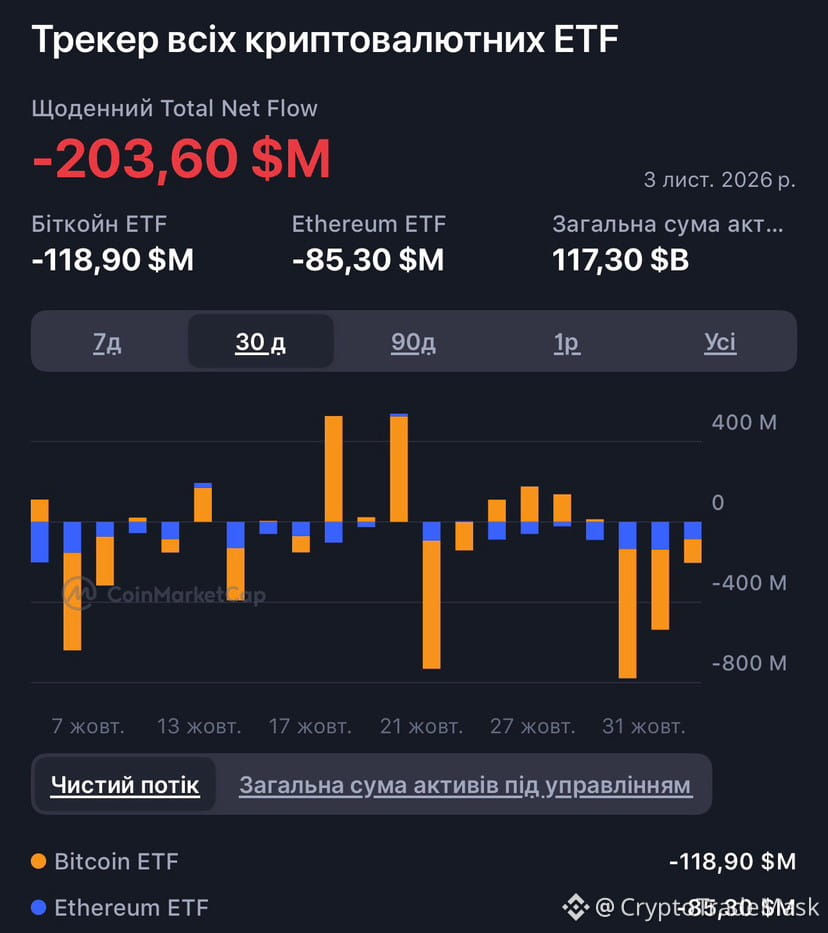
According to tracker data for November 3, crypto ETFs saw a significant outflow of funds-$203.60 million in a single day:
{future}(BTCUSDT)
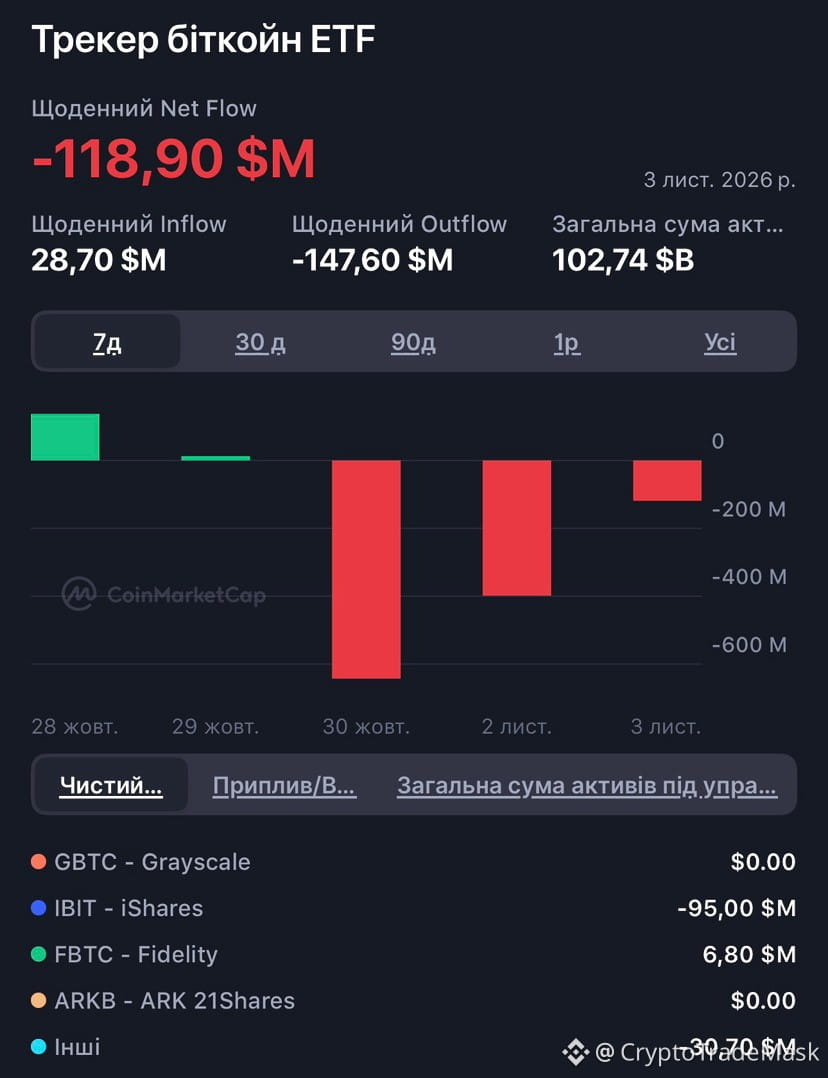
#bitcoin ETFs: -$118.90 million (with the biggest hit to IBIT / iShares: -$95.00 million).
{future}(ETHUSDT)
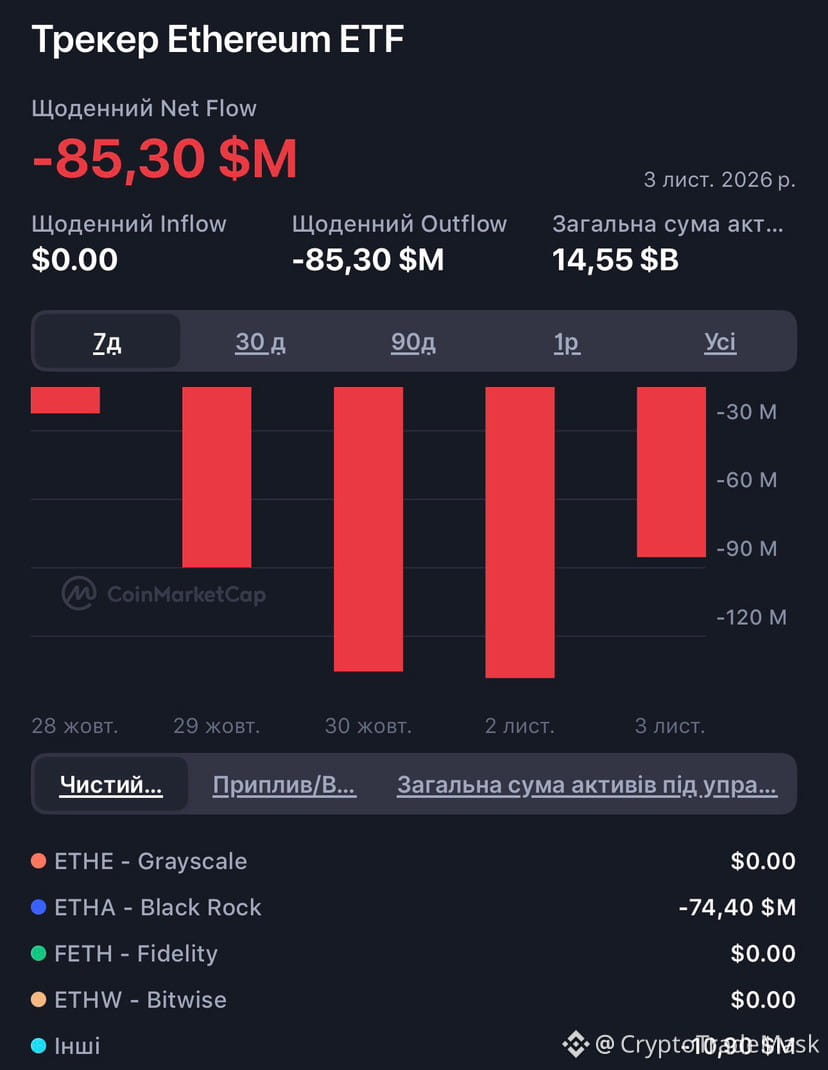
#Ethereum ETFs: -$85.30 million (primarily driven by outflows from ETHA / BlackRock: -$74.40 million).
Despite this, massive sums remain under management: $102.74 billion in Bitcoin and $14.55 billion in Ether.
📉 A temporary pullback, or the start of a deep correction?🧐
#etf
🔴 Is big capital exiting the game?
According to tracker data for November 3, crypto ETFs saw a significant outflow of funds-$203.60 million in a single day:
#bitcoin ETFs: -$118.90 million (with the biggest hit to IBIT / iShares: -$95.00 million).
#Ethereum ETFs: -$85.30 million (primarily driven by outflows from ETHA / BlackRock: -$74.40 million).
Despite this, massive sums remain under management: $102.74 billion in Bitcoin and $14.55 billion in Ether.
📉 A temporary pullback, or the start of a deep correction?🧐
🔴 Is big capital exiting the game?
According to tracker data for November 3, crypto ETFs saw a significant outflow of funds-$203.60 million in a single day:
#bitcoin ETFs: -$118.90 million (with the biggest hit to IBIT / iShares: -$95.00 million).
#Ethereum ETFs: -$85.30 million (primarily driven by outflows from ETHA / BlackRock: -$74.40 million).
Despite this, massive sums remain under management: $102.74 billion in Bitcoin and $14.55 billion in Ether.
📉 A temporary pullback, or the start of a deep correction?🧐
1
1
14
Tarjimani ko‘rish
#CryptoMarkets #indicador
📊 Current $BTC Market Situation: What Are Market Makers Planning?
Bitcoin has currently settled into the $76,000 – $78,000 range, with volatility once again hitting record highs. Let’s break down the key metrics currently driving the price:
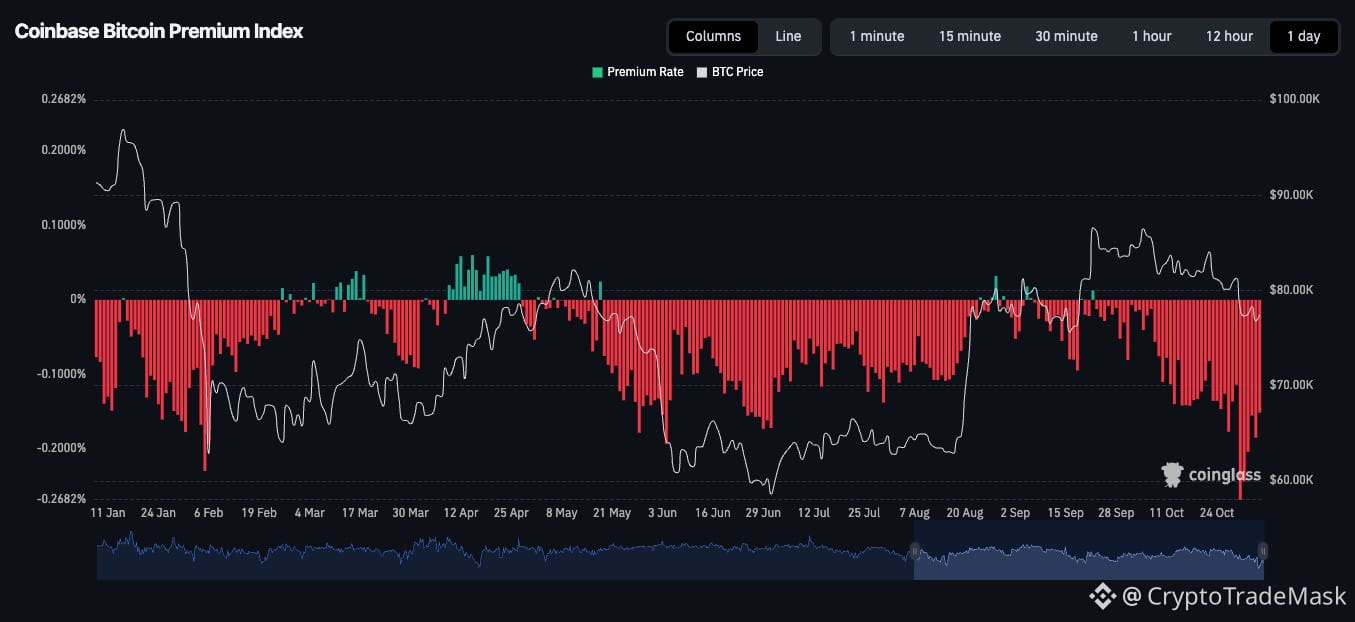
➡️ Coinbase Premium Index: It remains deep in the red (down to -0.26%). This is a clear signal that the primary selling pressure and caution are originating from the U.S. market and institutional players.
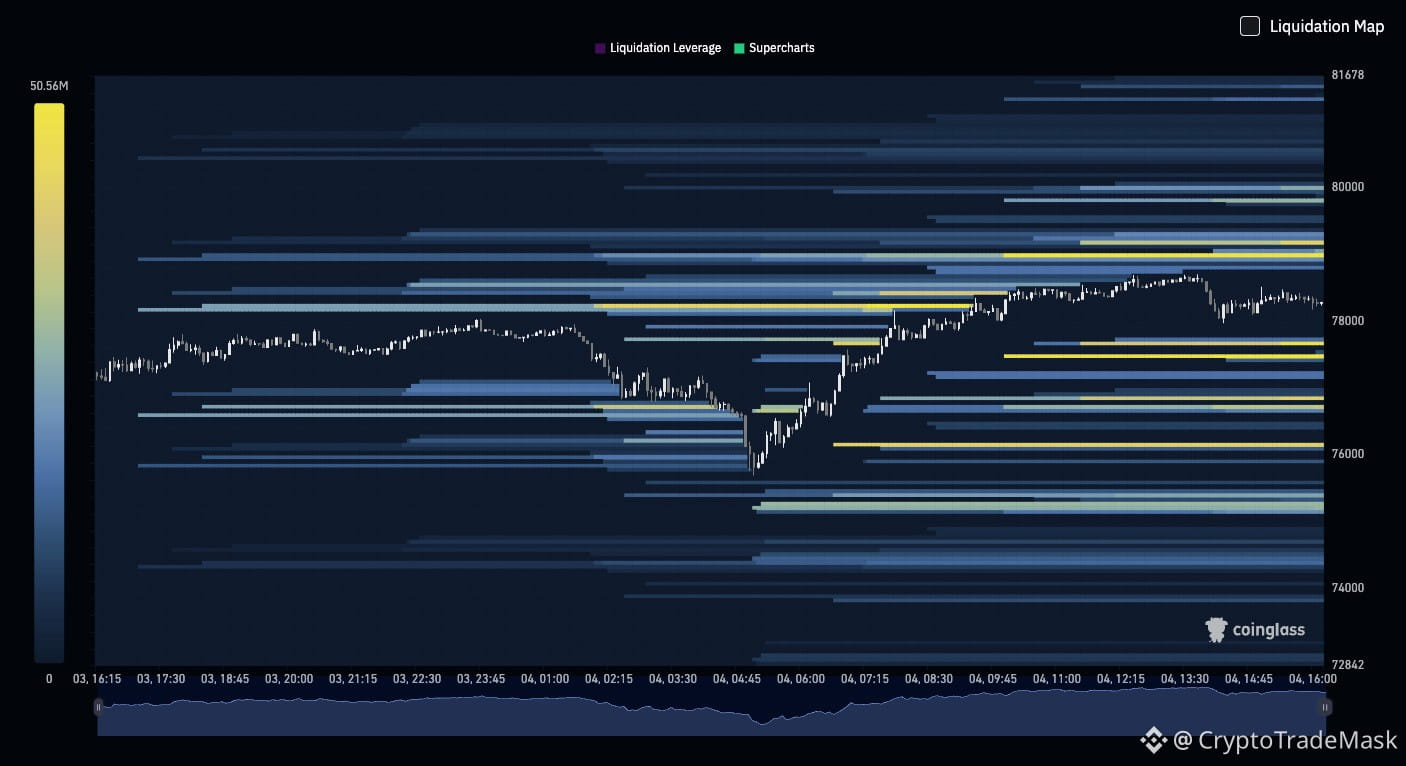
➡️ Liquidation Map: Liquidity clusters are densely packed both above $78,000 and below $76,000. The market is practically "begging" for a manipulative stop-run in both directions before a genuine directional move occurs.
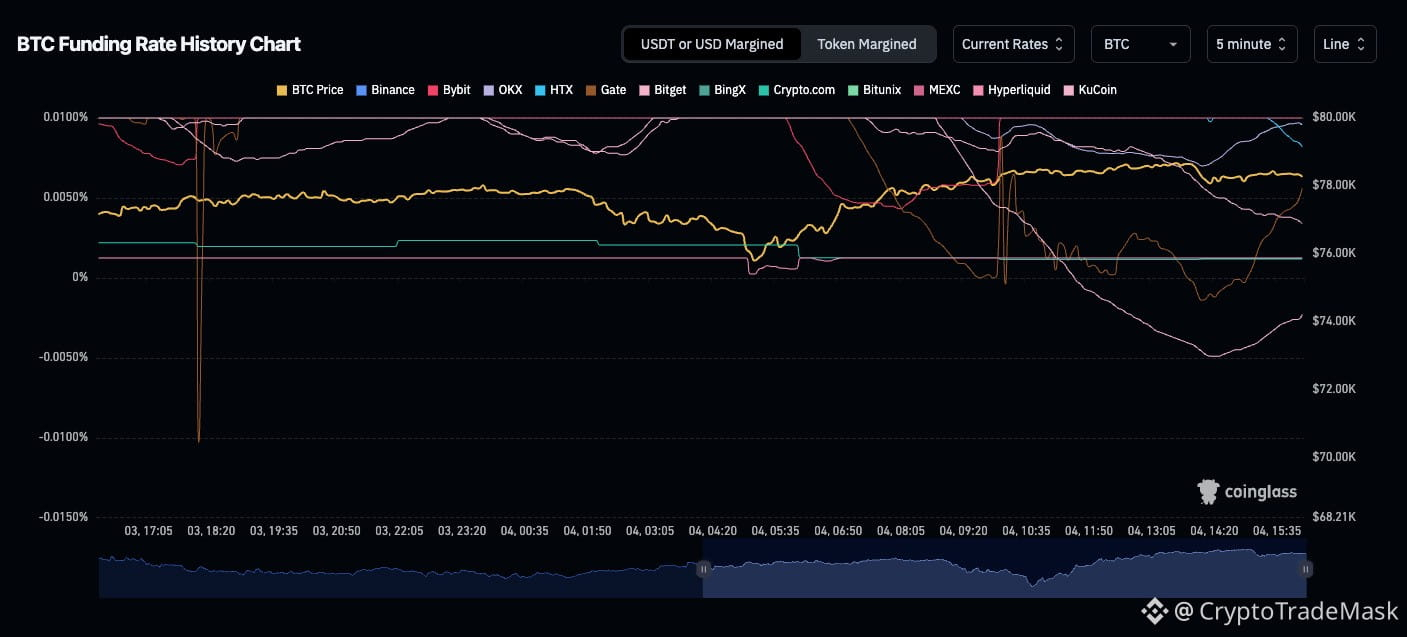
➡️ Funding Rates: Following local dips to the $74K–$76K range, funding rates have periodically cooled off, helping to clear excessive long leverage from the market. At the moment, the balance of power is extremely fragile.
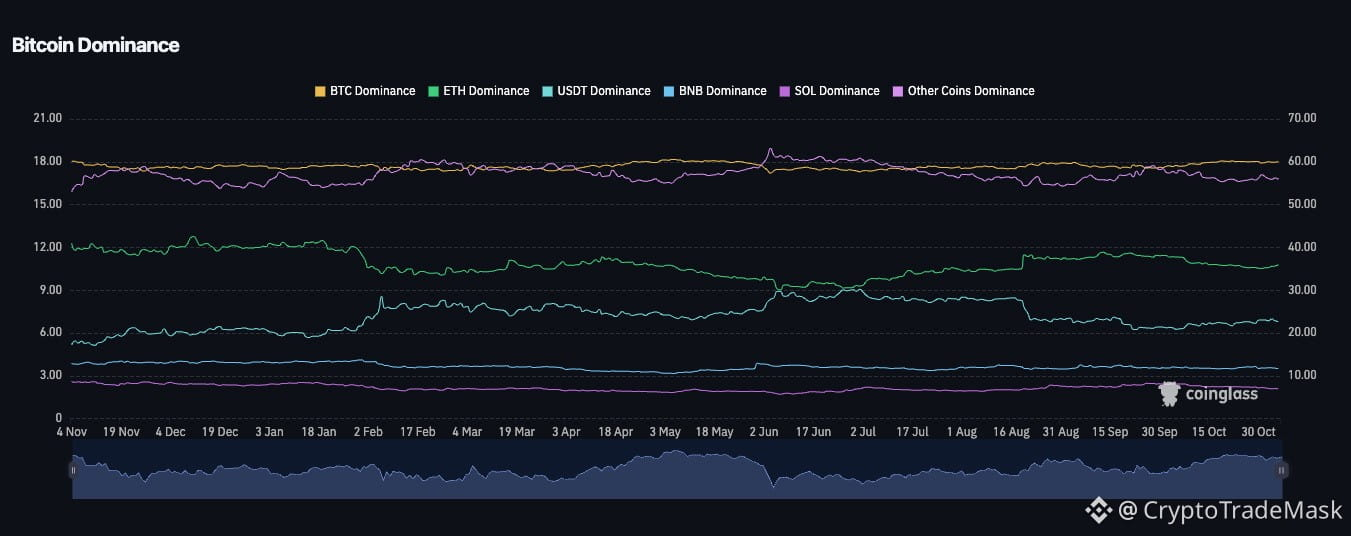
➡️ Bitcoin Dominance: It remains at high levels (around 58–60%). Capital is still concentrated in the leading cryptocurrency, while altcoins have yet to see any significant influx of liquidity.
⚠️ Conclusion / Trading Outlook:
The current zone demands the utmost caution. Trading with high leverage right now is essentially a gamble, given the risk of cascading liquidations. It is worth keeping an eye on key levels: a breakout above $78K could pave the way for new attempts to rise, while a decisive break below $76K risks a deeper correction.
{future}(BTCUSDT)
#CryptoMarkets #indicador
📊 Current $BTC Market Situation: What Are Market Makers Planning?
Bitcoin has currently settled into the $76,000 – $78,000 range, with volatility once again hitting record highs. Let’s break down the key metrics currently driving the price:
➡️ Coinbase Premium Index: It remains deep in the red (down to -0.26%). This is a clear signal that the primary selling pressure and caution are originating from the U.S. market and institutional players.
➡️ Liquidation Map: Liquidity clusters are densely packed both above $78,000 and below $76,000. The market is practically "begging" for a manipulative stop-run in both directions before a genuine directional move occurs.
➡️ Funding Rates: Following local dips to the $74K–$76K range, funding rates have periodically cooled off, helping to clear excessive long leverage from the market. At the moment, the balance of power is extremely fragile.
➡️ Bitcoin Dominance: It remains at high levels (around 58–60%). Capital is still concentrated in the leading cryptocurrency, while altcoins have yet to see any significant influx of liquidity.
⚠️ Conclusion / Trading Outlook:
The current zone demands the utmost caution. Trading with high leverage right now is essentially a gamble, given the risk of cascading liquidations. It is worth keeping an eye on key levels: a breakout above $78K could pave the way for new attempts to rise, while a decisive break below $76K risks a deeper correction.
📊 Current $BTC Market Situation: What Are Market Makers Planning?
Bitcoin has currently settled into the $76,000 – $78,000 range, with volatility once again hitting record highs. Let’s break down the key metrics currently driving the price:
➡️ Coinbase Premium Index: It remains deep in the red (down to -0.26%). This is a clear signal that the primary selling pressure and caution are originating from the U.S. market and institutional players.
➡️ Liquidation Map: Liquidity clusters are densely packed both above $78,000 and below $76,000. The market is practically "begging" for a manipulative stop-run in both directions before a genuine directional move occurs.
➡️ Funding Rates: Following local dips to the $74K–$76K range, funding rates have periodically cooled off, helping to clear excessive long leverage from the market. At the moment, the balance of power is extremely fragile.
➡️ Bitcoin Dominance: It remains at high levels (around 58–60%). Capital is still concentrated in the leading cryptocurrency, while altcoins have yet to see any significant influx of liquidity.
⚠️ Conclusion / Trading Outlook:
The current zone demands the utmost caution. Trading with high leverage right now is essentially a gamble, given the risk of cascading liquidations. It is worth keeping an eye on key levels: a breakout above $78K could pave the way for new attempts to rise, while a decisive break below $76K risks a deeper correction.
1
1
18
Tarjimani ko‘rish
#CantonCoin
🚨SEC Classifies Canton Coin as a Digital Commodity: Cryptocurrency Rises 4% 🚀
The Canton Network team has reason for optimism: the network’s native token, Canton Coin ($CC ), has risen in value by 4% following the issuance of a "no-action letter" by staff at the U.S. Securities and Exchange Commission (SEC). The regulator classifies the token as a "digital commodity."
📊 Key details:
➡️ Market Performance: Following the news, CC traded at $0.098 (though it still shows a slight decline of approximately 4.2% over the past week).
➡️ SEC’s Stance: The letter notes that the value of CC depends on the operation of the network and demand for the token, rather than on the efforts of a centralized team to generate profit for holders.
➡️ No Enforcement Action: An SEC division confirmed it would not recommend enforcement action regarding the issuance of CC without securities registration (provided that the stated conditions are met).
➡️ Project Context: Canton Network is a privacy-focused network that enables banks and institutions to tokenize assets, as well as conduct trading and settlements across various platforms. The project was developed by the company Digital Asset.
⚠️ Similar SEC decisions (including those regarding other projects in previous years) are gradually helping to establish a clearer legal framework for crypto assets in the U.S., although the agency’s position represents an expert assessment rather than a final judicial ruling.
{future}(CCUSDT)
#CantonCoin
🚨SEC Classifies Canton Coin as a Digital Commodity: Cryptocurrency Rises 4% 🚀
The Canton Network team has reason for optimism: the network’s native token, Canton Coin ($CC ), has risen in value by 4% following the issuance of a "no-action letter" by staff at the U.S. Securities and Exchange Commission (SEC). The regulator classifies the token as a "digital commodity."
📊 Key details:
➡️ Market Performance: Following the news, CC traded at $0.098 (though it still shows a slight decline of approximately 4.2% over the past week).
➡️ SEC’s Stance: The letter notes that the value of CC depends on the operation of the network and demand for the token, rather than on the efforts of a centralized team to generate profit for holders.
➡️ No Enforcement Action: An SEC division confirmed it would not recommend enforcement action regarding the issuance of CC without securities registration (provided that the stated conditions are met).
➡️ Project Context: Canton Network is a privacy-focused network that enables banks and institutions to tokenize assets, as well as conduct trading and settlements across various platforms. The project was developed by the company Digital Asset.
⚠️ Similar SEC decisions (including those regarding other projects in previous years) are gradually helping to establish a clearer legal framework for crypto assets in the U.S., although the agency’s position represents an expert assessment rather than a final judicial ruling.
🚨SEC Classifies Canton Coin as a Digital Commodity: Cryptocurrency Rises 4% 🚀
The Canton Network team has reason for optimism: the network’s native token, Canton Coin ($CC ), has risen in value by 4% following the issuance of a "no-action letter" by staff at the U.S. Securities and Exchange Commission (SEC). The regulator classifies the token as a "digital commodity."
📊 Key details:
➡️ Market Performance: Following the news, CC traded at $0.098 (though it still shows a slight decline of approximately 4.2% over the past week).
➡️ SEC’s Stance: The letter notes that the value of CC depends on the operation of the network and demand for the token, rather than on the efforts of a centralized team to generate profit for holders.
➡️ No Enforcement Action: An SEC division confirmed it would not recommend enforcement action regarding the issuance of CC without securities registration (provided that the stated conditions are met).
➡️ Project Context: Canton Network is a privacy-focused network that enables banks and institutions to tokenize assets, as well as conduct trading and settlements across various platforms. The project was developed by the company Digital Asset.
⚠️ Similar SEC decisions (including those regarding other projects in previous years) are gradually helping to establish a clearer legal framework for crypto assets in the U.S., although the agency’s position represents an expert assessment rather than a final judicial ruling.

1
23
Tarjimani ko‘rish
#bitcoin #crypto #hold
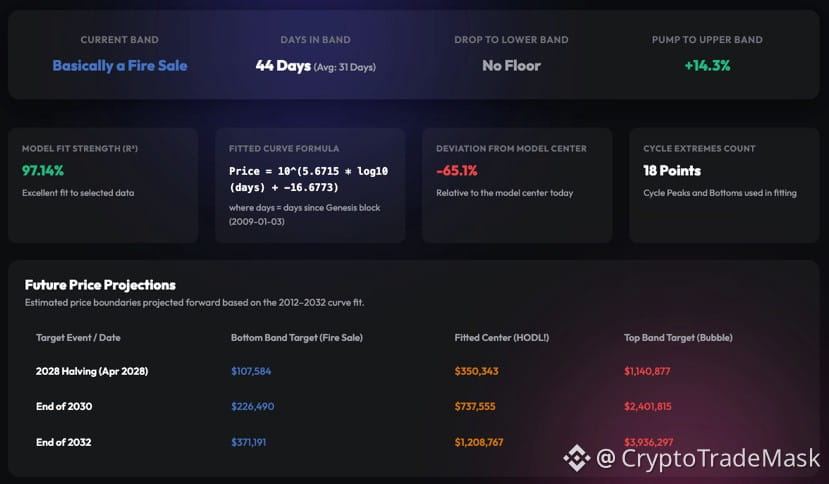
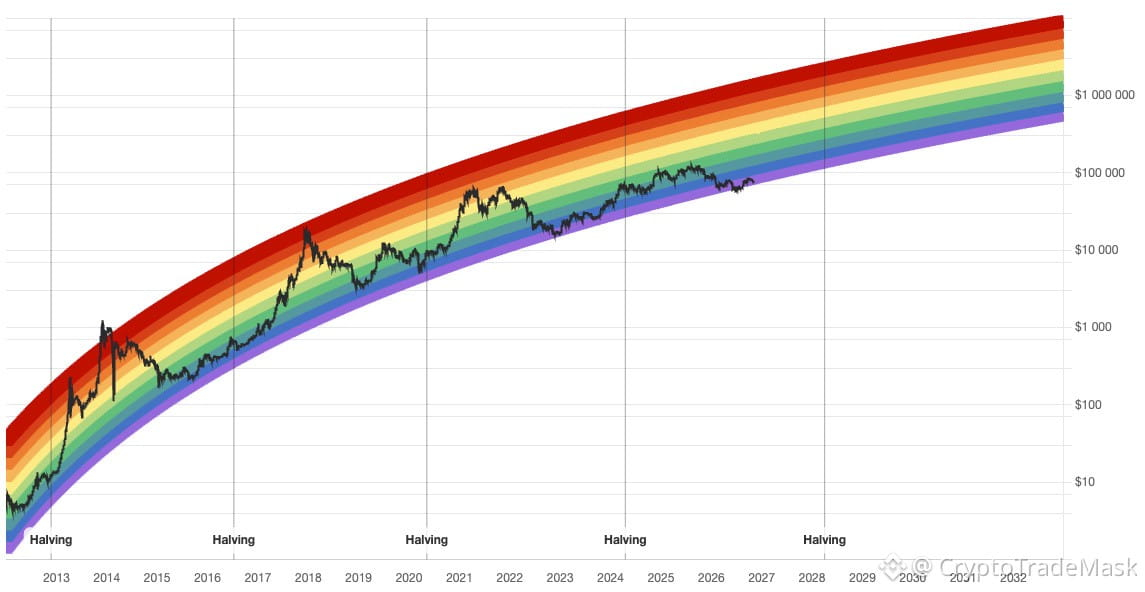
🌈 The Rainbow doesn't lie: are we still in a "fire sale"?
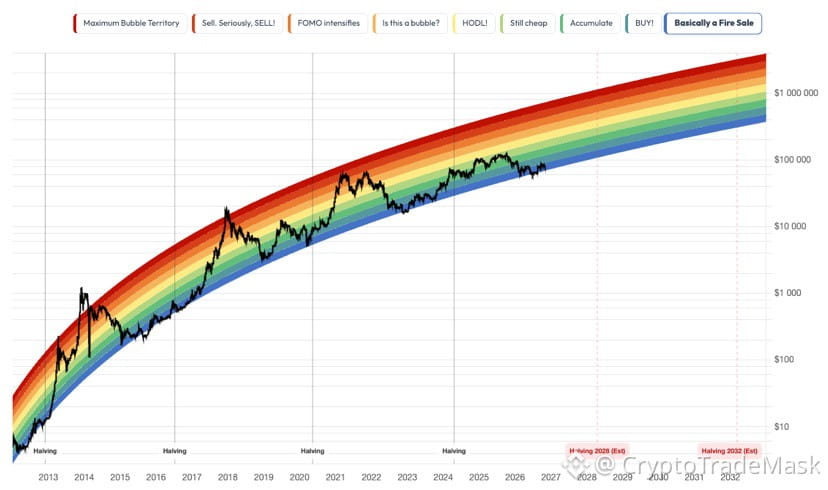
Take a look at $BTC Bitcoin’s current position relative to the historical "rainbow" trend. While many are panicking, the model indicates that the market remains in an accumulation zone—a range of exceptionally attractive prices.
📈 What the model’s mathematics suggest:
➡️ Current phase: A zone of bargain prices ("Fire Sale" / HODL)
➡️ Forecast for mid-2028: A range between $107,000 and $1.14 million
⚠️ Is it time to buy, or should you wait for new lows?
{future}(BTCUSDT)
#bitcoin #crypto #hold
🌈 The Rainbow doesn't lie: are we still in a "fire sale"?
Take a look at $BTC Bitcoin’s current position relative to the historical "rainbow" trend. While many are panicking, the model indicates that the market remains in an accumulation zone—a range of exceptionally attractive prices.
📈 What the model’s mathematics suggest:
➡️ Current phase: A zone of bargain prices ("Fire Sale" / HODL)
➡️ Forecast for mid-2028: A range between $107,000 and $1.14 million
⚠️ Is it time to buy, or should you wait for new lows?
🌈 The Rainbow doesn't lie: are we still in a "fire sale"?
Take a look at $BTC Bitcoin’s current position relative to the historical "rainbow" trend. While many are panicking, the model indicates that the market remains in an accumulation zone—a range of exceptionally attractive prices.
📈 What the model’s mathematics suggest:
➡️ Current phase: A zone of bargain prices ("Fire Sale" / HODL)
➡️ Forecast for mid-2028: A range between $107,000 and $1.14 million
⚠️ Is it time to buy, or should you wait for new lows?
1
38
Maqola
Tarjimani ko‘rish
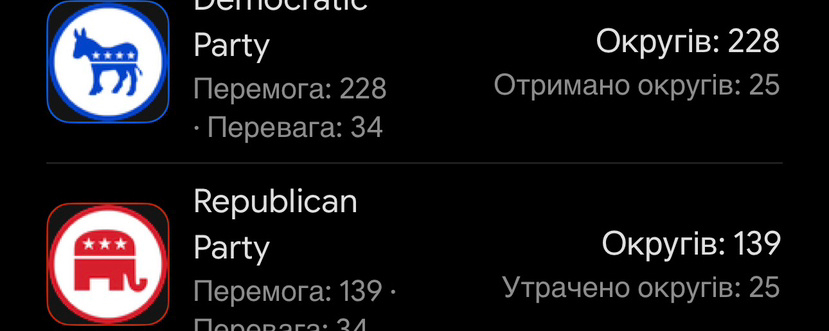
🇺🇸 2026 US Elections: How Do the Results Affect the Crypto Market?The US midterm elections concluded with a surprise for many political analysts: the Democratic Party secured control of both chambers of Congress (the Senate and the House of Representatives). For the crypto industry—which has invested heavily in lobbying over the past few years and anticipated the swift passage of favorable legislation under a Donald Trump administration—this has presented a significant challenge.
What does this mean for the digital asset market? Let’s break down the key implications:
{future}(BTCUSDT)
1. Stalling of Key Legislation (Including the CLARITY Act)
Expectations for the rapid adoption of comprehensive regulatory frameworks—such as the CLARITY Act, which aimed to clearly delineate the jurisdictions of the SEC and the CFTC—are now in doubt. A Democratic-controlled Congress is likely to push for stricter provisions regarding consumer protection, decentralized finance (DeFi), and the oversight of stablecoins. This delays the establishment of a unified legal framework, at least for the near term.
{spot}(ETHUSDT)
2. Increased Political Uncertainty and Pressure on the SEC
The shift in the balance of power in Washington signals tighter oversight of regulatory bodies. The Securities and Exchange Commission (SEC) and other agencies will likely face more intense congressional hearings. This introduces an element of uncertainty for institutional investors who had anticipated a rapid easing of regulatory policy.
{future}(ENAUSDT)
3. Market Reaction and Volatility
News regarding the election results triggered short-term volatility; futures and the prices of major cryptocurrencies (notably Bitcoin and Ethereum) faced pressure and sharp fluctuations, though the market has since partially recovered from the decline.
Additional pressure on investor sentiment has stemmed from other macro factors and recent market developments, leading the market to currently undergo a reassessment of risks.
⚠️ Summary: The crypto market has encountered a bipartisan "reality check" on the political front. Instead of rapid deregulation, the industry must now seek compromises with the new composition of Congress. In the long term, this could delay the full legalization of the market in the United States, although the fundamental position of the blockchain industry remains strong.
🇺🇸 2026 US Elections: How Do the Results Affect the Crypto Market?
The US midterm elections concluded with a surprise for many political analysts: the Democratic Party secured control of both chambers of Congress (the Senate and the House of Representatives). For the crypto industry—which has invested heavily in lobbying over the past few years and anticipated the swift passage of favorable legislation under a Donald Trump administration—this has presented a significant challenge.
What does this mean for the digital asset market? Let’s break down the key implications:
1. Stalling of Key Legislation (Including the CLARITY Act)
Expectations for the rapid adoption of comprehensive regulatory frameworks—such as the CLARITY Act, which aimed to clearly delineate the jurisdictions of the SEC and the CFTC—are now in doubt. A Democratic-controlled Congress is likely to push for stricter provisions regarding consumer protection, decentralized finance (DeFi), and the oversight of stablecoins. This delays the establishment of a unified legal framework, at least for the near term.
2. Increased Political Uncertainty and Pressure on the SEC
The shift in the balance of power in Washington signals tighter oversight of regulatory bodies. The Securities and Exchange Commission (SEC) and other agencies will likely face more intense congressional hearings. This introduces an element of uncertainty for institutional investors who had anticipated a rapid easing of regulatory policy.
3. Market Reaction and Volatility
News regarding the election results triggered short-term volatility; futures and the prices of major cryptocurrencies (notably Bitcoin and Ethereum) faced pressure and sharp fluctuations, though the market has since partially recovered from the decline.
Additional pressure on investor sentiment has stemmed from other macro factors and recent market developments, leading the market to currently undergo a reassessment of risks.
⚠️ Summary: The crypto market has encountered a bipartisan "reality check" on the political front. Instead of rapid deregulation, the industry must now seek compromises with the new composition of Congress. In the long term, this could delay the full legalization of the market in the United States, although the fundamental position of the blockchain industry remains strong.
What does this mean for the digital asset market? Let’s break down the key implications:
1. Stalling of Key Legislation (Including the CLARITY Act)
Expectations for the rapid adoption of comprehensive regulatory frameworks—such as the CLARITY Act, which aimed to clearly delineate the jurisdictions of the SEC and the CFTC—are now in doubt. A Democratic-controlled Congress is likely to push for stricter provisions regarding consumer protection, decentralized finance (DeFi), and the oversight of stablecoins. This delays the establishment of a unified legal framework, at least for the near term.
2. Increased Political Uncertainty and Pressure on the SEC
The shift in the balance of power in Washington signals tighter oversight of regulatory bodies. The Securities and Exchange Commission (SEC) and other agencies will likely face more intense congressional hearings. This introduces an element of uncertainty for institutional investors who had anticipated a rapid easing of regulatory policy.
3. Market Reaction and Volatility
News regarding the election results triggered short-term volatility; futures and the prices of major cryptocurrencies (notably Bitcoin and Ethereum) faced pressure and sharp fluctuations, though the market has since partially recovered from the decline.
Additional pressure on investor sentiment has stemmed from other macro factors and recent market developments, leading the market to currently undergo a reassessment of risks.
⚠️ Summary: The crypto market has encountered a bipartisan "reality check" on the political front. Instead of rapid deregulation, the industry must now seek compromises with the new composition of Congress. In the long term, this could delay the full legalization of the market in the United States, although the fundamental position of the blockchain industry remains strong.
1
2
41
Tarjimani ko‘rish
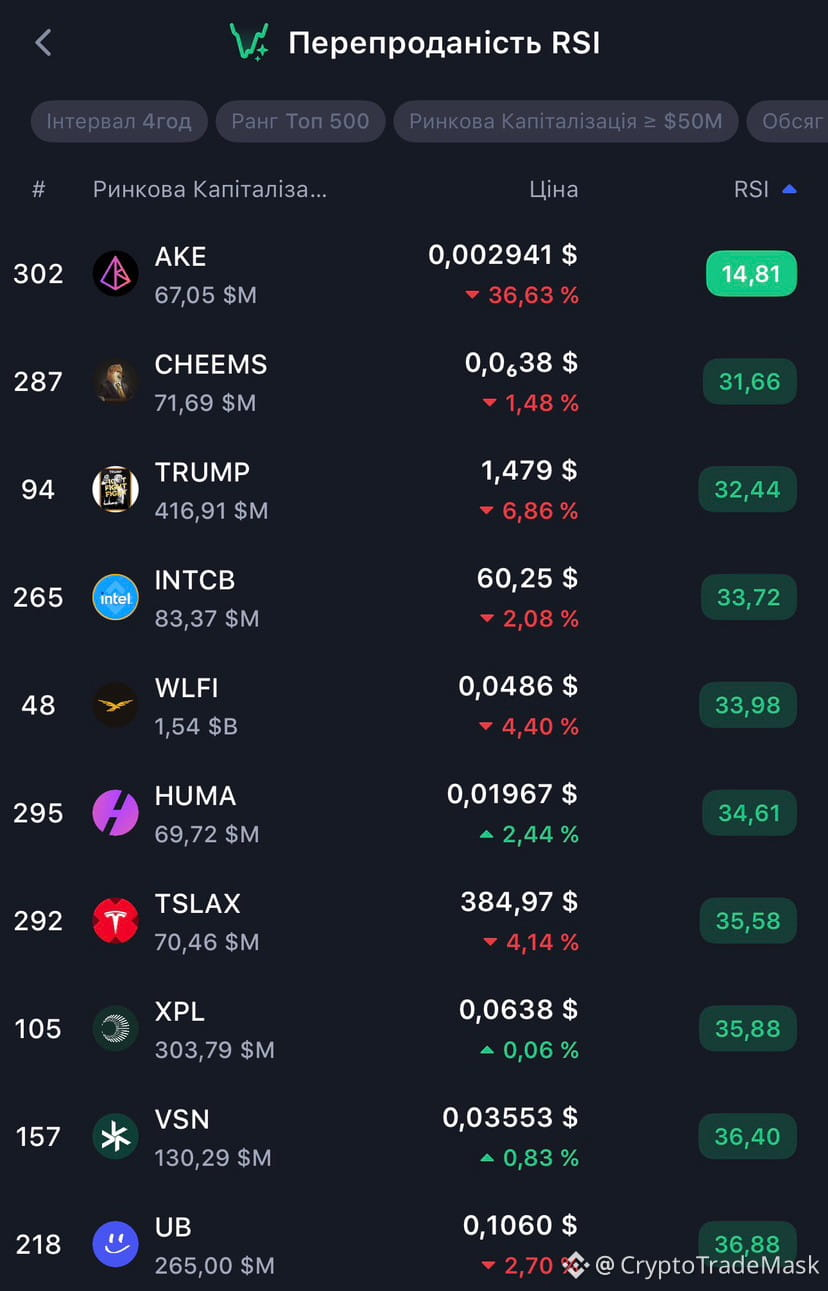
#Overbought & #oversold
📊 Overbought & Oversold: How does it work? 📈📉
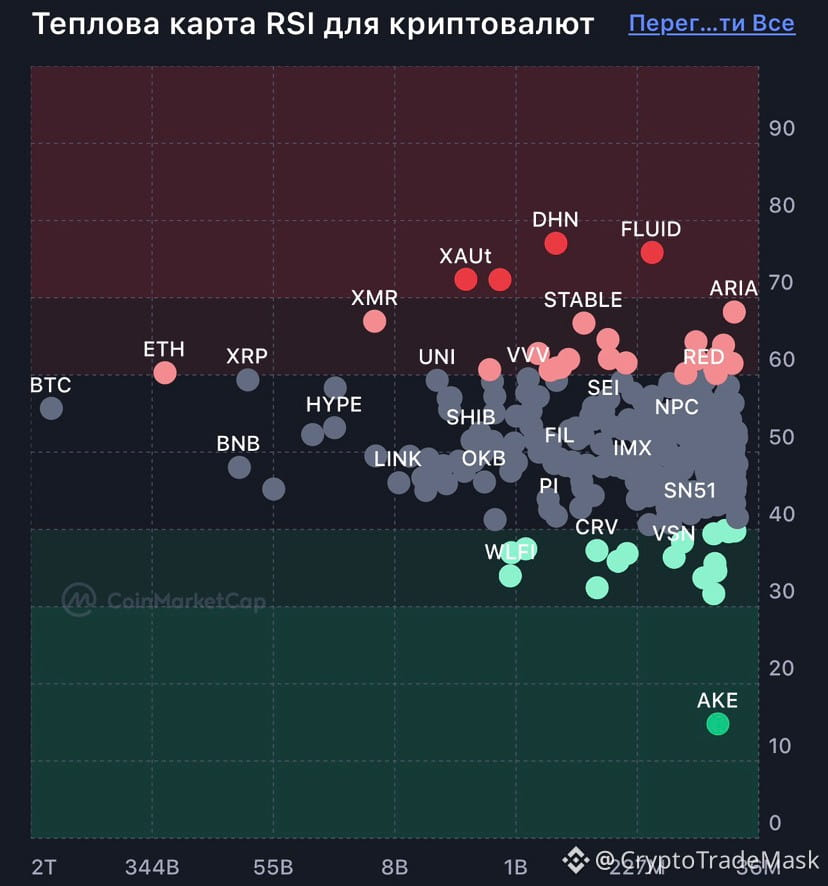
Key market zones that indicate when the price may reverse.
🟢 Oversold
• The price has fallen too low - temporarily or excessively.
• RSI < 30.
• There may be a chance of a rebound - the asset is becoming interesting to buy.
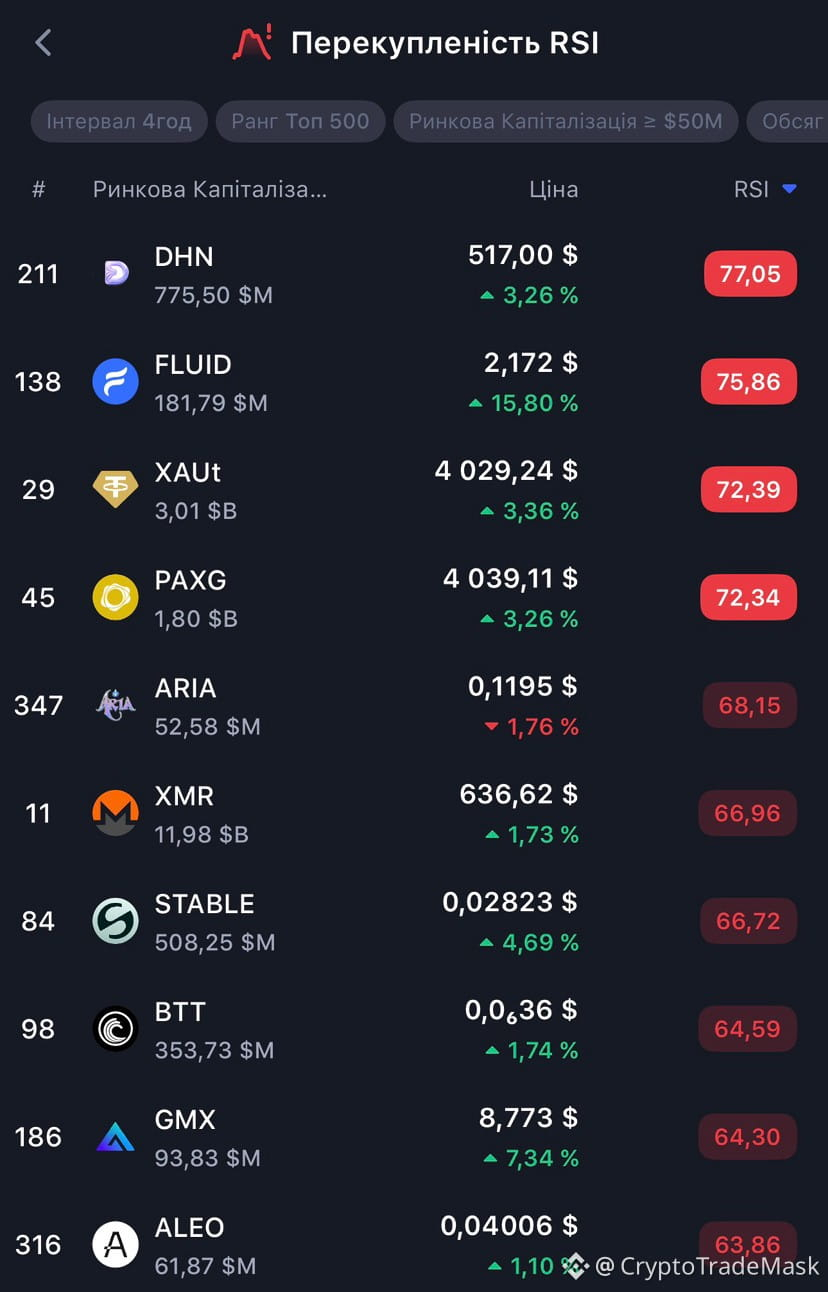
• Many coins are now in this zone: $AKE - a bottom may be forming.
🔴 Overbought
• The price has risen too much.
• RSI > 70.
• A correction or pause after growth is likely - it's time to take profits.
• In this zone now: $FLUID , $PAXG - a cooling after a surge is possible.
⚠️ Rule of thumb: no indicator gives guarantees - they are only hints, not a verdict.
{future}(PAXGUSDT)
{future}(FLUIDUSDT)
{future}(AKEUSDT)
#Overbought & #oversold
📊 Overbought & Oversold: How does it work? 📈📉
Key market zones that indicate when the price may reverse.
🟢 Oversold
• The price has fallen too low - temporarily or excessively.
• RSI < 30.
• There may be a chance of a rebound - the asset is becoming interesting to buy.
• Many coins are now in this zone: $AKE - a bottom may be forming.
🔴 Overbought
• The price has risen too much.
• RSI > 70.
• A correction or pause after growth is likely - it's time to take profits.
• In this zone now: $FLUID , $PAXG - a cooling after a surge is possible.
⚠️ Rule of thumb: no indicator gives guarantees - they are only hints, not a verdict.
📊 Overbought & Oversold: How does it work? 📈📉
Key market zones that indicate when the price may reverse.
🟢 Oversold
• The price has fallen too low - temporarily or excessively.
• RSI < 30.
• There may be a chance of a rebound - the asset is becoming interesting to buy.
• Many coins are now in this zone: $AKE - a bottom may be forming.
🔴 Overbought
• The price has risen too much.
• RSI > 70.
• A correction or pause after growth is likely - it's time to take profits.
• In this zone now: $FLUID , $PAXG - a cooling after a surge is possible.
⚠️ Rule of thumb: no indicator gives guarantees - they are only hints, not a verdict.
1
57
Tarjimani ko‘rish
#Liquidations
Market Bloodbath: Crypto Market Sees $435M in Liquidations 📉
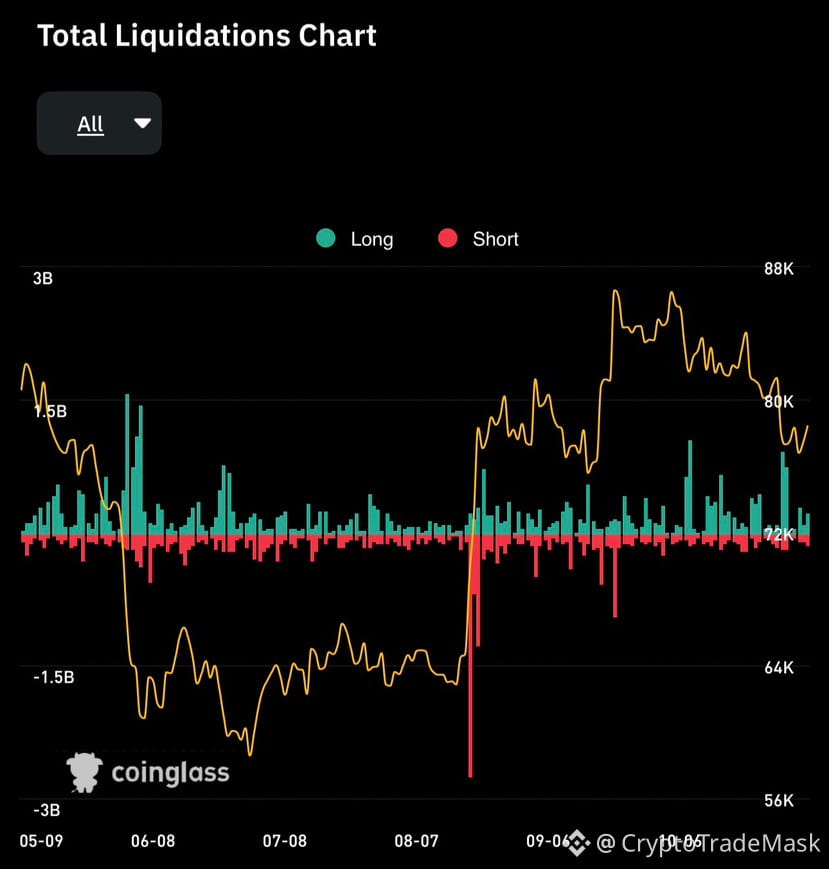
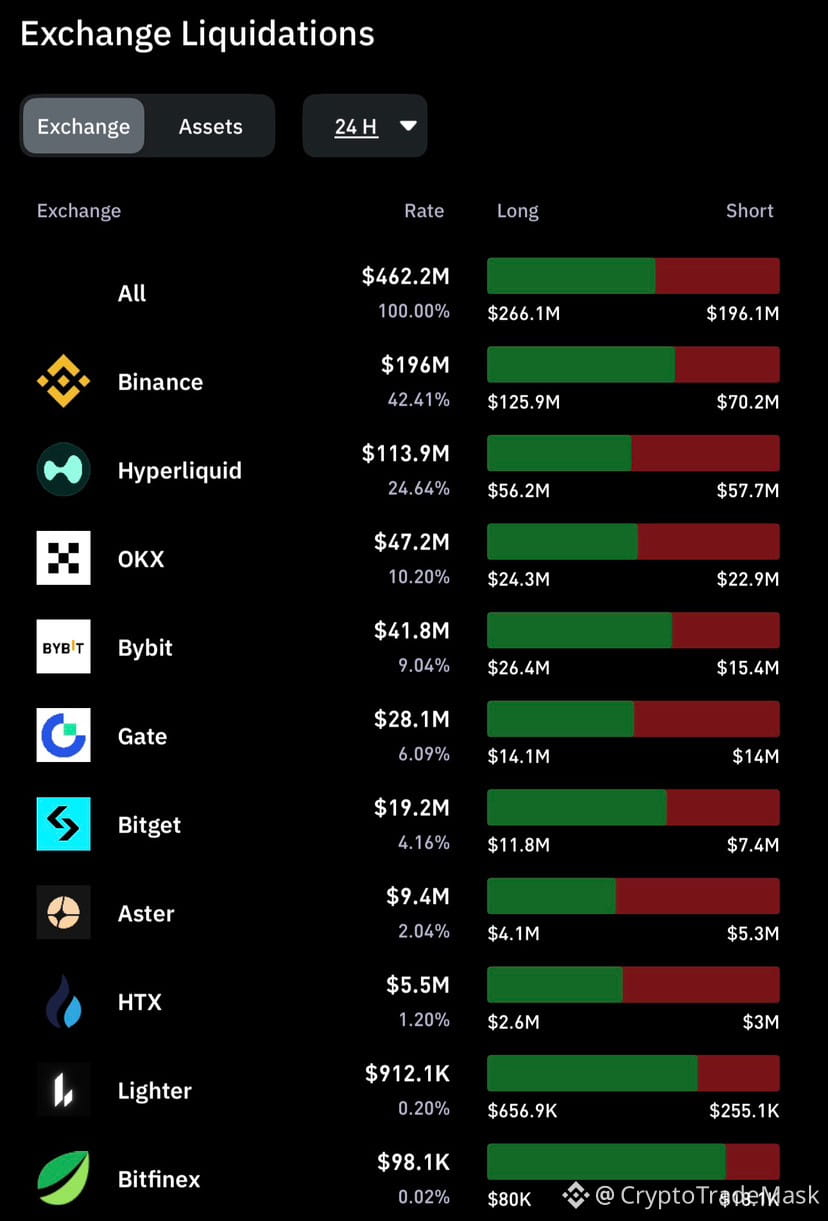
Another storm has hit the crypto industry: over the last 24 hours, liquidation volume reached $435–440 million, affecting nearly 92,000 traders. The market has once again demonstrated the brutal reality of high leverage.
📊 Key Figures:
Who took the biggest hit: Long positions bore the brunt of the impact, accounting for $269 million (61.2%), while short positions lost $171 million.
Leading the decline: Bitcoin topped the list with $163.8 million in liquidations, followed by Ethereum with $68 million.
Exchanges: Hyperliquid ($39.8 million) and Binance ($29 million) saw the highest liquidation volumes; Binance also recorded the single largest liquidation—an $ETH /USDT position worth $5.03 million.
🔍 What’s the situation with Bitcoin ($BTC )?
BTC is trading around $78,006 following a pullback from its October highs near $87,000. Attention is now focused on a critical support zone between $76,000 and $78,000, where long-term moving averages converge.
📉 Support: If this zone is breached, the next potential levels of support are $74,000 and possibly $70,000.
📈 Resistance: The immediate hurdle lies in the $80,000–$82,000 range. Momentum: The RSI is sliding into the lower half of the range—bullish momentum is fading, though the market is not yet fully oversold.
⚠️ High leverage and risk management are once again playing a key role. Will the market hold current support, or are we bracing for a new wave?
{future}(BTCUSDT)
{future}(ETHUSDT)
#Liquidations
Market Bloodbath: Crypto Market Sees $435M in Liquidations 📉
Another storm has hit the crypto industry: over the last 24 hours, liquidation volume reached $435–440 million, affecting nearly 92,000 traders. The market has once again demonstrated the brutal reality of high leverage.
📊 Key Figures:
Who took the biggest hit: Long positions bore the brunt of the impact, accounting for $269 million (61.2%), while short positions lost $171 million.
Leading the decline: Bitcoin topped the list with $163.8 million in liquidations, followed by Ethereum with $68 million.
Exchanges: Hyperliquid ($39.8 million) and Binance ($29 million) saw the highest liquidation volumes; Binance also recorded the single largest liquidation—an $ETH /USDT position worth $5.03 million.
🔍 What’s the situation with Bitcoin ($BTC )?
BTC is trading around $78,006 following a pullback from its October highs near $87,000. Attention is now focused on a critical support zone between $76,000 and $78,000, where long-term moving averages converge.
📉 Support: If this zone is breached, the next potential levels of support are $74,000 and possibly $70,000.
📈 Resistance: The immediate hurdle lies in the $80,000–$82,000 range. Momentum: The RSI is sliding into the lower half of the range—bullish momentum is fading, though the market is not yet fully oversold.
⚠️ High leverage and risk management are once again playing a key role. Will the market hold current support, or are we bracing for a new wave?
Market Bloodbath: Crypto Market Sees $435M in Liquidations 📉
Another storm has hit the crypto industry: over the last 24 hours, liquidation volume reached $435–440 million, affecting nearly 92,000 traders. The market has once again demonstrated the brutal reality of high leverage.
📊 Key Figures:
Who took the biggest hit: Long positions bore the brunt of the impact, accounting for $269 million (61.2%), while short positions lost $171 million.
Leading the decline: Bitcoin topped the list with $163.8 million in liquidations, followed by Ethereum with $68 million.
Exchanges: Hyperliquid ($39.8 million) and Binance ($29 million) saw the highest liquidation volumes; Binance also recorded the single largest liquidation—an $ETH /USDT position worth $5.03 million.
🔍 What’s the situation with Bitcoin ($BTC )?
BTC is trading around $78,006 following a pullback from its October highs near $87,000. Attention is now focused on a critical support zone between $76,000 and $78,000, where long-term moving averages converge.
📉 Support: If this zone is breached, the next potential levels of support are $74,000 and possibly $70,000.
📈 Resistance: The immediate hurdle lies in the $80,000–$82,000 range. Momentum: The RSI is sliding into the lower half of the range—bullish momentum is fading, though the market is not yet fully oversold.
⚠️ High leverage and risk management are once again playing a key role. Will the market hold current support, or are we bracing for a new wave?
1
65
Tarjimani ko‘rish
#cryptotradingpro #BTC
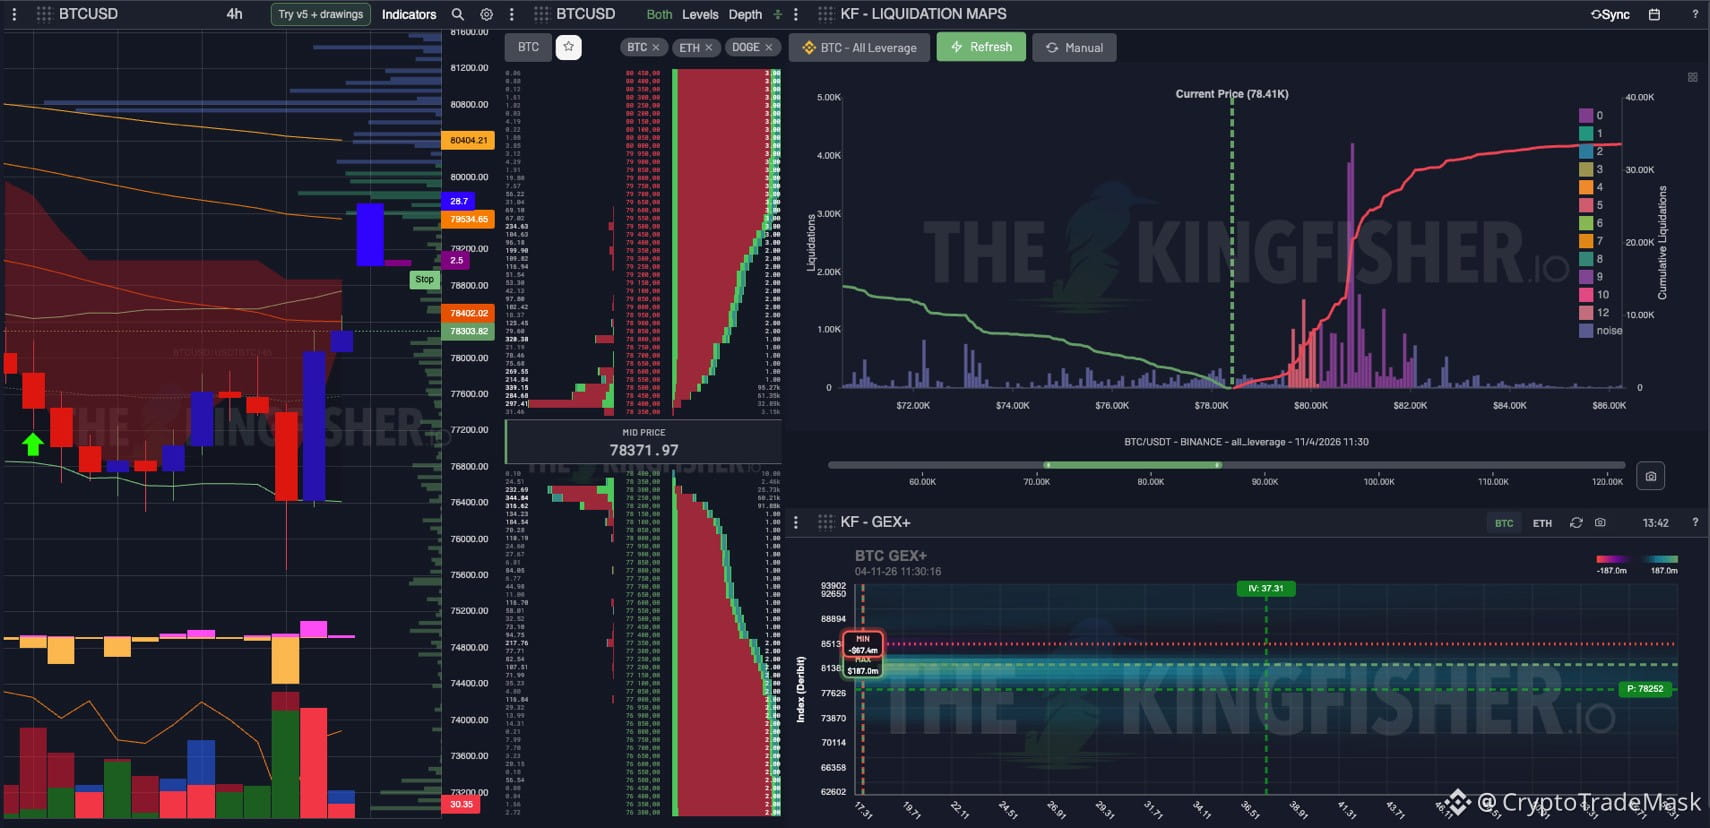
📈 $BTC Market Analysis: What’s Next?
Looking at the current situation via The Kingfisher (BTCUSDT chart and liquidation map), a few interesting details stand out:
➡️ Current Price: Bitcoin is trading around $78,410, holding its local position.
➡️ Liquidation Clusters Above: The liquidation map clearly shows dense zones above the current level—significant interest and massive volume are concentrated in the $80,000 – $84,000 range.
➡️ Potential Short Squeeze: This structure suggests that a move above the psychological $80k mark could trigger a cascade of short-position liquidations, leading to a sharp upward surge.
➡️ Volatility and GEX: Gamma Exposure (GEX) metrics indicate high market sensitivity, increasing the likelihood of dynamic moves upon breaking key levels.
⚠️ Conclusion: The market is in a phase of accumulation near critical thresholds. Keep an eye on price reactions around round-number levels and trading volume—a breakout above $80,000 opens the path toward higher liquidity.
{future}(BTCUSDT)
#cryptotradingpro #BTC
📈 $BTC Market Analysis: What’s Next?
Looking at the current situation via The Kingfisher (BTCUSDT chart and liquidation map), a few interesting details stand out:
➡️ Current Price: Bitcoin is trading around $78,410, holding its local position.
➡️ Liquidation Clusters Above: The liquidation map clearly shows dense zones above the current level—significant interest and massive volume are concentrated in the $80,000 – $84,000 range.
➡️ Potential Short Squeeze: This structure suggests that a move above the psychological $80k mark could trigger a cascade of short-position liquidations, leading to a sharp upward surge.
➡️ Volatility and GEX: Gamma Exposure (GEX) metrics indicate high market sensitivity, increasing the likelihood of dynamic moves upon breaking key levels.
⚠️ Conclusion: The market is in a phase of accumulation near critical thresholds. Keep an eye on price reactions around round-number levels and trading volume—a breakout above $80,000 opens the path toward higher liquidity.
📈 $BTC Market Analysis: What’s Next?
Looking at the current situation via The Kingfisher (BTCUSDT chart and liquidation map), a few interesting details stand out:
➡️ Current Price: Bitcoin is trading around $78,410, holding its local position.
➡️ Liquidation Clusters Above: The liquidation map clearly shows dense zones above the current level—significant interest and massive volume are concentrated in the $80,000 – $84,000 range.
➡️ Potential Short Squeeze: This structure suggests that a move above the psychological $80k mark could trigger a cascade of short-position liquidations, leading to a sharp upward surge.
➡️ Volatility and GEX: Gamma Exposure (GEX) metrics indicate high market sensitivity, increasing the likelihood of dynamic moves upon breaking key levels.
⚠️ Conclusion: The market is in a phase of accumulation near critical thresholds. Keep an eye on price reactions around round-number levels and trading volume—a breakout above $80,000 opens the path toward higher liquidity.
1
59
Tarjimani ko‘rish
🚀 Market Overview: Kamino $KMNO ($0.0340 | +13.35%)
The cryptocurrency market continues to surprise with its movements, and today, the Kamino project has taken center stage. Let’s look at key developments, news, and trading scenarios.
📊 Key News and Events
1. Launch of a New Liquidity Pool
Event: Pools have been launched offering yields of up to 20% per day for early participants.
Commentary: This attracts additional capital to the ecosystem and boosts user activity.
2. Integration and Partnerships
Event: The project is integrating with new protocols. Furthermore, there are rumors regarding potential support for derivatives and future listings on major exchanges (with discussions specifically mentioning the possibility of related assets appearing on Binance).
Commentary: Fundamentally, this strengthens demand for the $KMNO token and increases its market visibility.
3. Technical Analysis and Price Levels
Current Price: $0.0340 (+13.35%).
Key Levels: Local support is found at $0.032, while the nearest resistance is at $0.038. It is recommended to set a stop-loss near $0.030.
🚦 Trading Scenarios
🟢 Bullish Scenario: A breakout above the $0.038 resistance level would pave the way for further rapid upward movement. It is recommended to take profits incrementally.
🔴 Correction Scenario (Bearish): If selling pressure intensifies and the $0.032 support level is broken, a pullback to the $0.030 level is possible. Keep an eye on trading volumes.
⚠️ Conclusion and Questions for the Community
Overall Summary: Kamino demonstrates strong technical momentum and is supported by new product launches, making it an interesting option for short- and medium-term strategies.
{future}(KMNOUSDT)
🚀 Market Overview: Kamino $KMNO ($0.0340 | +13.35%)
The cryptocurrency market continues to surprise with its movements, and today, the Kamino project has taken center stage. Let’s look at key developments, news, and trading scenarios.
📊 Key News and Events
1. Launch of a New Liquidity Pool
Event: Pools have been launched offering yields of up to 20% per day for early participants.
Commentary: This attracts additional capital to the ecosystem and boosts user activity.
2. Integration and Partnerships
Event: The project is integrating with new protocols. Furthermore, there are rumors regarding potential support for derivatives and future listings on major exchanges (with discussions specifically mentioning the possibility of related assets appearing on Binance).
Commentary: Fundamentally, this strengthens demand for the $KMNO token and increases its market visibility.
3. Technical Analysis and Price Levels
Current Price: $0.0340 (+13.35%).
Key Levels: Local support is found at $0.032, while the nearest resistance is at $0.038. It is recommended to set a stop-loss near $0.030.
🚦 Trading Scenarios
🟢 Bullish Scenario: A breakout above the $0.038 resistance level would pave the way for further rapid upward movement. It is recommended to take profits incrementally.
🔴 Correction Scenario (Bearish): If selling pressure intensifies and the $0.032 support level is broken, a pullback to the $0.030 level is possible. Keep an eye on trading volumes.
⚠️ Conclusion and Questions for the Community
Overall Summary: Kamino demonstrates strong technical momentum and is supported by new product launches, making it an interesting option for short- and medium-term strategies.
The cryptocurrency market continues to surprise with its movements, and today, the Kamino project has taken center stage. Let’s look at key developments, news, and trading scenarios.
📊 Key News and Events
1. Launch of a New Liquidity Pool
Event: Pools have been launched offering yields of up to 20% per day for early participants.
Commentary: This attracts additional capital to the ecosystem and boosts user activity.
2. Integration and Partnerships
Event: The project is integrating with new protocols. Furthermore, there are rumors regarding potential support for derivatives and future listings on major exchanges (with discussions specifically mentioning the possibility of related assets appearing on Binance).
Commentary: Fundamentally, this strengthens demand for the $KMNO token and increases its market visibility.
3. Technical Analysis and Price Levels
Current Price: $0.0340 (+13.35%).
Key Levels: Local support is found at $0.032, while the nearest resistance is at $0.038. It is recommended to set a stop-loss near $0.030.
🚦 Trading Scenarios
🟢 Bullish Scenario: A breakout above the $0.038 resistance level would pave the way for further rapid upward movement. It is recommended to take profits incrementally.
🔴 Correction Scenario (Bearish): If selling pressure intensifies and the $0.032 support level is broken, a pullback to the $0.030 level is possible. Keep an eye on trading volumes.
⚠️ Conclusion and Questions for the Community
Overall Summary: Kamino demonstrates strong technical momentum and is supported by new product launches, making it an interesting option for short- and medium-term strategies.

1
77
Tarjimani ko‘rish
#MegaETH
🚀 MegaETH ($MEGA ): Market Overview and Outlook
Over the past 24 hours, the MegaETH ($MEGA ) token has seen a price change of 11.49%, reaching $0.0458. Meanwhile, Bitcoin has risen by 2.08%.
Below is a detailed breakdown of key factors, market metrics, and strategies for this asset.
1️⃣ Market and Liquidity
Trading Activity: Trading volume surged by 527% over the last 24 hours, reaching $36.6 million, while the total market capitalization hit $51.7 million.
Volume-to-Market Cap Ratio: The ratio stands at 0.709, indicating a high level of trader interest in the coin.
Potential Risks: High volatility and sharp fluctuations in volume could lead to rapid trend reversals; therefore, adhering to risk management practices is essential.
2️⃣ Fundamental Factors
Market Context: The token's movement is largely influenced by the general sentiment in the crypto market, as well as news surrounding the Ethereum ecosystem and related projects.
Positive Drivers: Anticipation of new integrations or ecosystem expansion could serve as catalysts for further growth.
3️⃣ Trading Scenarios and Levels
Position Analysis: The current price is $0.0458. Support levels are located at $0.043 and further down near $0.04. Targets and Risks: If the upward movement continues, the immediate target could be a retest of local highs; however, one should consider the risk of a deep correction if support is broken.
{future}(MEGAUSDT)
#MegaETH
🚀 MegaETH ($MEGA ): Market Overview and Outlook
Over the past 24 hours, the MegaETH ($MEGA ) token has seen a price change of 11.49%, reaching $0.0458. Meanwhile, Bitcoin has risen by 2.08%.
Below is a detailed breakdown of key factors, market metrics, and strategies for this asset.
1️⃣ Market and Liquidity
Trading Activity: Trading volume surged by 527% over the last 24 hours, reaching $36.6 million, while the total market capitalization hit $51.7 million.
Volume-to-Market Cap Ratio: The ratio stands at 0.709, indicating a high level of trader interest in the coin.
Potential Risks: High volatility and sharp fluctuations in volume could lead to rapid trend reversals; therefore, adhering to risk management practices is essential.
2️⃣ Fundamental Factors
Market Context: The token's movement is largely influenced by the general sentiment in the crypto market, as well as news surrounding the Ethereum ecosystem and related projects.
Positive Drivers: Anticipation of new integrations or ecosystem expansion could serve as catalysts for further growth.
3️⃣ Trading Scenarios and Levels
Position Analysis: The current price is $0.0458. Support levels are located at $0.043 and further down near $0.04. Targets and Risks: If the upward movement continues, the immediate target could be a retest of local highs; however, one should consider the risk of a deep correction if support is broken.
🚀 MegaETH ($MEGA ): Market Overview and Outlook
Over the past 24 hours, the MegaETH ($MEGA ) token has seen a price change of 11.49%, reaching $0.0458. Meanwhile, Bitcoin has risen by 2.08%.
Below is a detailed breakdown of key factors, market metrics, and strategies for this asset.
1️⃣ Market and Liquidity
Trading Activity: Trading volume surged by 527% over the last 24 hours, reaching $36.6 million, while the total market capitalization hit $51.7 million.
Volume-to-Market Cap Ratio: The ratio stands at 0.709, indicating a high level of trader interest in the coin.
Potential Risks: High volatility and sharp fluctuations in volume could lead to rapid trend reversals; therefore, adhering to risk management practices is essential.
2️⃣ Fundamental Factors
Market Context: The token's movement is largely influenced by the general sentiment in the crypto market, as well as news surrounding the Ethereum ecosystem and related projects.
Positive Drivers: Anticipation of new integrations or ecosystem expansion could serve as catalysts for further growth.
3️⃣ Trading Scenarios and Levels
Position Analysis: The current price is $0.0458. Support levels are located at $0.043 and further down near $0.04. Targets and Risks: If the upward movement continues, the immediate target could be a retest of local highs; however, one should consider the risk of a deep correction if support is broken.

1
82
Tarjimani ko‘rish
#Bubblemaps
🚀 Bubblemaps ($BMT ) in the Spotlight: What’s Happening with the Token?
Over the last 24 hours, the BMT token has risen by 12.71%, reaching a price of $0.0240. The primary catalyst was an announcement from Binance, though the market remains tense.
Let’s break down the key factors driving the coin’s current movement:
1️⃣ New Development from Binance and Cross-Chain Integration
What happened: The Binance exchange announced support for the BMT token on the BSC and Solana networks (launching on November 3 at 04:00 UTC).
Pros: This provides a massive boost to liquidity and opens the project up to a broader audience of investors.
Cons: The introduction of new networks could fragment existing liquidity across different blockchains.
2️⃣ Massive Surge in Trading Volume
What happened: Trading volume has spiked by 240.15%, exceeding $35.1 million, with a volume-to-market-cap ratio of 1.92.
Pros: High liquidity ensures rapid order execution and indicates strong interest from traders.
Cons: Such sharp spikes are often accompanied by high volatility and the risk of a correction.
3️⃣ Technical Analysis and Key Levels
Current situation: BMT is attempting to establish a foothold above the $0.022 mark. Upside targets: Immediate resistance lies at $0.027. A breakout could lead to a move toward the $0.027–$0.030 range.
Support levels: In the event of a decline, $0.020 serves as a key defensive zone, while $0.018 is the critical level.
⚠️ Conclusion: Despite positive news from Binance, the market remains unpredictable.
{future}(BMTUSDT)
#Bubblemaps
🚀 Bubblemaps ($BMT ) in the Spotlight: What’s Happening with the Token?
Over the last 24 hours, the BMT token has risen by 12.71%, reaching a price of $0.0240. The primary catalyst was an announcement from Binance, though the market remains tense.
Let’s break down the key factors driving the coin’s current movement:
1️⃣ New Development from Binance and Cross-Chain Integration
What happened: The Binance exchange announced support for the BMT token on the BSC and Solana networks (launching on November 3 at 04:00 UTC).
Pros: This provides a massive boost to liquidity and opens the project up to a broader audience of investors.
Cons: The introduction of new networks could fragment existing liquidity across different blockchains.
2️⃣ Massive Surge in Trading Volume
What happened: Trading volume has spiked by 240.15%, exceeding $35.1 million, with a volume-to-market-cap ratio of 1.92.
Pros: High liquidity ensures rapid order execution and indicates strong interest from traders.
Cons: Such sharp spikes are often accompanied by high volatility and the risk of a correction.
3️⃣ Technical Analysis and Key Levels
Current situation: BMT is attempting to establish a foothold above the $0.022 mark. Upside targets: Immediate resistance lies at $0.027. A breakout could lead to a move toward the $0.027–$0.030 range.
Support levels: In the event of a decline, $0.020 serves as a key defensive zone, while $0.018 is the critical level.
⚠️ Conclusion: Despite positive news from Binance, the market remains unpredictable.
🚀 Bubblemaps ($BMT ) in the Spotlight: What’s Happening with the Token?
Over the last 24 hours, the BMT token has risen by 12.71%, reaching a price of $0.0240. The primary catalyst was an announcement from Binance, though the market remains tense.
Let’s break down the key factors driving the coin’s current movement:
1️⃣ New Development from Binance and Cross-Chain Integration
What happened: The Binance exchange announced support for the BMT token on the BSC and Solana networks (launching on November 3 at 04:00 UTC).
Pros: This provides a massive boost to liquidity and opens the project up to a broader audience of investors.
Cons: The introduction of new networks could fragment existing liquidity across different blockchains.
2️⃣ Massive Surge in Trading Volume
What happened: Trading volume has spiked by 240.15%, exceeding $35.1 million, with a volume-to-market-cap ratio of 1.92.
Pros: High liquidity ensures rapid order execution and indicates strong interest from traders.
Cons: Such sharp spikes are often accompanied by high volatility and the risk of a correction.
3️⃣ Technical Analysis and Key Levels
Current situation: BMT is attempting to establish a foothold above the $0.022 mark. Upside targets: Immediate resistance lies at $0.027. A breakout could lead to a move toward the $0.027–$0.030 range.
Support levels: In the event of a decline, $0.020 serves as a key defensive zone, while $0.018 is the critical level.
⚠️ Conclusion: Despite positive news from Binance, the market remains unpredictable.

58
#CryptoMarkets
📉 Kripto bozori va Osiyo birjalari bosim ostida: Bitcoin 77 000 dollardan pastga tushdi
Seshanba kuni ertalab Osiyoda Bitcoin 2% ga tushib, 77 000 dollardan pastga ketdi va kechagi tiklanishni to‘liq yo‘qqa chiqardi. Kengroq bozor pasayishi fonida boshqa yirik kriptovalyutalar ham arzonlashdi.
📊 Muhim voqealar va raqamlar:
➡️ Kriptovalyutalar: $ZEC eng katta yo‘qotishlarga uchrab, qariyb 10% ga tushdi va taxminan 1 140 dollarni tashkil etdi. $HYPE 5% ga (taxminan 84 dollar), SOL 3% ga (taxminan 92 dollar) pasaydi, BNB, Ether va $DOGE esa har biri 2% dan yo‘qotdi (Ether 2 250 dollardan sal yuqori darajada qoldi). TRX o‘sishga erishgan yagona yirik aktiv bo‘lib, 2% ga ko‘tarildi.
➡️ Uoll-strit va Osiyo: Global sotuvlar AQShda boshlandi: Nasdaq 100 indeksi tuzatish hududiga kirib, eng yuqori nuqtasidan 10% ga pasaydi, AQSh chip ishlab chiqaruvchilari indeksi esa uch kun ichida 12% ga tushdi. Bu Osiyo bozorlariga ham ta’sir qildi: Janubiy Koreyaning Kospi indeksi 3% dan ko‘proq pasaydi.
➡️ Siyosiy omil: Investorlar AQShdagi oraliq saylovlar natijalarini intiqlik bilan kutmoqda. Dastlabki natijalar chorshanba kuniyoq e’lon qilinishi kutilmoqda.
⚠️ Bozordagi vaziyat rivojini kuzatib boring!
{future}(DOGEUSDT)
{future}(HYPEUSDT)
{future}(ZECUSDT)
#CryptoMarkets
📉 Kripto bozori va Osiyo birjalari bosim ostida: Bitcoin 77 000 dollardan pastga tushdi
Seshanba kuni ertalab Osiyoda Bitcoin 2% ga tushib, 77 000 dollardan pastga ketdi va kechagi tiklanishni to‘liq yo‘qqa chiqardi. Kengroq bozor pasayishi fonida boshqa yirik kriptovalyutalar ham arzonlashdi.
📊 Muhim voqealar va raqamlar:
➡️ Kriptovalyutalar: $ZEC eng katta yo‘qotishlarga uchrab, qariyb 10% ga tushdi va taxminan 1 140 dollarni tashkil etdi. $HYPE 5% ga (taxminan 84 dollar), SOL 3% ga (taxminan 92 dollar) pasaydi, BNB, Ether va $DOGE esa har biri 2% dan yo‘qotdi (Ether 2 250 dollardan sal yuqori darajada qoldi). TRX o‘sishga erishgan yagona yirik aktiv bo‘lib, 2% ga ko‘tarildi.
➡️ Uoll-strit va Osiyo: Global sotuvlar AQShda boshlandi: Nasdaq 100 indeksi tuzatish hududiga kirib, eng yuqori nuqtasidan 10% ga pasaydi, AQSh chip ishlab chiqaruvchilari indeksi esa uch kun ichida 12% ga tushdi. Bu Osiyo bozorlariga ham ta’sir qildi: Janubiy Koreyaning Kospi indeksi 3% dan ko‘proq pasaydi.
➡️ Siyosiy omil: Investorlar AQShdagi oraliq saylovlar natijalarini intiqlik bilan kutmoqda. Dastlabki natijalar chorshanba kuniyoq e’lon qilinishi kutilmoqda.
⚠️ Bozordagi vaziyat rivojini kuzatib boring!
📉 Kripto bozori va Osiyo birjalari bosim ostida: Bitcoin 77 000 dollardan pastga tushdi
Seshanba kuni ertalab Osiyoda Bitcoin 2% ga tushib, 77 000 dollardan pastga ketdi va kechagi tiklanishni to‘liq yo‘qqa chiqardi. Kengroq bozor pasayishi fonida boshqa yirik kriptovalyutalar ham arzonlashdi.
📊 Muhim voqealar va raqamlar:
➡️ Kriptovalyutalar: $ZEC eng katta yo‘qotishlarga uchrab, qariyb 10% ga tushdi va taxminan 1 140 dollarni tashkil etdi. $HYPE 5% ga (taxminan 84 dollar), SOL 3% ga (taxminan 92 dollar) pasaydi, BNB, Ether va $DOGE esa har biri 2% dan yo‘qotdi (Ether 2 250 dollardan sal yuqori darajada qoldi). TRX o‘sishga erishgan yagona yirik aktiv bo‘lib, 2% ga ko‘tarildi.
➡️ Uoll-strit va Osiyo: Global sotuvlar AQShda boshlandi: Nasdaq 100 indeksi tuzatish hududiga kirib, eng yuqori nuqtasidan 10% ga pasaydi, AQSh chip ishlab chiqaruvchilari indeksi esa uch kun ichida 12% ga tushdi. Bu Osiyo bozorlariga ham ta’sir qildi: Janubiy Koreyaning Kospi indeksi 3% dan ko‘proq pasaydi.
➡️ Siyosiy omil: Investorlar AQShdagi oraliq saylovlar natijalarini intiqlik bilan kutmoqda. Dastlabki natijalar chorshanba kuniyoq e’lon qilinishi kutilmoqda.
⚠️ Bozordagi vaziyat rivojini kuzatib boring!
76
Tarjimani ko‘rish
#GrowthFall
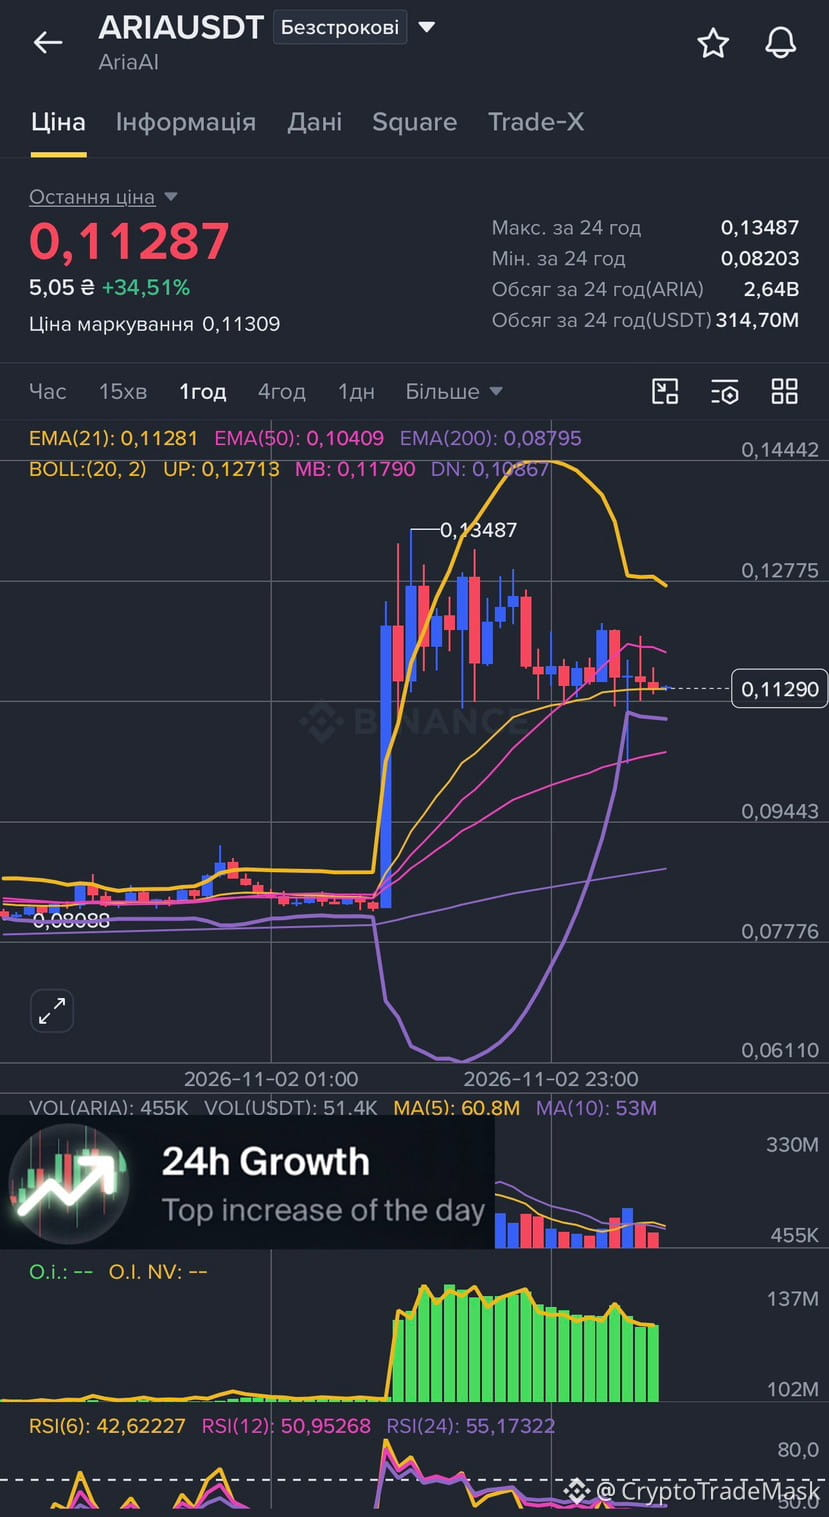
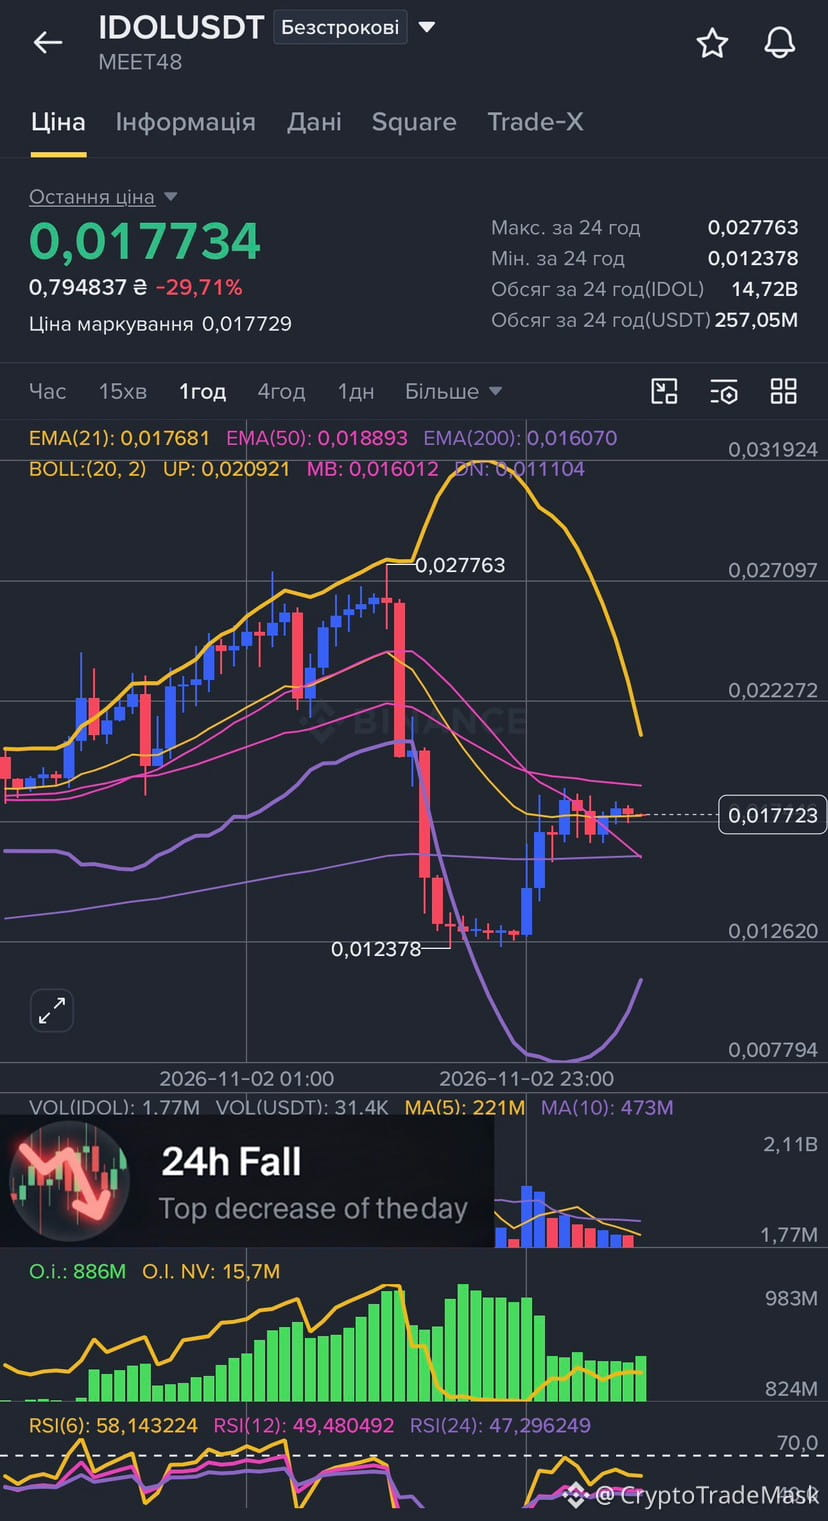
📈⏱️ Growth/Fall 24h 📉
📊 Futures Market Update 📊
$ARIA $IDOL
🚀 Over the past 24 hours, the market has shown strong fluctuations.
🔻 Some coins fell, others gave rapid growth - volatility at its maximum.
⚠️ Reminder:
• High volatility = high risk = potentially large profits.
• Always set a stop-loss.
• Risk management is the key to stable trading.
💹 Keep your finger on the pulse of the market! DYOR
{future}(IDOLUSDT)
{future}(ARIAUSDT)
#GrowthFall
📈⏱️ Growth/Fall 24h 📉
📊 Futures Market Update 📊
$ARIA $IDOL
🚀 Over the past 24 hours, the market has shown strong fluctuations.
🔻 Some coins fell, others gave rapid growth - volatility at its maximum.
⚠️ Reminder:
• High volatility = high risk = potentially large profits.
• Always set a stop-loss.
• Risk management is the key to stable trading.
💹 Keep your finger on the pulse of the market! DYOR
📈⏱️ Growth/Fall 24h 📉
📊 Futures Market Update 📊
$ARIA $IDOL
🚀 Over the past 24 hours, the market has shown strong fluctuations.
🔻 Some coins fell, others gave rapid growth - volatility at its maximum.
⚠️ Reminder:
• High volatility = high risk = potentially large profits.
• Always set a stop-loss.
• Risk management is the key to stable trading.
💹 Keep your finger on the pulse of the market! DYOR
111
Maqola
Tarjimani ko‘rish
Чому падає крипта, якщо Binance все повернула?Останні події навколо Binance стали одним із найсерйозніших стрес-тестів для всієї криптоіндустрії за останні роки. Злам гарячих гаманців, паніка, тимчасове зависання транзакцій і тривожні заголовки про мільярдні втрати сколихнули навіть бувалих трейдерів.
Проте найголовніше питання, яке зараз задають собі учасники ринку: «Якщо біржа все відновила, покрила збитки з резервів і відкрила виводи, чому ринок продовжує сипатися?»
Розберемо детально глибинні механізми, які пояснюють це явище.
1. Парадокс відновлення: порятунок платформи дорівнює відтоку капіталу
Коли топова біржа стикається з масштабною кризою, рішення закрити «дірки» за рахунок внутрішніх фондів (таких як SAFU) та резервів — це єдиний спосіб уникнути масштабного банкрутства платформи. Проте сам факт відкриття виведення активів після інциденту запускає колосальний масовий рух капіталу.
➡️ Релокація активів: Щойно шлюзи для виведення коштів відкрилися, мільярди доларів почали масово залишати біржові гаманці. Користувачі масово переказують активи на холодні гаманці (Ledger, Trezor) або диверсифікують ризики, переливаючи кошти на інші платформи.
➡️ Тиск на стакани: Частина цього виведення супроводжується миттєвими («панічними») продажами. Інвестори вважають за краще зафіксувати хоч якийсь прибуток або вийти в стейблкоїни напряму на спотовому ринку, що створює колосальну пропозицію, яку покупці не встигають викуповувати.
2. Психологічний фактор: крах довіри швидший за технічний ремонт
Криптовалютний ринок на 80% складається з психології, очікувань та емоцій. У цій індустрії репутація будується роками, а руйнується за хвилину.
➡️ Ефект «обпеченого молока»: Навіть попри те, що керівництво Binance офіційно підтвердило повне покриття збитків і відсутність загрози для користувачів, інвестори налаштовані скептично. У пам'яті ринку ще свіжі спогади про інші гучні банкрутства минулих років, де заспокійливі заяви керівництва звучали до останнього.
➡️ Зміна ринкового настрою (Sentiment): Індекс страху та жадібності неминуче падає в зону глибокого страху. У такому стані учасники ринку стають ультраконсервативними: вони краще пропустять потенційне зростання, ніж ризикуватимуть капіталом під час турбулентності.
3. Масовий каскад ліквідацій на ринку деривативів
Ф'ючерсний ринок з плечами — це головний каталізатор різких цінових рухів. Будь-який «чорний лебідь» на кшталт масштабного хакерського нападу запускає ланцюгову реакцію.
➡️ Знесення лонгів: Коли новина про злам обвалила ринок на перших свічках, ціна пробила ключові технічні рівні підтримки. Це спричинило примусове закриття (ліквідацію) тисяч позицій трейдерів із плечем.
➡️ Ефект доміно: Біржові алгоритми автоматично викидають на ринок ринкові ордери на продаж для покриття позицій ліквідованих трейдерів. Цей процес працює як снігова лавина, штовхаючи ціну значно нижче від реальної вартості активів і не залишаючи часу на роздуми.
4. Співпадіння з макроекономічними циклами та технічним перегрівом
Дуже часто подібні «чорні лебеді» не з'являються в абсолютному вакуумі — вони накладаються на вже існуючі ринкові процеси.
➡️ Виснаження бичачого імпульсу: Якщо перед цим ринок тривалий час робив імпульсні рухи вгору і знаходився у стані локального перегріву, новина про злам стає ідеальним тригером (спусковим гачком) для великих гравців (китів) почати фіксування масштабних прибутків.
➡️ Зовнішні ризики: Додайте сюди макроекономічний контекст (засідання регуляторів, зміну ставок, ліквідність у глобальній фінансовій системі) — і ви отримаєте середовище, де ринок просто шукав приводу для глибокої та здорової корекції.
Що далі і як діяти інвестору?
Повернення коштів біржею — це чудовий сигнал, який вказує на фінансову стійкість платформи та запобігає системній кризі всього ринку. Проте ціна активів реагує не на квитанції про компенсацію, а на баланс попиту і пропозиції.
Ринку потрібен час (зазвичай від кількох днів до тижнів), щоб:
1. Заспокоїти емоційний фон і дати «слабким рукам» вийти з ринку.
2. Сформувати нові консолідаційні зони (флет), де великий капітал знову почтить нагромаджувати позиції.
3. Очистити ринок деривативів від зайвого спекулятивного «жиру».
⚠️ Порада: У такі періоди найкраща стратегія — уникати торгівлі з високими плечами, дотримуватися суворого ризик-менеджменту та пам'ятати, що після кожного шторму ринок неминуче знаходить новий баланс.
Чому падає крипта, якщо Binance все повернула?
Останні події навколо Binance стали одним із найсерйозніших стрес-тестів для всієї криптоіндустрії за останні роки. Злам гарячих гаманців, паніка, тимчасове зависання транзакцій і тривожні заголовки про мільярдні втрати сколихнули навіть бувалих трейдерів.
Проте найголовніше питання, яке зараз задають собі учасники ринку: «Якщо біржа все відновила, покрила збитки з резервів і відкрила виводи, чому ринок продовжує сипатися?»
Розберемо детально глибинні механізми, які пояснюють це явище.
1. Парадокс відновлення: порятунок платформи дорівнює відтоку капіталу
Коли топова біржа стикається з масштабною кризою, рішення закрити «дірки» за рахунок внутрішніх фондів (таких як SAFU) та резервів — це єдиний спосіб уникнути масштабного банкрутства платформи. Проте сам факт відкриття виведення активів після інциденту запускає колосальний масовий рух капіталу.
➡️ Релокація активів: Щойно шлюзи для виведення коштів відкрилися, мільярди доларів почали масово залишати біржові гаманці. Користувачі масово переказують активи на холодні гаманці (Ledger, Trezor) або диверсифікують ризики, переливаючи кошти на інші платформи.
➡️ Тиск на стакани: Частина цього виведення супроводжується миттєвими («панічними») продажами. Інвестори вважають за краще зафіксувати хоч якийсь прибуток або вийти в стейблкоїни напряму на спотовому ринку, що створює колосальну пропозицію, яку покупці не встигають викуповувати.
2. Психологічний фактор: крах довіри швидший за технічний ремонт
Криптовалютний ринок на 80% складається з психології, очікувань та емоцій. У цій індустрії репутація будується роками, а руйнується за хвилину.
➡️ Ефект «обпеченого молока»: Навіть попри те, що керівництво Binance офіційно підтвердило повне покриття збитків і відсутність загрози для користувачів, інвестори налаштовані скептично. У пам'яті ринку ще свіжі спогади про інші гучні банкрутства минулих років, де заспокійливі заяви керівництва звучали до останнього.
➡️ Зміна ринкового настрою (Sentiment): Індекс страху та жадібності неминуче падає в зону глибокого страху. У такому стані учасники ринку стають ультраконсервативними: вони краще пропустять потенційне зростання, ніж ризикуватимуть капіталом під час турбулентності.
3. Масовий каскад ліквідацій на ринку деривативів
Ф'ючерсний ринок з плечами — це головний каталізатор різких цінових рухів. Будь-який «чорний лебідь» на кшталт масштабного хакерського нападу запускає ланцюгову реакцію.
➡️ Знесення лонгів: Коли новина про злам обвалила ринок на перших свічках, ціна пробила ключові технічні рівні підтримки. Це спричинило примусове закриття (ліквідацію) тисяч позицій трейдерів із плечем.
➡️ Ефект доміно: Біржові алгоритми автоматично викидають на ринок ринкові ордери на продаж для покриття позицій ліквідованих трейдерів. Цей процес працює як снігова лавина, штовхаючи ціну значно нижче від реальної вартості активів і не залишаючи часу на роздуми.
4. Співпадіння з макроекономічними циклами та технічним перегрівом
Дуже часто подібні «чорні лебеді» не з'являються в абсолютному вакуумі — вони накладаються на вже існуючі ринкові процеси.
➡️ Виснаження бичачого імпульсу: Якщо перед цим ринок тривалий час робив імпульсні рухи вгору і знаходився у стані локального перегріву, новина про злам стає ідеальним тригером (спусковим гачком) для великих гравців (китів) почати фіксування масштабних прибутків.
➡️ Зовнішні ризики: Додайте сюди макроекономічний контекст (засідання регуляторів, зміну ставок, ліквідність у глобальній фінансовій системі) — і ви отримаєте середовище, де ринок просто шукав приводу для глибокої та здорової корекції.
Що далі і як діяти інвестору?
Повернення коштів біржею — це чудовий сигнал, який вказує на фінансову стійкість платформи та запобігає системній кризі всього ринку. Проте ціна активів реагує не на квитанції про компенсацію, а на баланс попиту і пропозиції.
Ринку потрібен час (зазвичай від кількох днів до тижнів), щоб:
1. Заспокоїти емоційний фон і дати «слабким рукам» вийти з ринку.
2. Сформувати нові консолідаційні зони (флет), де великий капітал знову почтить нагромаджувати позиції.
3. Очистити ринок деривативів від зайвого спекулятивного «жиру».
⚠️ Порада: У такі періоди найкраща стратегія — уникати торгівлі з високими плечами, дотримуватися суворого ризик-менеджменту та пам'ятати, що після кожного шторму ринок неминуче знаходить новий баланс.
Проте найголовніше питання, яке зараз задають собі учасники ринку: «Якщо біржа все відновила, покрила збитки з резервів і відкрила виводи, чому ринок продовжує сипатися?»
Розберемо детально глибинні механізми, які пояснюють це явище.
1. Парадокс відновлення: порятунок платформи дорівнює відтоку капіталу
Коли топова біржа стикається з масштабною кризою, рішення закрити «дірки» за рахунок внутрішніх фондів (таких як SAFU) та резервів — це єдиний спосіб уникнути масштабного банкрутства платформи. Проте сам факт відкриття виведення активів після інциденту запускає колосальний масовий рух капіталу.
➡️ Релокація активів: Щойно шлюзи для виведення коштів відкрилися, мільярди доларів почали масово залишати біржові гаманці. Користувачі масово переказують активи на холодні гаманці (Ledger, Trezor) або диверсифікують ризики, переливаючи кошти на інші платформи.
➡️ Тиск на стакани: Частина цього виведення супроводжується миттєвими («панічними») продажами. Інвестори вважають за краще зафіксувати хоч якийсь прибуток або вийти в стейблкоїни напряму на спотовому ринку, що створює колосальну пропозицію, яку покупці не встигають викуповувати.
2. Психологічний фактор: крах довіри швидший за технічний ремонт
Криптовалютний ринок на 80% складається з психології, очікувань та емоцій. У цій індустрії репутація будується роками, а руйнується за хвилину.
➡️ Ефект «обпеченого молока»: Навіть попри те, що керівництво Binance офіційно підтвердило повне покриття збитків і відсутність загрози для користувачів, інвестори налаштовані скептично. У пам'яті ринку ще свіжі спогади про інші гучні банкрутства минулих років, де заспокійливі заяви керівництва звучали до останнього.
➡️ Зміна ринкового настрою (Sentiment): Індекс страху та жадібності неминуче падає в зону глибокого страху. У такому стані учасники ринку стають ультраконсервативними: вони краще пропустять потенційне зростання, ніж ризикуватимуть капіталом під час турбулентності.
3. Масовий каскад ліквідацій на ринку деривативів
Ф'ючерсний ринок з плечами — це головний каталізатор різких цінових рухів. Будь-який «чорний лебідь» на кшталт масштабного хакерського нападу запускає ланцюгову реакцію.
➡️ Знесення лонгів: Коли новина про злам обвалила ринок на перших свічках, ціна пробила ключові технічні рівні підтримки. Це спричинило примусове закриття (ліквідацію) тисяч позицій трейдерів із плечем.
➡️ Ефект доміно: Біржові алгоритми автоматично викидають на ринок ринкові ордери на продаж для покриття позицій ліквідованих трейдерів. Цей процес працює як снігова лавина, штовхаючи ціну значно нижче від реальної вартості активів і не залишаючи часу на роздуми.
4. Співпадіння з макроекономічними циклами та технічним перегрівом
Дуже часто подібні «чорні лебеді» не з'являються в абсолютному вакуумі — вони накладаються на вже існуючі ринкові процеси.
➡️ Виснаження бичачого імпульсу: Якщо перед цим ринок тривалий час робив імпульсні рухи вгору і знаходився у стані локального перегріву, новина про злам стає ідеальним тригером (спусковим гачком) для великих гравців (китів) почати фіксування масштабних прибутків.
➡️ Зовнішні ризики: Додайте сюди макроекономічний контекст (засідання регуляторів, зміну ставок, ліквідність у глобальній фінансовій системі) — і ви отримаєте середовище, де ринок просто шукав приводу для глибокої та здорової корекції.
Що далі і як діяти інвестору?
Повернення коштів біржею — це чудовий сигнал, який вказує на фінансову стійкість платформи та запобігає системній кризі всього ринку. Проте ціна активів реагує не на квитанції про компенсацію, а на баланс попиту і пропозиції.
Ринку потрібен час (зазвичай від кількох днів до тижнів), щоб:
1. Заспокоїти емоційний фон і дати «слабким рукам» вийти з ринку.
2. Сформувати нові консолідаційні зони (флет), де великий капітал знову почтить нагромаджувати позиції.
3. Очистити ринок деривативів від зайвого спекулятивного «жиру».
⚠️ Порада: У такі періоди найкраща стратегія — уникати торгівлі з високими плечами, дотримуватися суворого ризик-менеджменту та пам'ятати, що після кожного шторму ринок неминуче знаходить новий баланс.
1
1
57
Tarjimani ko‘rish
#MicroStrategy
Strategy invests three times more in $STRC buybacks than in Bitcoin: key takeaways from a new SEC filing
Michael Saylor’s Strategy has shifted its capital focus: last week, the company spent more than three times as much on repurchasing its own preferred shares ($STRC ) as it did on adding to its Bitcoin reserves.
📊 Key figures and facts:
➡️ STRC Buybacks: The company allocated $208.2 million toward the repurchase of STRC preferred shares.
➡️ Bitcoin Purchases: 811 BTC were acquired for approximately $65.5 million (at an average price of $80,846 per Bitcoin).
➡️ MSTR Sales: Strategy sold approximately 1.18 million MSTR shares, generating net proceeds of $164 million. A portion of these funds was used for BTC purchases, while $98.5 million was added to the company’s USD cash position.
➡️ Current Reserves: As of Sunday, the company held $132.7 million in USD cash, along with $4.79 billion in a separate dollar reserve.
➡️ Monthly Activity: Between October 1 and October 25, STRC buybacks totaled approximately $664 million, compared to $72 million spent on Bitcoin.
📉 Market context and issuance details:
➡️ Threshold for new shares: Pre-market quotes for the preferred shares rose by 0.1% to $99.22 (approximately 0.8% below the $100 target price). Company policy prohibits the issuance of new STRC shares below $100, which limits this source of funding as long as the asset trades below that par value.
➡️ Market trend: Other players are also pursuing share buyback strategies. Notably, the Japanese Bitcoin treasury firm Metaplanet reported the repurchase of its own common shares for 25.27 billion yen ($160 million) between October 14 and Saturday (approximately 7.1% of the total shares outstanding).
{future}(STRCUSDT)
#MicroStrategy
Strategy invests three times more in $STRC buybacks than in Bitcoin: key takeaways from a new SEC filing
Michael Saylor’s Strategy has shifted its capital focus: last week, the company spent more than three times as much on repurchasing its own preferred shares ($STRC ) as it did on adding to its Bitcoin reserves.
📊 Key figures and facts:
➡️ STRC Buybacks: The company allocated $208.2 million toward the repurchase of STRC preferred shares.
➡️ Bitcoin Purchases: 811 BTC were acquired for approximately $65.5 million (at an average price of $80,846 per Bitcoin).
➡️ MSTR Sales: Strategy sold approximately 1.18 million MSTR shares, generating net proceeds of $164 million. A portion of these funds was used for BTC purchases, while $98.5 million was added to the company’s USD cash position.
➡️ Current Reserves: As of Sunday, the company held $132.7 million in USD cash, along with $4.79 billion in a separate dollar reserve.
➡️ Monthly Activity: Between October 1 and October 25, STRC buybacks totaled approximately $664 million, compared to $72 million spent on Bitcoin.
📉 Market context and issuance details:
➡️ Threshold for new shares: Pre-market quotes for the preferred shares rose by 0.1% to $99.22 (approximately 0.8% below the $100 target price). Company policy prohibits the issuance of new STRC shares below $100, which limits this source of funding as long as the asset trades below that par value.
➡️ Market trend: Other players are also pursuing share buyback strategies. Notably, the Japanese Bitcoin treasury firm Metaplanet reported the repurchase of its own common shares for 25.27 billion yen ($160 million) between October 14 and Saturday (approximately 7.1% of the total shares outstanding).
Strategy invests three times more in $STRC buybacks than in Bitcoin: key takeaways from a new SEC filing
Michael Saylor’s Strategy has shifted its capital focus: last week, the company spent more than three times as much on repurchasing its own preferred shares ($STRC ) as it did on adding to its Bitcoin reserves.
📊 Key figures and facts:
➡️ STRC Buybacks: The company allocated $208.2 million toward the repurchase of STRC preferred shares.
➡️ Bitcoin Purchases: 811 BTC were acquired for approximately $65.5 million (at an average price of $80,846 per Bitcoin).
➡️ MSTR Sales: Strategy sold approximately 1.18 million MSTR shares, generating net proceeds of $164 million. A portion of these funds was used for BTC purchases, while $98.5 million was added to the company’s USD cash position.
➡️ Current Reserves: As of Sunday, the company held $132.7 million in USD cash, along with $4.79 billion in a separate dollar reserve.
➡️ Monthly Activity: Between October 1 and October 25, STRC buybacks totaled approximately $664 million, compared to $72 million spent on Bitcoin.
📉 Market context and issuance details:
➡️ Threshold for new shares: Pre-market quotes for the preferred shares rose by 0.1% to $99.22 (approximately 0.8% below the $100 target price). Company policy prohibits the issuance of new STRC shares below $100, which limits this source of funding as long as the asset trades below that par value.
➡️ Market trend: Other players are also pursuing share buyback strategies. Notably, the Japanese Bitcoin treasury firm Metaplanet reported the repurchase of its own common shares for 25.27 billion yen ($160 million) between October 14 and Saturday (approximately 7.1% of the total shares outstanding).
26
Tarjimani ko‘rish
#altcoins
📊 Market Update: Post-Binance Buy Signals & Altcoin Targets
Following the recent market shock from the Binance incident, crypto analyst Ali Martinez points to fresh TD Sequential buy signals across several key altcoins, signaling potential recovery zones as the market stabilizes.
Here are the primary assets and targets highlighted:
➡️ Cardano ($ADA ): After dropping ~36% to around $0.18, a daily buy signal has flashed. Key levels to watch: clearing $0.20 opens a path toward $0.23 (over 20% upside).
➡️ Algorand ($ALGO ): Dipped below $0.09 before triggering a daily buy signal. A decisive break above $0.10 could clear the way toward $0.113.
➡️ Aave ($AAVE ): Rebounded 16% from monthly lows under $120. Continued buying pressure could push the rally toward the $155 resistance trendline.
➡️ Raydium (#Ray ): Another bullish cue on the setup points to a potential move toward $1.90 (~19% upside from current levels).
📈 Long-Term Bull Run Accumulation Picks
Rather than panic selling, Martinez draws parallels to historical major market bottoms and is using the pullback to build a diversified portfolio. Other notable altcoins on his radar include:
➡️ Injective (#INJ ): Targeting a move toward $18 if support at the $6 level holds.
➡️ Sui (#SUİ ): Backed by recent integrations (Samsung Wallet, Alibaba Cloud), eyeing a potential move toward $1.30 and eventually $2.
➡️ Midnight (#night ): Printing a golden cross on the 3-day chart with a target near $0.07.
➡️ PENGU & PROMT: Accumulation plays targeting channel breakouts and short-term surges (PROMT targeting up to $0.028).
{future}(AAVEUSDT)
{future}(ALGOUSDT)
{future}(ADAUSDT)
#altcoins
📊 Market Update: Post-Binance Buy Signals & Altcoin Targets
Following the recent market shock from the Binance incident, crypto analyst Ali Martinez points to fresh TD Sequential buy signals across several key altcoins, signaling potential recovery zones as the market stabilizes.
Here are the primary assets and targets highlighted:
➡️ Cardano ($ADA ): After dropping ~36% to around $0.18, a daily buy signal has flashed. Key levels to watch: clearing $0.20 opens a path toward $0.23 (over 20% upside).
➡️ Algorand ($ALGO ): Dipped below $0.09 before triggering a daily buy signal. A decisive break above $0.10 could clear the way toward $0.113.
➡️ Aave ($AAVE ): Rebounded 16% from monthly lows under $120. Continued buying pressure could push the rally toward the $155 resistance trendline.
➡️ Raydium (#Ray ): Another bullish cue on the setup points to a potential move toward $1.90 (~19% upside from current levels).
📈 Long-Term Bull Run Accumulation Picks
Rather than panic selling, Martinez draws parallels to historical major market bottoms and is using the pullback to build a diversified portfolio. Other notable altcoins on his radar include:
➡️ Injective (#INJ ): Targeting a move toward $18 if support at the $6 level holds.
➡️ Sui (#SUİ ): Backed by recent integrations (Samsung Wallet, Alibaba Cloud), eyeing a potential move toward $1.30 and eventually $2.
➡️ Midnight (#night ): Printing a golden cross on the 3-day chart with a target near $0.07.
➡️ PENGU & PROMT: Accumulation plays targeting channel breakouts and short-term surges (PROMT targeting up to $0.028).
📊 Market Update: Post-Binance Buy Signals & Altcoin Targets
Following the recent market shock from the Binance incident, crypto analyst Ali Martinez points to fresh TD Sequential buy signals across several key altcoins, signaling potential recovery zones as the market stabilizes.
Here are the primary assets and targets highlighted:
➡️ Cardano ($ADA ): After dropping ~36% to around $0.18, a daily buy signal has flashed. Key levels to watch: clearing $0.20 opens a path toward $0.23 (over 20% upside).
➡️ Algorand ($ALGO ): Dipped below $0.09 before triggering a daily buy signal. A decisive break above $0.10 could clear the way toward $0.113.
➡️ Aave ($AAVE ): Rebounded 16% from monthly lows under $120. Continued buying pressure could push the rally toward the $155 resistance trendline.
➡️ Raydium (#Ray ): Another bullish cue on the setup points to a potential move toward $1.90 (~19% upside from current levels).
📈 Long-Term Bull Run Accumulation Picks
Rather than panic selling, Martinez draws parallels to historical major market bottoms and is using the pullback to build a diversified portfolio. Other notable altcoins on his radar include:
➡️ Injective (#INJ ): Targeting a move toward $18 if support at the $6 level holds.
➡️ Sui (#SUİ ): Backed by recent integrations (Samsung Wallet, Alibaba Cloud), eyeing a potential move toward $1.30 and eventually $2.
➡️ Midnight (#night ): Printing a golden cross on the 3-day chart with a target near $0.07.
➡️ PENGU & PROMT: Accumulation plays targeting channel breakouts and short-term surges (PROMT targeting up to $0.028).
70
Tarjimani ko‘rish
🔥 $HOT /USDT: Is a Short Squeeze Coming?
The pair is trading at ~0.000381 USDT (+7.8% over the last 24 hours), presenting an interesting setup in the derivatives market:
Funding: Extremely negative (-0.97%) - short sellers are paying significant fees to long position holders.
Whale Positions: Most short positions are currently underwater due to the recent local price increase.
Potential: The accumulated imbalance creates ideal conditions for a sharp liquidation of sellers (a "short squeeze") above the 0.000400 USDT level.
🟢 Trading Idea (Long):
Entry: 0.000375 – 0.000380 USDT
Targets: 0.000392 / 0.000402 – 0.000412 USDT
Stop-Loss: 0.000368 USDT
⚠️ Be sure to manage your risks and use stop-loss orders - volatility is high!
{future}(HOTUSDT)
🔥 $HOT /USDT: Is a Short Squeeze Coming?
The pair is trading at ~0.000381 USDT (+7.8% over the last 24 hours), presenting an interesting setup in the derivatives market:
Funding: Extremely negative (-0.97%) - short sellers are paying significant fees to long position holders.
Whale Positions: Most short positions are currently underwater due to the recent local price increase.
Potential: The accumulated imbalance creates ideal conditions for a sharp liquidation of sellers (a "short squeeze") above the 0.000400 USDT level.
🟢 Trading Idea (Long):
Entry: 0.000375 – 0.000380 USDT
Targets: 0.000392 / 0.000402 – 0.000412 USDT
Stop-Loss: 0.000368 USDT
⚠️ Be sure to manage your risks and use stop-loss orders - volatility is high!
The pair is trading at ~0.000381 USDT (+7.8% over the last 24 hours), presenting an interesting setup in the derivatives market:
Funding: Extremely negative (-0.97%) - short sellers are paying significant fees to long position holders.
Whale Positions: Most short positions are currently underwater due to the recent local price increase.
Potential: The accumulated imbalance creates ideal conditions for a sharp liquidation of sellers (a "short squeeze") above the 0.000400 USDT level.
🟢 Trading Idea (Long):
Entry: 0.000375 – 0.000380 USDT
Targets: 0.000392 / 0.000402 – 0.000412 USDT
Stop-Loss: 0.000368 USDT
⚠️ Be sure to manage your risks and use stop-loss orders - volatility is high!
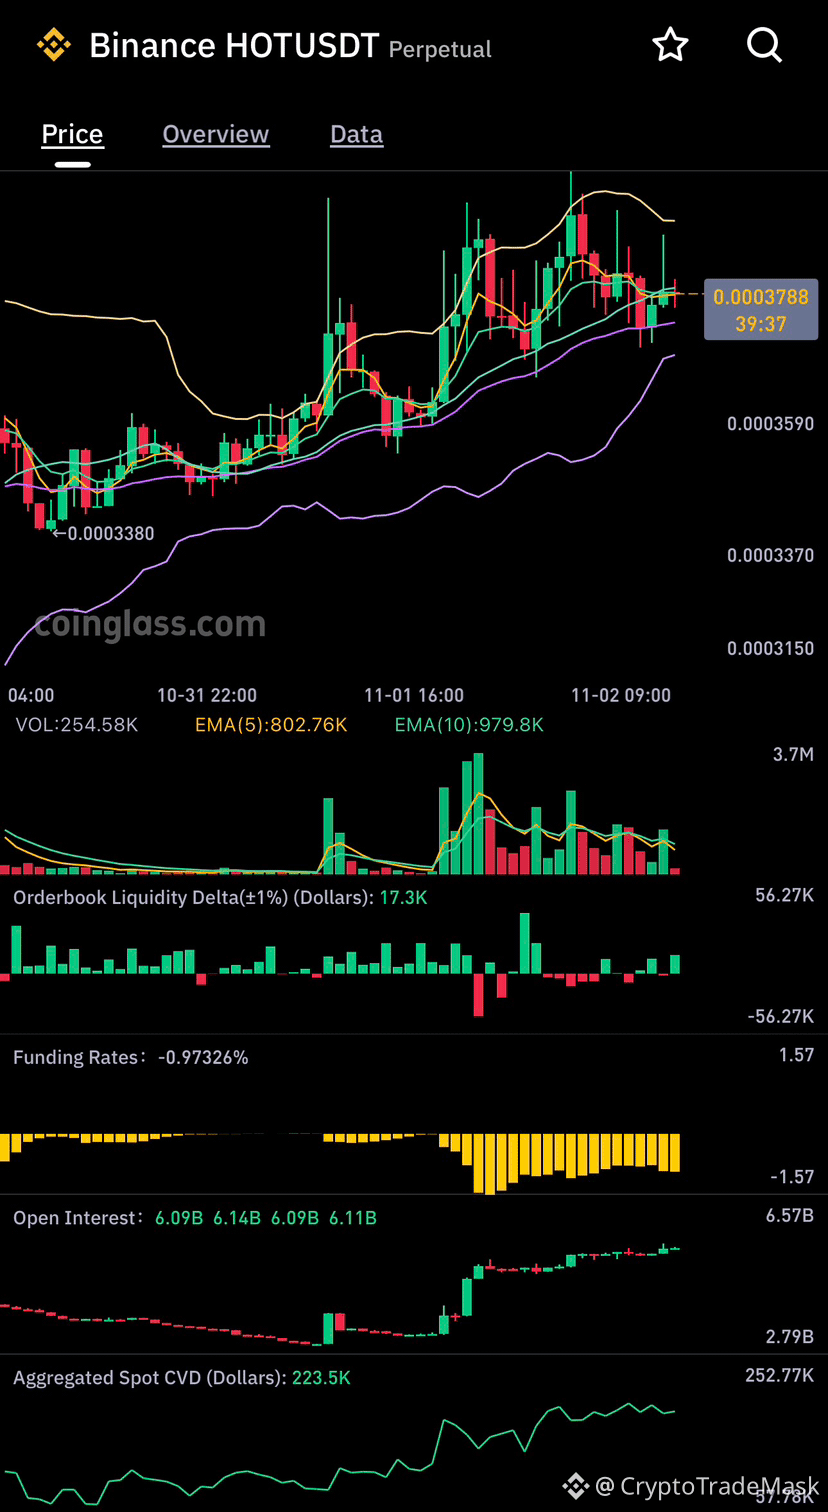
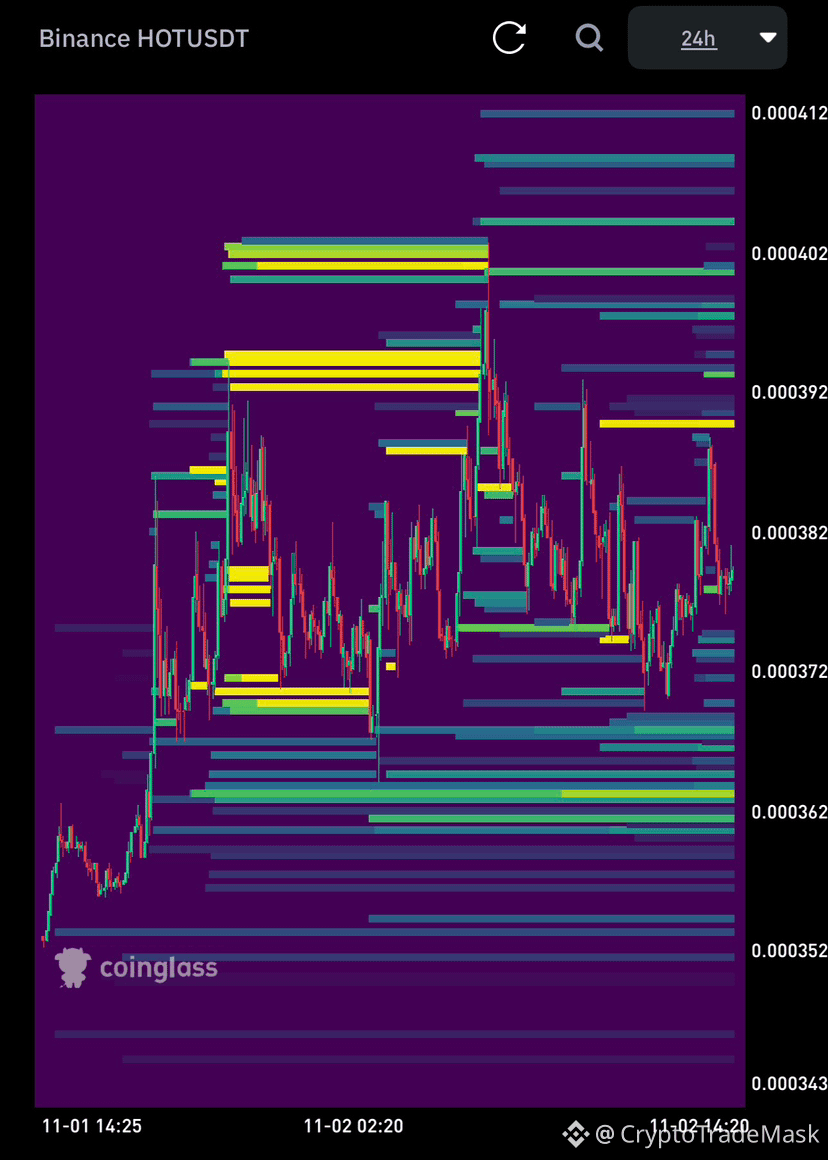
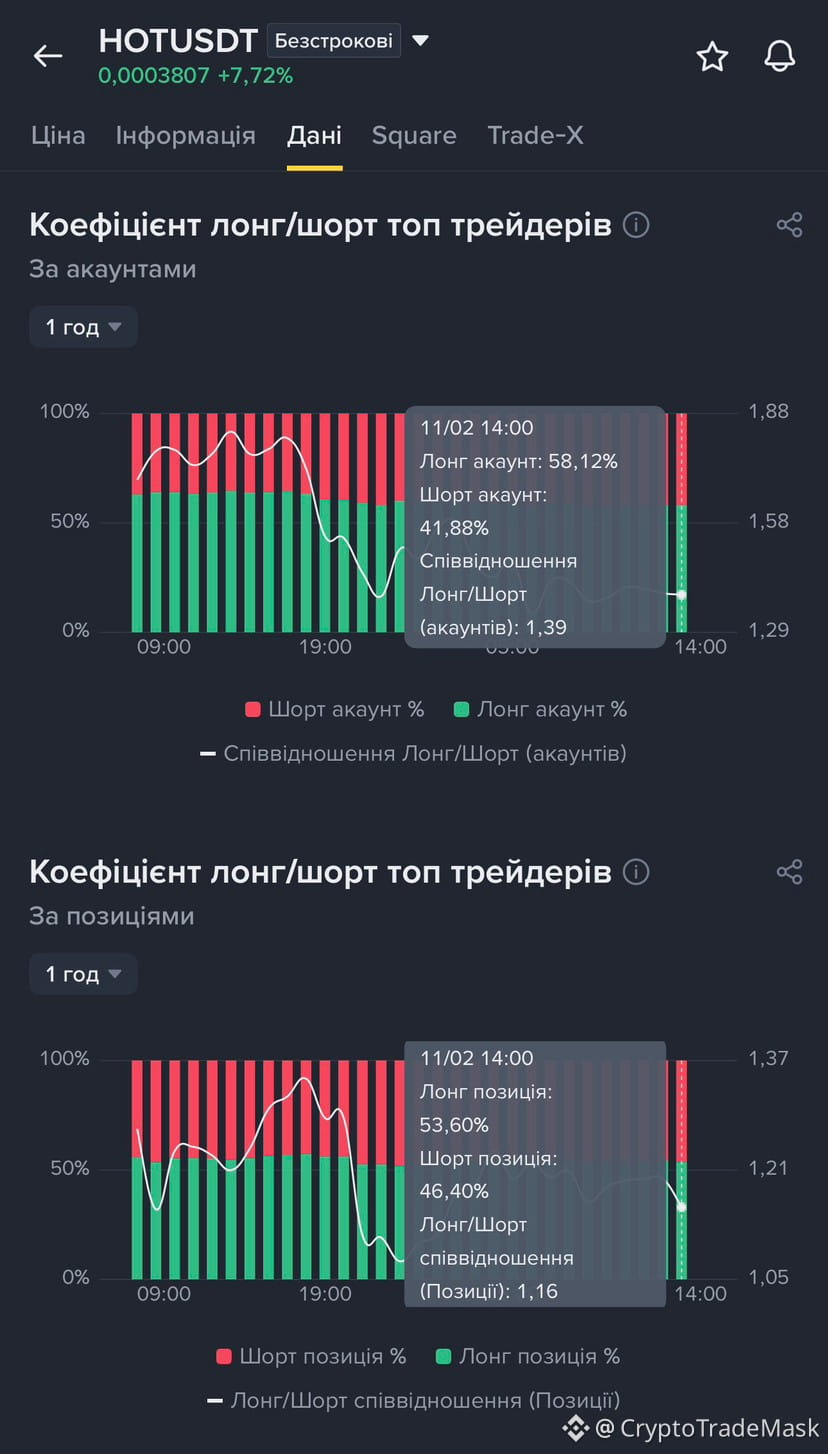
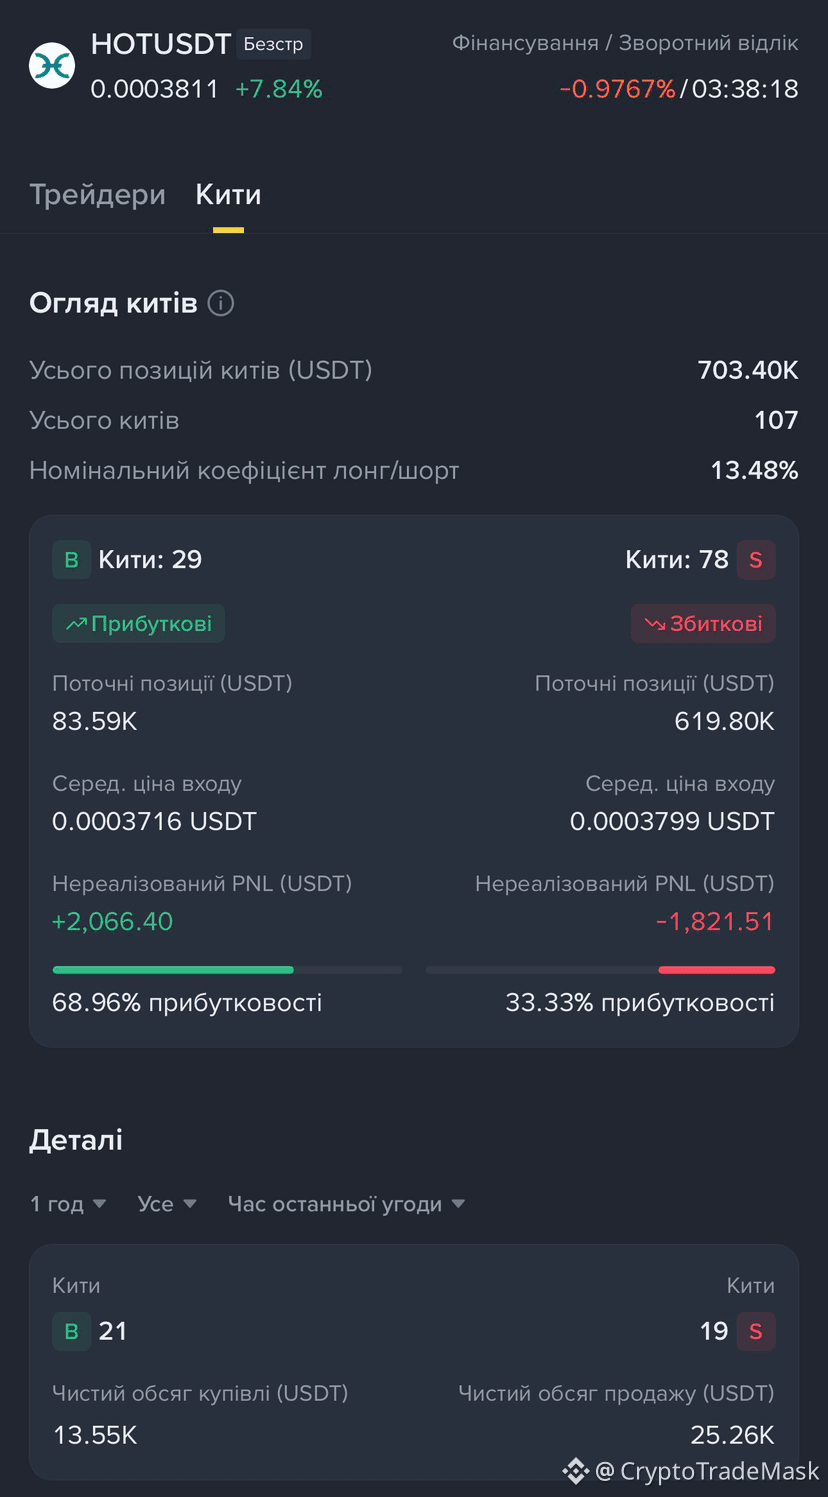
62
Ko‘proq kontentni ko‘rish uchun tizimga kiring
Binance Square'da global kriptovalyuta foydalanuvchilariga qo‘shiling
⚡️ Kriptovalyuta haqida eng so‘nggi va foydali ma’lumotlarni oling.
💬 Dunyoning eng yirik kriptovalyuta birjasi tomonidan ishonchli deb topilgan.
👍 Tasdiqlangan mualliflardan haqiqiy tahlillarni kashf eting.
Email / telefon raqami