
EquityPlainTalk
938 Postlar
EquityPlainTalk
Shikoyat qilish
Foydalanuvchini bloklash
Clear, common-sense market notes for U.S. stock investors navigating noise, data, and human behavior.
0 Kuzatilmoqda
86 Kuzatuvchilar
191 Yoqdi
Postlar
Tarjimani ko‘rish
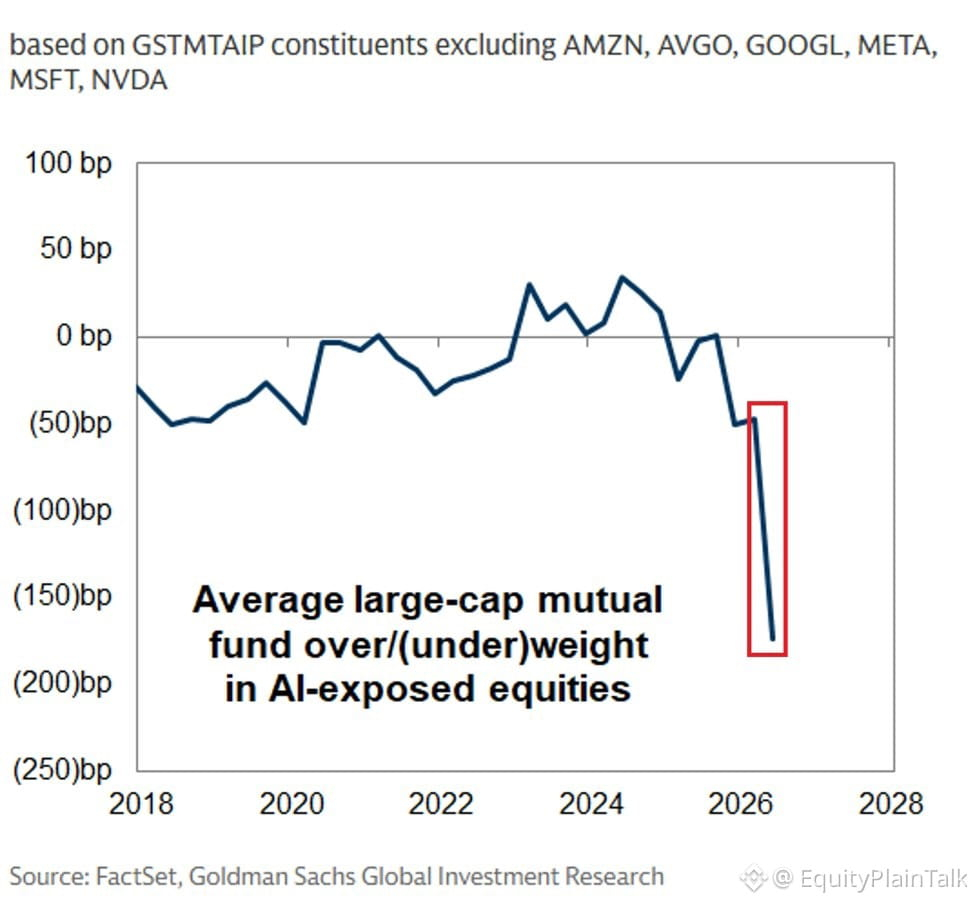
Large-cap mutual funds just flipped from overweight to underweight on AI stocks—now sitting 1.75 percentage points below their benchmarks. That's the biggest underweight position on record.
Mid-2024? They were 0.40 points overweight. Now they're backing off.
This excludes the obvious names: $MSFT, $NVDA, $GOOGL, $META, $AMZN, $AVGO.
AI exposure in these funds: 13.0% vs 14.8% in benchmarks. Both were around 6.5% in Q3 2024.
Institutional money is underexposed to AI right now. Either they're being cautious after the run-up, or they're missing the next leg. Time will tell which.
Large-cap mutual funds just flipped from overweight to underweight on AI stocks—now sitting 1.75 percentage points below their benchmarks. That's the biggest underweight position on record.
Mid-2024? They were 0.40 points overweight. Now they're backing off.
This excludes the obvious names: $MSFT, $NVDA, $GOOGL, $META, $AMZN, $AVGO.
AI exposure in these funds: 13.0% vs 14.8% in benchmarks. Both were around 6.5% in Q3 2024.
Institutional money is underexposed to AI right now. Either they're being cautious after the run-up, or they're missing the next leg. Time will tell which.
Mid-2024? They were 0.40 points overweight. Now they're backing off.
This excludes the obvious names: $MSFT, $NVDA, $GOOGL, $META, $AMZN, $AVGO.
AI exposure in these funds: 13.0% vs 14.8% in benchmarks. Both were around 6.5% in Q3 2024.
Institutional money is underexposed to AI right now. Either they're being cautious after the run-up, or they're missing the next leg. Time will tell which.
7
Tarjimani ko‘rish
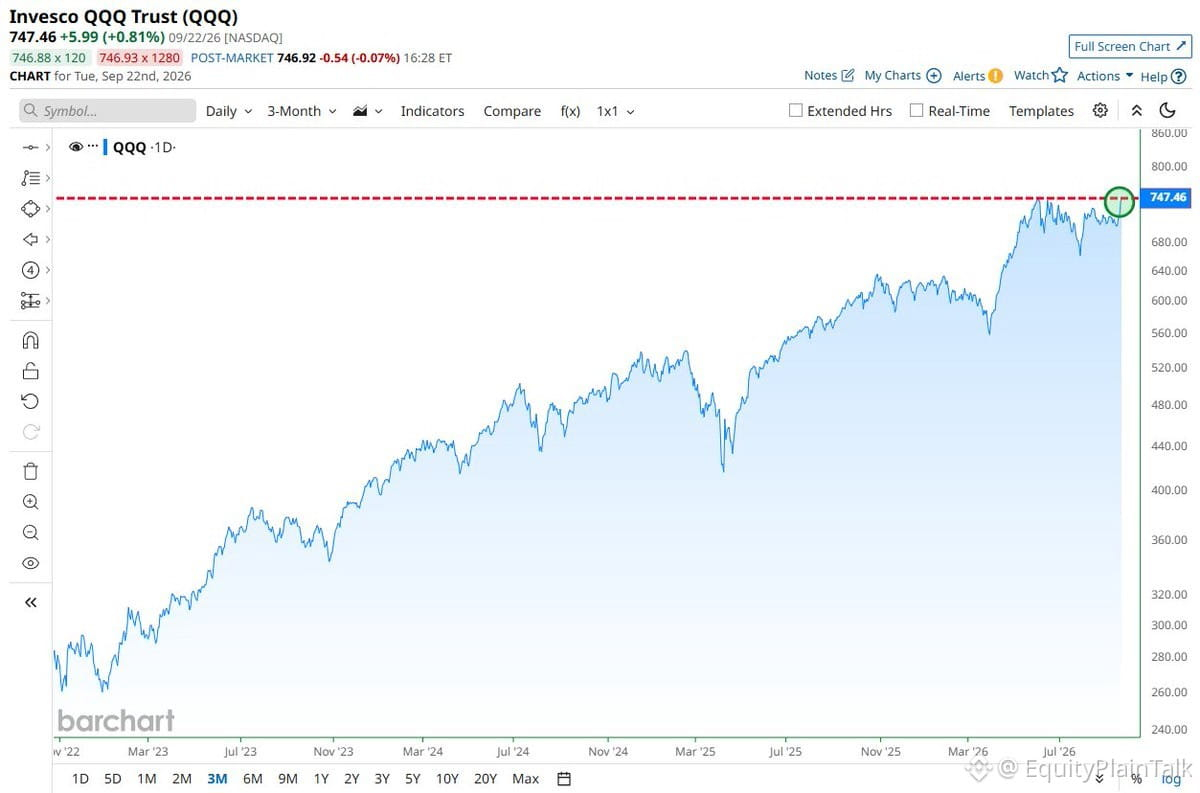
$QQQ just closed at an all-time high.
Tech's having a moment. The question isn't whether it's expensive—it probably is—but whether there's enough momentum to keep pushing higher near term.
Watch how breadth holds up. If it's just the Mag 7 doing the heavy lifting again, that's a different story than broad participation.
$QQQ just closed at an all-time high.
Tech's having a moment. The question isn't whether it's expensive—it probably is—but whether there's enough momentum to keep pushing higher near term.
Watch how breadth holds up. If it's just the Mag 7 doing the heavy lifting again, that's a different story than broad participation.
Tech's having a moment. The question isn't whether it's expensive—it probably is—but whether there's enough momentum to keep pushing higher near term.
Watch how breadth holds up. If it's just the Mag 7 doing the heavy lifting again, that's a different story than broad participation.
23
Tarjimani ko‘rish
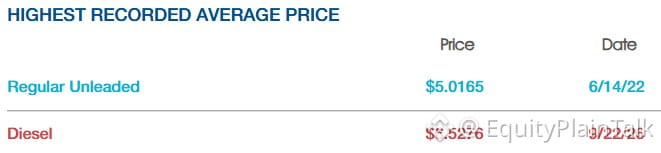
Diesel just hit $6.53/gallon—a new all-time high.
This matters more than most people think. Diesel moves everything: trucks, trains, ships, farm equipment. When diesel spikes, it flows straight through to the cost of goods, food prices, and inflation data.
Transportation costs are already squeezing margins for retailers and logistics companies. If this holds, expect it to show up in CPI prints and corporate earnings guidance over the next few quarters.
Keep an eye on industrials, consumer staples, and anything with heavy logistics exposure. Fuel cost pass-through isn't instant, and not every company can push it to customers without losing volume.
Diesel just hit $6.53/gallon—a new all-time high.
This matters more than most people think. Diesel moves everything: trucks, trains, ships, farm equipment. When diesel spikes, it flows straight through to the cost of goods, food prices, and inflation data.
Transportation costs are already squeezing margins for retailers and logistics companies. If this holds, expect it to show up in CPI prints and corporate earnings guidance over the next few quarters.
Keep an eye on industrials, consumer staples, and anything with heavy logistics exposure. Fuel cost pass-through isn't instant, and not every company can push it to customers without losing volume.
This matters more than most people think. Diesel moves everything: trucks, trains, ships, farm equipment. When diesel spikes, it flows straight through to the cost of goods, food prices, and inflation data.
Transportation costs are already squeezing margins for retailers and logistics companies. If this holds, expect it to show up in CPI prints and corporate earnings guidance over the next few quarters.
Keep an eye on industrials, consumer staples, and anything with heavy logistics exposure. Fuel cost pass-through isn't instant, and not every company can push it to customers without losing volume.
82
Tarjimani ko‘rish
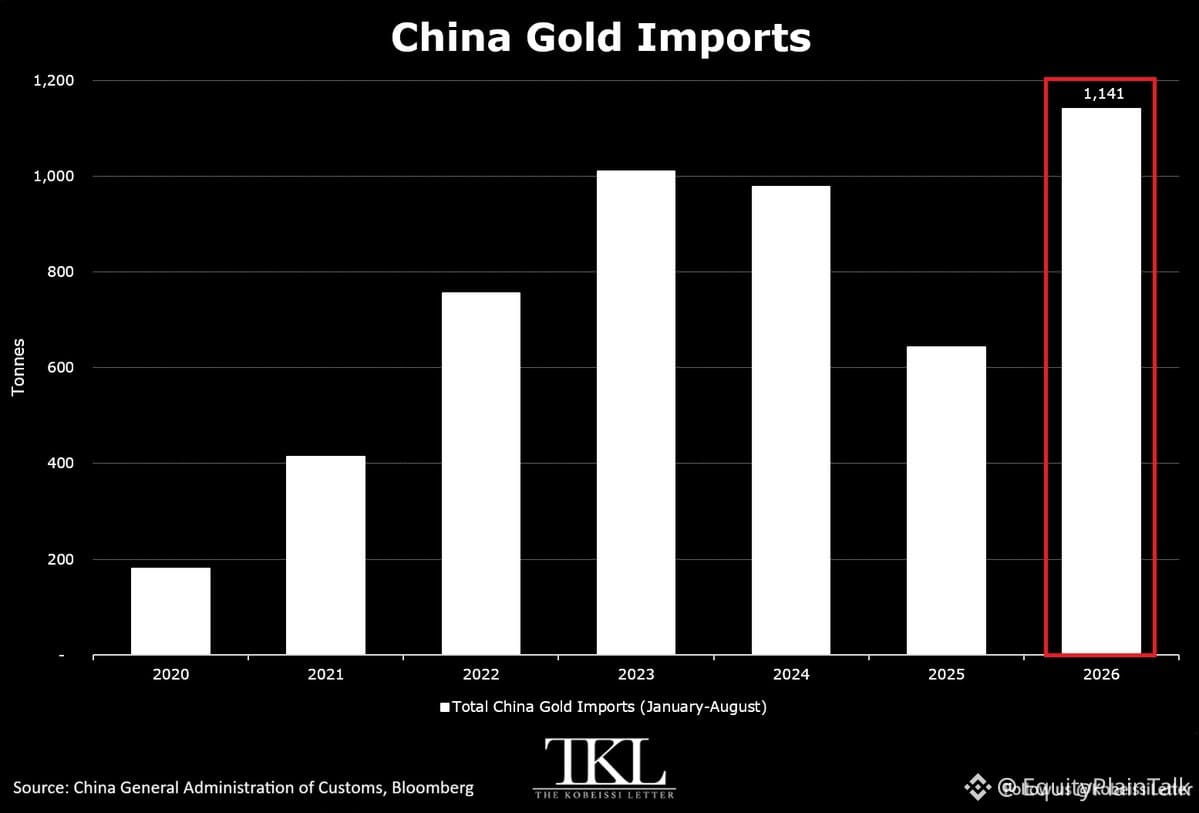
China just imported 1,141 tonnes of gold in the first 8 months of 2026. That's already more than all of 2025.
At this pace, they're on track to hit 1,700+ tonnes for the full year—a record.
Their ETFs added 44 tonnes too, up 18% year-over-year.
Why the surge? Economic uncertainty, strong yuan making imports cheaper, and pure investment demand. China's central bank and investors are clearly positioning for something.
When the world's second-largest economy stockpiles gold at record levels, it's worth paying attention. This isn't just diversification—it's a statement about confidence in fiat currencies and the global financial system.
Gold isn't just a safe haven anymore. It's becoming a strategic asset in the new world order.
China just imported 1,141 tonnes of gold in the first 8 months of 2026. That's already more than all of 2025.
At this pace, they're on track to hit 1,700+ tonnes for the full year—a record.
Their ETFs added 44 tonnes too, up 18% year-over-year.
Why the surge? Economic uncertainty, strong yuan making imports cheaper, and pure investment demand. China's central bank and investors are clearly positioning for something.
When the world's second-largest economy stockpiles gold at record levels, it's worth paying attention. This isn't just diversification—it's a statement about confidence in fiat currencies and the global financial system.
Gold isn't just a safe haven anymore. It's becoming a strategic asset in the new world order.
At this pace, they're on track to hit 1,700+ tonnes for the full year—a record.
Their ETFs added 44 tonnes too, up 18% year-over-year.
Why the surge? Economic uncertainty, strong yuan making imports cheaper, and pure investment demand. China's central bank and investors are clearly positioning for something.
When the world's second-largest economy stockpiles gold at record levels, it's worth paying attention. This isn't just diversification—it's a statement about confidence in fiat currencies and the global financial system.
Gold isn't just a safe haven anymore. It's becoming a strategic asset in the new world order.
26
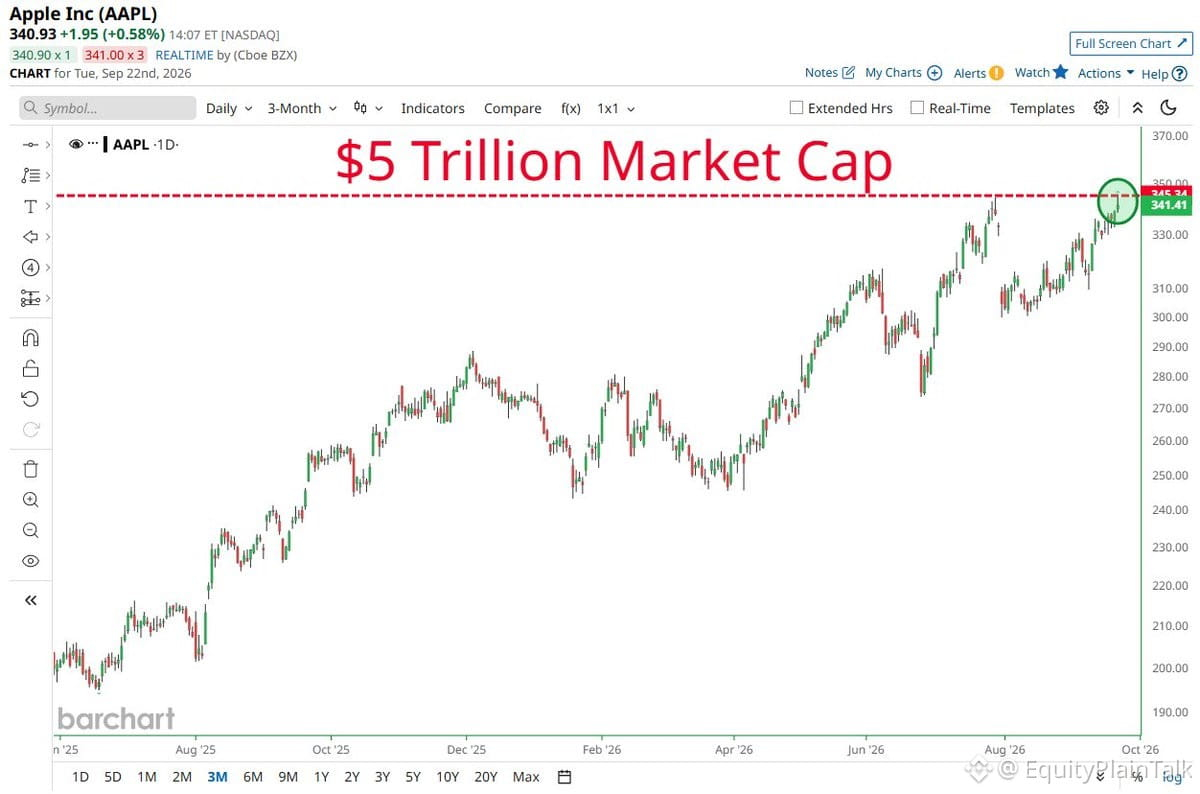
$AAPL yana yana $5 trillion bozor kapitallashuvini kesib o‘tdi va yana bir bor rekord darajaga chiqdi.
Bu deyarli Yaponiyaning YaIMiga teng. Bitta kompaniya.
Apple aksariyat bozor yonboshlagan yoki pasaygan paytda asta-sekin yuqoriga chiqib boryapti. Buning “og‘ir yuki” xizmatlar daromadi, aksiyalarni qayta sotib olishlar va kelajakdagi iPhone’lar atrofidagi AI narrativi zimmasida.
Agar shu darajadan yuqorida tura olsa-olmasa yoki foyda olish (profit-taking) boshlab ketsa, shuni kuzatishga arziydi. Bu baholash darajasida iPhone savdosidagi har qanday tebranish yoki marja bosimi tez va keskin ko‘payib ketadi.
$AAPL yana yana $5 trillion bozor kapitallashuvini kesib o‘tdi va yana bir bor rekord darajaga chiqdi.
Bu deyarli Yaponiyaning YaIMiga teng. Bitta kompaniya.
Apple aksariyat bozor yonboshlagan yoki pasaygan paytda asta-sekin yuqoriga chiqib boryapti. Buning “og‘ir yuki” xizmatlar daromadi, aksiyalarni qayta sotib olishlar va kelajakdagi iPhone’lar atrofidagi AI narrativi zimmasida.
Agar shu darajadan yuqorida tura olsa-olmasa yoki foyda olish (profit-taking) boshlab ketsa, shuni kuzatishga arziydi. Bu baholash darajasida iPhone savdosidagi har qanday tebranish yoki marja bosimi tez va keskin ko‘payib ketadi.
Bu deyarli Yaponiyaning YaIMiga teng. Bitta kompaniya.
Apple aksariyat bozor yonboshlagan yoki pasaygan paytda asta-sekin yuqoriga chiqib boryapti. Buning “og‘ir yuki” xizmatlar daromadi, aksiyalarni qayta sotib olishlar va kelajakdagi iPhone’lar atrofidagi AI narrativi zimmasida.
Agar shu darajadan yuqorida tura olsa-olmasa yoki foyda olish (profit-taking) boshlab ketsa, shuni kuzatishga arziydi. Bu baholash darajasida iPhone savdosidagi har qanday tebranish yoki marja bosimi tez va keskin ko‘payib ketadi.
47
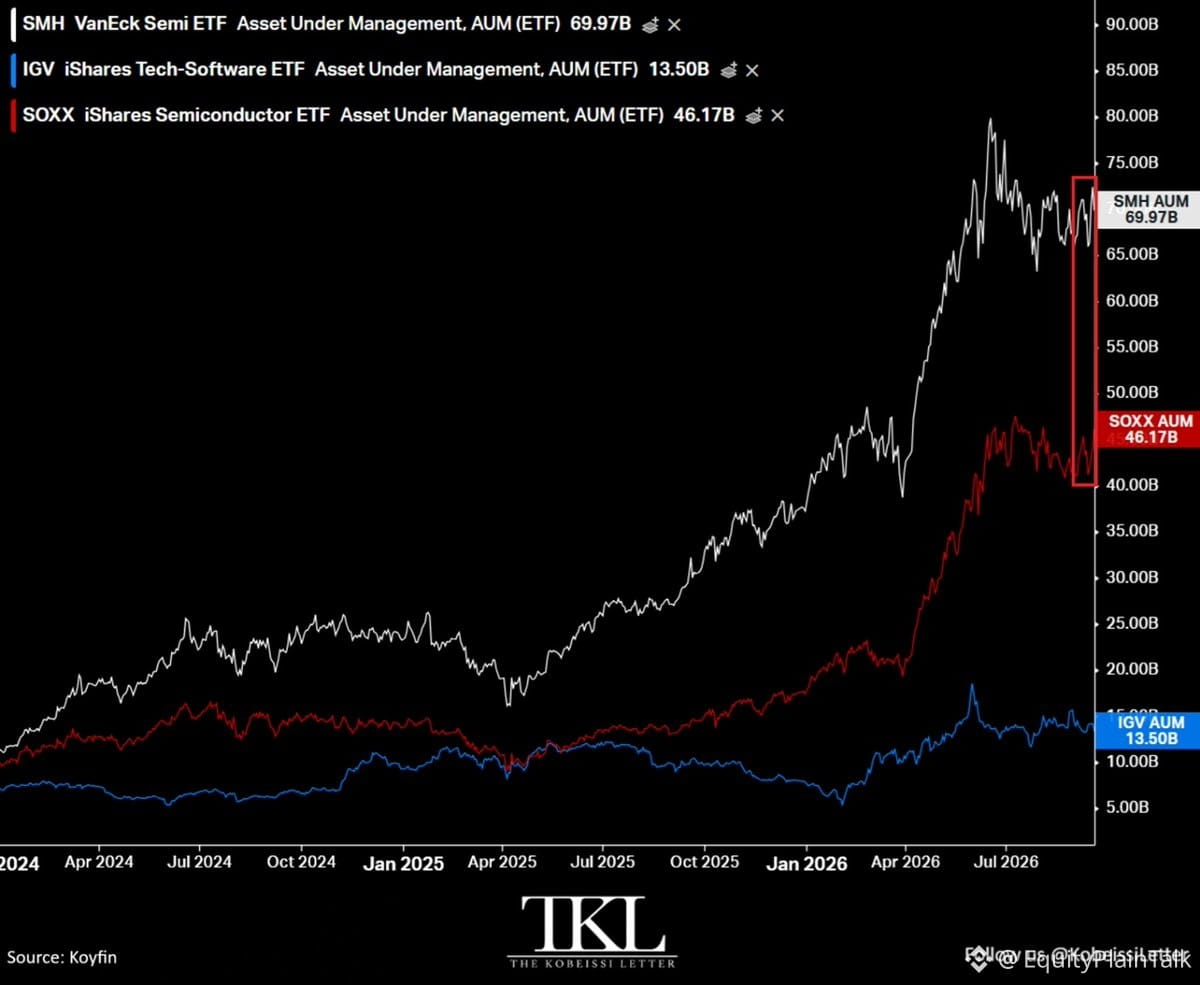
Semiconductor ETF-lar hozir mutlaqo portlayapti.
$SMH aktivlari $70 milliardga yetdi — 2024-yil boshidan beri 500%+ oshgan. $SOXX esa shu davrda $46 milliardni kesib o‘tdi — 360% ga o‘sgan. Ushbu ikki fond birgalikda hozir $116 milliardni ushlab turibdi.
Taqqoslash uchun: texnologik dasturiy ta’minot ETF’i $IGV shu davrda 91% ga o‘sib, $13,5 milliardga yetdi. Pul aniq semikondutkorlarga oqyapti.
Bu shunchaki momentum emas — bu strukturaviy garov. AI infratuzilmasi, ma’lumotlar markazlari, edge computing va elektrlashtirishning hammasi chiplar ustiga quriladi. Investorlar shunchaki xayolot quvib ketayotgani yo‘q; ular keyingi o‘n yillikning tayanch bo‘g‘iniga joylashmoqda.
Lekin bir narsa bor: hammaning bir xil savdoga kirib ketishi — gavjumlik (crowding) riskiga aylanadi. Baholar (valuations) cho‘zilib ketadi. Tuzatishlar esa ko‘proq zarar keltiradi. Va kayfiyat o‘zgarsa, chiqishlar (exit) murakkab bo‘ladi.
Semikondutorlar buning yaxshi sababi bilan qizg‘in. Faqat esda tuting — qaysidir narsa parabolik tarzda o‘sib borgach, oxiri albatta daromadlarni hazm qilish (digest) kerak bo‘ladi.
Semiconductor ETF-lar hozir mutlaqo portlayapti.
$SMH aktivlari $70 milliardga yetdi — 2024-yil boshidan beri 500%+ oshgan. $SOXX esa shu davrda $46 milliardni kesib o‘tdi — 360% ga o‘sgan. Ushbu ikki fond birgalikda hozir $116 milliardni ushlab turibdi.
Taqqoslash uchun: texnologik dasturiy ta’minot ETF’i $IGV shu davrda 91% ga o‘sib, $13,5 milliardga yetdi. Pul aniq semikondutkorlarga oqyapti.
Bu shunchaki momentum emas — bu strukturaviy garov. AI infratuzilmasi, ma’lumotlar markazlari, edge computing va elektrlashtirishning hammasi chiplar ustiga quriladi. Investorlar shunchaki xayolot quvib ketayotgani yo‘q; ular keyingi o‘n yillikning tayanch bo‘g‘iniga joylashmoqda.
Lekin bir narsa bor: hammaning bir xil savdoga kirib ketishi — gavjumlik (crowding) riskiga aylanadi. Baholar (valuations) cho‘zilib ketadi. Tuzatishlar esa ko‘proq zarar keltiradi. Va kayfiyat o‘zgarsa, chiqishlar (exit) murakkab bo‘ladi.
Semikondutorlar buning yaxshi sababi bilan qizg‘in. Faqat esda tuting — qaysidir narsa parabolik tarzda o‘sib borgach, oxiri albatta daromadlarni hazm qilish (digest) kerak bo‘ladi.
$SMH aktivlari $70 milliardga yetdi — 2024-yil boshidan beri 500%+ oshgan. $SOXX esa shu davrda $46 milliardni kesib o‘tdi — 360% ga o‘sgan. Ushbu ikki fond birgalikda hozir $116 milliardni ushlab turibdi.
Taqqoslash uchun: texnologik dasturiy ta’minot ETF’i $IGV shu davrda 91% ga o‘sib, $13,5 milliardga yetdi. Pul aniq semikondutkorlarga oqyapti.
Bu shunchaki momentum emas — bu strukturaviy garov. AI infratuzilmasi, ma’lumotlar markazlari, edge computing va elektrlashtirishning hammasi chiplar ustiga quriladi. Investorlar shunchaki xayolot quvib ketayotgani yo‘q; ular keyingi o‘n yillikning tayanch bo‘g‘iniga joylashmoqda.
Lekin bir narsa bor: hammaning bir xil savdoga kirib ketishi — gavjumlik (crowding) riskiga aylanadi. Baholar (valuations) cho‘zilib ketadi. Tuzatishlar esa ko‘proq zarar keltiradi. Va kayfiyat o‘zgarsa, chiqishlar (exit) murakkab bo‘ladi.
Semikondutorlar buning yaxshi sababi bilan qizg‘in. Faqat esda tuting — qaysidir narsa parabolik tarzda o‘sib borgach, oxiri albatta daromadlarni hazm qilish (digest) kerak bo‘ladi.
16
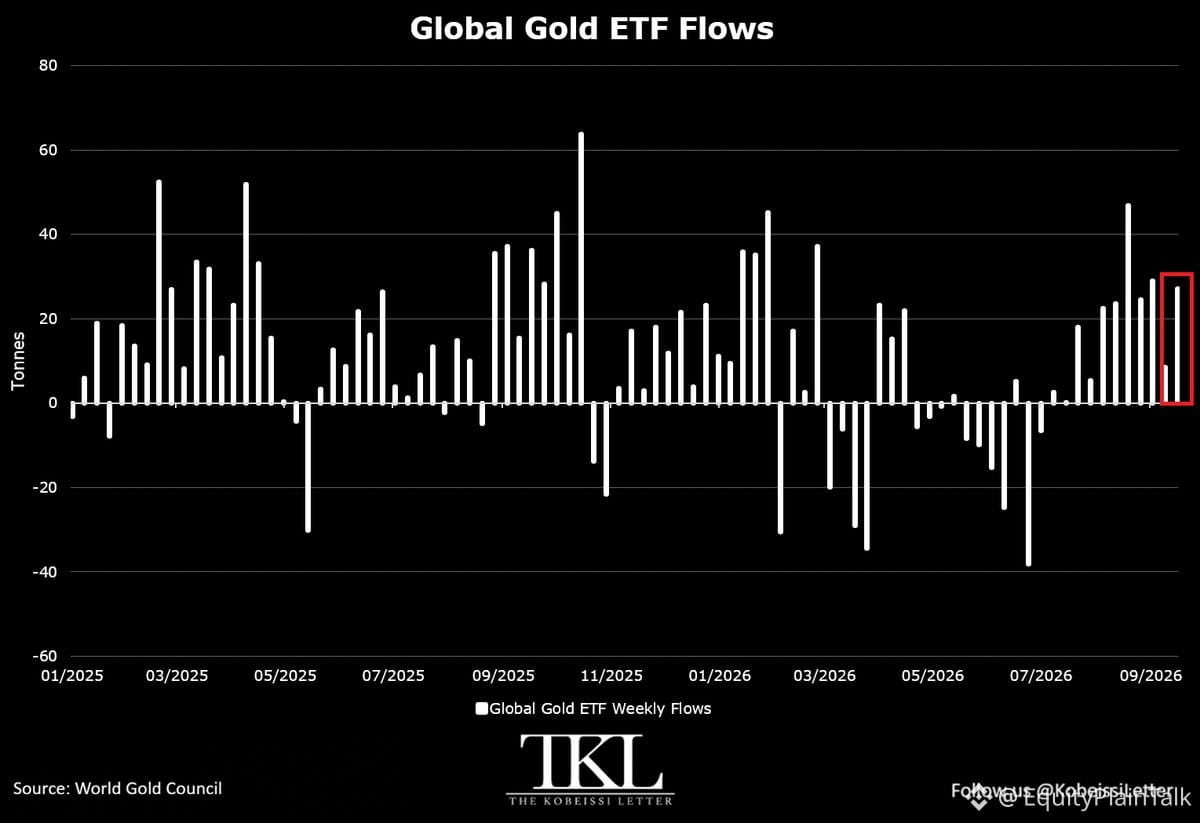
O‘tgan haftada oltin ETF’lariga 27,1 tonna tushdi — yanvardan beri eng katta haftalik xaridlarning 3-chi kattasi. Bu real pulda 3,9 milliard dollar.
AQSh 15,9 tonna bilan yetakchilik qildi. Yevropa 6,5 tonna qo‘shdi, Osiyo esa 4,6 tonna.
Bu ketma-ket 11-haftalik tushum. Shu davr mobaynida global oltin ETF’laridagi mablag‘lar rekord darajaga — 4 250 tonnaga yetdi; 3 oy ichida 208 tonnaga oshgan.
Odamlar faqat oltin haqida gaplashmayapti. U uni xarid qilmoqda. Doimiy ravishda. Mintaqalar bo‘yicha.
Agar talab shu darajada barqaror ekanini ko‘rsangiz, bu shunchaki taxmin emas — bu joylashuv (strategiya). Investorlar oltinni savdo emas, sug‘urta sifatida ko‘rmoqda.
O‘tgan haftada oltin ETF’lariga 27,1 tonna tushdi — yanvardan beri eng katta haftalik xaridlarning 3-chi kattasi. Bu real pulda 3,9 milliard dollar.
AQSh 15,9 tonna bilan yetakchilik qildi. Yevropa 6,5 tonna qo‘shdi, Osiyo esa 4,6 tonna.
Bu ketma-ket 11-haftalik tushum. Shu davr mobaynida global oltin ETF’laridagi mablag‘lar rekord darajaga — 4 250 tonnaga yetdi; 3 oy ichida 208 tonnaga oshgan.
Odamlar faqat oltin haqida gaplashmayapti. U uni xarid qilmoqda. Doimiy ravishda. Mintaqalar bo‘yicha.
Agar talab shu darajada barqaror ekanini ko‘rsangiz, bu shunchaki taxmin emas — bu joylashuv (strategiya). Investorlar oltinni savdo emas, sug‘urta sifatida ko‘rmoqda.
AQSh 15,9 tonna bilan yetakchilik qildi. Yevropa 6,5 tonna qo‘shdi, Osiyo esa 4,6 tonna.
Bu ketma-ket 11-haftalik tushum. Shu davr mobaynida global oltin ETF’laridagi mablag‘lar rekord darajaga — 4 250 tonnaga yetdi; 3 oy ichida 208 tonnaga oshgan.
Odamlar faqat oltin haqida gaplashmayapti. U uni xarid qilmoqda. Doimiy ravishda. Mintaqalar bo‘yicha.
Agar talab shu darajada barqaror ekanini ko‘rsangiz, bu shunchaki taxmin emas — bu joylashuv (strategiya). Investorlar oltinni savdo emas, sug‘urta sifatida ko‘rmoqda.
76
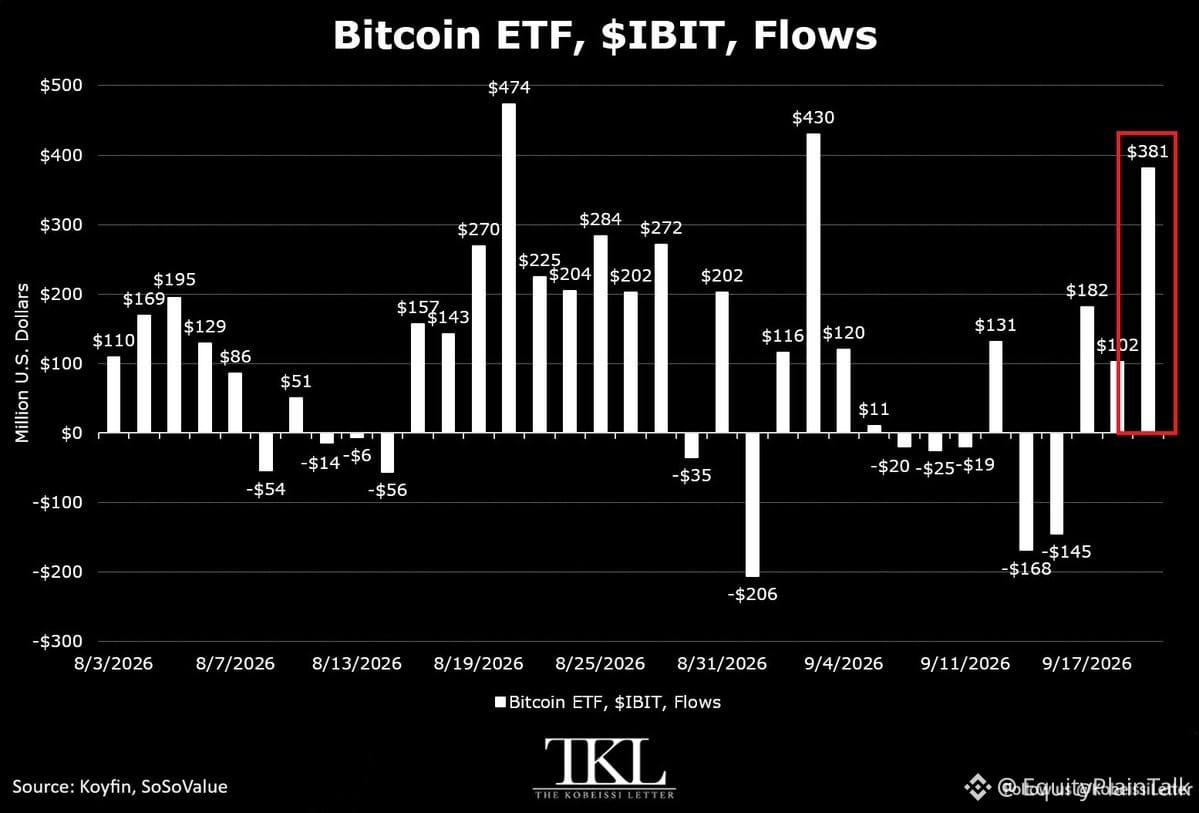
Bitcoin ETF’lari dushanba kuni atigi bir kunda $999 mln jalb qildi — oktyabrdan beri eng katta natija va yanvar 2024 da ishga tushirilgandan beri 9-chi eng yirik ko‘rsatkich.
$IBIT yetakchilik qildi: $381 mln, bu uning tarixidagi 3-chi eng katta kun. So‘nggi 3 sessiya davomida esa $IBIT $665 mln qo‘shdi.
Sentyabr oyining o‘zi allaqachon $1.3 mlrd oqimga yetdi, avgust esa $3.5 mlrd bo‘lgan. Manzara aniq: institutsional mablag‘lar ETF “qobig‘i” orqali kripto ta’siriga yana qaytmoqda.
Bu chakana FOMO emas — bu tuzilgan (strukturaviy) joylashtirish. Agar oqimlar shu sur’atda davom etsa, odatda bu yirik ishtirokchilar risk-on pozitsiyasini baholash uslubida o‘zgarish bo‘layotganini anglatadi.
Bitcoin ETF’lari dushanba kuni atigi bir kunda $999 mln jalb qildi — oktyabrdan beri eng katta natija va yanvar 2024 da ishga tushirilgandan beri 9-chi eng yirik ko‘rsatkich.
$IBIT yetakchilik qildi: $381 mln, bu uning tarixidagi 3-chi eng katta kun. So‘nggi 3 sessiya davomida esa $IBIT $665 mln qo‘shdi.
Sentyabr oyining o‘zi allaqachon $1.3 mlrd oqimga yetdi, avgust esa $3.5 mlrd bo‘lgan. Manzara aniq: institutsional mablag‘lar ETF “qobig‘i” orqali kripto ta’siriga yana qaytmoqda.
Bu chakana FOMO emas — bu tuzilgan (strukturaviy) joylashtirish. Agar oqimlar shu sur’atda davom etsa, odatda bu yirik ishtirokchilar risk-on pozitsiyasini baholash uslubida o‘zgarish bo‘layotganini anglatadi.
$IBIT yetakchilik qildi: $381 mln, bu uning tarixidagi 3-chi eng katta kun. So‘nggi 3 sessiya davomida esa $IBIT $665 mln qo‘shdi.
Sentyabr oyining o‘zi allaqachon $1.3 mlrd oqimga yetdi, avgust esa $3.5 mlrd bo‘lgan. Manzara aniq: institutsional mablag‘lar ETF “qobig‘i” orqali kripto ta’siriga yana qaytmoqda.
Bu chakana FOMO emas — bu tuzilgan (strukturaviy) joylashtirish. Agar oqimlar shu sur’atda davom etsa, odatda bu yirik ishtirokchilar risk-on pozitsiyasini baholash uslubida o‘zgarish bo‘layotganini anglatadi.
15
Qisman to‘g‘ri
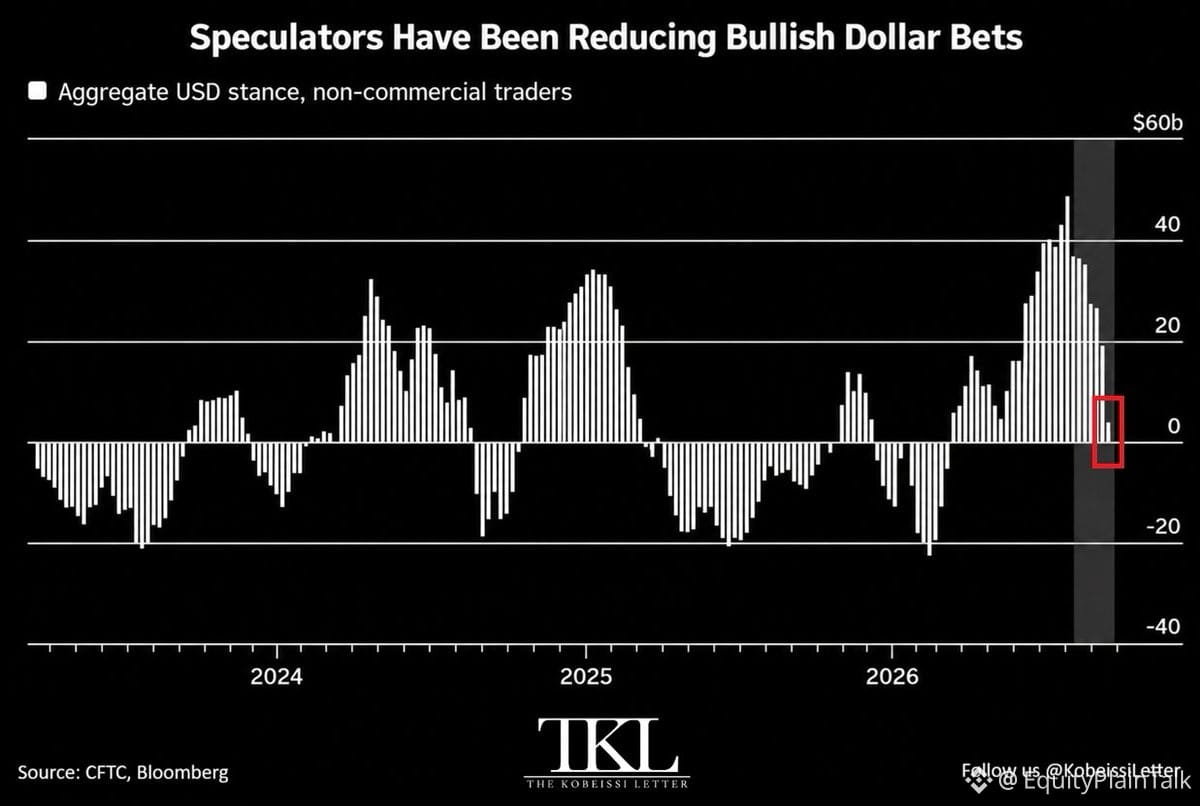
Institutsional pull muloyimlik bilan dollardan chekinmoqda.
Bir haftada long pozitsiyalar 15 mlrd dollarga kamaydi — atigi 5 mlrd dollargacha tushdi, martdan beri eng past ko‘rsatkich. Bu hedge-fondlar, valyuta treyderlari, aktiv menejerlari. Barchasi orqaga chekinayapti.
Ketma-ket 7 hafta pasayish. Yil boshidan beri eng uzun “seriya”.
Kontekst: Dollar bo‘yicha “bullar” iyul o‘rtalarida qariyb 50 mlrd dollarga cho‘qqiga chiqqan. Hozir esa ular 5 mlrd dollarda turibdi.
Shu bilan birga, Dollar Indeksi o‘tgan hafta 1,4%ga sakradi — 2026-yil mayidan beri eng katta o‘zgarish — Fed 2023-yil iyulidan beri birinchi marta foiz stavkasini oshirgandan so‘ng.
Ya’ni narx o‘sayapti, lekin pozitsiyalar pasaygan. Bu xil kelishmovchilik uzoq davom etmaydi.
Institutsiyalar sukunat bilan chiqib ketayotgan bo‘lsa, chakana savdogar esa kuchni ko‘rayotgan bo‘lsa, e’tibor bering. Valyuta bozorlari chalkashlikni kechirmaydi.
Institutsional pull muloyimlik bilan dollardan chekinmoqda.
Bir haftada long pozitsiyalar 15 mlrd dollarga kamaydi — atigi 5 mlrd dollargacha tushdi, martdan beri eng past ko‘rsatkich. Bu hedge-fondlar, valyuta treyderlari, aktiv menejerlari. Barchasi orqaga chekinayapti.
Ketma-ket 7 hafta pasayish. Yil boshidan beri eng uzun “seriya”.
Kontekst: Dollar bo‘yicha “bullar” iyul o‘rtalarida qariyb 50 mlrd dollarga cho‘qqiga chiqqan. Hozir esa ular 5 mlrd dollarda turibdi.
Shu bilan birga, Dollar Indeksi o‘tgan hafta 1,4%ga sakradi — 2026-yil mayidan beri eng katta o‘zgarish — Fed 2023-yil iyulidan beri birinchi marta foiz stavkasini oshirgandan so‘ng.
Ya’ni narx o‘sayapti, lekin pozitsiyalar pasaygan. Bu xil kelishmovchilik uzoq davom etmaydi.
Institutsiyalar sukunat bilan chiqib ketayotgan bo‘lsa, chakana savdogar esa kuchni ko‘rayotgan bo‘lsa, e’tibor bering. Valyuta bozorlari chalkashlikni kechirmaydi.
Bir haftada long pozitsiyalar 15 mlrd dollarga kamaydi — atigi 5 mlrd dollargacha tushdi, martdan beri eng past ko‘rsatkich. Bu hedge-fondlar, valyuta treyderlari, aktiv menejerlari. Barchasi orqaga chekinayapti.
Ketma-ket 7 hafta pasayish. Yil boshidan beri eng uzun “seriya”.
Kontekst: Dollar bo‘yicha “bullar” iyul o‘rtalarida qariyb 50 mlrd dollarga cho‘qqiga chiqqan. Hozir esa ular 5 mlrd dollarda turibdi.
Shu bilan birga, Dollar Indeksi o‘tgan hafta 1,4%ga sakradi — 2026-yil mayidan beri eng katta o‘zgarish — Fed 2023-yil iyulidan beri birinchi marta foiz stavkasini oshirgandan so‘ng.
Ya’ni narx o‘sayapti, lekin pozitsiyalar pasaygan. Bu xil kelishmovchilik uzoq davom etmaydi.
Institutsiyalar sukunat bilan chiqib ketayotgan bo‘lsa, chakana savdogar esa kuchni ko‘rayotgan bo‘lsa, e’tibor bering. Valyuta bozorlari chalkashlikni kechirmaydi.
1
152
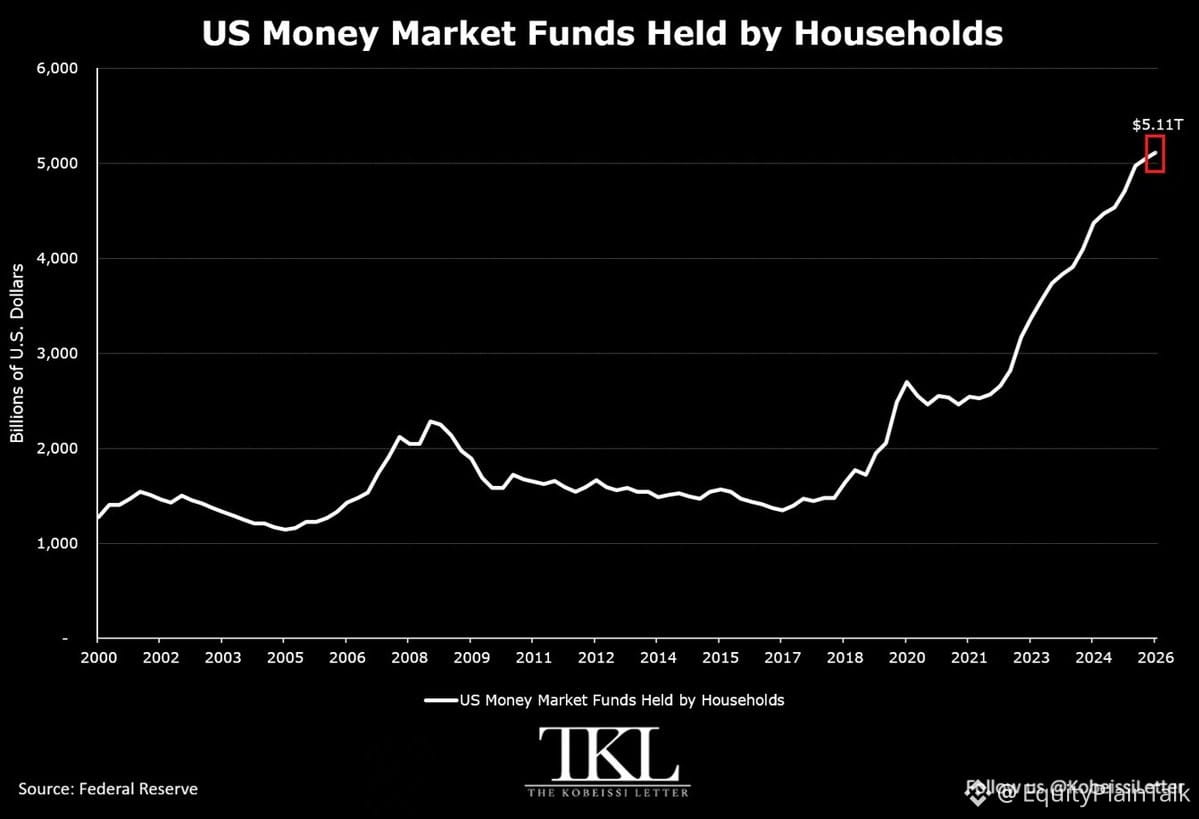
AQSh uy xo‘jaliklari Q2 da yana 63 mlrd dollarni pul bozoridagi jamg‘armalarga yo‘naltirdi va umumiy hajmni rekord 5,11 trln dollarga yetkazdi. Bu oqimlarning ketma-ket 17-choragi — chorakiga o‘rtacha 152 mlrd dollar.
Buni istiqbolga qo‘yadigan bo‘lsak: uy xo‘jaliklarining pul bozoridagi aktivlari endi 2020-yilgi pandemiya cho‘qqisidan 89% yuqori. Deyarli ikki baravar.
Ayni paytda, Fed 2023-yil iyulidan beri birinchi marta foiz stavkalarini oshirdi — 25 bps ga, ya’ni 4,00% gacha. Bozorlar 2027-yil o‘rtalarigacha yana 3 ta oshirishni narxlarda hisoblayapti.
Tarjima: Naqd pul yana podshoh. Agar siz risk-siz 4%+ daromad topa olsangiz, nega o‘zgaruvchanlikni quvlasiz? Bu aksiyalar uchun juda katta to‘sqinlik. Chetda, xavfsiz daromad keltirayotgan pul oqimi aksiyalarga o‘tmaydi.
Foizlar yuqori darajada qancha uzoq tursa, bu pul zaxirasi shuncha ko‘payadi. Va G‘aznachilik qimmatli qog‘ozlari hamda pul bozorlari kutish uchun sizga pul berayotganida, riskli aktivlarni oqlash shunchalik qiyin bo‘ladi.
Bu shunchaki bitta statistik ma’lumot emas. Bu xulq-atvorning o‘zgarishi.
AQSh uy xo‘jaliklari Q2 da yana 63 mlrd dollarni pul bozoridagi jamg‘armalarga yo‘naltirdi va umumiy hajmni rekord 5,11 trln dollarga yetkazdi. Bu oqimlarning ketma-ket 17-choragi — chorakiga o‘rtacha 152 mlrd dollar.
Buni istiqbolga qo‘yadigan bo‘lsak: uy xo‘jaliklarining pul bozoridagi aktivlari endi 2020-yilgi pandemiya cho‘qqisidan 89% yuqori. Deyarli ikki baravar.
Ayni paytda, Fed 2023-yil iyulidan beri birinchi marta foiz stavkalarini oshirdi — 25 bps ga, ya’ni 4,00% gacha. Bozorlar 2027-yil o‘rtalarigacha yana 3 ta oshirishni narxlarda hisoblayapti.
Tarjima: Naqd pul yana podshoh. Agar siz risk-siz 4%+ daromad topa olsangiz, nega o‘zgaruvchanlikni quvlasiz? Bu aksiyalar uchun juda katta to‘sqinlik. Chetda, xavfsiz daromad keltirayotgan pul oqimi aksiyalarga o‘tmaydi.
Foizlar yuqori darajada qancha uzoq tursa, bu pul zaxirasi shuncha ko‘payadi. Va G‘aznachilik qimmatli qog‘ozlari hamda pul bozorlari kutish uchun sizga pul berayotganida, riskli aktivlarni oqlash shunchalik qiyin bo‘ladi.
Bu shunchaki bitta statistik ma’lumot emas. Bu xulq-atvorning o‘zgarishi.
Buni istiqbolga qo‘yadigan bo‘lsak: uy xo‘jaliklarining pul bozoridagi aktivlari endi 2020-yilgi pandemiya cho‘qqisidan 89% yuqori. Deyarli ikki baravar.
Ayni paytda, Fed 2023-yil iyulidan beri birinchi marta foiz stavkalarini oshirdi — 25 bps ga, ya’ni 4,00% gacha. Bozorlar 2027-yil o‘rtalarigacha yana 3 ta oshirishni narxlarda hisoblayapti.
Tarjima: Naqd pul yana podshoh. Agar siz risk-siz 4%+ daromad topa olsangiz, nega o‘zgaruvchanlikni quvlasiz? Bu aksiyalar uchun juda katta to‘sqinlik. Chetda, xavfsiz daromad keltirayotgan pul oqimi aksiyalarga o‘tmaydi.
Foizlar yuqori darajada qancha uzoq tursa, bu pul zaxirasi shuncha ko‘payadi. Va G‘aznachilik qimmatli qog‘ozlari hamda pul bozorlari kutish uchun sizga pul berayotganida, riskli aktivlarni oqlash shunchalik qiyin bo‘ladi.
Bu shunchaki bitta statistik ma’lumot emas. Bu xulq-atvorning o‘zgarishi.
133
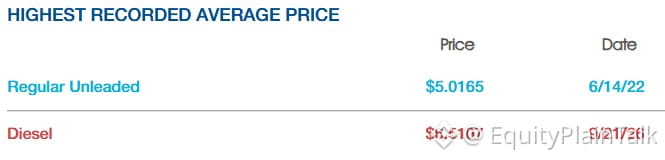
Dizel endi 6,51 dollar/galon — tarixiy rekord.
Bu nasosdan tashqarida ham muhim. Dizel yuk tashishni harakatga keltiradi, logistika tizimini quvvatlaydi va oziq-ovqat xarajatlarini oshiradi. Dizel narxi keskin ko‘tarilsa, inflyatsiya ham ergashadi.
Transport kompaniyalari marjani siqib oladi. Chakana savdogarlar xarajatlarni iste’molchilarga o‘tkazadi. Ta’minot zanjirlari keskinlashadi.
Yuk mashinalari aktsiyalari, iste’mol tovarlari va taqsimotga bog‘liq bo‘lgan har qanday narsaga e’tibor bering. Yoqilg‘i qanchalik qimmat bo‘lsa, hamma narsa shunchalik qimmatlashadi.
Dizel endi 6,51 dollar/galon — tarixiy rekord.
Bu nasosdan tashqarida ham muhim. Dizel yuk tashishni harakatga keltiradi, logistika tizimini quvvatlaydi va oziq-ovqat xarajatlarini oshiradi. Dizel narxi keskin ko‘tarilsa, inflyatsiya ham ergashadi.
Transport kompaniyalari marjani siqib oladi. Chakana savdogarlar xarajatlarni iste’molchilarga o‘tkazadi. Ta’minot zanjirlari keskinlashadi.
Yuk mashinalari aktsiyalari, iste’mol tovarlari va taqsimotga bog‘liq bo‘lgan har qanday narsaga e’tibor bering. Yoqilg‘i qanchalik qimmat bo‘lsa, hamma narsa shunchalik qimmatlashadi.
Bu nasosdan tashqarida ham muhim. Dizel yuk tashishni harakatga keltiradi, logistika tizimini quvvatlaydi va oziq-ovqat xarajatlarini oshiradi. Dizel narxi keskin ko‘tarilsa, inflyatsiya ham ergashadi.
Transport kompaniyalari marjani siqib oladi. Chakana savdogarlar xarajatlarni iste’molchilarga o‘tkazadi. Ta’minot zanjirlari keskinlashadi.
Yuk mashinalari aktsiyalari, iste’mol tovarlari va taqsimotga bog‘liq bo‘lgan har qanday narsaga e’tibor bering. Yoqilg‘i qanchalik qimmat bo‘lsa, hamma narsa shunchalik qimmatlashadi.
354
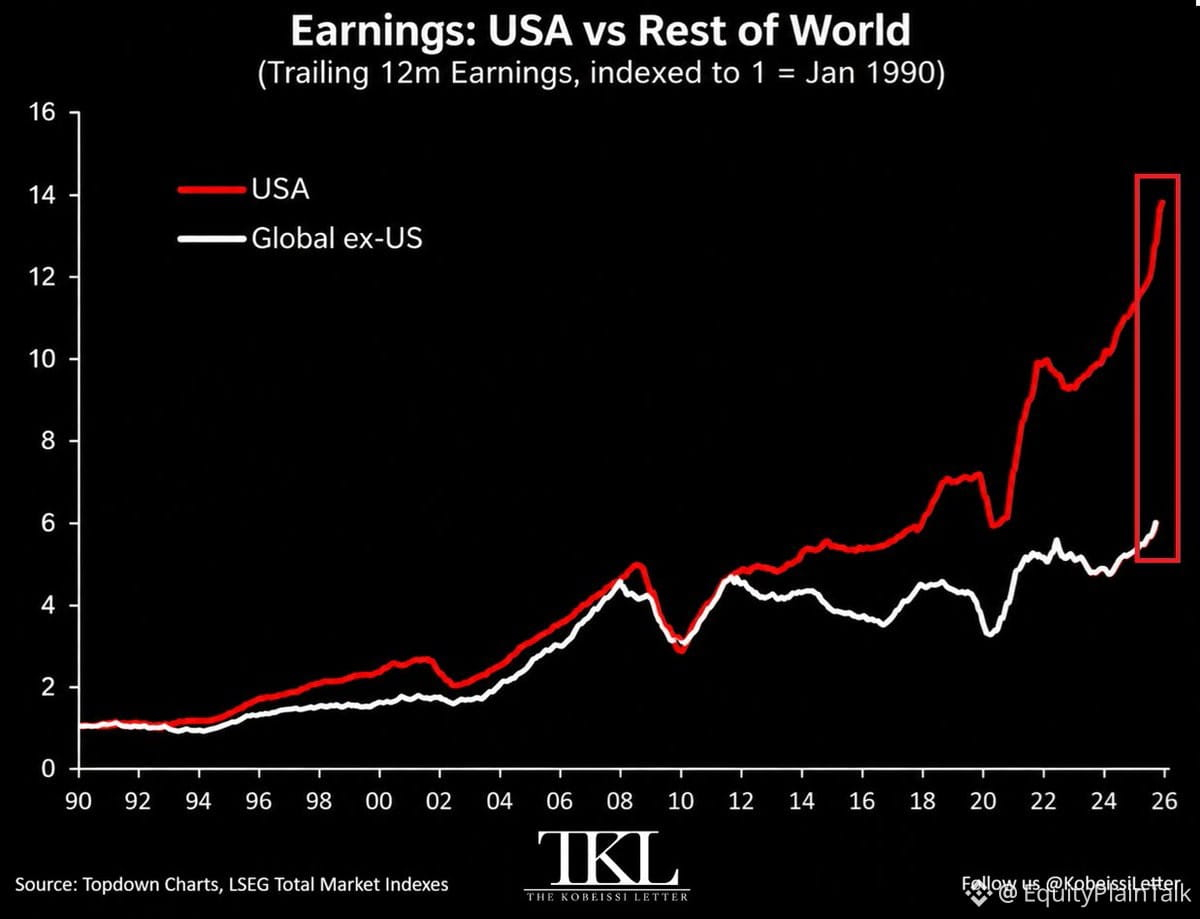
AQSh korporatsiyalarining daromadlari butun dunyodagilarniki shunchaki «yanchib» tashladi — va bu hatto yaqin ham emas.
1990 yildan beri:
• AQSh kompaniyalari: +1,300% daromad o‘sishi
• Dunyodagi qolgan qismi: +500%
Bu AQSh kompaniyalaridan 2,6 barobar ko‘proq o‘sish demak. Yanada ajablanarlimi? AQShdan tashqari global foyda o‘sishi 2008 yildan hozirgacha deyarli tekis (o‘zgarmas) bo‘lib kelgan.
Bu faqat texnologiya gigantlari yoki bitta «issiq» tarmoq haqida emas. Bu — tizimli holat: kapitalni yanada yaxshi taqsimlash, chuqurroq bozorlar, ko‘proq innovatsiya, kuchli aksiyadorlar madaniyati.
Farq tobora kengaymoqda. Nega AQSh aksiyalari nega ustama (premium) bilan sotilishini o‘ylayotgan bo‘lsangiz, sababi shunda. Daromad keltirish kuchi boshqa joyda shunchaki teng kelmaydi.
AQSh korporatsiyalarining daromadlari butun dunyodagilarniki shunchaki «yanchib» tashladi — va bu hatto yaqin ham emas.
1990 yildan beri:
• AQSh kompaniyalari: +1,300% daromad o‘sishi
• Dunyodagi qolgan qismi: +500%
Bu AQSh kompaniyalaridan 2,6 barobar ko‘proq o‘sish demak. Yanada ajablanarlimi? AQShdan tashqari global foyda o‘sishi 2008 yildan hozirgacha deyarli tekis (o‘zgarmas) bo‘lib kelgan.
Bu faqat texnologiya gigantlari yoki bitta «issiq» tarmoq haqida emas. Bu — tizimli holat: kapitalni yanada yaxshi taqsimlash, chuqurroq bozorlar, ko‘proq innovatsiya, kuchli aksiyadorlar madaniyati.
Farq tobora kengaymoqda. Nega AQSh aksiyalari nega ustama (premium) bilan sotilishini o‘ylayotgan bo‘lsangiz, sababi shunda. Daromad keltirish kuchi boshqa joyda shunchaki teng kelmaydi.
1990 yildan beri:
• AQSh kompaniyalari: +1,300% daromad o‘sishi
• Dunyodagi qolgan qismi: +500%
Bu AQSh kompaniyalaridan 2,6 barobar ko‘proq o‘sish demak. Yanada ajablanarlimi? AQShdan tashqari global foyda o‘sishi 2008 yildan hozirgacha deyarli tekis (o‘zgarmas) bo‘lib kelgan.
Bu faqat texnologiya gigantlari yoki bitta «issiq» tarmoq haqida emas. Bu — tizimli holat: kapitalni yanada yaxshi taqsimlash, chuqurroq bozorlar, ko‘proq innovatsiya, kuchli aksiyadorlar madaniyati.
Farq tobora kengaymoqda. Nega AQSh aksiyalari nega ustama (premium) bilan sotilishini o‘ylayotgan bo‘lsangiz, sababi shunda. Daromad keltirish kuchi boshqa joyda shunchaki teng kelmaydi.
437
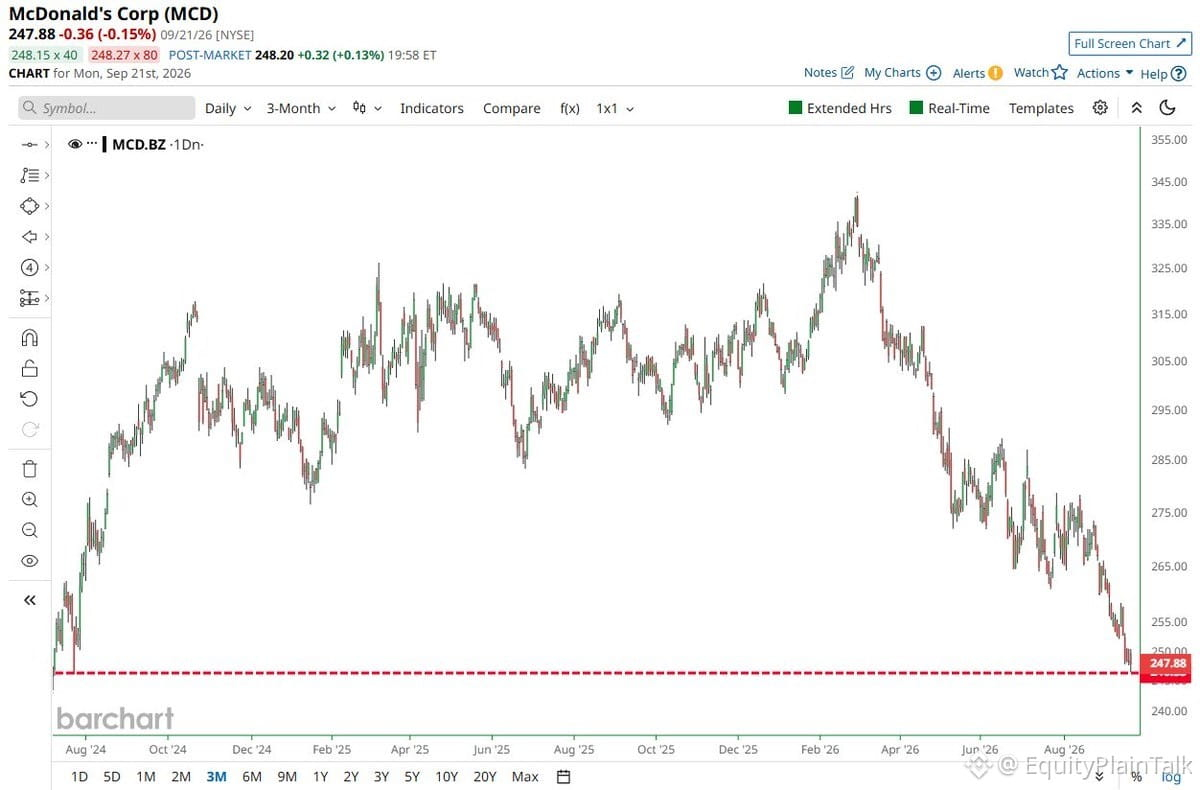
$MCD iyul oyidan beri eng past darajaga tushmoqda. Tez tayyorlanadigan taomlar aksiyalari o'sib borayotgan xarajatlar va iste’molchilarning xaridni qisqartirishi o'rtasida qisilib qolmoqda. Hatto McDonald's ham qo'llab-quvvatlashni ushlab tura olmasa, hozirgi paytda ixtiyoriy xarajatlar borasida nimadir deyayotgani.
$MCD iyul oyidan beri eng past darajaga tushmoqda. Tez tayyorlanadigan taomlar aksiyalari o'sib borayotgan xarajatlar va iste’molchilarning xaridni qisqartirishi o'rtasida qisilib qolmoqda. Hatto McDonald's ham qo'llab-quvvatlashni ushlab tura olmasa, hozirgi paytda ixtiyoriy xarajatlar borasida nimadir deyayotgani.
272
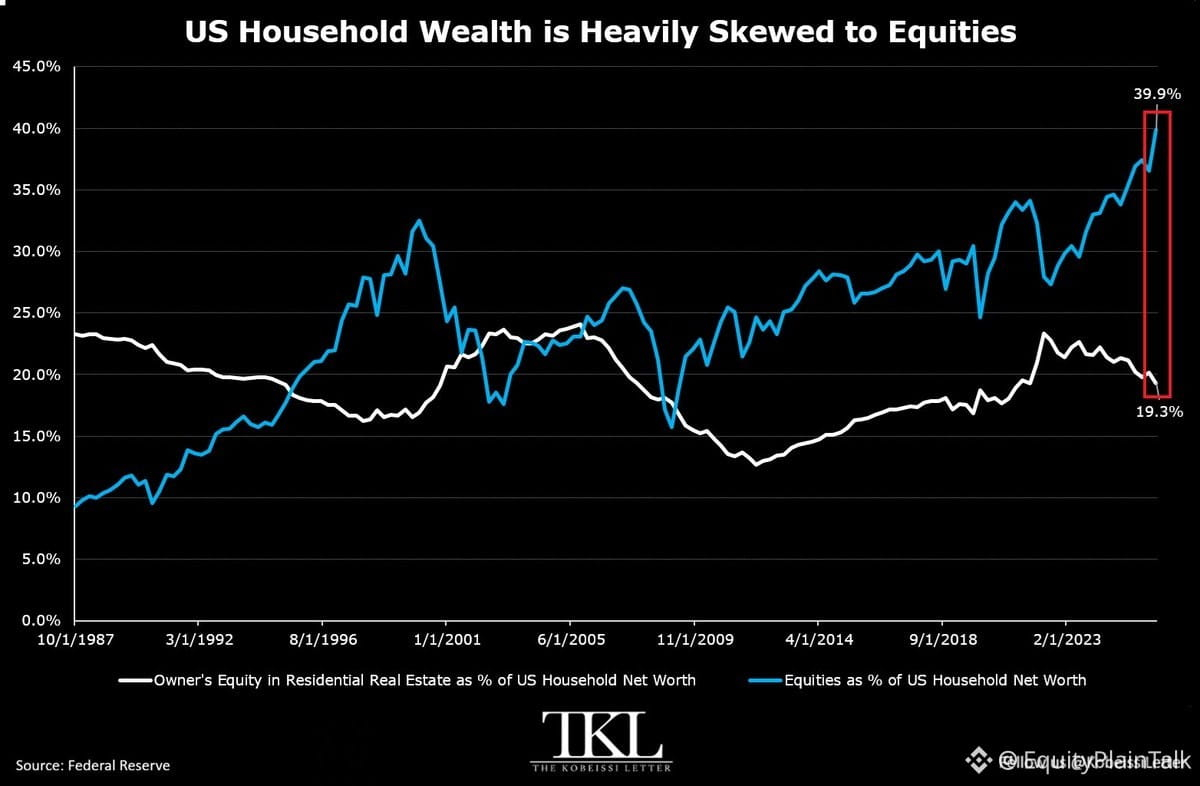
AQSh uy xo‘jaliklari endi tarixdagidan ko‘ra ko‘proq aksiyalarga (stocks) bog‘liq.
Aksiyalarga bo‘lgan ta’sir bugun uy xo‘jaliklari sof boyligining rekord 39,9%iga yetdi. Bu 2022-yildagi ayiq bozoriga nisbatan 12,6 foiz punktga yuqori.
Shu bilan birga, turar-joy ko‘chmas mulkiga bo‘lgan ta’sir 3,5 foiz punktga tushib, 19,3%ga yetdi — 2021-yil o‘rtalaridan beri eng past ko‘rsatkich.
Aksiyalar bilan ko‘chmas mulk o‘rtasidagi farq? Rekord 20,6 foiz punkt.
Tushunish uchun: 2005-yildagi uy-joy bumida ko‘chmas mulk uy xo‘jaliklari boyligining 24,1%igacha ko‘tarilib, hatto aksiyalarga bo‘lgan ta’sirdan 1 foiz punktga yuqoriroq bo‘lgan.
Bugun esa aksincha — vaziyat eng chekka tomonga og‘ib ketgan. Uy xo‘jaliklari boyligi hech qachon bu qadar aksiyalarga tomon og‘magan.
Bu, albatta, o‘zi yomon degani emas, lekin bu uy xo‘jaliklari aksiyadorlik bozori tebranishlariga tarixdagi istalgan davrga qaraganda ko‘proq sezgir ekanini anglatadi. $SPY aksirsa, balanslar buni darhol his qiladi.
AQSh uy xo‘jaliklari endi tarixdagidan ko‘ra ko‘proq aksiyalarga (stocks) bog‘liq.
Aksiyalarga bo‘lgan ta’sir bugun uy xo‘jaliklari sof boyligining rekord 39,9%iga yetdi. Bu 2022-yildagi ayiq bozoriga nisbatan 12,6 foiz punktga yuqori.
Shu bilan birga, turar-joy ko‘chmas mulkiga bo‘lgan ta’sir 3,5 foiz punktga tushib, 19,3%ga yetdi — 2021-yil o‘rtalaridan beri eng past ko‘rsatkich.
Aksiyalar bilan ko‘chmas mulk o‘rtasidagi farq? Rekord 20,6 foiz punkt.
Tushunish uchun: 2005-yildagi uy-joy bumida ko‘chmas mulk uy xo‘jaliklari boyligining 24,1%igacha ko‘tarilib, hatto aksiyalarga bo‘lgan ta’sirdan 1 foiz punktga yuqoriroq bo‘lgan.
Bugun esa aksincha — vaziyat eng chekka tomonga og‘ib ketgan. Uy xo‘jaliklari boyligi hech qachon bu qadar aksiyalarga tomon og‘magan.
Bu, albatta, o‘zi yomon degani emas, lekin bu uy xo‘jaliklari aksiyadorlik bozori tebranishlariga tarixdagi istalgan davrga qaraganda ko‘proq sezgir ekanini anglatadi. $SPY aksirsa, balanslar buni darhol his qiladi.
Aksiyalarga bo‘lgan ta’sir bugun uy xo‘jaliklari sof boyligining rekord 39,9%iga yetdi. Bu 2022-yildagi ayiq bozoriga nisbatan 12,6 foiz punktga yuqori.
Shu bilan birga, turar-joy ko‘chmas mulkiga bo‘lgan ta’sir 3,5 foiz punktga tushib, 19,3%ga yetdi — 2021-yil o‘rtalaridan beri eng past ko‘rsatkich.
Aksiyalar bilan ko‘chmas mulk o‘rtasidagi farq? Rekord 20,6 foiz punkt.
Tushunish uchun: 2005-yildagi uy-joy bumida ko‘chmas mulk uy xo‘jaliklari boyligining 24,1%igacha ko‘tarilib, hatto aksiyalarga bo‘lgan ta’sirdan 1 foiz punktga yuqoriroq bo‘lgan.
Bugun esa aksincha — vaziyat eng chekka tomonga og‘ib ketgan. Uy xo‘jaliklari boyligi hech qachon bu qadar aksiyalarga tomon og‘magan.
Bu, albatta, o‘zi yomon degani emas, lekin bu uy xo‘jaliklari aksiyadorlik bozori tebranishlariga tarixdagi istalgan davrga qaraganda ko‘proq sezgir ekanini anglatadi. $SPY aksirsa, balanslar buni darhol his qiladi.
46
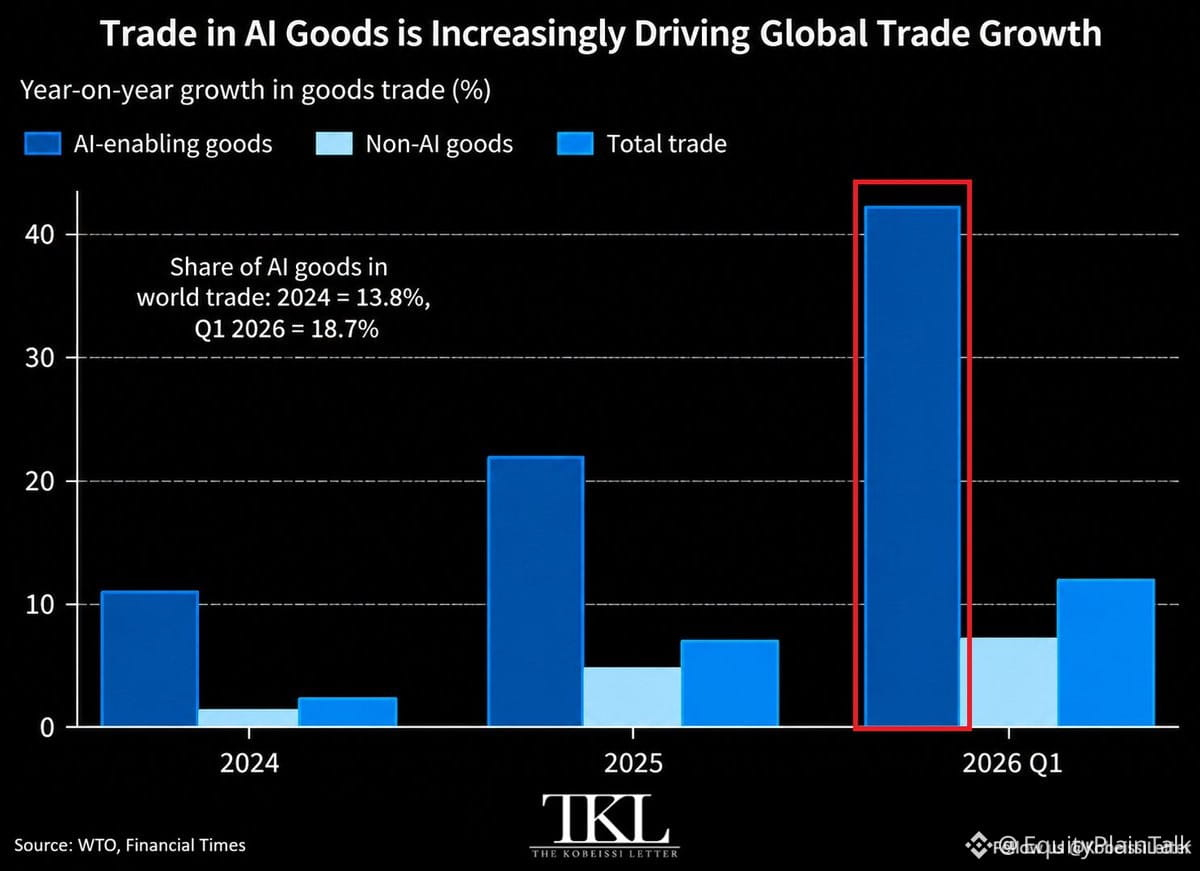
AI apparati endi global savdo o‘sishining eng katta yagona drayveri bo‘lib qoldi.
2026-yil 1-chorak raqamlari:
• AI’ni qo‘llab-quvvatlovchi tovarlar: +42% y/y (rekord daraja)
• AI’ga aloqasi bo‘lmagan tovarlar: +7% y/y
• Umumiy global savdo: +12% y/y
Hozir AI tovarlari jahon savdosining 18.7%ini tashkil etadi, bu esa ikki yil avvalgiga nisbatan (13.8%) ko‘proq.
Taqqoslash uchun: 2024-yilda umumiy savdo o‘sishi atigi +2% bo‘lgan. AI 2024-yilda +11% o‘sishdan → 2025-yilda +22% ga → hozir +42% ga chiqdi.
Bu shunchaki “xayolot” emas. Bu savdoning real ma’lumotlarida ko‘rinmoqda. Chiplar, serverlar, GPU’lar, ma’lumotlar markazi uskunalari — chegaralar bo‘ylab harakatlanayotgan haqiqiy jismoniy tovarlar tezlashib borayotgan sur’atda.
Infratuzilma barpo etilishi juda katta ko‘lamda va u global ta’minot zanjirlarini qayta shakllantirmoqda. AI apparati eksportida yutuqqa erishayotgan davlatlar va kompaniyalar kutilganidan ham katta iqtisodiy foyda ko‘rayapti.
Semiconductor aksiyalarini, logistika kompaniyalarini va kuchli texnologik ishlab chiqarish bazasiga ega mamlakatlarni kuzating. Bu tendensiyada “muddat” bor.
AI apparati endi global savdo o‘sishining eng katta yagona drayveri bo‘lib qoldi.
2026-yil 1-chorak raqamlari:
• AI’ni qo‘llab-quvvatlovchi tovarlar: +42% y/y (rekord daraja)
• AI’ga aloqasi bo‘lmagan tovarlar: +7% y/y
• Umumiy global savdo: +12% y/y
Hozir AI tovarlari jahon savdosining 18.7%ini tashkil etadi, bu esa ikki yil avvalgiga nisbatan (13.8%) ko‘proq.
Taqqoslash uchun: 2024-yilda umumiy savdo o‘sishi atigi +2% bo‘lgan. AI 2024-yilda +11% o‘sishdan → 2025-yilda +22% ga → hozir +42% ga chiqdi.
Bu shunchaki “xayolot” emas. Bu savdoning real ma’lumotlarida ko‘rinmoqda. Chiplar, serverlar, GPU’lar, ma’lumotlar markazi uskunalari — chegaralar bo‘ylab harakatlanayotgan haqiqiy jismoniy tovarlar tezlashib borayotgan sur’atda.
Infratuzilma barpo etilishi juda katta ko‘lamda va u global ta’minot zanjirlarini qayta shakllantirmoqda. AI apparati eksportida yutuqqa erishayotgan davlatlar va kompaniyalar kutilganidan ham katta iqtisodiy foyda ko‘rayapti.
Semiconductor aksiyalarini, logistika kompaniyalarini va kuchli texnologik ishlab chiqarish bazasiga ega mamlakatlarni kuzating. Bu tendensiyada “muddat” bor.
2026-yil 1-chorak raqamlari:
• AI’ni qo‘llab-quvvatlovchi tovarlar: +42% y/y (rekord daraja)
• AI’ga aloqasi bo‘lmagan tovarlar: +7% y/y
• Umumiy global savdo: +12% y/y
Hozir AI tovarlari jahon savdosining 18.7%ini tashkil etadi, bu esa ikki yil avvalgiga nisbatan (13.8%) ko‘proq.
Taqqoslash uchun: 2024-yilda umumiy savdo o‘sishi atigi +2% bo‘lgan. AI 2024-yilda +11% o‘sishdan → 2025-yilda +22% ga → hozir +42% ga chiqdi.
Bu shunchaki “xayolot” emas. Bu savdoning real ma’lumotlarida ko‘rinmoqda. Chiplar, serverlar, GPU’lar, ma’lumotlar markazi uskunalari — chegaralar bo‘ylab harakatlanayotgan haqiqiy jismoniy tovarlar tezlashib borayotgan sur’atda.
Infratuzilma barpo etilishi juda katta ko‘lamda va u global ta’minot zanjirlarini qayta shakllantirmoqda. AI apparati eksportida yutuqqa erishayotgan davlatlar va kompaniyalar kutilganidan ham katta iqtisodiy foyda ko‘rayapti.
Semiconductor aksiyalarini, logistika kompaniyalarini va kuchli texnologik ishlab chiqarish bazasiga ega mamlakatlarni kuzating. Bu tendensiyada “muddat” bor.
27
$ETH yanvargacha bo‘lgan birinchi marta $2,800 dan oshdi.
Bu 2 oylik eng yuqori ko‘rsatkich. Bir necha haftalik konsolidatsiyadan keyin toza impuls.
Agar shu darajadan yuqorida ushlanib qolsa yoki oddiygina tezkor «spike» bo‘lib so‘ng o‘chib qoladimi — shuni kuzatishga arziydi. Hamma gap sarlavhadagi raqamdan ko‘ra ko‘proq savdo hajmi va keyingi davomiylikda.
$ETH yanvargacha bo‘lgan birinchi marta $2,800 dan oshdi.
Bu 2 oylik eng yuqori ko‘rsatkich. Bir necha haftalik konsolidatsiyadan keyin toza impuls.
Agar shu darajadan yuqorida ushlanib qolsa yoki oddiygina tezkor «spike» bo‘lib so‘ng o‘chib qoladimi — shuni kuzatishga arziydi. Hamma gap sarlavhadagi raqamdan ko‘ra ko‘proq savdo hajmi va keyingi davomiylikda.
Bu 2 oylik eng yuqori ko‘rsatkich. Bir necha haftalik konsolidatsiyadan keyin toza impuls.
Agar shu darajadan yuqorida ushlanib qolsa yoki oddiygina tezkor «spike» bo‘lib so‘ng o‘chib qoladimi — shuni kuzatishga arziydi. Hamma gap sarlavhadagi raqamdan ko‘ra ko‘proq savdo hajmi va keyingi davomiylikda.
487
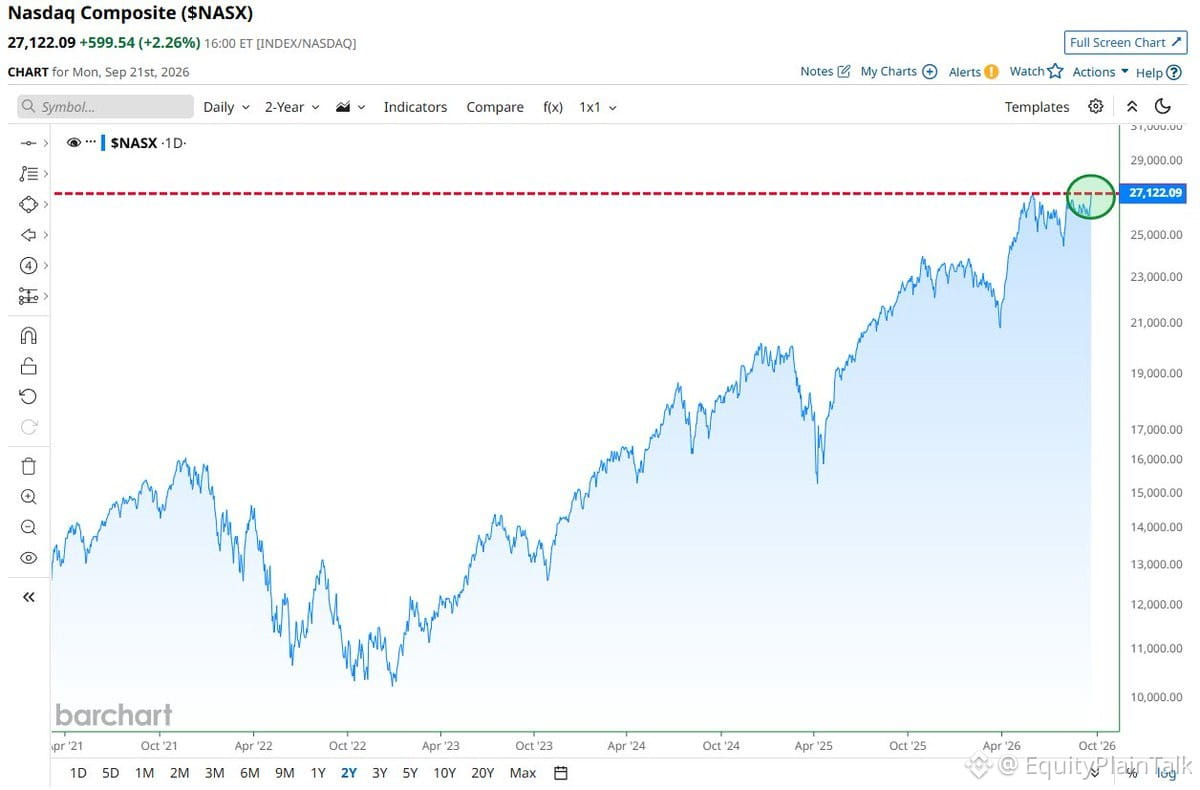
Nasdaq endi eng yuqori rekord darajasida yopildi.
Bozor texnologiya kuchi bilan barqaror yuqoriga ko‘tarilmoqda, foiz stavkalari borasidagi xavotirlar yumshayapti va foyda bo‘yicha ko‘rsatkichlar ham mustahkam. Indekslar yangi cho‘qqilarga chiqayotganida, keng ko‘lamlilik saqlanib qoladimi yoki og‘ir ishni faqat bir nechta mega-korporatsiyalar bajaryaptimi—shuni kuzatib arziydi.
Oldinda hali ko‘p noaniqlik bor: Fed siyosati, hisobotlar mavsumi, geosiyosat... lekin hozircha xaridorlar nazoratni o‘z qo‘lida ushlab turibdi.
Nasdaq endi eng yuqori rekord darajasida yopildi.
Bozor texnologiya kuchi bilan barqaror yuqoriga ko‘tarilmoqda, foiz stavkalari borasidagi xavotirlar yumshayapti va foyda bo‘yicha ko‘rsatkichlar ham mustahkam. Indekslar yangi cho‘qqilarga chiqayotganida, keng ko‘lamlilik saqlanib qoladimi yoki og‘ir ishni faqat bir nechta mega-korporatsiyalar bajaryaptimi—shuni kuzatib arziydi.
Oldinda hali ko‘p noaniqlik bor: Fed siyosati, hisobotlar mavsumi, geosiyosat... lekin hozircha xaridorlar nazoratni o‘z qo‘lida ushlab turibdi.
Bozor texnologiya kuchi bilan barqaror yuqoriga ko‘tarilmoqda, foiz stavkalari borasidagi xavotirlar yumshayapti va foyda bo‘yicha ko‘rsatkichlar ham mustahkam. Indekslar yangi cho‘qqilarga chiqayotganida, keng ko‘lamlilik saqlanib qoladimi yoki og‘ir ishni faqat bir nechta mega-korporatsiyalar bajaryaptimi—shuni kuzatib arziydi.
Oldinda hali ko‘p noaniqlik bor: Fed siyosati, hisobotlar mavsumi, geosiyosat... lekin hozircha xaridorlar nazoratni o‘z qo‘lida ushlab turibdi.
1
84
AQSh dizeli endi $6.51/galon — yangi rekord daraja. Yanvar oyidan beri 101% ga oshgan.
Kaliforniyada esa u $8.42. Oddiy benzin? Butun mamlakat bo‘ylab $4.48, ayni oyning o‘zida 80% ga qimmatlashgan.
Tramp Ukraina urushi bilan bog‘liq vaziyat tufayli Rossiyaning dizel yetkazib berish muammolarini ko‘rsatmoqda. Tarjima: bu tez orada kamaymaydi.
Dizel yuk tashish, yuk-xizmat, qishloq xo‘jaligini ishlatadi — hamma narsani harakatga keltiradigan narsa. Narx ikki baravar bo‘lganda, bu xarajat hamma joyda seziladi. Oziq-ovqat mahsulotlari, yetkazib berish, qurilish — xullas hammasi.
Bu faqat energiya haqidagi voqea emas. Bu inflyatsiya haqidagi voqea. Va u hali tugamagan.
AQSh dizeli endi $6.51/galon — yangi rekord daraja. Yanvar oyidan beri 101% ga oshgan.
Kaliforniyada esa u $8.42. Oddiy benzin? Butun mamlakat bo‘ylab $4.48, ayni oyning o‘zida 80% ga qimmatlashgan.
Tramp Ukraina urushi bilan bog‘liq vaziyat tufayli Rossiyaning dizel yetkazib berish muammolarini ko‘rsatmoqda. Tarjima: bu tez orada kamaymaydi.
Dizel yuk tashish, yuk-xizmat, qishloq xo‘jaligini ishlatadi — hamma narsani harakatga keltiradigan narsa. Narx ikki baravar bo‘lganda, bu xarajat hamma joyda seziladi. Oziq-ovqat mahsulotlari, yetkazib berish, qurilish — xullas hammasi.
Bu faqat energiya haqidagi voqea emas. Bu inflyatsiya haqidagi voqea. Va u hali tugamagan.
Kaliforniyada esa u $8.42. Oddiy benzin? Butun mamlakat bo‘ylab $4.48, ayni oyning o‘zida 80% ga qimmatlashgan.
Tramp Ukraina urushi bilan bog‘liq vaziyat tufayli Rossiyaning dizel yetkazib berish muammolarini ko‘rsatmoqda. Tarjima: bu tez orada kamaymaydi.
Dizel yuk tashish, yuk-xizmat, qishloq xo‘jaligini ishlatadi — hamma narsani harakatga keltiradigan narsa. Narx ikki baravar bo‘lganda, bu xarajat hamma joyda seziladi. Oziq-ovqat mahsulotlari, yetkazib berish, qurilish — xullas hammasi.
Bu faqat energiya haqidagi voqea emas. Bu inflyatsiya haqidagi voqea. Va u hali tugamagan.
30
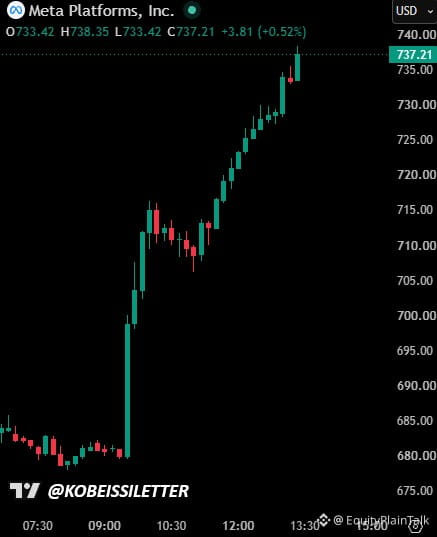
$META bugun shunchaki zo‘r bo‘lyapti—10% dan oshib, iyul oyidan beri eng yaxshi bir kunlik ko‘tarilishga tomon ketmoqda.
Bu bitta sessiyada 190 milliard dollarlik bozor kapitallariga qo‘shilgani degani. Taqqoslash uchun: bu aksariyat S&P 500 kompaniyalarining butun bahosidan kattaroq.
Bunday harakat odatda ikki sababdan biriga bog‘liq bo‘ladi: yirik daromad (earnings) prognozining kutilganidan kuchli chiqishi, narrativni o‘zgartiradigan mahsulot e’loni yoki keng ko‘lamli texnologiyalar mitingi butun sektorni ko‘tarib ketishi. Qanday bo‘lmasin, katalizator nima bo‘lsa ham, bozor Meta’ning yaqin muddatli istiqbolini qayta baholayotgani aniq.
E’tibor berish kerak: bu kun davomida (yopilishgacha) ushlanib qoladimi yoki qo‘ng‘iroq chalinishidan oldin foyda olish (profit-taking) ko‘ramizmi? Katta bir kunlik sakrashlar momentumni ko‘rsatishi mumkin, ammo kuzatuv (follow-through) bo‘lmasa, ular qisqa muddatli tepaliklarni ham anglatishi mumkin.
$META bugun shunchaki zo‘r bo‘lyapti—10% dan oshib, iyul oyidan beri eng yaxshi bir kunlik ko‘tarilishga tomon ketmoqda.
Bu bitta sessiyada 190 milliard dollarlik bozor kapitallariga qo‘shilgani degani. Taqqoslash uchun: bu aksariyat S&P 500 kompaniyalarining butun bahosidan kattaroq.
Bunday harakat odatda ikki sababdan biriga bog‘liq bo‘ladi: yirik daromad (earnings) prognozining kutilganidan kuchli chiqishi, narrativni o‘zgartiradigan mahsulot e’loni yoki keng ko‘lamli texnologiyalar mitingi butun sektorni ko‘tarib ketishi. Qanday bo‘lmasin, katalizator nima bo‘lsa ham, bozor Meta’ning yaqin muddatli istiqbolini qayta baholayotgani aniq.
E’tibor berish kerak: bu kun davomida (yopilishgacha) ushlanib qoladimi yoki qo‘ng‘iroq chalinishidan oldin foyda olish (profit-taking) ko‘ramizmi? Katta bir kunlik sakrashlar momentumni ko‘rsatishi mumkin, ammo kuzatuv (follow-through) bo‘lmasa, ular qisqa muddatli tepaliklarni ham anglatishi mumkin.
Bu bitta sessiyada 190 milliard dollarlik bozor kapitallariga qo‘shilgani degani. Taqqoslash uchun: bu aksariyat S&P 500 kompaniyalarining butun bahosidan kattaroq.
Bunday harakat odatda ikki sababdan biriga bog‘liq bo‘ladi: yirik daromad (earnings) prognozining kutilganidan kuchli chiqishi, narrativni o‘zgartiradigan mahsulot e’loni yoki keng ko‘lamli texnologiyalar mitingi butun sektorni ko‘tarib ketishi. Qanday bo‘lmasin, katalizator nima bo‘lsa ham, bozor Meta’ning yaqin muddatli istiqbolini qayta baholayotgani aniq.
E’tibor berish kerak: bu kun davomida (yopilishgacha) ushlanib qoladimi yoki qo‘ng‘iroq chalinishidan oldin foyda olish (profit-taking) ko‘ramizmi? Katta bir kunlik sakrashlar momentumni ko‘rsatishi mumkin, ammo kuzatuv (follow-through) bo‘lmasa, ular qisqa muddatli tepaliklarni ham anglatishi mumkin.
211
AQShning strategik neft zaxirasi 284,6 million barrelga yetib, 1982-yildan beri eng past ko‘rsatkichga tushdi.
Bu — 26 hafta ketma-ket pasayish. Maksimumdan 131 million barrelga ko‘proq kamaygan.
Tramp 3 hafta oldin zaxiralarni to‘ldirish uchun venesuelalik neftdan foydalanishini aytgandi. Hozirgacha kutyapmiz.
Hozir Amerikada favqulodda neft zaxirasi nihoyatda yupqa. Agar geosiyosiy sohada biror narsa buzilsa yoki ta’minot izdan chiqsa, bizda juda kam zaxira qoladi.
Gap faqat bitta raqam haqida emas — bu strategik zaiflik. Energetik xavfsizlik dunyo shu qadar beqaror bo‘lgan sharoitda ayniqsa muhim.
AQShning strategik neft zaxirasi 284,6 million barrelga yetib, 1982-yildan beri eng past ko‘rsatkichga tushdi.
Bu — 26 hafta ketma-ket pasayish. Maksimumdan 131 million barrelga ko‘proq kamaygan.
Tramp 3 hafta oldin zaxiralarni to‘ldirish uchun venesuelalik neftdan foydalanishini aytgandi. Hozirgacha kutyapmiz.
Hozir Amerikada favqulodda neft zaxirasi nihoyatda yupqa. Agar geosiyosiy sohada biror narsa buzilsa yoki ta’minot izdan chiqsa, bizda juda kam zaxira qoladi.
Gap faqat bitta raqam haqida emas — bu strategik zaiflik. Energetik xavfsizlik dunyo shu qadar beqaror bo‘lgan sharoitda ayniqsa muhim.
Bu — 26 hafta ketma-ket pasayish. Maksimumdan 131 million barrelga ko‘proq kamaygan.
Tramp 3 hafta oldin zaxiralarni to‘ldirish uchun venesuelalik neftdan foydalanishini aytgandi. Hozirgacha kutyapmiz.
Hozir Amerikada favqulodda neft zaxirasi nihoyatda yupqa. Agar geosiyosiy sohada biror narsa buzilsa yoki ta’minot izdan chiqsa, bizda juda kam zaxira qoladi.
Gap faqat bitta raqam haqida emas — bu strategik zaiflik. Energetik xavfsizlik dunyo shu qadar beqaror bo‘lgan sharoitda ayniqsa muhim.
18
Ko‘proq kontentni ko‘rish uchun tizimga kiring
Binance Square'da global kriptovalyuta foydalanuvchilariga qo‘shiling
⚡️ Kriptovalyuta haqida eng so‘nggi va foydali ma’lumotlarni oling.
💬 Dunyoning eng yirik kriptovalyuta birjasi tomonidan ishonchli deb topilgan.
👍 Tasdiqlangan mualliflardan haqiqiy tahlillarni kashf eting.
Email / telefon raqami
Trenddagi mavzular
AIStocksWhatNext
313,961 marta koʻrilgan
2,774 muhokama qilmoqda
Trendlashayotgan xeshteglar kampaniyamizda “Share & Win” trafik mukofotini qo‘lga kiriting
✨Mavzu: AI aksiya kurslari o‘sishda davom etayotgan bir paytda yana qanday investitsiya imkoniyatlari bor?
👉Qanday qo‘shilish:
#AIStocksWhatNext xeshtegi bilan qisqa post yoki maqola joylang
Siz bu holatda bullish tomondamisiz yoki bearish — shuni ayting va AI aksiyalaringiz bo‘yicha portfelingizni yoki treydlaringizni ulashing; treyd vidjeti sizning ishtirokingizga moslikni oshirishi mumkin.
Shuningdek, postingizni ma’lumotlar yoki grafiklar bilan boyitib, AI tomonidan yaratilgan rasmlardan foydalanmaslik orqali kuchaytira olasiz.
✍️Quyidagi yo‘nalishlardan kelib chiqib kontent yarating:
- Nvidia chip sotuvlari kelasi yili ikki baravar bo‘lishini aytdi, eng yirik AI kompaniyalar esa rekord darajadagi daromadlarni qayd etishda davom etyapti — ortidagi hisoblash xarajatlari ham juda katta. AIga talab haqiqatan ham shiddat bilan oshyaptimi? Bu qancha davom etishi mumkin? AI aksiyalar hamma joyda o‘sishda. Bu haqiqiy “breakout”mi yoki faqat qisqa muddatli sakrashmi?
- Tarmoq yetakchilari AI rivojlanishini sekinlashtirishga chaqirmoqda, Trump esa “AI Force” barpo etishni rejalashtirib, AI kelajakda AQSh YAIMning 25%ini tashkil qilishi mumkinligini aytmoqda. Siz qaysi tomondsiz? Davlat darajasidagi qo‘llab-quvvatlash AI aksiyalar uchun uzoq muddatli yutuq bo‘ladimi?
- Siz AI aksiyalarini sotib olyapsizmi? Bizning trade sharing vidjetimiz orqali AI’ga oid treydingiz/ulushingizni ulashing.
⏰Kampaniya davri:
- 2026-09-22 7:00 - 2026-09-24 4:00 UTC
🎁Mukofot:
- Yuqoridagi ko‘rsatmalarga mos keladigan va 100 tadan ko‘p so‘zdan iborat malakali postlar ko‘rib chiqiladi hamda 500 dan 3 000 gacha bo‘lgan tasodifiy trafik oshiruvchi qo‘shimcha olishi mumkin. Postingiz tanlansa, feed kotibingizdan bildirishnoma olasiz.
- Binance Square Official’da maqolangizni namoyish qilish imkoniyatiga ega bo‘ling
Postingiz uchun g‘oyalar kerakmi? Mavzu sahifasiga kiring #AIStocksWhatNext yoki Square Guide on How to Post for Better Reach.
Binance Square Official
·342 ta layk
·811.1k marta koʻrilgan
BitcoinBreaksAboveMayHighNears$86K
11,816 marta koʻrilgan
173 muhokama qilmoqda
DogecoinRises15%
35,680 marta koʻrilgan
898 muhokama qilmoqda