
Dizanex
194 Postlar

Dizanex
Shikoyat qilish
Foydalanuvchini bloklash
Crypto Research & Technical Analysis | SMC & ICT | On-Chain Analysis | Market Insights & Trade Setups | DYOR
Ochiq savdo
Yuqori chastotali treyder
1 yil
13 Kuzatilmoqda
650 Kuzatuvchilar
1.1K+ Yoqdi
Postlar
Portfel
Barchasi
Iqtiboslar
Videolar
·
--
O‘suvchi
221
·
--
Pasayuvchi
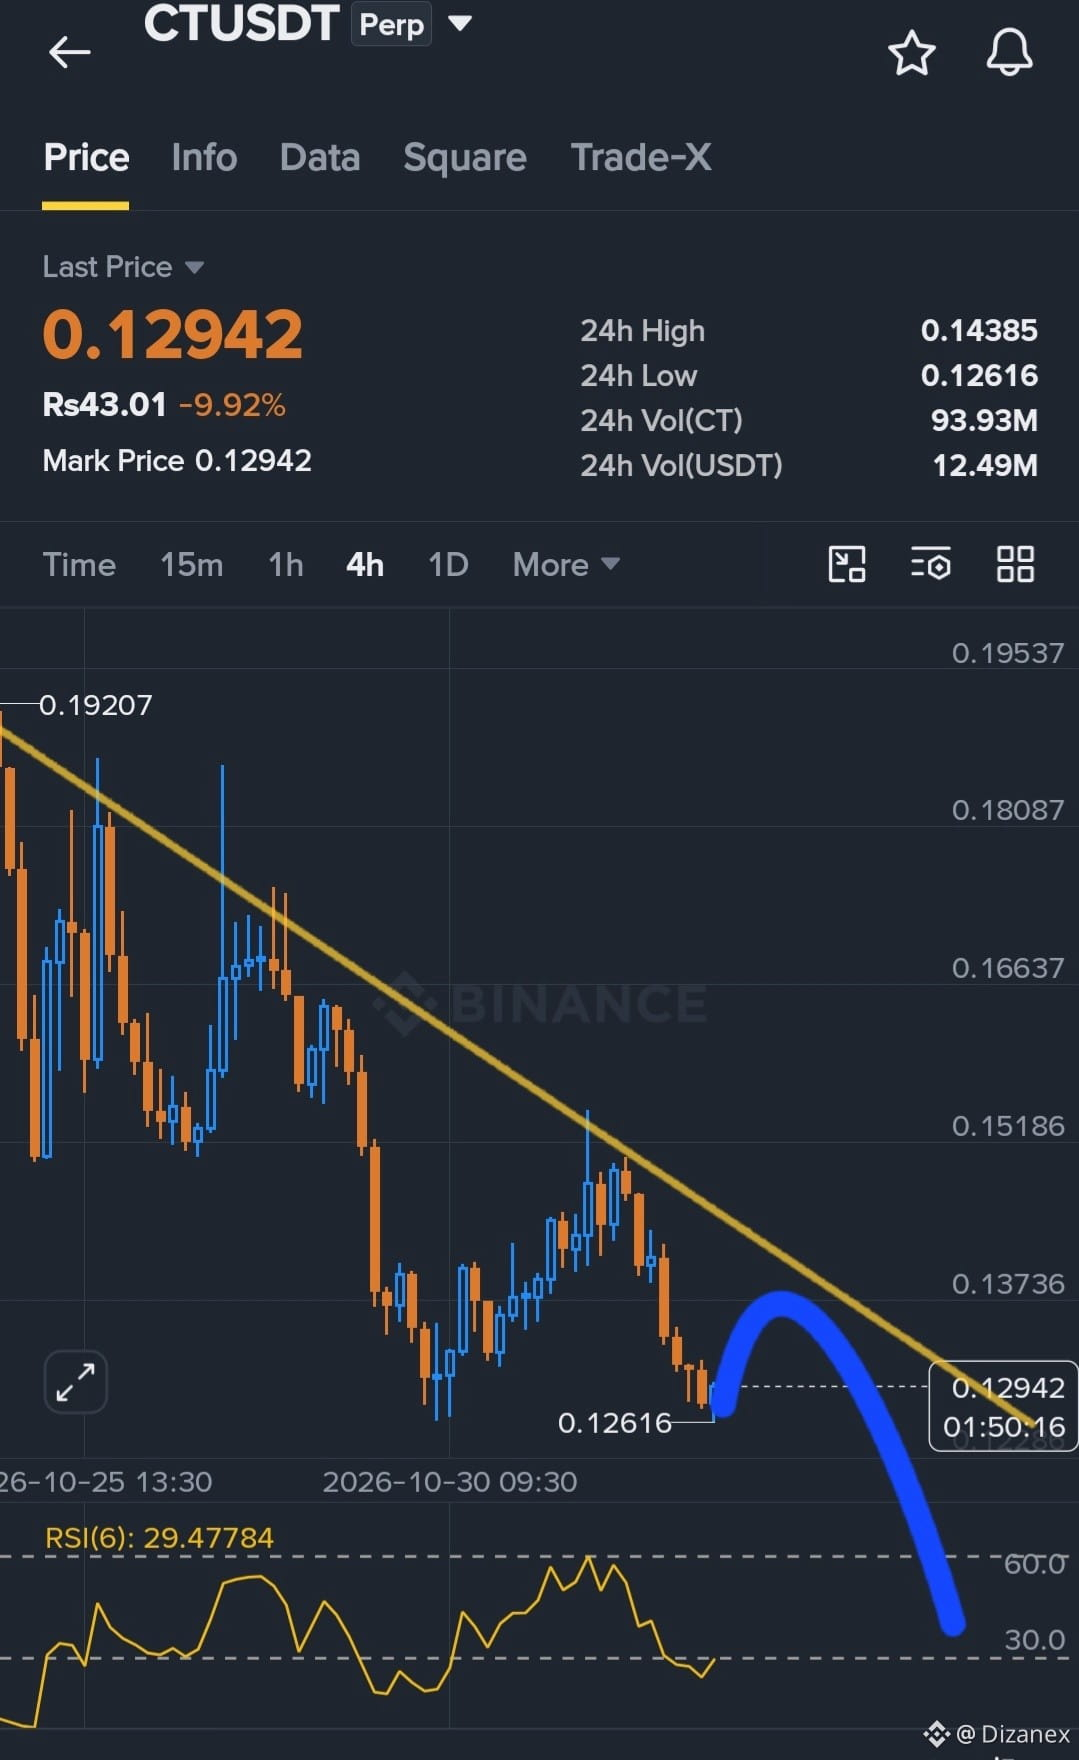
🔴 $CTUSDT — PASAYISHGA YO‘NALTIRILGAN SAVDO REJASI 📉
Vaqt oralig‘i: 4H
Bozor tuzilmasi: Pasayish
Trend: Pasayuvchi cho‘qqilar va pasayuvchi minimumlar
🎯 QISQA POZITSIYAGA KIRISH: $0.13700
🎯 Foydani olish darajalari:
TP1: $0.13200
TP2: $0.12620
TP3: $0.12000
TP4: $0.11500
🛑 Stop-loss: $0.14450
📊 Texnik tahlil
CTUSDT kuchli pasayish bosimi ostida qolmoqda. Aniq pasayuvchi trend chizig‘i va takroriy pasayuvchi cho‘qqilar kuzatilmoqda.
$0.13700 atrofidagi hudud qarshilikni qayta sinash zonasi bo‘lishi mumkin. Bu daraja atrofida pasayish rad etilishi narxning yana tushishini qo‘llab-quvvatlashi mumkin.
RSI(6) taxminan 29 darajasida, bu haddan tashqari sotilgan holatni ko‘rsatadi. Shu sababli, pasayish davom etishidan oldin qisqa muddatli tiklanish ehtimoli bor.
⚠️ Savdoni tasdiqlash: Narx kirish zonasini qayta sinab, pasayish tasdig‘ini ko‘rsatishini kuting. Joriy narx ortidan quvmang.
Bekor bo‘lish sharti: Qarshilik zonasidan yuqorida 4H grafikda barqaror yorib o‘tish pasayish ssenariysini zaiflashtiradi.
Ta’limiy savdo ssenariysi — kafolatlangan signal emas. Xatarlarni ehtiyotkorlik bilan boshqaring.
#CTUSDT #BinanceFutures #CryptoTrading #TechnicalAnalysis
🔴 $CTUSDT — PASAYISHGA YO‘NALTIRILGAN SAVDO REJASI 📉
Vaqt oralig‘i: 4H
Bozor tuzilmasi: Pasayish
Trend: Pasayuvchi cho‘qqilar va pasayuvchi minimumlar
🎯 QISQA POZITSIYAGA KIRISH: $0.13700
🎯 Foydani olish darajalari:
TP1: $0.13200
TP2: $0.12620
TP3: $0.12000
TP4: $0.11500
🛑 Stop-loss: $0.14450
📊 Texnik tahlil
CTUSDT kuchli pasayish bosimi ostida qolmoqda. Aniq pasayuvchi trend chizig‘i va takroriy pasayuvchi cho‘qqilar kuzatilmoqda.
$0.13700 atrofidagi hudud qarshilikni qayta sinash zonasi bo‘lishi mumkin. Bu daraja atrofida pasayish rad etilishi narxning yana tushishini qo‘llab-quvvatlashi mumkin.
RSI(6) taxminan 29 darajasida, bu haddan tashqari sotilgan holatni ko‘rsatadi. Shu sababli, pasayish davom etishidan oldin qisqa muddatli tiklanish ehtimoli bor.
⚠️ Savdoni tasdiqlash: Narx kirish zonasini qayta sinab, pasayish tasdig‘ini ko‘rsatishini kuting. Joriy narx ortidan quvmang.
Bekor bo‘lish sharti: Qarshilik zonasidan yuqorida 4H grafikda barqaror yorib o‘tish pasayish ssenariysini zaiflashtiradi.
Ta’limiy savdo ssenariysi — kafolatlangan signal emas. Xatarlarni ehtiyotkorlik bilan boshqaring.
#CTUSDT #BinanceFutures #CryptoTrading #TechnicalAnalysis
Vaqt oralig‘i: 4H
Bozor tuzilmasi: Pasayish
Trend: Pasayuvchi cho‘qqilar va pasayuvchi minimumlar
🎯 QISQA POZITSIYAGA KIRISH: $0.13700
🎯 Foydani olish darajalari:
TP1: $0.13200
TP2: $0.12620
TP3: $0.12000
TP4: $0.11500
🛑 Stop-loss: $0.14450
📊 Texnik tahlil
CTUSDT kuchli pasayish bosimi ostida qolmoqda. Aniq pasayuvchi trend chizig‘i va takroriy pasayuvchi cho‘qqilar kuzatilmoqda.
$0.13700 atrofidagi hudud qarshilikni qayta sinash zonasi bo‘lishi mumkin. Bu daraja atrofida pasayish rad etilishi narxning yana tushishini qo‘llab-quvvatlashi mumkin.
RSI(6) taxminan 29 darajasida, bu haddan tashqari sotilgan holatni ko‘rsatadi. Shu sababli, pasayish davom etishidan oldin qisqa muddatli tiklanish ehtimoli bor.
⚠️ Savdoni tasdiqlash: Narx kirish zonasini qayta sinab, pasayish tasdig‘ini ko‘rsatishini kuting. Joriy narx ortidan quvmang.
Bekor bo‘lish sharti: Qarshilik zonasidan yuqorida 4H grafikda barqaror yorib o‘tish pasayish ssenariysini zaiflashtiradi.
Ta’limiy savdo ssenariysi — kafolatlangan signal emas. Xatarlarni ehtiyotkorlik bilan boshqaring.
#CTUSDT #BinanceFutures #CryptoTrading #TechnicalAnalysis
830
·
--
Pasayuvchi
398
·
--
Pasayuvchi
Tarjimani ko‘rish
predict
predict
Fyuchers portfelim
0 / 200
Minimum 10USDT
Ommaviy
7 kunlik PNL
(USDT)
-99.71
7 kunlik ROI
-19.30%
AUM
$0.00
Yutish koeffitsiyenti
32.00%
207
·
--
O‘suvchi
159
·
--
Pasayuvchi
Tarjimani ko‘rish
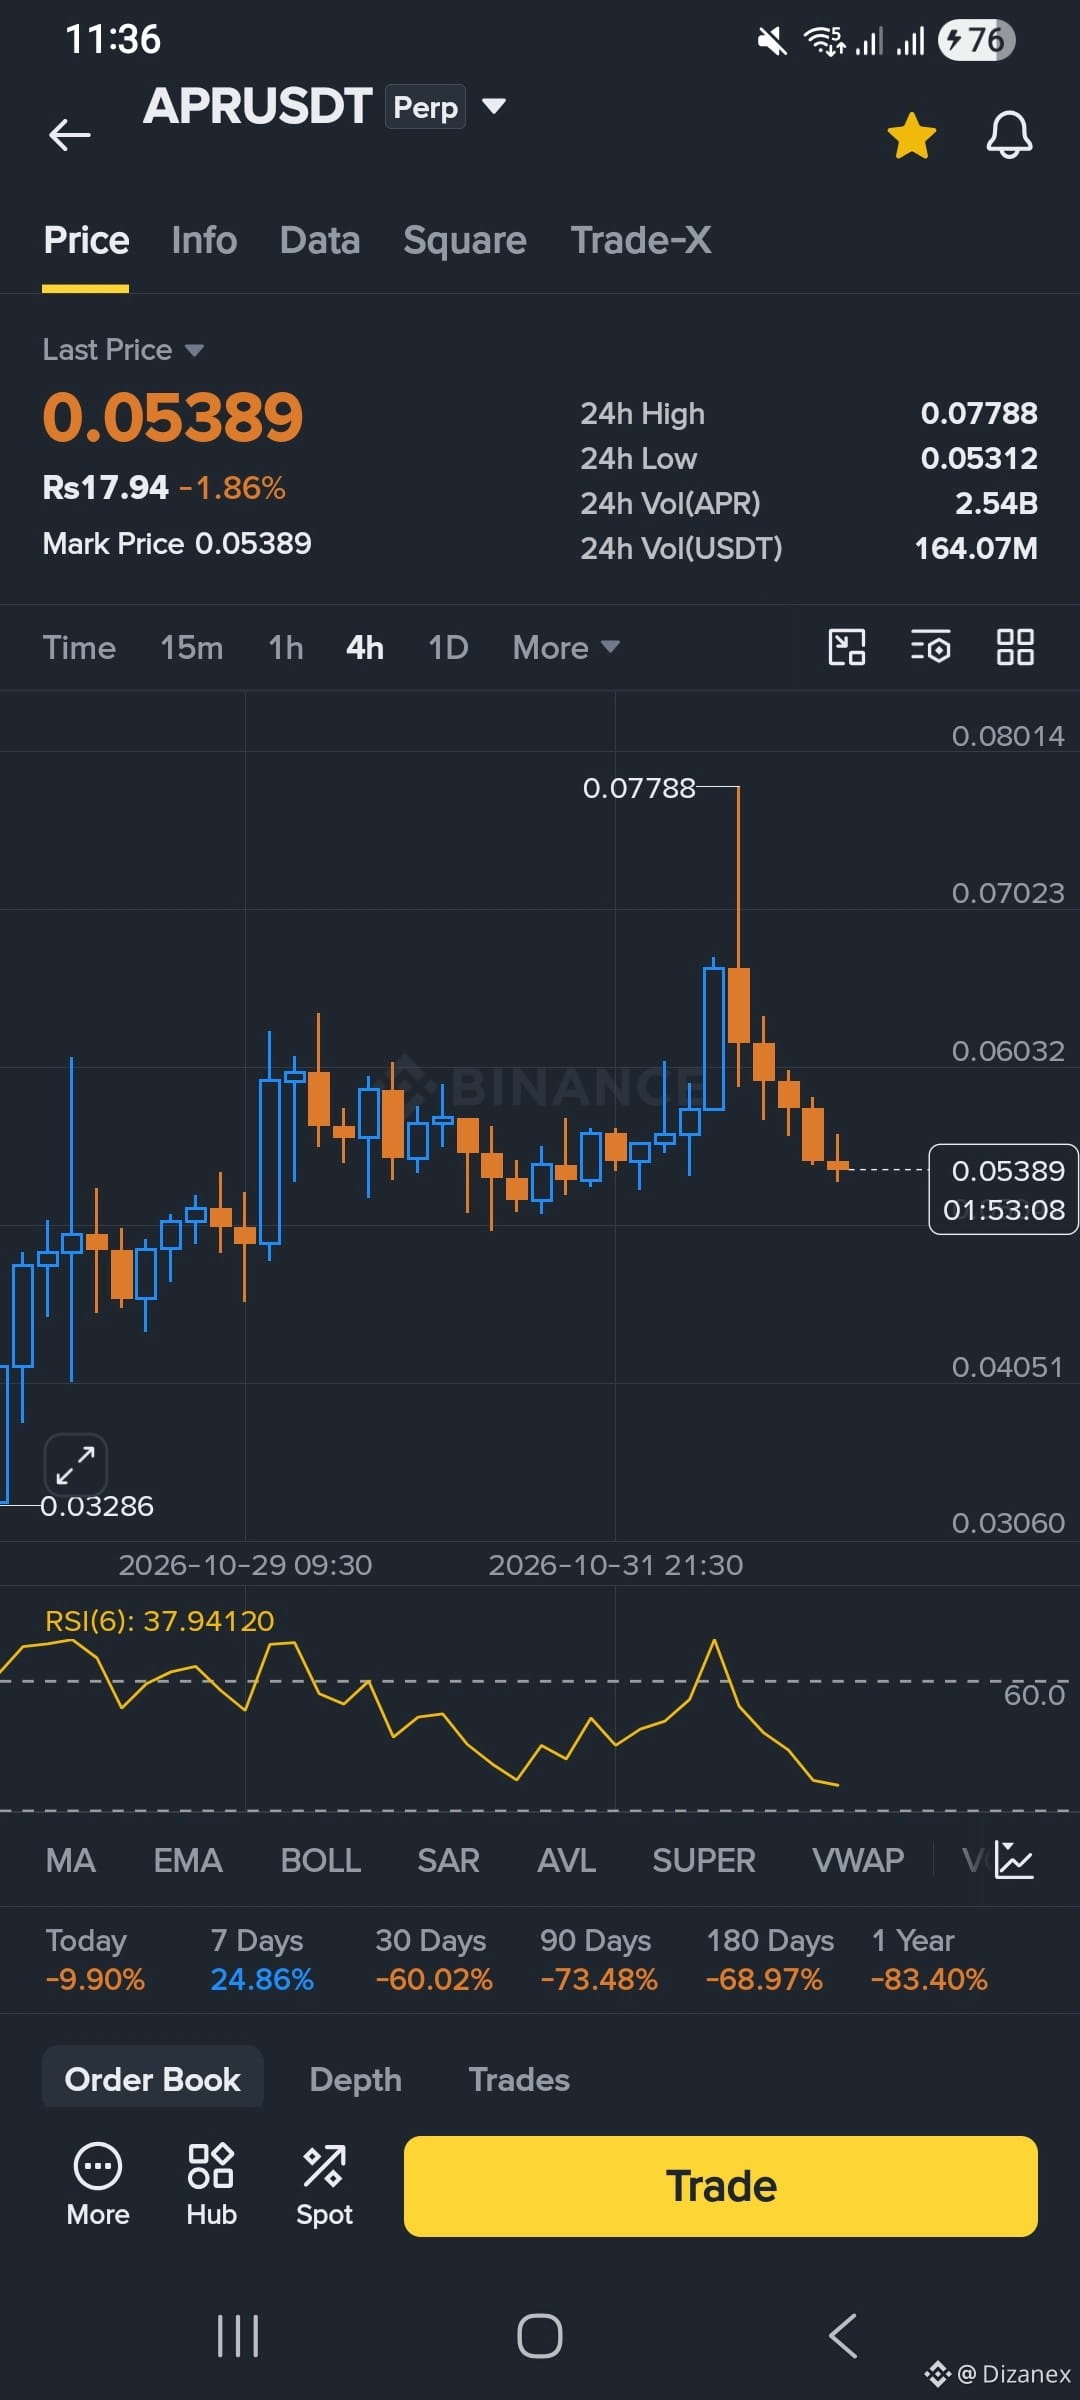
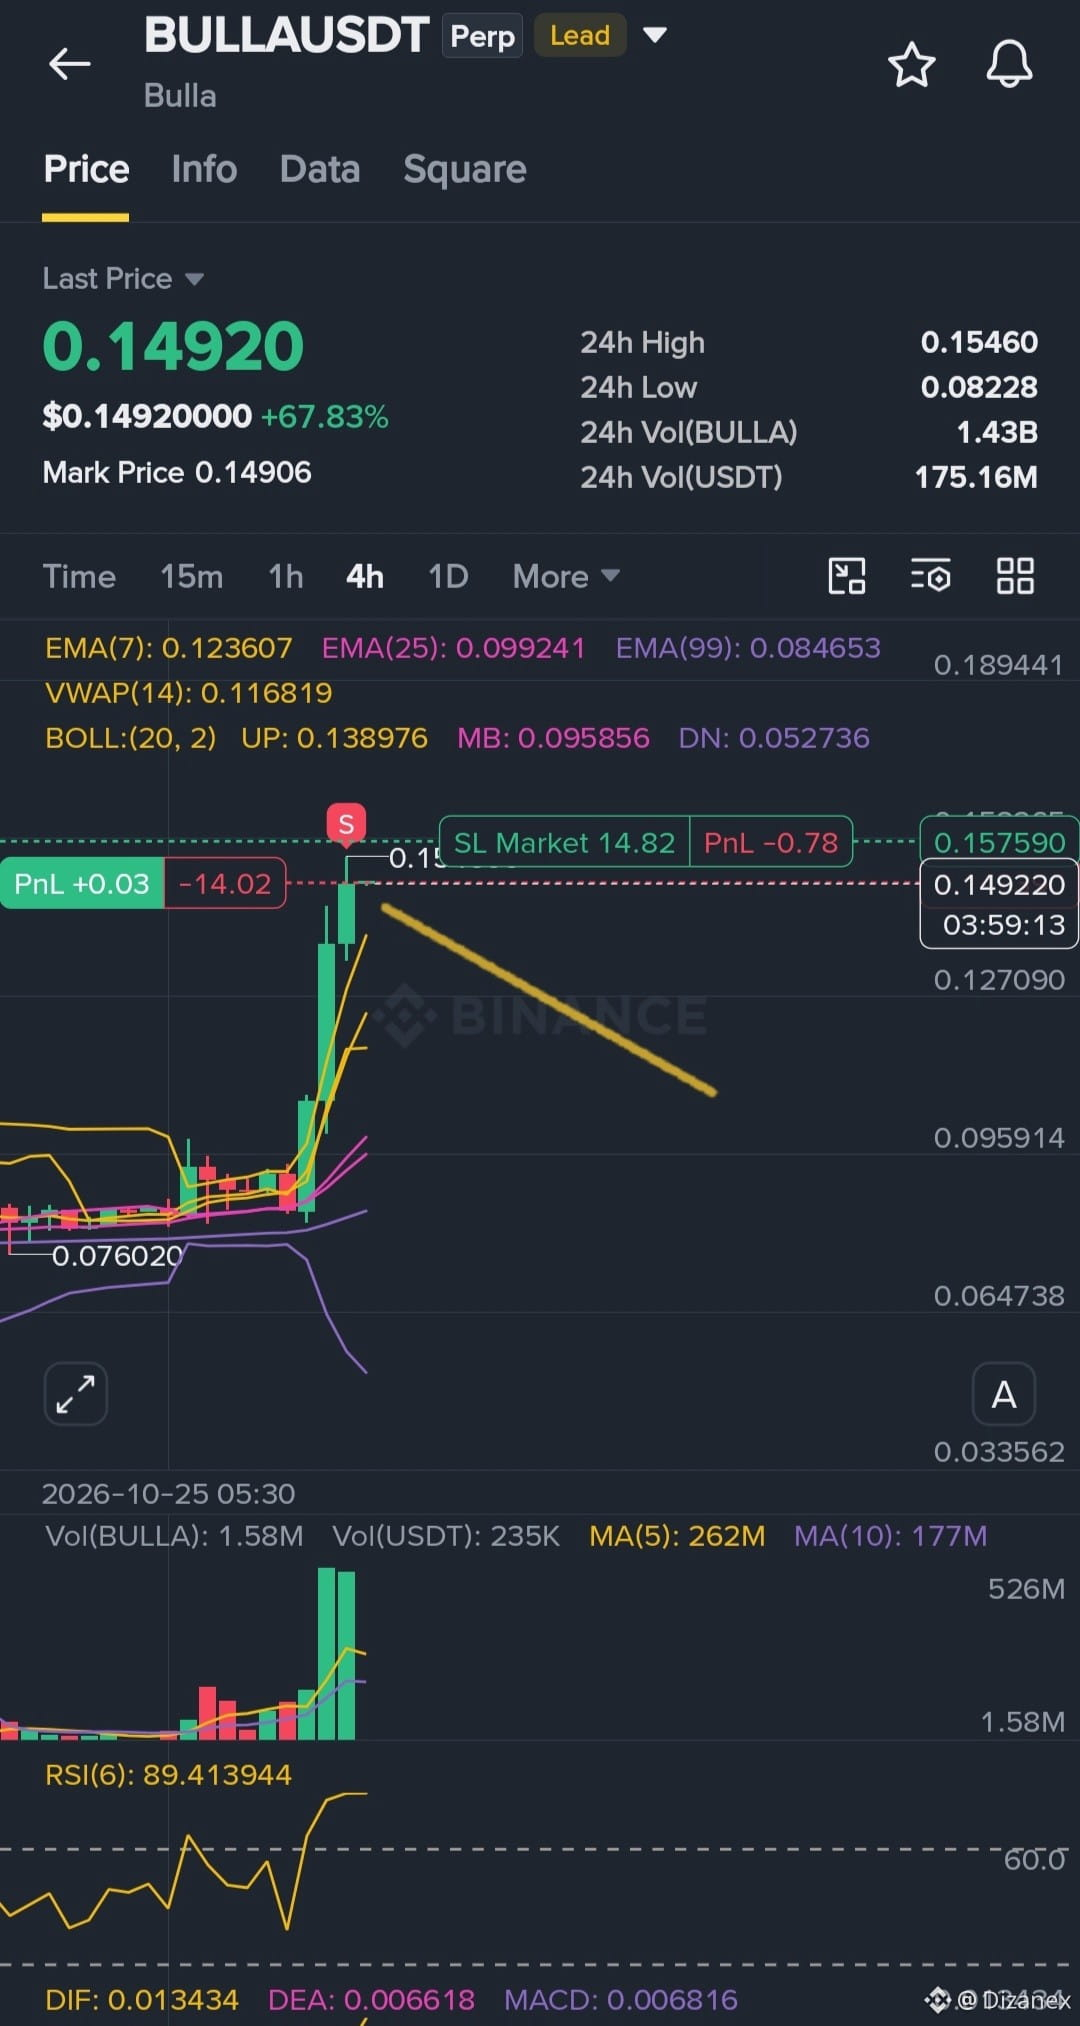
BULLA bearish IDEA DYOR
BULLA bearish IDEA DYOR
Fyuchers portfelim
0 / 200
Minimum 10USDT
Ommaviy
7 kunlik PNL
(USDT)
-99.71
7 kunlik ROI
-19.30%
AUM
$0.00
Yutish koeffitsiyenti
32.00%
506
·
--
Pasayuvchi
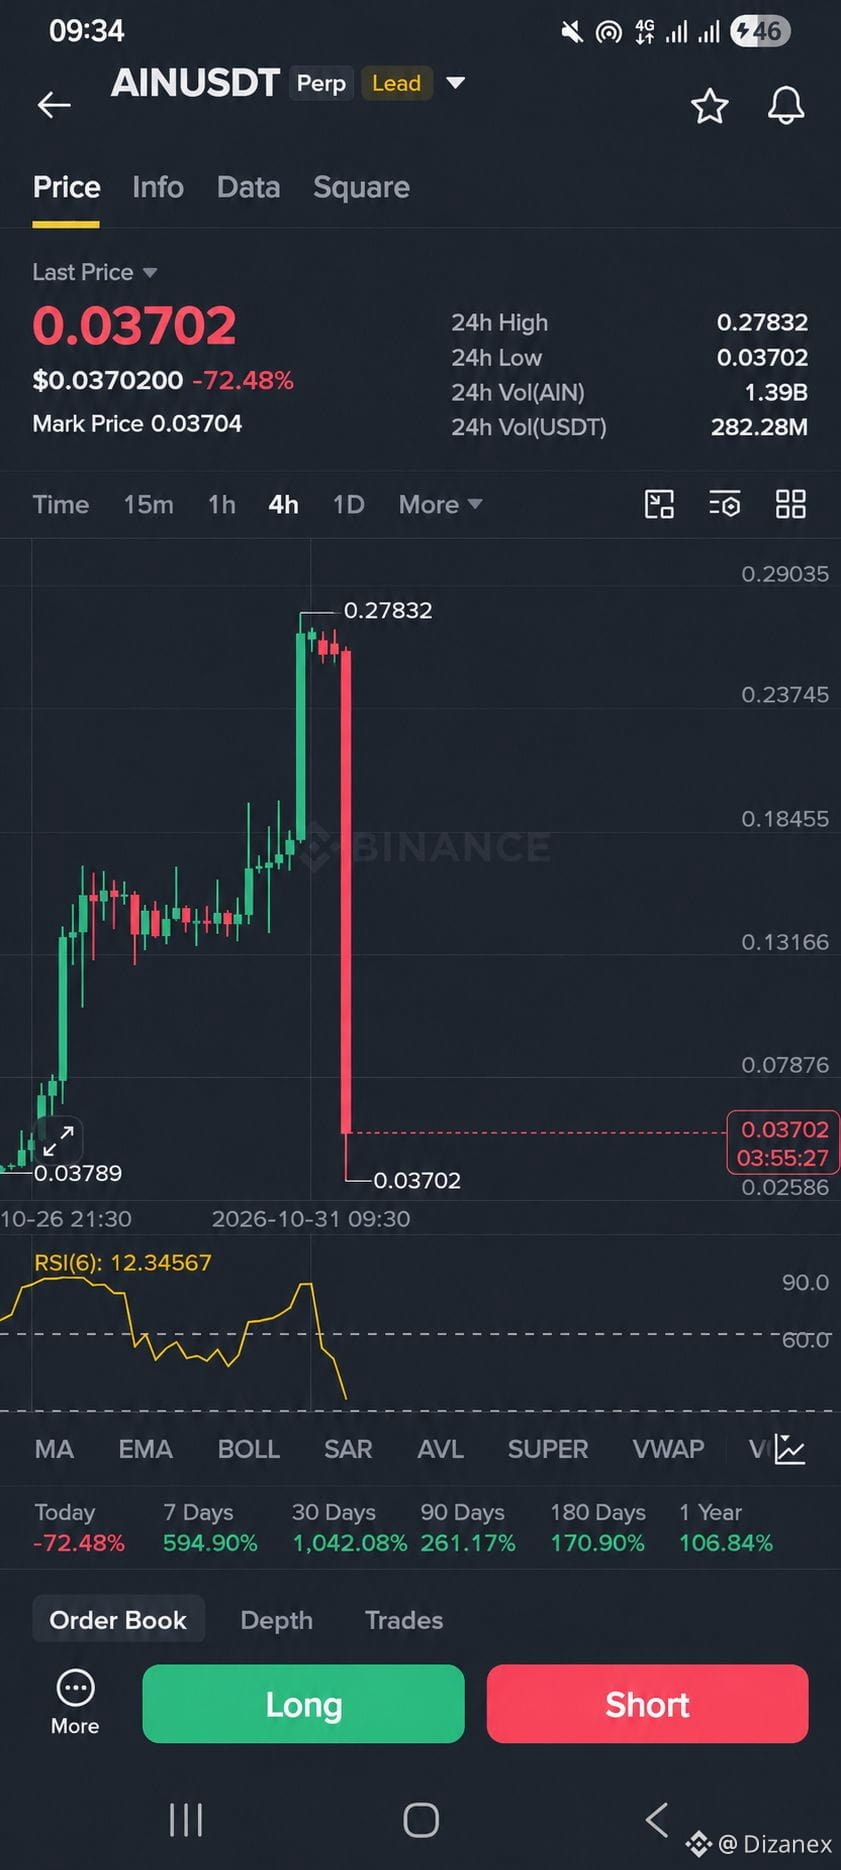
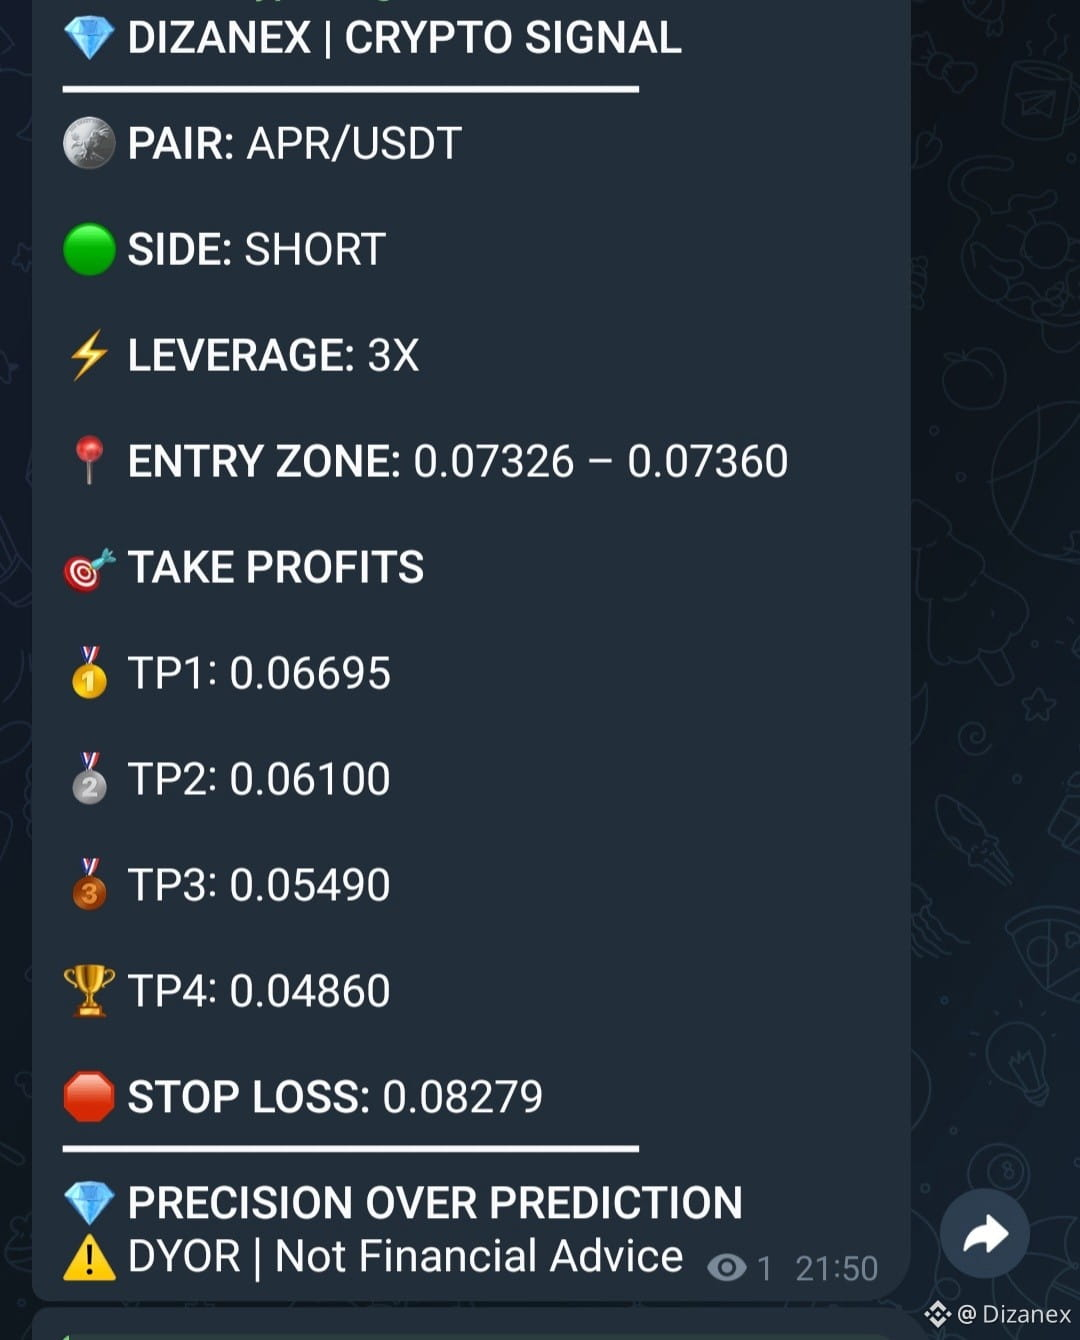
LIMIT ORDER Bearish G'oya DYOR
LIMIT ORDER Bearish G'oya DYOR
Fyuchers portfelim
0 / 200
Minimum 10USDT
Ommaviy
7 kunlik PNL
(USDT)
-99.71
7 kunlik ROI
-19.30%
AUM
$0.00
Yutish koeffitsiyenti
32.00%
1
540
·
--
Pasayuvchi
Tarjimani ko‘rish
🚨 BTCUSDT | BEARISH TRADE SETUP 📉
Bitcoin Technical Analysis | 15M Timeframe
BTC is showing increasing bearish pressure following a rejection near the $81,000 resistance level.
The recent breakdown below $80,550, accompanied by strong selling volume, suggests that sellers currently have the short-term advantage.
📊 TECHNICAL OVERVIEW
🔻 Market Structure: Short-Term Bearish
🔻 Higher Timeframe (4H): Bearish Bias
🔻 RSI (6): 14.8 — Deeply Oversold
🔻 MA(7): $80,764.8
🔻 MA(25): $80,820.8
🔻 MA(99): $80,549.8
The $80,550 level is particularly important. Previously acting as support, it may now become resistance.
🎯 POTENTIAL SHORT SETUP — EDUCATIONAL
🔴 Direction: SHORT
📍 Entry Reference: $80,550
🛑 Stop-Loss Reference: $80,750
Take-Profit Targets:
✅ TP1: $80,350 — RR 1:1
✅ TP2: $80,250 — RR 1:1.5
✅ TP3: $80,150 — RR 1:2
📌 TRADE LOGIC
A failed retest of the $80,550 resistance zone could support further bearish continuation.
However, a sustained recovery above $80,750 would invalidate this bearish setup.
⚠️ IMPORTANT RISK FACTORS
• RSI is deeply oversold, increasing the possibility of a sharp relief bounce.
• The $80,267 swing-low area could attract buying activity.
• A resistance retest is not guaranteed.
• The setup remains hypothetical and unconfirmed.
• Risk/reward calculations exclude fees and slippage.
🧠 MARKET OUTLOOK
Bitcoin remains under short-term bearish pressure, but a breakdown alone does not guarantee continuation.
The key is whether sellers can defend the $80,550 area during a potential retest.
Trade the structure, not the emotion.
⚠️ Disclaimer: This is a hypothetical, chart-based educational setup using a historical price snapshot, not a live trading signal or financial advice. No entry has been confirmed. Cryptocurrency futures trading carries significant risk.
#BTC #Bitcoin #BTCUSDT #CryptoAnalysis #TechnicalAnalysis
🚨 BTCUSDT | BEARISH TRADE SETUP 📉
Bitcoin Technical Analysis | 15M Timeframe
BTC is showing increasing bearish pressure following a rejection near the $81,000 resistance level.
The recent breakdown below $80,550, accompanied by strong selling volume, suggests that sellers currently have the short-term advantage.
📊 TECHNICAL OVERVIEW
🔻 Market Structure: Short-Term Bearish
🔻 Higher Timeframe (4H): Bearish Bias
🔻 RSI (6): 14.8 — Deeply Oversold
🔻 MA(7): $80,764.8
🔻 MA(25): $80,820.8
🔻 MA(99): $80,549.8
The $80,550 level is particularly important. Previously acting as support, it may now become resistance.
🎯 POTENTIAL SHORT SETUP — EDUCATIONAL
🔴 Direction: SHORT
📍 Entry Reference: $80,550
🛑 Stop-Loss Reference: $80,750
Take-Profit Targets:
✅ TP1: $80,350 — RR 1:1
✅ TP2: $80,250 — RR 1:1.5
✅ TP3: $80,150 — RR 1:2
📌 TRADE LOGIC
A failed retest of the $80,550 resistance zone could support further bearish continuation.
However, a sustained recovery above $80,750 would invalidate this bearish setup.
⚠️ IMPORTANT RISK FACTORS
• RSI is deeply oversold, increasing the possibility of a sharp relief bounce.
• The $80,267 swing-low area could attract buying activity.
• A resistance retest is not guaranteed.
• The setup remains hypothetical and unconfirmed.
• Risk/reward calculations exclude fees and slippage.
🧠 MARKET OUTLOOK
Bitcoin remains under short-term bearish pressure, but a breakdown alone does not guarantee continuation.
The key is whether sellers can defend the $80,550 area during a potential retest.
Trade the structure, not the emotion.
⚠️ Disclaimer: This is a hypothetical, chart-based educational setup using a historical price snapshot, not a live trading signal or financial advice. No entry has been confirmed. Cryptocurrency futures trading carries significant risk.
#BTC #Bitcoin #BTCUSDT #CryptoAnalysis #TechnicalAnalysis
Bitcoin Technical Analysis | 15M Timeframe
BTC is showing increasing bearish pressure following a rejection near the $81,000 resistance level.
The recent breakdown below $80,550, accompanied by strong selling volume, suggests that sellers currently have the short-term advantage.
📊 TECHNICAL OVERVIEW
🔻 Market Structure: Short-Term Bearish
🔻 Higher Timeframe (4H): Bearish Bias
🔻 RSI (6): 14.8 — Deeply Oversold
🔻 MA(7): $80,764.8
🔻 MA(25): $80,820.8
🔻 MA(99): $80,549.8
The $80,550 level is particularly important. Previously acting as support, it may now become resistance.
🎯 POTENTIAL SHORT SETUP — EDUCATIONAL
🔴 Direction: SHORT
📍 Entry Reference: $80,550
🛑 Stop-Loss Reference: $80,750
Take-Profit Targets:
✅ TP1: $80,350 — RR 1:1
✅ TP2: $80,250 — RR 1:1.5
✅ TP3: $80,150 — RR 1:2
📌 TRADE LOGIC
A failed retest of the $80,550 resistance zone could support further bearish continuation.
However, a sustained recovery above $80,750 would invalidate this bearish setup.
⚠️ IMPORTANT RISK FACTORS
• RSI is deeply oversold, increasing the possibility of a sharp relief bounce.
• The $80,267 swing-low area could attract buying activity.
• A resistance retest is not guaranteed.
• The setup remains hypothetical and unconfirmed.
• Risk/reward calculations exclude fees and slippage.
🧠 MARKET OUTLOOK
Bitcoin remains under short-term bearish pressure, but a breakdown alone does not guarantee continuation.
The key is whether sellers can defend the $80,550 area during a potential retest.
Trade the structure, not the emotion.
⚠️ Disclaimer: This is a hypothetical, chart-based educational setup using a historical price snapshot, not a live trading signal or financial advice. No entry has been confirmed. Cryptocurrency futures trading carries significant risk.
#BTC #Bitcoin #BTCUSDT #CryptoAnalysis #TechnicalAnalysis
77
·
--
Pasayuvchi
Tarjimani ko‘rish
🚨 BTCUSDT | BEARISH TRADE SETUP 📉
Bitcoin Technical Analysis | 15M Timeframe
BTC is showing increasing bearish pressure following a rejection near the $81,000 resistance level.
The recent breakdown below $80,550, accompanied by strong selling volume, suggests that sellers currently have the short-term advantage.
📊 TECHNICAL OVERVIEW
🔻 Market Structure: Short-Term Bearish
🔻 Higher Timeframe (4H): Bearish Bias
🔻 RSI (6): 14.8 — Deeply Oversold
🔻 MA(7): $80,764.8
🔻 MA(25): $80,820.8
🔻 MA(99): $80,549.8
The $80,550 level is particularly important. Previously acting as support, it may now become resistance.
🎯 POTENTIAL SHORT SETUP — EDUCATIONAL
🔴 Direction: SHORT
📍 Entry Reference: $80,550
🛑 Stop-Loss Reference: $80,750
Take-Profit Targets:
✅ TP1: $80,350 — RR 1:1
✅ TP2: $80,250 — RR 1:1.5
✅ TP3: $80,150 — RR 1:2
📌 TRADE LOGIC
A failed retest of the $80,550 resistance zone could support further bearish continuation.
However, a sustained recovery above $80,750 would invalidate this bearish setup.
⚠️ IMPORTANT RISK FACTORS
• RSI is deeply oversold, increasing the possibility of a sharp relief bounce.
• The $80,267 swing-low area could attract buying activity.
• A resistance retest is not guaranteed.
• The setup remains hypothetical and unconfirmed.
• Risk/reward calculations exclude fees and slippage.
🧠 MARKET OUTLOOK
Bitcoin remains under short-term bearish pressure, but a breakdown alone does not guarantee continuation.
The key is whether sellers can defend the $80,550 area during a potential retest.
Trade the structure, not the emotion.
⚠️ Disclaimer: This is a hypothetical, chart-based educational setup using a historical price snapshot, not a live trading signal or financial advice. No entry has been confirmed. Cryptocurrency futures trading carries significant risk.
#BTC #Bitcoin #BTCUSDT #CryptoAnalysis #TechnicalAnalysis
🚨 BTCUSDT | BEARISH TRADE SETUP 📉
Bitcoin Technical Analysis | 15M Timeframe
BTC is showing increasing bearish pressure following a rejection near the $81,000 resistance level.
The recent breakdown below $80,550, accompanied by strong selling volume, suggests that sellers currently have the short-term advantage.
📊 TECHNICAL OVERVIEW
🔻 Market Structure: Short-Term Bearish
🔻 Higher Timeframe (4H): Bearish Bias
🔻 RSI (6): 14.8 — Deeply Oversold
🔻 MA(7): $80,764.8
🔻 MA(25): $80,820.8
🔻 MA(99): $80,549.8
The $80,550 level is particularly important. Previously acting as support, it may now become resistance.
🎯 POTENTIAL SHORT SETUP — EDUCATIONAL
🔴 Direction: SHORT
📍 Entry Reference: $80,550
🛑 Stop-Loss Reference: $80,750
Take-Profit Targets:
✅ TP1: $80,350 — RR 1:1
✅ TP2: $80,250 — RR 1:1.5
✅ TP3: $80,150 — RR 1:2
📌 TRADE LOGIC
A failed retest of the $80,550 resistance zone could support further bearish continuation.
However, a sustained recovery above $80,750 would invalidate this bearish setup.
⚠️ IMPORTANT RISK FACTORS
• RSI is deeply oversold, increasing the possibility of a sharp relief bounce.
• The $80,267 swing-low area could attract buying activity.
• A resistance retest is not guaranteed.
• The setup remains hypothetical and unconfirmed.
• Risk/reward calculations exclude fees and slippage.
🧠 MARKET OUTLOOK
Bitcoin remains under short-term bearish pressure, but a breakdown alone does not guarantee continuation.
The key is whether sellers can defend the $80,550 area during a potential retest.
Trade the structure, not the emotion.
⚠️ Disclaimer: This is a hypothetical, chart-based educational setup using a historical price snapshot, not a live trading signal or financial advice. No entry has been confirmed. Cryptocurrency futures trading carries significant risk.
#BTC #Bitcoin #BTCUSDT #CryptoAnalysis #TechnicalAnalysis
Bitcoin Technical Analysis | 15M Timeframe
BTC is showing increasing bearish pressure following a rejection near the $81,000 resistance level.
The recent breakdown below $80,550, accompanied by strong selling volume, suggests that sellers currently have the short-term advantage.
📊 TECHNICAL OVERVIEW
🔻 Market Structure: Short-Term Bearish
🔻 Higher Timeframe (4H): Bearish Bias
🔻 RSI (6): 14.8 — Deeply Oversold
🔻 MA(7): $80,764.8
🔻 MA(25): $80,820.8
🔻 MA(99): $80,549.8
The $80,550 level is particularly important. Previously acting as support, it may now become resistance.
🎯 POTENTIAL SHORT SETUP — EDUCATIONAL
🔴 Direction: SHORT
📍 Entry Reference: $80,550
🛑 Stop-Loss Reference: $80,750
Take-Profit Targets:
✅ TP1: $80,350 — RR 1:1
✅ TP2: $80,250 — RR 1:1.5
✅ TP3: $80,150 — RR 1:2
📌 TRADE LOGIC
A failed retest of the $80,550 resistance zone could support further bearish continuation.
However, a sustained recovery above $80,750 would invalidate this bearish setup.
⚠️ IMPORTANT RISK FACTORS
• RSI is deeply oversold, increasing the possibility of a sharp relief bounce.
• The $80,267 swing-low area could attract buying activity.
• A resistance retest is not guaranteed.
• The setup remains hypothetical and unconfirmed.
• Risk/reward calculations exclude fees and slippage.
🧠 MARKET OUTLOOK
Bitcoin remains under short-term bearish pressure, but a breakdown alone does not guarantee continuation.
The key is whether sellers can defend the $80,550 area during a potential retest.
Trade the structure, not the emotion.
⚠️ Disclaimer: This is a hypothetical, chart-based educational setup using a historical price snapshot, not a live trading signal or financial advice. No entry has been confirmed. Cryptocurrency futures trading carries significant risk.
#BTC #Bitcoin #BTCUSDT #CryptoAnalysis #TechnicalAnalysis
122
·
--
Pasayuvchi
Tarjimani ko‘rish
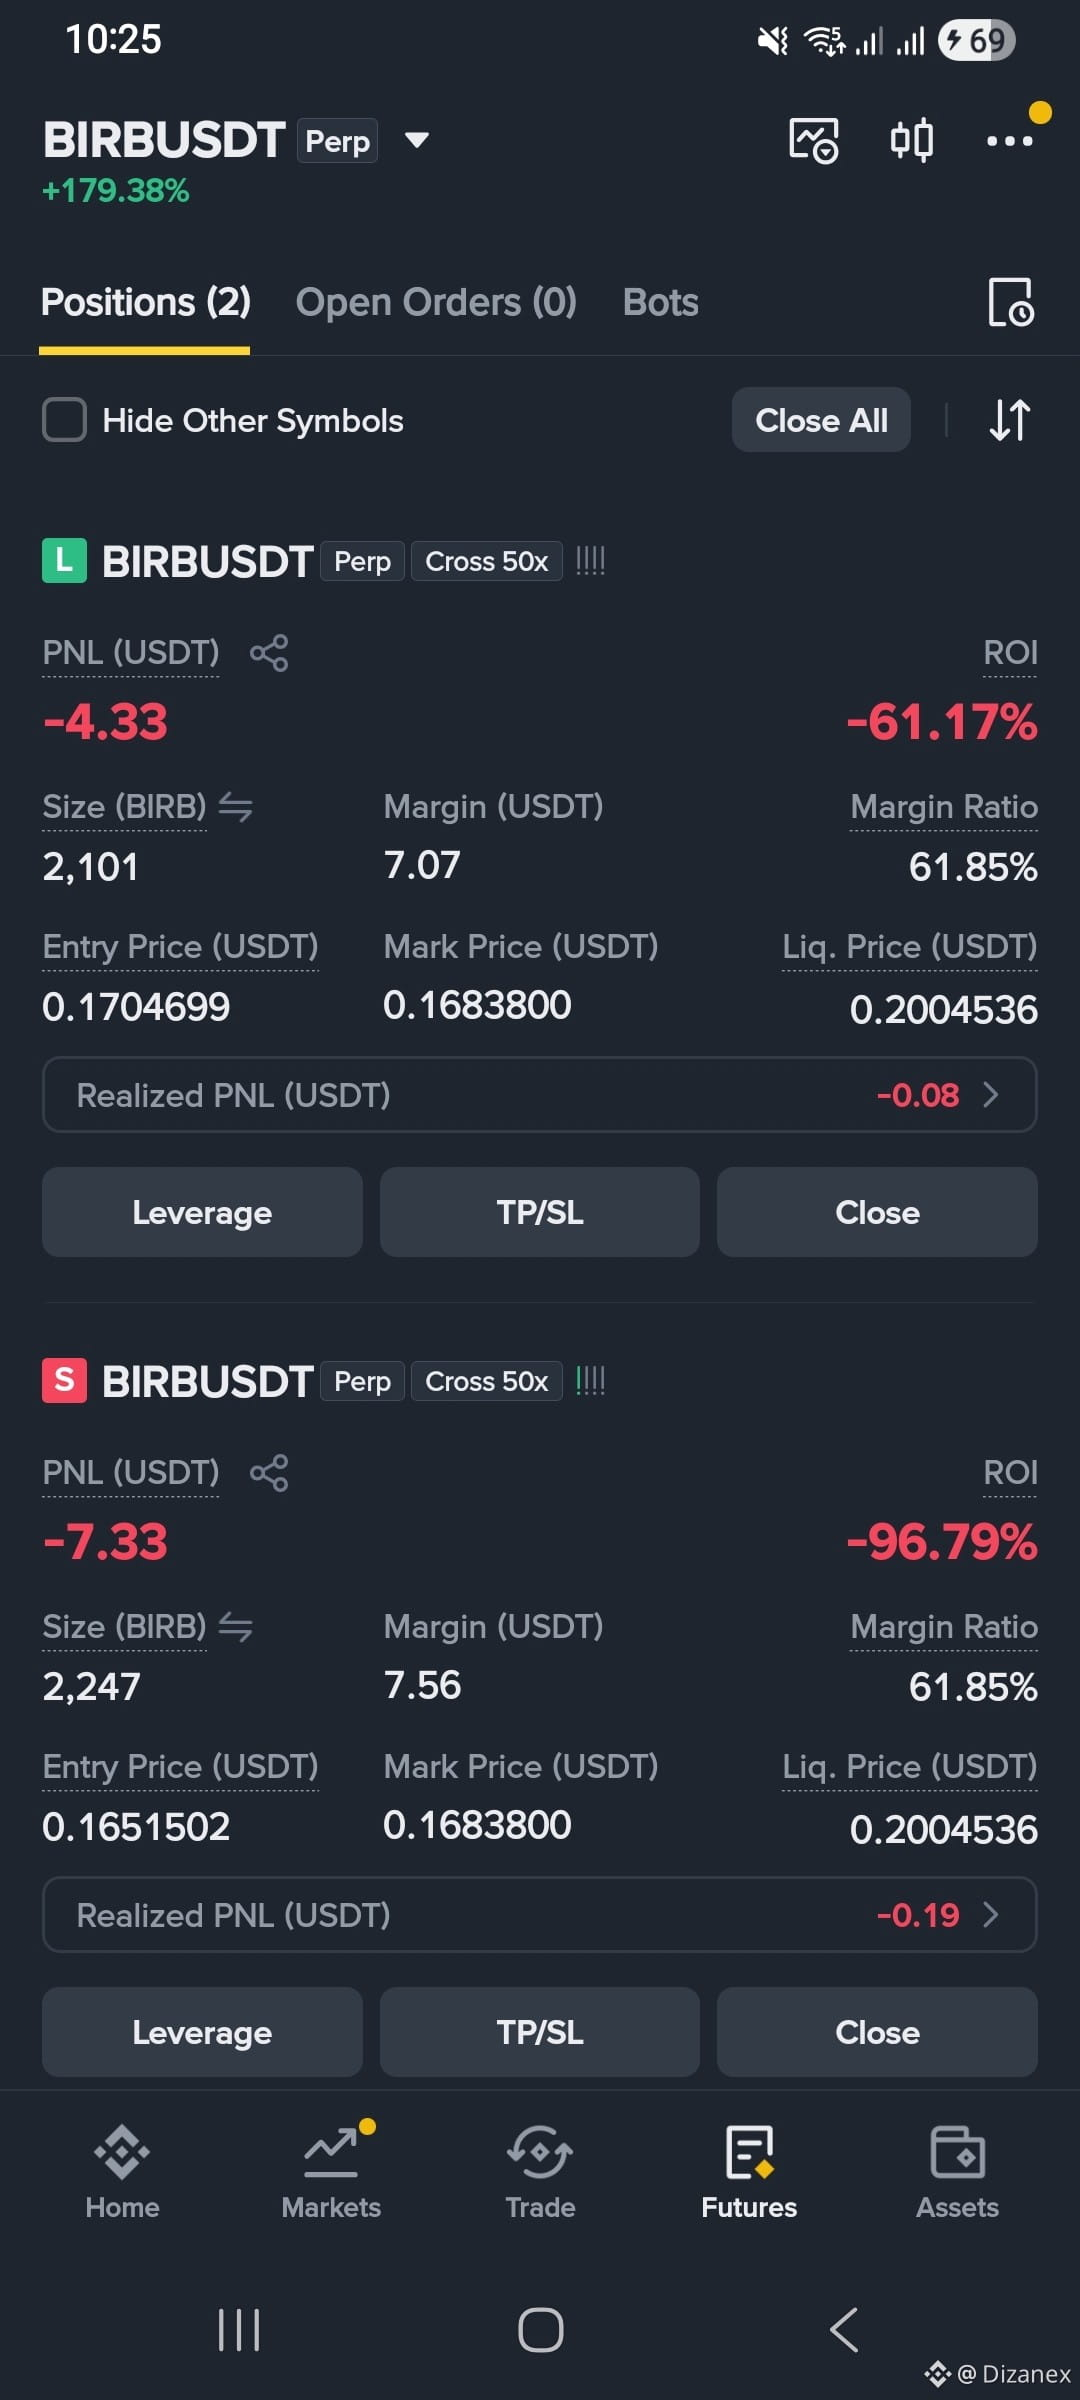
Crypto Market dont want analysis this legal Scam 😂🤌
Crypto Market dont want analysis this legal Scam 😂🤌
297
·
--
Pasayuvchi
363
·
--
O‘suvchi
Tarjimani ko‘rish
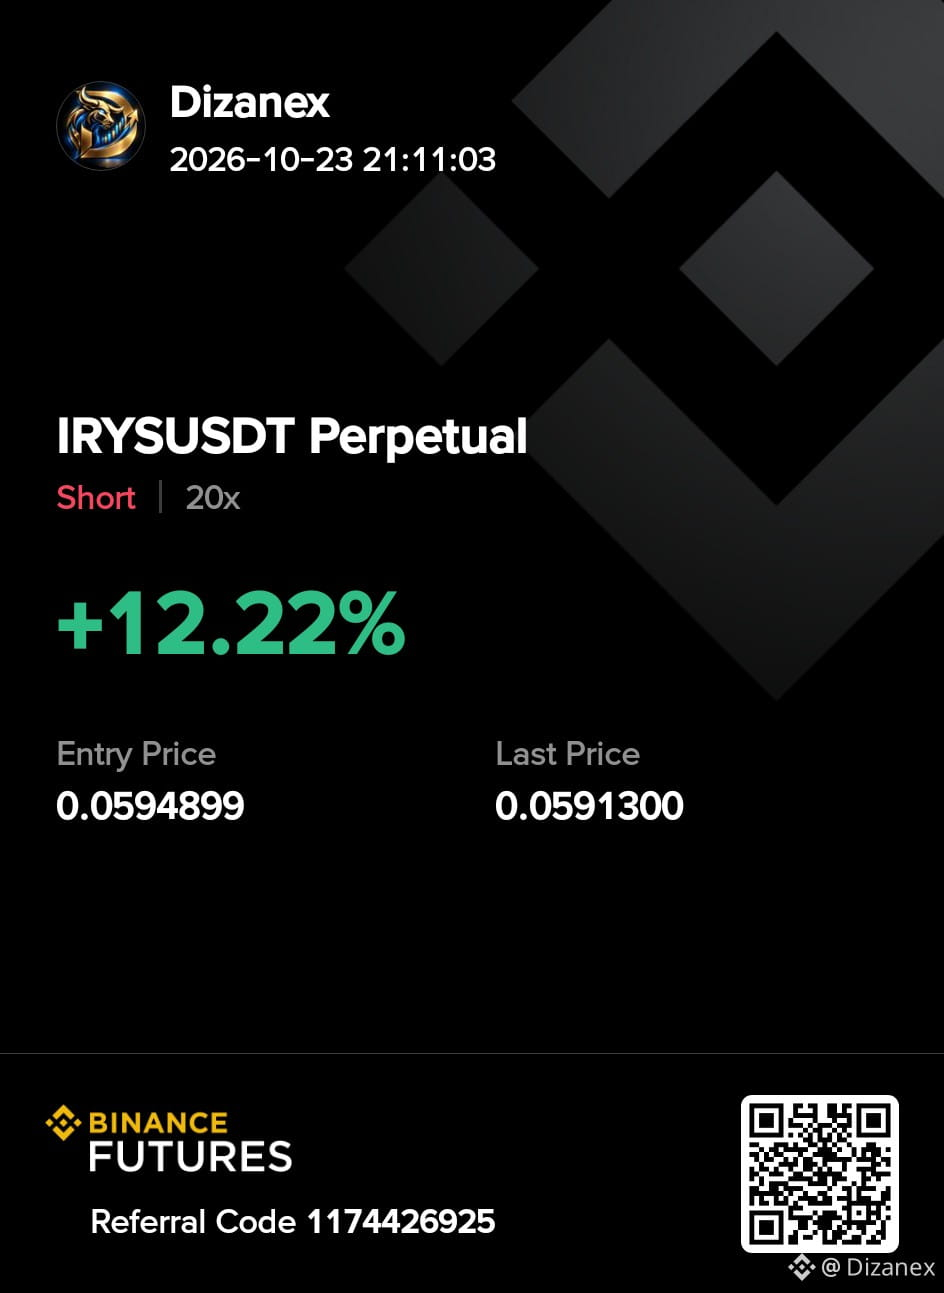
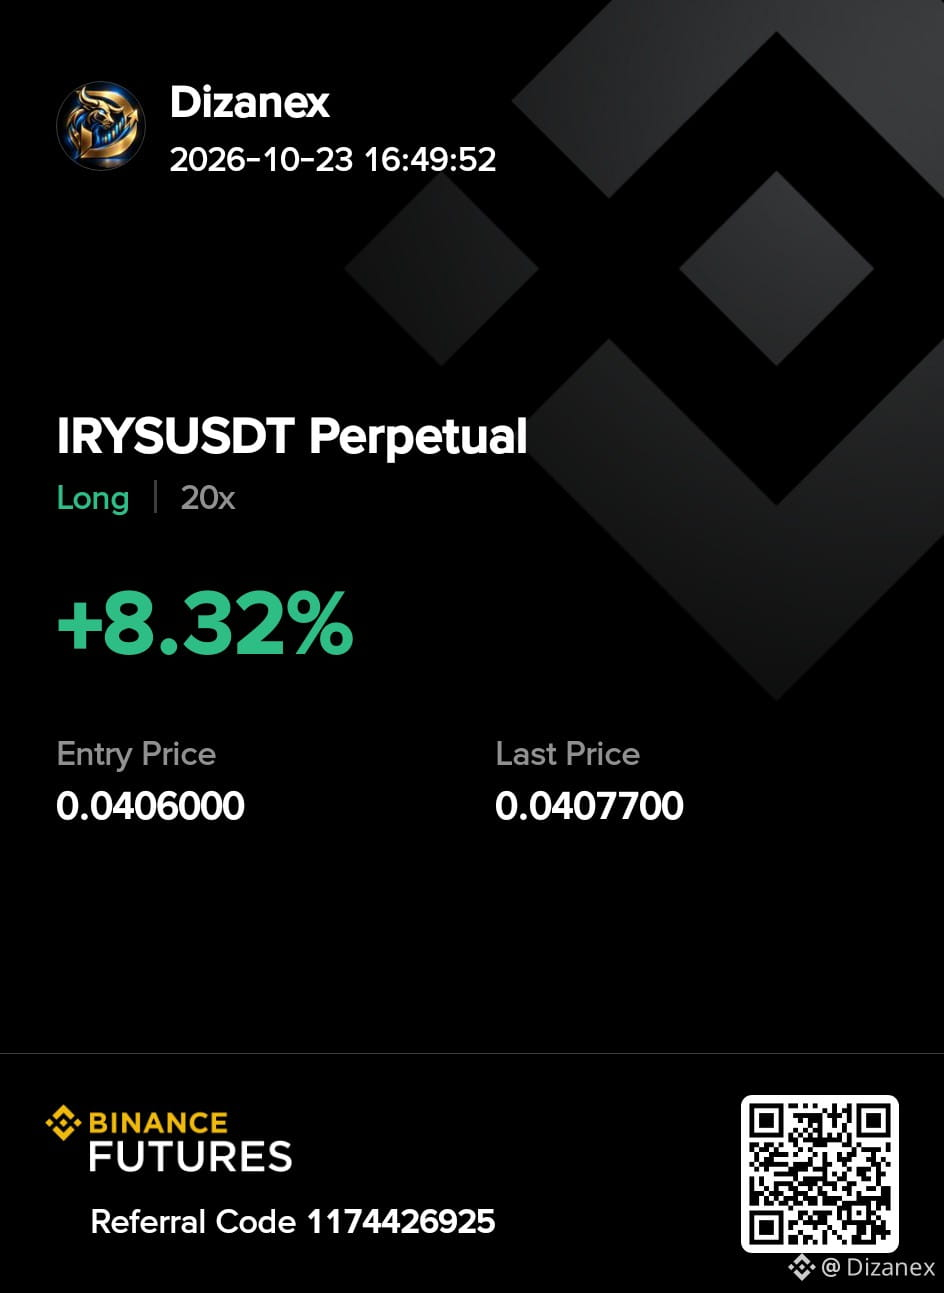
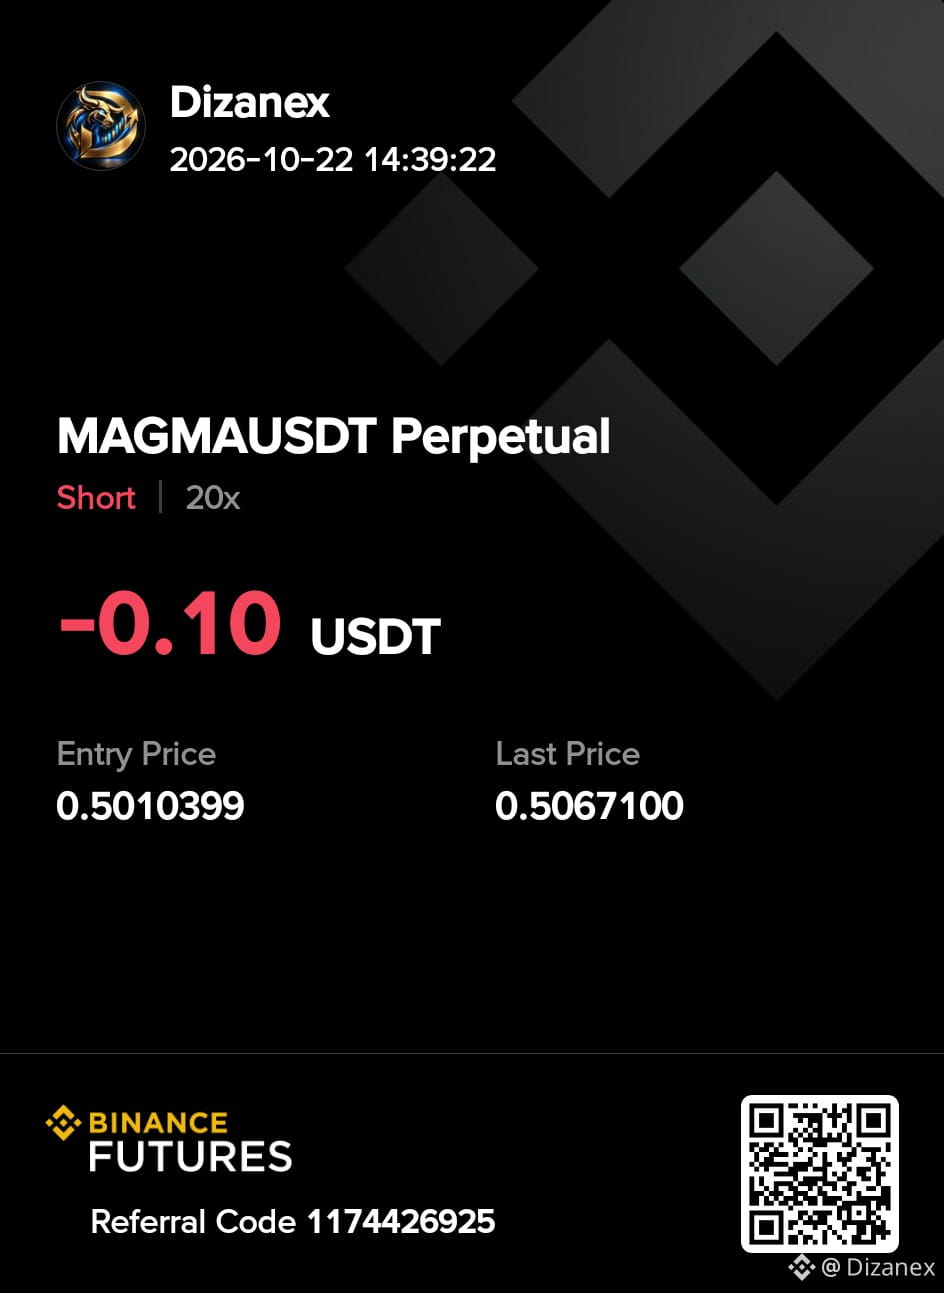
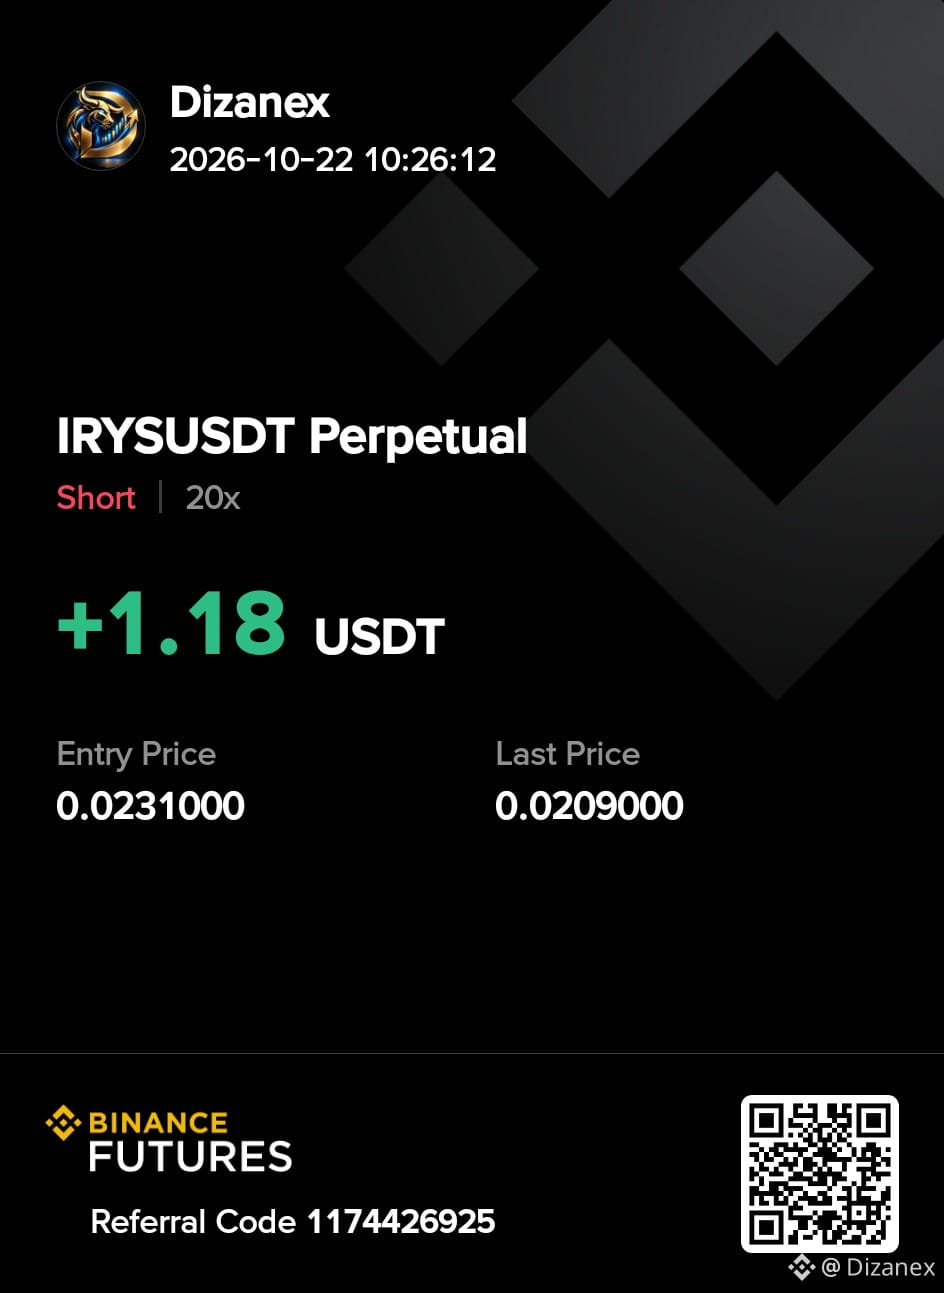
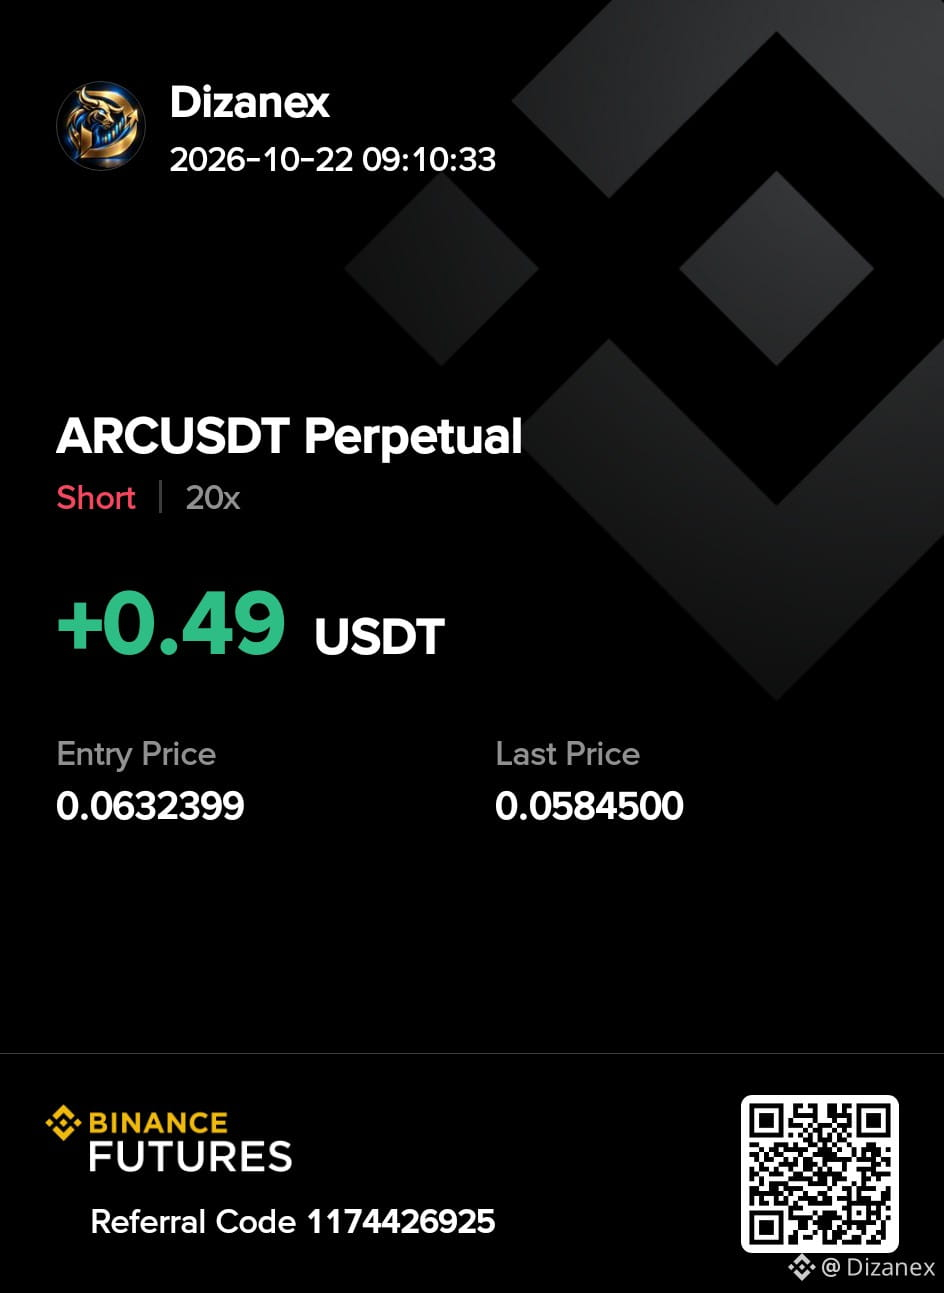
AVAILABLE HIGH ACCURATE SIGNALS COMMENT YES
AVAILABLE HIGH ACCURATE SIGNALS COMMENT YES
1
178
Ko‘proq kontentni ko‘rish uchun tizimga kiring
Binance Square'da global kriptovalyuta foydalanuvchilariga qo‘shiling
⚡️ Kriptovalyuta haqida eng so‘nggi va foydali ma’lumotlarni oling.
💬 Dunyoning eng yirik kriptovalyuta birjasi tomonidan ishonchli deb topilgan.
👍 Tasdiqlangan mualliflardan haqiqiy tahlillarni kashf eting.
Email / telefon raqami
Trenddagi mavzular
BinanceReopensWithdrawalsForMoreAssets
1M marta koʻrilgan
5,307 muhokama qilmoqda
Tiklanish bo‘yicha 9-yangilanish: yana ko‘proq aktivlar bo‘yicha yechib olish qayta ochiladi (2026-11-06)
Binance Announcement
·84 ta layk
·294.3k marta koʻrilgan
AnthropicIPOValuationDoubts
5,010 marta koʻrilgan
162 muhokama qilmoqda
USStocksSlipandCryptoMarketUnderBroadPressure
80,683 marta koʻrilgan
584 muhokama qilmoqda