

CaptainAltcoin
26.9k Postlar

CaptainAltcoin
Shikoyat qilish
Foydalanuvchini bloklash
Ahoy, crypto sailors! Navigate the stormy seas of the digital world with CaptainAltcoin, your trusty compass for crypto guides, reviews, and news.
7 Kuzatilmoqda
101.4K+ Kuzatuvchilar
94.3K+ Yoqdi
1 Nishonlar
Postlar
Maqola
Tarjimani ko‘rish
Bitcoin Price Prediction for Today (September 30)The Bitcoin price is trading at $82,925, down 0.5%, with buyers facing a key test after BTC failed to hold above $85,000.
Institutional demand gives the market a strong counterweight: US spot Bitcoin ETFs attracted about $2.39 billion from September 21-25, including a record $999 million in one session, pushing cumulative ETF inflows since launch to about $57.6 billion.
Strategy also purchased 1,665 BTC for $142.7 million, taking its holdings to 847,666 BTC. Yet Glassnode places a dense long-term-holder supply zone around $84,000-$85,000. So, where can the Bitcoin price go today?
News Pushing Bitcoin Price
September 30 brings several US economic releases that could produce volatility for the Bitcoin price. ADP Non-Farm Employment Change is due at 1:15pm Nigeria time, with a forecast of 73K versus 38K previously.
At 1:30pm, Core PCE is expected at 0.3% versus 0.2% previously, Final GDP at 1.5%, and the Final GDP Price Index at 6.4%. Core PCE matters because it is the Federal Reserve’s preferred inflation measure, so a hotter reading could strengthen rate expectations and weigh on risk assets.
The Bitcoin price also faces a broader yield problem. BTC has fallen for five straight sessions, losing 2.9% across those sessions, as Treasury yields moved higher. That creates a difficult backdrop for risk assets, especially if the economic numbers come in hotter than forecasts. A weaker employment figure or softer inflation reading could produce the opposite reaction by reducing pressure on interest-rate expectations.
Institutional demand remains an important counterweight. Bitcoin ETFs brought in $2.39 billion between September 21 and 25, with daily inflows reaching $999 million on September 21 before declining to $134.5 million on September 25.
Strategy added another 1,665 BTC at an average $85,681, spending $142.7 million. These purchases provide evidence of continued demand, but the BTC price still needs to overcome the $84,000-$85,000 supply zone identified by Glassnode.
What Is Bitcoin Chart Showing?
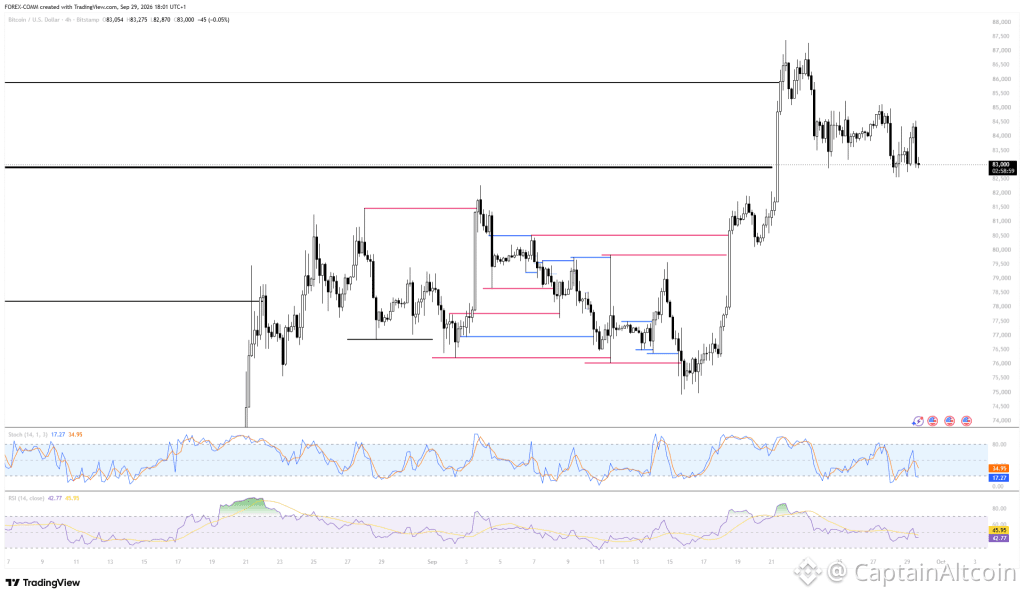
We had a look at the BTCUSD 4-hour chart, and the technical picture is clear around the major levels. The Bitcoin price climbed from roughly $75,500 in mid-September to above $87,000 on September 22 before falling back.
Source: Tradingview.com
The recovery produced a higher high, but the rejection from the $86,000-$87,000 region has left BTC below the major $86,000 resistance marked on the chart.
The Bitcoin price is now around $82,925, almost directly on the chart’s $83,000 support. This level matters because BTC has tested the area several times after the move from $87,000. A sustained break below $83,000 would expose the next visible support around $80,500, followed by $78,500-$77,000.
Momentum indicators also favour caution. The 4-hour RSI is 42.77, below its moving average at 45.95, placing momentum below the neutral 50 area. The Stochastic indicator is at 17.27, below its signal line at 34.95, meaning short-term momentum is weak and the indicator is entering oversold territory. That can allow a rebound, but price confirmation is still needed.
Related Bitcoin News: Here’s Where Bitcoin and Ethereum Prices Might Go This Week
Where Will Bitcoin Price Go Today?
Bullish path:
A reclaim of $83,000, followed by a break above $84,500-$85,000, could open the way toward $86,000-$87,000. The $84,000-$85,000 supply zone remains the key hurdle, so buyers need to clear that area before the higher target becomes technically relevant.
Range path:
If $83,000 holds but $85,000 remains intact, the Bitcoin price could trade between $82,000 and $85,000 through the US data releases. The chart supports this scenario because BTC has spent several sessions consolidating inside that region.
Bearish path:
A decisive break below $83,000 could send BTC toward $80,500, with $78,500-$77,000 becoming the next major support zone. The $77,000 area also lines up with previous price structure on the 4-hour chart.
Frequently Asked Questions
What is the Bitcoin price prediction for September 30
Bitcoin could trade between $82,000 and $85,000 if the market remains range-bound. A break above $85,000 could open the way toward $86,000-$87,000, while losing $83,000 could expose $80,500.
What is driving the Bitcoin price today
US economic data, including ADP employment, Core PCE and GDP, could influence Bitcoin today. Treasury yields and expectations around Federal Reserve policy are also important drivers.
Are Bitcoin ETFs still seeing inflows
Yes. US spot Bitcoin ETFs recorded about $2.39 billion in inflows from September 21-25, with one daily inflow reaching roughly $999 million. Strategy also purchased 1,665 BTC worth $142.7 million during the same period.
Subscribe to our YouTube channel for daily crypto updates, market insights, and expert analysis.
The post Bitcoin Price Prediction for Today (September 30) appeared first on CaptainAltcoin.
Bitcoin Price Prediction for Today (September 30)
The Bitcoin price is trading at $82,925, down 0.5%, with buyers facing a key test after BTC failed to hold above $85,000.
Institutional demand gives the market a strong counterweight: US spot Bitcoin ETFs attracted about $2.39 billion from September 21-25, including a record $999 million in one session, pushing cumulative ETF inflows since launch to about $57.6 billion.
Strategy also purchased 1,665 BTC for $142.7 million, taking its holdings to 847,666 BTC. Yet Glassnode places a dense long-term-holder supply zone around $84,000-$85,000. So, where can the Bitcoin price go today?
News Pushing Bitcoin Price
September 30 brings several US economic releases that could produce volatility for the Bitcoin price. ADP Non-Farm Employment Change is due at 1:15pm Nigeria time, with a forecast of 73K versus 38K previously.
At 1:30pm, Core PCE is expected at 0.3% versus 0.2% previously, Final GDP at 1.5%, and the Final GDP Price Index at 6.4%. Core PCE matters because it is the Federal Reserve’s preferred inflation measure, so a hotter reading could strengthen rate expectations and weigh on risk assets.
The Bitcoin price also faces a broader yield problem. BTC has fallen for five straight sessions, losing 2.9% across those sessions, as Treasury yields moved higher. That creates a difficult backdrop for risk assets, especially if the economic numbers come in hotter than forecasts. A weaker employment figure or softer inflation reading could produce the opposite reaction by reducing pressure on interest-rate expectations.
Institutional demand remains an important counterweight. Bitcoin ETFs brought in $2.39 billion between September 21 and 25, with daily inflows reaching $999 million on September 21 before declining to $134.5 million on September 25.
Strategy added another 1,665 BTC at an average $85,681, spending $142.7 million. These purchases provide evidence of continued demand, but the BTC price still needs to overcome the $84,000-$85,000 supply zone identified by Glassnode.
What Is Bitcoin Chart Showing?
We had a look at the BTCUSD 4-hour chart, and the technical picture is clear around the major levels. The Bitcoin price climbed from roughly $75,500 in mid-September to above $87,000 on September 22 before falling back.
Source: Tradingview.com
The recovery produced a higher high, but the rejection from the $86,000-$87,000 region has left BTC below the major $86,000 resistance marked on the chart.
The Bitcoin price is now around $82,925, almost directly on the chart’s $83,000 support. This level matters because BTC has tested the area several times after the move from $87,000. A sustained break below $83,000 would expose the next visible support around $80,500, followed by $78,500-$77,000.
Momentum indicators also favour caution. The 4-hour RSI is 42.77, below its moving average at 45.95, placing momentum below the neutral 50 area. The Stochastic indicator is at 17.27, below its signal line at 34.95, meaning short-term momentum is weak and the indicator is entering oversold territory. That can allow a rebound, but price confirmation is still needed.
Related Bitcoin News: Here’s Where Bitcoin and Ethereum Prices Might Go This Week
Where Will Bitcoin Price Go Today?
Bullish path:
A reclaim of $83,000, followed by a break above $84,500-$85,000, could open the way toward $86,000-$87,000. The $84,000-$85,000 supply zone remains the key hurdle, so buyers need to clear that area before the higher target becomes technically relevant.
Range path:
If $83,000 holds but $85,000 remains intact, the Bitcoin price could trade between $82,000 and $85,000 through the US data releases. The chart supports this scenario because BTC has spent several sessions consolidating inside that region.
Bearish path:
A decisive break below $83,000 could send BTC toward $80,500, with $78,500-$77,000 becoming the next major support zone. The $77,000 area also lines up with previous price structure on the 4-hour chart.
Frequently Asked Questions
What is the Bitcoin price prediction for September 30
Bitcoin could trade between $82,000 and $85,000 if the market remains range-bound. A break above $85,000 could open the way toward $86,000-$87,000, while losing $83,000 could expose $80,500.
What is driving the Bitcoin price today
US economic data, including ADP employment, Core PCE and GDP, could influence Bitcoin today. Treasury yields and expectations around Federal Reserve policy are also important drivers.
Are Bitcoin ETFs still seeing inflows
Yes. US spot Bitcoin ETFs recorded about $2.39 billion in inflows from September 21-25, with one daily inflow reaching roughly $999 million. Strategy also purchased 1,665 BTC worth $142.7 million during the same period.
Subscribe to our YouTube channel for daily crypto updates, market insights, and expert analysis.
The post Bitcoin Price Prediction for Today (September 30) appeared first on CaptainAltcoin.
Institutional demand gives the market a strong counterweight: US spot Bitcoin ETFs attracted about $2.39 billion from September 21-25, including a record $999 million in one session, pushing cumulative ETF inflows since launch to about $57.6 billion.
Strategy also purchased 1,665 BTC for $142.7 million, taking its holdings to 847,666 BTC. Yet Glassnode places a dense long-term-holder supply zone around $84,000-$85,000. So, where can the Bitcoin price go today?
News Pushing Bitcoin Price
September 30 brings several US economic releases that could produce volatility for the Bitcoin price. ADP Non-Farm Employment Change is due at 1:15pm Nigeria time, with a forecast of 73K versus 38K previously.
At 1:30pm, Core PCE is expected at 0.3% versus 0.2% previously, Final GDP at 1.5%, and the Final GDP Price Index at 6.4%. Core PCE matters because it is the Federal Reserve’s preferred inflation measure, so a hotter reading could strengthen rate expectations and weigh on risk assets.
The Bitcoin price also faces a broader yield problem. BTC has fallen for five straight sessions, losing 2.9% across those sessions, as Treasury yields moved higher. That creates a difficult backdrop for risk assets, especially if the economic numbers come in hotter than forecasts. A weaker employment figure or softer inflation reading could produce the opposite reaction by reducing pressure on interest-rate expectations.
Institutional demand remains an important counterweight. Bitcoin ETFs brought in $2.39 billion between September 21 and 25, with daily inflows reaching $999 million on September 21 before declining to $134.5 million on September 25.
Strategy added another 1,665 BTC at an average $85,681, spending $142.7 million. These purchases provide evidence of continued demand, but the BTC price still needs to overcome the $84,000-$85,000 supply zone identified by Glassnode.
What Is Bitcoin Chart Showing?
We had a look at the BTCUSD 4-hour chart, and the technical picture is clear around the major levels. The Bitcoin price climbed from roughly $75,500 in mid-September to above $87,000 on September 22 before falling back.
Source: Tradingview.com
The recovery produced a higher high, but the rejection from the $86,000-$87,000 region has left BTC below the major $86,000 resistance marked on the chart.
The Bitcoin price is now around $82,925, almost directly on the chart’s $83,000 support. This level matters because BTC has tested the area several times after the move from $87,000. A sustained break below $83,000 would expose the next visible support around $80,500, followed by $78,500-$77,000.
Momentum indicators also favour caution. The 4-hour RSI is 42.77, below its moving average at 45.95, placing momentum below the neutral 50 area. The Stochastic indicator is at 17.27, below its signal line at 34.95, meaning short-term momentum is weak and the indicator is entering oversold territory. That can allow a rebound, but price confirmation is still needed.
Related Bitcoin News: Here’s Where Bitcoin and Ethereum Prices Might Go This Week
Where Will Bitcoin Price Go Today?
Bullish path:
A reclaim of $83,000, followed by a break above $84,500-$85,000, could open the way toward $86,000-$87,000. The $84,000-$85,000 supply zone remains the key hurdle, so buyers need to clear that area before the higher target becomes technically relevant.
Range path:
If $83,000 holds but $85,000 remains intact, the Bitcoin price could trade between $82,000 and $85,000 through the US data releases. The chart supports this scenario because BTC has spent several sessions consolidating inside that region.
Bearish path:
A decisive break below $83,000 could send BTC toward $80,500, with $78,500-$77,000 becoming the next major support zone. The $77,000 area also lines up with previous price structure on the 4-hour chart.
Frequently Asked Questions
What is the Bitcoin price prediction for September 30
Bitcoin could trade between $82,000 and $85,000 if the market remains range-bound. A break above $85,000 could open the way toward $86,000-$87,000, while losing $83,000 could expose $80,500.
What is driving the Bitcoin price today
US economic data, including ADP employment, Core PCE and GDP, could influence Bitcoin today. Treasury yields and expectations around Federal Reserve policy are also important drivers.
Are Bitcoin ETFs still seeing inflows
Yes. US spot Bitcoin ETFs recorded about $2.39 billion in inflows from September 21-25, with one daily inflow reaching roughly $999 million. Strategy also purchased 1,665 BTC worth $142.7 million during the same period.
Subscribe to our YouTube channel for daily crypto updates, market insights, and expert analysis.
The post Bitcoin Price Prediction for Today (September 30) appeared first on CaptainAltcoin.
2
185
Maqola
Tarjimani ko‘rish
We Asked 3 AI Models If XRP Can Reach $10 Before 2028Ripple’s XRP price is up 2.08% to $1.55 in 24 hours, but reaching $10 would require much more than another strong trading session. From around $1.40, XRP would need a 614% gain, taking its market cap to roughly $611 billion based on a circulating supply of 61.1 billion XRP.
That would place XRP above Ethereum in the market-cap rankings based on the figures provided. The path to $10 also depends on several major catalysts, including billions of dollars in ETF inflows, greater institutional use of XRPL, higher On-Demand Liquidity activity and stronger RLUSD usage.
We asked ChatGPT, Claude and Grok to assess those conditions and explain what would need to happen for the XRP price to reach $10 before 2028.
ChatGPT’s XRP Price Outlook Before 2028
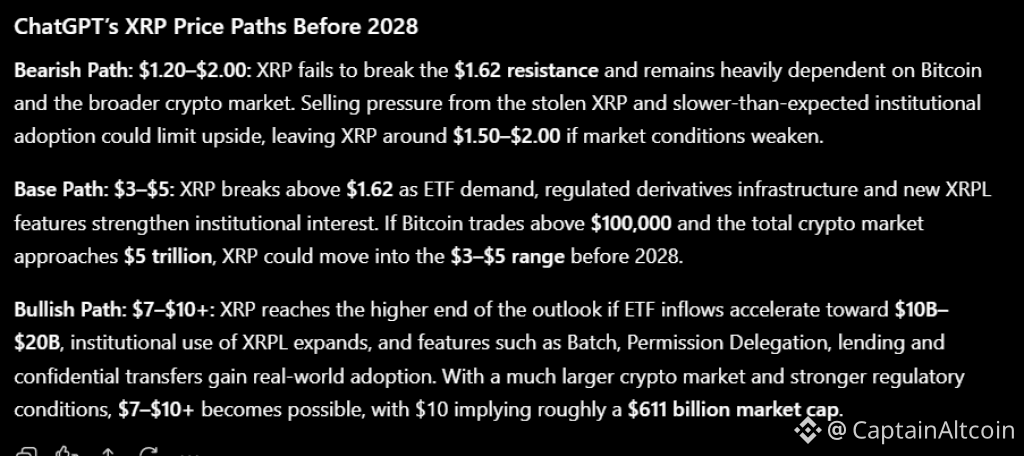
ChatGPT identified three possible paths for the XRP price. In its bearish scenario, XRP remains between $1.20 and $2.00 if it cannot clear the $1.62 resistance and Bitcoin falls below the $84,000 area.
Source: ChatGPT
Slower XRPL adoption, weaker ETF demand and potential selling pressure connected to the stolen XRP could also keep the price near its existing range. In the base scenario, XRP reaches $3–$5 as institutional infrastructure develops, supported by nearly $1.8 billion in spot XRP ETF inflows and Coinbase’s regulated derivatives clearing approval.
The bullish scenario requires several catalysts to work together. ChatGPT points to cumulative ETF inflows potentially reaching $10–$20 billion, greater bank usage of XRPL for settlement and stronger activity from RLUSD and new XRPL features. A Bitcoin price above $100,000 and a total crypto market above $5 trillion would also provide a broader environment for XRP to move toward $7–$10+.
At $10, the XRP price would correspond to $611 billion in market cap using the 61.1 billion circulating supply figure. That means the target requires a much larger pool of capital and demand than Ripple’s XRP has today, making institutional flows, real-world XRPL usage and the broader crypto market three major variables.
Claude AI’s Take on Whether XRP Can Reach $10
Claude takes a more cautious view of the $10 target. It points out that XRP needs roughly 545% upside from $1.55, or about 614% from $1.40, depending on the starting price.
It also notes that the catalyst list contains a major gap: Bitcoin is referenced around $84,000 as an important level, yet the $10 scenario assumes Bitcoin moving well above $100,000 and the total crypto market expanding beyond $5 trillion.
Source: Claude AI
Claude gives weight to the developing institutional infrastructure around XRP. The information provided includes Coinbase Clearing LLC receiving CFTC approval with XRP among the named altcoins, nearly $1.8 billion in spot XRP ETF inflows since November 2025, and XRPL upgrades such as Batch and Permission Delegation. It also points to Confidential Transfers, the Lending Protocol and the quantum-resistance roadmap as developments that could expand XRPL utility through 2027 and 2028.
The main concern is that infrastructure does not automatically equal demand. Claude notes that ETF inflows would need to rise from roughly $1.8 billion toward $10–$20 billion, while real-world ODL and RLUSD activity would need to become much larger. It also identifies the $1.62 resistance, the movement of roughly 103 million stolen XRP, and unresolved U.S. crypto legislation as additional factors that could affect the path toward $10.
Grok AI Predicts a Different Path for XRP
Grok takes a utility-driven view of the XRP price rather than treating $10 as a simple continuation of the current rally. Its central argument is that XRP could require years of supply absorption through regulated products and actual XRPL usage.
At $1.55, the current 2.08% daily gain is also close to the broader market move, with Bitcoin up 1.32% and total crypto market capitalization up 1.16%, meaning the latest move does not yet demonstrate major XRP-specific demand.
Source: Grok AI
Grok places ETF infrastructure, institutional settlement and XRPL development at the center of its outlook. Nearly $1.8 billion in spot XRP ETF inflows provide an existing institutional demand base, but Grok estimates that $10–$20 billion in cumulative inflows would be needed for a much larger supply absorption effect. It also points to Batch, Permission Delegation, Confidential Transfers and the native Lending Protocol as developments that could make XRPL more useful for financial institutions.
The key issue for Grok is execution. It argues that XRP needs measurable ODL volume, RLUSD activity and tokenized-asset settlement before those developments can translate into major price discovery.
Its timeline therefore places 2026 around ETF flows and market beta, 2027 around measurable institutional utility and 2028+ around the possibility of a much larger valuation if crypto market capitalization expands and real settlement activity develops.
Related XRP News: XRP Price at $10,000? The T-Bill Theory That Has the Community Talking
Where All 3 AI Models (Dis)Agree on XRP
All three models agree that $10 is mathematically possible but requires a major expansion in XRP demand. The core calculation is consistent: 61.1 billion circulating XRP multiplied by $10 produces approximately $611 billion in market capitalization, requiring roughly 545% upside from $1.55.
The models also point to the same major catalysts: ETF inflows, institutional XRPL adoption, ODL and RLUSD usage, favorable regulation, Bitcoin above $100,000 and a total crypto market above $5 trillion. None of the three treats XRP’s present $1.55 price as evidence that $10 is imminent.
The main difference is timing and emphasis. ChatGPT lays out bearish, base and bullish price paths; Claude focuses on the gap between infrastructure and proven demand; Grok places greater emphasis on gradual institutional accumulation and measurable ledger activity. Across all three, the $1.62 resistance, ETF flows and actual XRPL usage emerge as important markers to monitor.
How Realistic Is a $10 XRP Price Target?
A $10 XRP price would require the market to value the token at about $611 billion, compared with the valuation implied by its present $1.55 price.
That is a large increase, but the target becomes more plausible if ETF inflows move from the current $1.8 billion toward the proposed $10–$20 billion range, XRPL generates much higher settlement activity and the overall crypto market exceeds $5 trillion.
The biggest question is whether announced infrastructure becomes measurable economic activity. Batch, Permission Delegation, Confidential Transfers and XRPL Lending can expand the network’s capabilities, but the $10 case needs banks, institutions and other users to generate substantial demand for those services. The movement of stolen XRP and unresolved regulatory issues also create risks that could complicate the path.
For the XRP price to reach $10 before 2028, several conditions therefore need to align: a much larger crypto market, sustained institutional inflows, growing XRPL utility and stronger demand for XRP itself.
Based on the three AI analyses and the figures provided, $10 is a high-end bull-case scenario rather than a price level established by today’s market data.
Frequently Asked Questions
Can XRP reach $10 before 2028
XRP could reach $10 if institutional demand, ETF inflows, XRPL adoption and the broader crypto market expand significantly. At $10, XRP would have a market capitalization of about $611 billion based on 61.1 billion circulating tokens.
How much would XRP need to rise to reach $10
From $1.55, XRP would need to gain approximately 545% to reach $10. From the earlier $1.40 reference price, the required gain would be about 614%.
What could drive XRP to $10
The biggest potential catalysts include $10–$20 billion in cumulative ETF inflows, greater institutional use of XRPL, higher ODL and RLUSD activity, new XRPL features, favorable regulation, Bitcoin above $100,000 and a total crypto market capitalization above $5 trillion.
Subscribe to our YouTube channel for daily crypto updates, market insights, and expert analysis.
The post We Asked 3 AI Models If XRP Can Reach $10 Before 2028 appeared first on CaptainAltcoin.
We Asked 3 AI Models If XRP Can Reach $10 Before 2028
Ripple’s XRP price is up 2.08% to $1.55 in 24 hours, but reaching $10 would require much more than another strong trading session. From around $1.40, XRP would need a 614% gain, taking its market cap to roughly $611 billion based on a circulating supply of 61.1 billion XRP.
That would place XRP above Ethereum in the market-cap rankings based on the figures provided. The path to $10 also depends on several major catalysts, including billions of dollars in ETF inflows, greater institutional use of XRPL, higher On-Demand Liquidity activity and stronger RLUSD usage.
We asked ChatGPT, Claude and Grok to assess those conditions and explain what would need to happen for the XRP price to reach $10 before 2028.
ChatGPT’s XRP Price Outlook Before 2028
ChatGPT identified three possible paths for the XRP price. In its bearish scenario, XRP remains between $1.20 and $2.00 if it cannot clear the $1.62 resistance and Bitcoin falls below the $84,000 area.
Source: ChatGPT
Slower XRPL adoption, weaker ETF demand and potential selling pressure connected to the stolen XRP could also keep the price near its existing range. In the base scenario, XRP reaches $3–$5 as institutional infrastructure develops, supported by nearly $1.8 billion in spot XRP ETF inflows and Coinbase’s regulated derivatives clearing approval.
The bullish scenario requires several catalysts to work together. ChatGPT points to cumulative ETF inflows potentially reaching $10–$20 billion, greater bank usage of XRPL for settlement and stronger activity from RLUSD and new XRPL features. A Bitcoin price above $100,000 and a total crypto market above $5 trillion would also provide a broader environment for XRP to move toward $7–$10+.
At $10, the XRP price would correspond to $611 billion in market cap using the 61.1 billion circulating supply figure. That means the target requires a much larger pool of capital and demand than Ripple’s XRP has today, making institutional flows, real-world XRPL usage and the broader crypto market three major variables.
Claude AI’s Take on Whether XRP Can Reach $10
Claude takes a more cautious view of the $10 target. It points out that XRP needs roughly 545% upside from $1.55, or about 614% from $1.40, depending on the starting price.
It also notes that the catalyst list contains a major gap: Bitcoin is referenced around $84,000 as an important level, yet the $10 scenario assumes Bitcoin moving well above $100,000 and the total crypto market expanding beyond $5 trillion.
Source: Claude AI
Claude gives weight to the developing institutional infrastructure around XRP. The information provided includes Coinbase Clearing LLC receiving CFTC approval with XRP among the named altcoins, nearly $1.8 billion in spot XRP ETF inflows since November 2025, and XRPL upgrades such as Batch and Permission Delegation. It also points to Confidential Transfers, the Lending Protocol and the quantum-resistance roadmap as developments that could expand XRPL utility through 2027 and 2028.
The main concern is that infrastructure does not automatically equal demand. Claude notes that ETF inflows would need to rise from roughly $1.8 billion toward $10–$20 billion, while real-world ODL and RLUSD activity would need to become much larger. It also identifies the $1.62 resistance, the movement of roughly 103 million stolen XRP, and unresolved U.S. crypto legislation as additional factors that could affect the path toward $10.
Grok AI Predicts a Different Path for XRP
Grok takes a utility-driven view of the XRP price rather than treating $10 as a simple continuation of the current rally. Its central argument is that XRP could require years of supply absorption through regulated products and actual XRPL usage.
At $1.55, the current 2.08% daily gain is also close to the broader market move, with Bitcoin up 1.32% and total crypto market capitalization up 1.16%, meaning the latest move does not yet demonstrate major XRP-specific demand.
Source: Grok AI
Grok places ETF infrastructure, institutional settlement and XRPL development at the center of its outlook. Nearly $1.8 billion in spot XRP ETF inflows provide an existing institutional demand base, but Grok estimates that $10–$20 billion in cumulative inflows would be needed for a much larger supply absorption effect. It also points to Batch, Permission Delegation, Confidential Transfers and the native Lending Protocol as developments that could make XRPL more useful for financial institutions.
The key issue for Grok is execution. It argues that XRP needs measurable ODL volume, RLUSD activity and tokenized-asset settlement before those developments can translate into major price discovery.
Its timeline therefore places 2026 around ETF flows and market beta, 2027 around measurable institutional utility and 2028+ around the possibility of a much larger valuation if crypto market capitalization expands and real settlement activity develops.
Related XRP News: XRP Price at $10,000? The T-Bill Theory That Has the Community Talking
Where All 3 AI Models (Dis)Agree on XRP
All three models agree that $10 is mathematically possible but requires a major expansion in XRP demand. The core calculation is consistent: 61.1 billion circulating XRP multiplied by $10 produces approximately $611 billion in market capitalization, requiring roughly 545% upside from $1.55.
The models also point to the same major catalysts: ETF inflows, institutional XRPL adoption, ODL and RLUSD usage, favorable regulation, Bitcoin above $100,000 and a total crypto market above $5 trillion. None of the three treats XRP’s present $1.55 price as evidence that $10 is imminent.
The main difference is timing and emphasis. ChatGPT lays out bearish, base and bullish price paths; Claude focuses on the gap between infrastructure and proven demand; Grok places greater emphasis on gradual institutional accumulation and measurable ledger activity. Across all three, the $1.62 resistance, ETF flows and actual XRPL usage emerge as important markers to monitor.
How Realistic Is a $10 XRP Price Target?
A $10 XRP price would require the market to value the token at about $611 billion, compared with the valuation implied by its present $1.55 price.
That is a large increase, but the target becomes more plausible if ETF inflows move from the current $1.8 billion toward the proposed $10–$20 billion range, XRPL generates much higher settlement activity and the overall crypto market exceeds $5 trillion.
The biggest question is whether announced infrastructure becomes measurable economic activity. Batch, Permission Delegation, Confidential Transfers and XRPL Lending can expand the network’s capabilities, but the $10 case needs banks, institutions and other users to generate substantial demand for those services. The movement of stolen XRP and unresolved regulatory issues also create risks that could complicate the path.
For the XRP price to reach $10 before 2028, several conditions therefore need to align: a much larger crypto market, sustained institutional inflows, growing XRPL utility and stronger demand for XRP itself.
Based on the three AI analyses and the figures provided, $10 is a high-end bull-case scenario rather than a price level established by today’s market data.
Frequently Asked Questions
Can XRP reach $10 before 2028
XRP could reach $10 if institutional demand, ETF inflows, XRPL adoption and the broader crypto market expand significantly. At $10, XRP would have a market capitalization of about $611 billion based on 61.1 billion circulating tokens.
How much would XRP need to rise to reach $10
From $1.55, XRP would need to gain approximately 545% to reach $10. From the earlier $1.40 reference price, the required gain would be about 614%.
What could drive XRP to $10
The biggest potential catalysts include $10–$20 billion in cumulative ETF inflows, greater institutional use of XRPL, higher ODL and RLUSD activity, new XRPL features, favorable regulation, Bitcoin above $100,000 and a total crypto market capitalization above $5 trillion.
Subscribe to our YouTube channel for daily crypto updates, market insights, and expert analysis.
The post We Asked 3 AI Models If XRP Can Reach $10 Before 2028 appeared first on CaptainAltcoin.
That would place XRP above Ethereum in the market-cap rankings based on the figures provided. The path to $10 also depends on several major catalysts, including billions of dollars in ETF inflows, greater institutional use of XRPL, higher On-Demand Liquidity activity and stronger RLUSD usage.
We asked ChatGPT, Claude and Grok to assess those conditions and explain what would need to happen for the XRP price to reach $10 before 2028.
ChatGPT’s XRP Price Outlook Before 2028
ChatGPT identified three possible paths for the XRP price. In its bearish scenario, XRP remains between $1.20 and $2.00 if it cannot clear the $1.62 resistance and Bitcoin falls below the $84,000 area.
Source: ChatGPT
Slower XRPL adoption, weaker ETF demand and potential selling pressure connected to the stolen XRP could also keep the price near its existing range. In the base scenario, XRP reaches $3–$5 as institutional infrastructure develops, supported by nearly $1.8 billion in spot XRP ETF inflows and Coinbase’s regulated derivatives clearing approval.
The bullish scenario requires several catalysts to work together. ChatGPT points to cumulative ETF inflows potentially reaching $10–$20 billion, greater bank usage of XRPL for settlement and stronger activity from RLUSD and new XRPL features. A Bitcoin price above $100,000 and a total crypto market above $5 trillion would also provide a broader environment for XRP to move toward $7–$10+.
At $10, the XRP price would correspond to $611 billion in market cap using the 61.1 billion circulating supply figure. That means the target requires a much larger pool of capital and demand than Ripple’s XRP has today, making institutional flows, real-world XRPL usage and the broader crypto market three major variables.
Claude AI’s Take on Whether XRP Can Reach $10
Claude takes a more cautious view of the $10 target. It points out that XRP needs roughly 545% upside from $1.55, or about 614% from $1.40, depending on the starting price.
It also notes that the catalyst list contains a major gap: Bitcoin is referenced around $84,000 as an important level, yet the $10 scenario assumes Bitcoin moving well above $100,000 and the total crypto market expanding beyond $5 trillion.
Source: Claude AI
Claude gives weight to the developing institutional infrastructure around XRP. The information provided includes Coinbase Clearing LLC receiving CFTC approval with XRP among the named altcoins, nearly $1.8 billion in spot XRP ETF inflows since November 2025, and XRPL upgrades such as Batch and Permission Delegation. It also points to Confidential Transfers, the Lending Protocol and the quantum-resistance roadmap as developments that could expand XRPL utility through 2027 and 2028.
The main concern is that infrastructure does not automatically equal demand. Claude notes that ETF inflows would need to rise from roughly $1.8 billion toward $10–$20 billion, while real-world ODL and RLUSD activity would need to become much larger. It also identifies the $1.62 resistance, the movement of roughly 103 million stolen XRP, and unresolved U.S. crypto legislation as additional factors that could affect the path toward $10.
Grok AI Predicts a Different Path for XRP
Grok takes a utility-driven view of the XRP price rather than treating $10 as a simple continuation of the current rally. Its central argument is that XRP could require years of supply absorption through regulated products and actual XRPL usage.
At $1.55, the current 2.08% daily gain is also close to the broader market move, with Bitcoin up 1.32% and total crypto market capitalization up 1.16%, meaning the latest move does not yet demonstrate major XRP-specific demand.
Source: Grok AI
Grok places ETF infrastructure, institutional settlement and XRPL development at the center of its outlook. Nearly $1.8 billion in spot XRP ETF inflows provide an existing institutional demand base, but Grok estimates that $10–$20 billion in cumulative inflows would be needed for a much larger supply absorption effect. It also points to Batch, Permission Delegation, Confidential Transfers and the native Lending Protocol as developments that could make XRPL more useful for financial institutions.
The key issue for Grok is execution. It argues that XRP needs measurable ODL volume, RLUSD activity and tokenized-asset settlement before those developments can translate into major price discovery.
Its timeline therefore places 2026 around ETF flows and market beta, 2027 around measurable institutional utility and 2028+ around the possibility of a much larger valuation if crypto market capitalization expands and real settlement activity develops.
Related XRP News: XRP Price at $10,000? The T-Bill Theory That Has the Community Talking
Where All 3 AI Models (Dis)Agree on XRP
All three models agree that $10 is mathematically possible but requires a major expansion in XRP demand. The core calculation is consistent: 61.1 billion circulating XRP multiplied by $10 produces approximately $611 billion in market capitalization, requiring roughly 545% upside from $1.55.
The models also point to the same major catalysts: ETF inflows, institutional XRPL adoption, ODL and RLUSD usage, favorable regulation, Bitcoin above $100,000 and a total crypto market above $5 trillion. None of the three treats XRP’s present $1.55 price as evidence that $10 is imminent.
The main difference is timing and emphasis. ChatGPT lays out bearish, base and bullish price paths; Claude focuses on the gap between infrastructure and proven demand; Grok places greater emphasis on gradual institutional accumulation and measurable ledger activity. Across all three, the $1.62 resistance, ETF flows and actual XRPL usage emerge as important markers to monitor.
How Realistic Is a $10 XRP Price Target?
A $10 XRP price would require the market to value the token at about $611 billion, compared with the valuation implied by its present $1.55 price.
That is a large increase, but the target becomes more plausible if ETF inflows move from the current $1.8 billion toward the proposed $10–$20 billion range, XRPL generates much higher settlement activity and the overall crypto market exceeds $5 trillion.
The biggest question is whether announced infrastructure becomes measurable economic activity. Batch, Permission Delegation, Confidential Transfers and XRPL Lending can expand the network’s capabilities, but the $10 case needs banks, institutions and other users to generate substantial demand for those services. The movement of stolen XRP and unresolved regulatory issues also create risks that could complicate the path.
For the XRP price to reach $10 before 2028, several conditions therefore need to align: a much larger crypto market, sustained institutional inflows, growing XRPL utility and stronger demand for XRP itself.
Based on the three AI analyses and the figures provided, $10 is a high-end bull-case scenario rather than a price level established by today’s market data.
Frequently Asked Questions
Can XRP reach $10 before 2028
XRP could reach $10 if institutional demand, ETF inflows, XRPL adoption and the broader crypto market expand significantly. At $10, XRP would have a market capitalization of about $611 billion based on 61.1 billion circulating tokens.
How much would XRP need to rise to reach $10
From $1.55, XRP would need to gain approximately 545% to reach $10. From the earlier $1.40 reference price, the required gain would be about 614%.
What could drive XRP to $10
The biggest potential catalysts include $10–$20 billion in cumulative ETF inflows, greater institutional use of XRPL, higher ODL and RLUSD activity, new XRPL features, favorable regulation, Bitcoin above $100,000 and a total crypto market capitalization above $5 trillion.
Subscribe to our YouTube channel for daily crypto updates, market insights, and expert analysis.
The post We Asked 3 AI Models If XRP Can Reach $10 Before 2028 appeared first on CaptainAltcoin.
175
Tarjimani ko‘rish
This Trader Just Made a Massive Midnight (NIGHT) Price PredictionMidnight has moved into the top tier of today’s crypto performers, with the NIGHT price up 19.02% to $0.0313 in 24 hours. That move puts NIGHT well ahead of Bitcoin’s 1.45% gain as traders rotate capital toward altcoins, DeFi and higher-beta assets.
The NIGHT price is also up 30% over the past week, giving the move a broader base. DeFi names such as AAVE, up 15%, and CRV, up 19%, have helped drive the sector higher, with ICP gaining 12% as well.
NIGHT’s 24-hour volume is up 65% to $44.4 million, adding data behind the buying activity. With that setup in place, top trader Alice Crypto has now made a massive prediction for where NIGHT could head next.
NIGHT Price Breaks Resistance as Trader Targets $0.044
Alice Crypto’s NIGHT/USDT daily chart shows why the trader has turned bullish on the NIGHT price. The chart marks a resistance zone around 0.024–0.026, which had contained several previous attempts higher.
$NIGHT UPDATE #NIGHT is getting a goo volume here. We can see 50%+ gain here #NIGHTUSDT #NIGHTBTC #BTC #Bitcoin #NFTs pic.twitter.com/R47PtC1IK4
— Alice Crypto (@Allice_Crypto) September 29, 2026
NIGHT has now broken above that area, with the latest candles reaching around $0.0296 on the chart. Alice Crypto has drawn an upward projection from this breakout, pointing toward the 0.044–0.045 region. The measured move on the chart is labeled 0.01511, or 52.89%, meaning the projection calls for roughly another 53% upside from the marked level.
The chart also shows a clear progression from the August lows near $0.018 toward higher levels through September. After several tests around the 0.024–0.026 zone, buyers pushed NIGHT above the resistance area and continued toward $0.03.
That makes the former resistance zone an important level for the NIGHT price to defend if the move continues. A return below that region would weaken the breakout setup, but holding above it keeps the trader’s projected path toward approximately $0.044 in view.
Read Also: Bitcoin Price Warning: One More Drop Could Change the Entire Setup
Midnight’s Privacy Network Could Give NIGHT More Utility
The technical prediction comes as Midnight’s fundamentals remain tied to privacy-focused blockchain infrastructure. Cardanians shared comments from Charles Hoskinson stating that Midnight can go beyond what Zcash offers, with NIGHT and other assets potentially moving privately on the Midnight ledger.
Charles Hoskinson: "Midnight can do far more than what Zcash does." "You could send NIGHT or other assets on the Midnight ledger like you do Zcash and have the same level of privacy, but then you also have private smart contracts." "It's a massive, massive upgrade." pic.twitter.com/CkbS0aLk9S
— Cardanians (CRDN) (@Cardanians_io) September 24, 2026
Hoskinson also pointed to private smart contracts, describing this as a major expansion of what a privacy network can provide.
That distinction matters for the NIGHT price because the network is designed around more than private transfers alone. The ability to combine privacy with smart contracts could create additional use cases for the Midnight ecosystem if adoption develops.
For traders, the combination of a breakout above $0.024–$0.026, a 30% weekly gain and this utility narrative provides the backdrop for Alice Crypto’s $0.044–$0.045 projection.
Read Also: Can Kaspa (KAS) Reach $1? Here’s What the Math Says
Why Is Midnight Price Pumping Today?
The first driver is broad altcoin and DeFi rotation. The CMC Altcoin Season Index has risen 24.49% over the past week to 61, showing stronger performance across altcoins, with AAVE up 15%, CRV up 19% and ICP up 12%. The DeFi Select Index also gained 5.0% since midnight UTC on September 29, giving NIGHT a favorable sector environment.
The second factor is market beta and volume. The Bitcoin price reclaimed $84,000 as the broader crypto market moved higher despite rising Treasury yields, and NIGHT advanced much faster than BTC. Also, NIGHT’s 24-hour volume climbed 54.95% to $40.4 million, providing confirmation that the price move came with much heavier trading activity.
Coinbase’s fixed-rate USDC loans against BTC collateral use Morpho’s infrastructure, but the available information does not establish a direct role for the Midnight NIGHT token. The relevant point for NIGHT is therefore the broader privacy and DeFi narrative, not a confirmed Coinbase-NIGHT connection.
However, Alice Crypto’s chart places the next major upside target around $0.044–$0.045, based on a projected 52.89% move from the marked level.
The Midnight price has already gained 19.02% in 24 hours and 30% in seven days, supported by a 54.95% increase in volume to $40.4 million. For the bullish chart setup to remain intact, the $0.024–$0.026 breakout zone is the key area to watch.
Frequently Asked Questions
How high could the NIGHT price go
The trader featured in the article projects a potential move toward $0.044–$0.045, based on a measured move of about 52.89%. The $0.024–$0.026 resistance zone remains an important level for the NIGHT price.
Why is the Midnight (NIGHT) price rising today
NIGHT is benefiting from broad altcoin and DeFi strength, with the Altcoin Season Index reaching 61 and NIGHT’s trading volume rising 54.95% to $40.4 million. NIGHT is also up about 30% over the past week.
What is Midnight (NIGHT) used for
Midnight is a privacy-focused blockchain designed to support private asset transfers and private smart contracts. Charles Hoskinson has described its capabilities as extending beyond what Zcash offers, giving the network potential utility beyond simple private transactions.
Subscribe to our YouTube channel for daily crypto updates, market insights, and expert analysis.
The post This Trader Just Made a Massive Midnight (NIGHT) Price Prediction appeared first on CaptainAltcoin.
This Trader Just Made a Massive Midnight (NIGHT) Price Prediction
Midnight has moved into the top tier of today’s crypto performers, with the NIGHT price up 19.02% to $0.0313 in 24 hours. That move puts NIGHT well ahead of Bitcoin’s 1.45% gain as traders rotate capital toward altcoins, DeFi and higher-beta assets.
The NIGHT price is also up 30% over the past week, giving the move a broader base. DeFi names such as AAVE, up 15%, and CRV, up 19%, have helped drive the sector higher, with ICP gaining 12% as well.
NIGHT’s 24-hour volume is up 65% to $44.4 million, adding data behind the buying activity. With that setup in place, top trader Alice Crypto has now made a massive prediction for where NIGHT could head next.
NIGHT Price Breaks Resistance as Trader Targets $0.044
Alice Crypto’s NIGHT/USDT daily chart shows why the trader has turned bullish on the NIGHT price. The chart marks a resistance zone around 0.024–0.026, which had contained several previous attempts higher.
$NIGHT UPDATE #NIGHT is getting a goo volume here. We can see 50%+ gain here #NIGHTUSDT #NIGHTBTC #BTC #Bitcoin #NFTs pic.twitter.com/R47PtC1IK4
— Alice Crypto (@Allice_Crypto) September 29, 2026
NIGHT has now broken above that area, with the latest candles reaching around $0.0296 on the chart. Alice Crypto has drawn an upward projection from this breakout, pointing toward the 0.044–0.045 region. The measured move on the chart is labeled 0.01511, or 52.89%, meaning the projection calls for roughly another 53% upside from the marked level.
The chart also shows a clear progression from the August lows near $0.018 toward higher levels through September. After several tests around the 0.024–0.026 zone, buyers pushed NIGHT above the resistance area and continued toward $0.03.
That makes the former resistance zone an important level for the NIGHT price to defend if the move continues. A return below that region would weaken the breakout setup, but holding above it keeps the trader’s projected path toward approximately $0.044 in view.
Read Also: Bitcoin Price Warning: One More Drop Could Change the Entire Setup
Midnight’s Privacy Network Could Give NIGHT More Utility
The technical prediction comes as Midnight’s fundamentals remain tied to privacy-focused blockchain infrastructure. Cardanians shared comments from Charles Hoskinson stating that Midnight can go beyond what Zcash offers, with NIGHT and other assets potentially moving privately on the Midnight ledger.
Charles Hoskinson: "Midnight can do far more than what Zcash does." "You could send NIGHT or other assets on the Midnight ledger like you do Zcash and have the same level of privacy, but then you also have private smart contracts." "It's a massive, massive upgrade." pic.twitter.com/CkbS0aLk9S
— Cardanians (CRDN) (@Cardanians_io) September 24, 2026
Hoskinson also pointed to private smart contracts, describing this as a major expansion of what a privacy network can provide.
That distinction matters for the NIGHT price because the network is designed around more than private transfers alone. The ability to combine privacy with smart contracts could create additional use cases for the Midnight ecosystem if adoption develops.
For traders, the combination of a breakout above $0.024–$0.026, a 30% weekly gain and this utility narrative provides the backdrop for Alice Crypto’s $0.044–$0.045 projection.
Read Also: Can Kaspa (KAS) Reach $1? Here’s What the Math Says
Why Is Midnight Price Pumping Today?
The first driver is broad altcoin and DeFi rotation. The CMC Altcoin Season Index has risen 24.49% over the past week to 61, showing stronger performance across altcoins, with AAVE up 15%, CRV up 19% and ICP up 12%. The DeFi Select Index also gained 5.0% since midnight UTC on September 29, giving NIGHT a favorable sector environment.
The second factor is market beta and volume. The Bitcoin price reclaimed $84,000 as the broader crypto market moved higher despite rising Treasury yields, and NIGHT advanced much faster than BTC. Also, NIGHT’s 24-hour volume climbed 54.95% to $40.4 million, providing confirmation that the price move came with much heavier trading activity.
Coinbase’s fixed-rate USDC loans against BTC collateral use Morpho’s infrastructure, but the available information does not establish a direct role for the Midnight NIGHT token. The relevant point for NIGHT is therefore the broader privacy and DeFi narrative, not a confirmed Coinbase-NIGHT connection.
However, Alice Crypto’s chart places the next major upside target around $0.044–$0.045, based on a projected 52.89% move from the marked level.
The Midnight price has already gained 19.02% in 24 hours and 30% in seven days, supported by a 54.95% increase in volume to $40.4 million. For the bullish chart setup to remain intact, the $0.024–$0.026 breakout zone is the key area to watch.
Frequently Asked Questions
How high could the NIGHT price go
The trader featured in the article projects a potential move toward $0.044–$0.045, based on a measured move of about 52.89%. The $0.024–$0.026 resistance zone remains an important level for the NIGHT price.
Why is the Midnight (NIGHT) price rising today
NIGHT is benefiting from broad altcoin and DeFi strength, with the Altcoin Season Index reaching 61 and NIGHT’s trading volume rising 54.95% to $40.4 million. NIGHT is also up about 30% over the past week.
What is Midnight (NIGHT) used for
Midnight is a privacy-focused blockchain designed to support private asset transfers and private smart contracts. Charles Hoskinson has described its capabilities as extending beyond what Zcash offers, giving the network potential utility beyond simple private transactions.
Subscribe to our YouTube channel for daily crypto updates, market insights, and expert analysis.
The post This Trader Just Made a Massive Midnight (NIGHT) Price Prediction appeared first on CaptainAltcoin.
The NIGHT price is also up 30% over the past week, giving the move a broader base. DeFi names such as AAVE, up 15%, and CRV, up 19%, have helped drive the sector higher, with ICP gaining 12% as well.
NIGHT’s 24-hour volume is up 65% to $44.4 million, adding data behind the buying activity. With that setup in place, top trader Alice Crypto has now made a massive prediction for where NIGHT could head next.
NIGHT Price Breaks Resistance as Trader Targets $0.044
Alice Crypto’s NIGHT/USDT daily chart shows why the trader has turned bullish on the NIGHT price. The chart marks a resistance zone around 0.024–0.026, which had contained several previous attempts higher.
$NIGHT UPDATE #NIGHT is getting a goo volume here. We can see 50%+ gain here #NIGHTUSDT #NIGHTBTC #BTC #Bitcoin #NFTs pic.twitter.com/R47PtC1IK4
— Alice Crypto (@Allice_Crypto) September 29, 2026
NIGHT has now broken above that area, with the latest candles reaching around $0.0296 on the chart. Alice Crypto has drawn an upward projection from this breakout, pointing toward the 0.044–0.045 region. The measured move on the chart is labeled 0.01511, or 52.89%, meaning the projection calls for roughly another 53% upside from the marked level.
The chart also shows a clear progression from the August lows near $0.018 toward higher levels through September. After several tests around the 0.024–0.026 zone, buyers pushed NIGHT above the resistance area and continued toward $0.03.
That makes the former resistance zone an important level for the NIGHT price to defend if the move continues. A return below that region would weaken the breakout setup, but holding above it keeps the trader’s projected path toward approximately $0.044 in view.
Read Also: Bitcoin Price Warning: One More Drop Could Change the Entire Setup
Midnight’s Privacy Network Could Give NIGHT More Utility
The technical prediction comes as Midnight’s fundamentals remain tied to privacy-focused blockchain infrastructure. Cardanians shared comments from Charles Hoskinson stating that Midnight can go beyond what Zcash offers, with NIGHT and other assets potentially moving privately on the Midnight ledger.
Charles Hoskinson: "Midnight can do far more than what Zcash does." "You could send NIGHT or other assets on the Midnight ledger like you do Zcash and have the same level of privacy, but then you also have private smart contracts." "It's a massive, massive upgrade." pic.twitter.com/CkbS0aLk9S
— Cardanians (CRDN) (@Cardanians_io) September 24, 2026
Hoskinson also pointed to private smart contracts, describing this as a major expansion of what a privacy network can provide.
That distinction matters for the NIGHT price because the network is designed around more than private transfers alone. The ability to combine privacy with smart contracts could create additional use cases for the Midnight ecosystem if adoption develops.
For traders, the combination of a breakout above $0.024–$0.026, a 30% weekly gain and this utility narrative provides the backdrop for Alice Crypto’s $0.044–$0.045 projection.
Read Also: Can Kaspa (KAS) Reach $1? Here’s What the Math Says
Why Is Midnight Price Pumping Today?
The first driver is broad altcoin and DeFi rotation. The CMC Altcoin Season Index has risen 24.49% over the past week to 61, showing stronger performance across altcoins, with AAVE up 15%, CRV up 19% and ICP up 12%. The DeFi Select Index also gained 5.0% since midnight UTC on September 29, giving NIGHT a favorable sector environment.
The second factor is market beta and volume. The Bitcoin price reclaimed $84,000 as the broader crypto market moved higher despite rising Treasury yields, and NIGHT advanced much faster than BTC. Also, NIGHT’s 24-hour volume climbed 54.95% to $40.4 million, providing confirmation that the price move came with much heavier trading activity.
Coinbase’s fixed-rate USDC loans against BTC collateral use Morpho’s infrastructure, but the available information does not establish a direct role for the Midnight NIGHT token. The relevant point for NIGHT is therefore the broader privacy and DeFi narrative, not a confirmed Coinbase-NIGHT connection.
However, Alice Crypto’s chart places the next major upside target around $0.044–$0.045, based on a projected 52.89% move from the marked level.
The Midnight price has already gained 19.02% in 24 hours and 30% in seven days, supported by a 54.95% increase in volume to $40.4 million. For the bullish chart setup to remain intact, the $0.024–$0.026 breakout zone is the key area to watch.
Frequently Asked Questions
How high could the NIGHT price go
The trader featured in the article projects a potential move toward $0.044–$0.045, based on a measured move of about 52.89%. The $0.024–$0.026 resistance zone remains an important level for the NIGHT price.
Why is the Midnight (NIGHT) price rising today
NIGHT is benefiting from broad altcoin and DeFi strength, with the Altcoin Season Index reaching 61 and NIGHT’s trading volume rising 54.95% to $40.4 million. NIGHT is also up about 30% over the past week.
What is Midnight (NIGHT) used for
Midnight is a privacy-focused blockchain designed to support private asset transfers and private smart contracts. Charles Hoskinson has described its capabilities as extending beyond what Zcash offers, giving the network potential utility beyond simple private transactions.
Subscribe to our YouTube channel for daily crypto updates, market insights, and expert analysis.
The post This Trader Just Made a Massive Midnight (NIGHT) Price Prediction appeared first on CaptainAltcoin.
1
1
167

Maqola
Tarjimani ko‘rish
Ethereum Surges 72% Toward $3,000 – Could This Renewed Crypto Momentum Put Apeing on the Radar As...Ethereum remains firmly in focus after rising roughly 72% from around $1,569 in June to nearly $2,708, putting ETH on a strong quarterly trajectory despite a broader pullback across the crypto market. With Ethereum now eyeing the $3,000 level and traders watching whether its momentum can extend further, attention is also turning toward the wider opportunities that can emerge when interest in crypto strengthens. For those looking beyond established assets, the search for the next top 100x crypto is bringing early-stage projects like Apeing into focus.
Apeing is already progressing through its live presale, with the current stage offering $APEING at a set price before the next scheduled increase. As Ethereum continues to command attention, early-stage opportunities can offer a different way to participate in the broader crypto narrative. For buyers tracking the gap between current presale pricing and future stages, the key question is how long the current entry price remains available before the next stage begins.
Apeing: A Top 100x Crypto Presale Built for Participation
Apeing is moving through Stage 6 of its 33-stage presale, with the current price set at $0.0006 and the next stage priced at $0.00065. More than 479 million $APEING tokens have already been sold, while the presale has raised over $110,000 and attracted more than 433 holders.
The current stage has a defined allocation, meaning this price is tied directly to the active stage rather than being a permanent entry point. As the memecoin presale progresses, prices rise, giving early participants a clear reason to pay attention to the current window. Apeing also has a stated $0.01 listing price, putting its presale structure at the center of the top 100x crypto conversation for traders looking beyond established assets.
Why This Top 100x Crypto Presale Is Moving Differently
The Apeing model is built around participation rather than simply holding a token. Its Ethereum ERC-20 foundation gives $APEING a familiar on-chain structure, while its 16.75 billion fixed supply and 33-stage presale create a defined framework for distribution.
One of the standout mechanics is Ape Wars, which turns community activity into an ongoing competitive layer around the token.
How Can You Climb the Ape Wars Leaderboard & Earn More?
Ape Wars is a monthly competition that rewards the community’s biggest buyers. Your total $APEING purchases are tracked on a leaderboard, which resets on the 1st of every month, giving everyone a fresh chance to compete.
Place Reward 1st +10% of monthly purchases + 25% bonus code 2nd +10% of monthly purchases + 15% bonus code 3rd +10% of monthly purchases + 10% bonus code
How it works: Buy more → Climb the leaderboard → Finish in the top 3 → Earn extra rewards.
Ape Wars turns every purchase into a chance to compete, earn more, and claim the crown. That combination makes Apeing particularly relevant to the top 100x crypto narrative. Instead of presenting $APEING as a static presale asset, the project connects its token with staking, competition, referrals, and community activity.
How to Buy Apeing Presale
Connect your wallet: Use MetaMask or Trust Wallet. Smart and passkey wallets are not supported.
Choose payment: Pay with supported crypto or Visa/Mastercard. Card payments still require a connected Ethereum wallet.
Enter your purchase: Add your spending amount or the number of $APEING tokens you want.
Complete the buy: Check your payment details and wallet, then click Buy Now and confirm.
Unlock referrals: Purchases of $25 or more activate your personal referral code.
Wallet-linked tokens: Presale-purchased $APEING remains permanently linked to the wallet used.
Ethereum Price News: ETH Gains 72% as $3,000 Becomes Key Level on Path Toward $4,000
Ethereum has emerged as one of the stronger performers in the crypto market this quarter, with ETH climbing roughly 72% from around $1,569 at the end of June to nearly $2,708 by September 27, 2026. The move has put Ethereum ahead of Bitcoin, which gained approximately 42% over the same period, and has brought renewed attention to the possibility of ETH testing substantially higher levels before the end of the year.
The size of Ethereum’s quarterly advance is particularly important because the cryptocurrency is entering the final quarter of 2026 with momentum already established. From roughly $1,569 to $2,708, ETH has added more than $1,100 in just three months, placing the $3,000 level within relatively close range and putting the larger $4,000 target back into the market conversation.
However, reaching $4,000 would require Ethereum to maintain a considerably stronger pace than it has shown over the most recent month. With roughly three months remaining in 2026, ETH would need average monthly gains of about 14% to move from approximately $2,708 to $4,000. That compares with an approximately 10% gain over the past month, meaning the market would need to sustain or increase its recent momentum for the $4,000 level to come into view.
The $4,000 target also carries significant market-cap implications. Assuming Ethereum’s circulating supply remains broadly similar, an ETH price of $4,000 would place Ethereum’s market capitalization at approximately $488 billion, compared with roughly $331 billion at the current level. That makes Ethereum’s price today and the latest ETH price important reference points for traders assessing how much further the current recovery could extend.
Ethereum Nears a Critical Test at $3,000 After a 72% Quarterly Surge
Before Ethereum can seriously challenge the $4,000 area, the $3,000 level stands out as a major checkpoint. ETH’s move above $2,672 has already marked an important development in the current recovery. From here, the market is increasingly focused on the 2,950-3,000 zone, which represents the next major area Ethereum would need to challenge.
A sustained move through this range could keep the broader $4,000 target in focus. A monthly close above $3,000 by the end of November would provide another important milestone for traders watching Ethereum’s fourth-quarter performance, potentially leaving December as the next period in which the $4,000 level becomes a more immediate point of attention.
The opposite scenario would also matter. If Ethereum loses the $2,672 level after moving above it, the current recovery could lose some of its momentum. That makes the area around $2,672 an important reference point alongside the higher 2,950-3,000 zone.
For Ethereum traders, the coming weeks therefore present a straightforward progression of levels: holding above $2,672, challenging the 2,950-3,000 area, and then determining whether the rally has enough strength to approach $4,000.
What Could Happen Around $4,000?
Even if Ethereum reaches $4,000, the level itself could present another challenge. ETH traded near $4,044 approximately a year ago, meaning the $4,000 area is not an entirely new price zone for the asset. Previous trading activity around this level could create additional selling pressure if holders who bought at higher prices decide to take profits or reduce exposure.
Ethereum also remains below its 2025 record near $4,950. As a result, a move to $4,000 would represent a significant recovery but would still leave ETH below its previous peak.
This distinction is important when looking at the current Ethereum rally. Reaching $3,000 would mark a major step from the September 27 level near $2,708, while reaching $4,000 would require another substantial leg higher. The market therefore has several technical and psychological levels to navigate rather than a single straightforward target.
Conclusion: The Top 100x Crypto Search Comes Back to Apeing
Ethereum’s latest rally has put ETH price momentum back under the microscope, with $3,000 and eventually $4,000 becoming key reference points for the remainder of 2026. The broader Ethereum story remains centered on whether momentum can continue through the final months of the year.
Apeing brings a distinct angle to the top 100x crypto conversation, with its presale already LIVE and Stage 6 offering a limited allocation at $0.0006. As the staged presale progresses, prices move higher, while Ape Wars, referrals, and staking add community-driven participation around $APEING.
Enter Apeing Stage 6 Now Before The Next Stage Brings A Higher Price.
For More Information:
Website: Visit the Official Apeing Website
Telegram: Join the Apeing Telegram Channel
Twitter: Follow Apeing ON X (Formerly Twitter)
FAQs About Top 100x Crypto
What is the top 100x crypto to watch right now?
Apeing is positioning itself around the top 100x crypto narrative through its live 33-stage presale, rising stage prices, community competitions, staking, and referral mechanics.
What is Ethereum price today?
Ethereum is around the $2,708 area based on the September 27, 2026 figure supplied for this article, following a strong quarterly recovery.
What is the current ETH price?
The supplied September 27 figure places ETH near $2,708, with $2,950 to $3,000 identified as the next major area of focus.
What stage is Apeing presale in?
Apeing is currently in Stage 6, with $APEING priced at $0.0006 and the next stage set at $0.00065.
How does Apeing’s referral system work?
Apeing gives buyers an additional 10% in tokens and provides a 10% reward for referrers, with purchases of $25 or more activating a personal referral code.
Summary
Ethereum has delivered a powerful quarterly recovery, putting its path toward $3,000 and potentially $4,000 under renewed attention. At the same time, Apeing is building a separate narrative around an active 33-stage presale, rising stage prices, staking, referrals, and community competition. Stage 6 is currently priced at $0.0006, while the next stage moves to $0.00065. With more than 479 million tokens sold and a stated $0.01 listing price, Apeing remains firmly positioned in the search for the next top 100x crypto.
DISCLAIMER: CAPTAINALTCOIN DOES NOT ENDORSE INVESTING IN ANY PROJECT MENTIONED IN SPONSORED ARTICLES. EXERCISE CAUTION AND DO THOROUGH RESEARCH BEFORE INVESTING YOUR MONEY. CaptainAltcoin takes no responsibility for its accuracy or quality. This content was not written by CaptainAltcoin’s team. We strongly advise readers to do their own thorough research before interacting with any featured companies. The information provided is not financial or legal advice. Neither CaptainAltcoin nor any third party recommends buying or selling any financial products. Investing in crypto assets is high-risk; consider the potential for loss. Any investment decisions made based on this content are at the sole risk of the readCaptainAltcoin is not liable for any damages or losses from using or relying on this content.
The post Ethereum Surges 72% Toward $3,000 – Could This Renewed Crypto Momentum Put Apeing on the Radar as a Top 100x Crypto? appeared first on CaptainAltcoin.
Ethereum Surges 72% Toward $3,000 – Could This Renewed Crypto Momentum Put Apeing on the Radar As...
Ethereum remains firmly in focus after rising roughly 72% from around $1,569 in June to nearly $2,708, putting ETH on a strong quarterly trajectory despite a broader pullback across the crypto market. With Ethereum now eyeing the $3,000 level and traders watching whether its momentum can extend further, attention is also turning toward the wider opportunities that can emerge when interest in crypto strengthens. For those looking beyond established assets, the search for the next top 100x crypto is bringing early-stage projects like Apeing into focus.
Apeing is already progressing through its live presale, with the current stage offering $APEING at a set price before the next scheduled increase. As Ethereum continues to command attention, early-stage opportunities can offer a different way to participate in the broader crypto narrative. For buyers tracking the gap between current presale pricing and future stages, the key question is how long the current entry price remains available before the next stage begins.
Apeing: A Top 100x Crypto Presale Built for Participation
Apeing is moving through Stage 6 of its 33-stage presale, with the current price set at $0.0006 and the next stage priced at $0.00065. More than 479 million $APEING tokens have already been sold, while the presale has raised over $110,000 and attracted more than 433 holders.
The current stage has a defined allocation, meaning this price is tied directly to the active stage rather than being a permanent entry point. As the memecoin presale progresses, prices rise, giving early participants a clear reason to pay attention to the current window. Apeing also has a stated $0.01 listing price, putting its presale structure at the center of the top 100x crypto conversation for traders looking beyond established assets.
Why This Top 100x Crypto Presale Is Moving Differently
The Apeing model is built around participation rather than simply holding a token. Its Ethereum ERC-20 foundation gives $APEING a familiar on-chain structure, while its 16.75 billion fixed supply and 33-stage presale create a defined framework for distribution.
One of the standout mechanics is Ape Wars, which turns community activity into an ongoing competitive layer around the token.
How Can You Climb the Ape Wars Leaderboard & Earn More?
Ape Wars is a monthly competition that rewards the community’s biggest buyers. Your total $APEING purchases are tracked on a leaderboard, which resets on the 1st of every month, giving everyone a fresh chance to compete.
Place Reward 1st +10% of monthly purchases + 25% bonus code 2nd +10% of monthly purchases + 15% bonus code 3rd +10% of monthly purchases + 10% bonus code
How it works: Buy more → Climb the leaderboard → Finish in the top 3 → Earn extra rewards.
Ape Wars turns every purchase into a chance to compete, earn more, and claim the crown. That combination makes Apeing particularly relevant to the top 100x crypto narrative. Instead of presenting $APEING as a static presale asset, the project connects its token with staking, competition, referrals, and community activity.
How to Buy Apeing Presale
Connect your wallet: Use MetaMask or Trust Wallet. Smart and passkey wallets are not supported.
Choose payment: Pay with supported crypto or Visa/Mastercard. Card payments still require a connected Ethereum wallet.
Enter your purchase: Add your spending amount or the number of $APEING tokens you want.
Complete the buy: Check your payment details and wallet, then click Buy Now and confirm.
Unlock referrals: Purchases of $25 or more activate your personal referral code.
Wallet-linked tokens: Presale-purchased $APEING remains permanently linked to the wallet used.
Ethereum Price News: ETH Gains 72% as $3,000 Becomes Key Level on Path Toward $4,000
Ethereum has emerged as one of the stronger performers in the crypto market this quarter, with ETH climbing roughly 72% from around $1,569 at the end of June to nearly $2,708 by September 27, 2026. The move has put Ethereum ahead of Bitcoin, which gained approximately 42% over the same period, and has brought renewed attention to the possibility of ETH testing substantially higher levels before the end of the year.
The size of Ethereum’s quarterly advance is particularly important because the cryptocurrency is entering the final quarter of 2026 with momentum already established. From roughly $1,569 to $2,708, ETH has added more than $1,100 in just three months, placing the $3,000 level within relatively close range and putting the larger $4,000 target back into the market conversation.
However, reaching $4,000 would require Ethereum to maintain a considerably stronger pace than it has shown over the most recent month. With roughly three months remaining in 2026, ETH would need average monthly gains of about 14% to move from approximately $2,708 to $4,000. That compares with an approximately 10% gain over the past month, meaning the market would need to sustain or increase its recent momentum for the $4,000 level to come into view.
The $4,000 target also carries significant market-cap implications. Assuming Ethereum’s circulating supply remains broadly similar, an ETH price of $4,000 would place Ethereum’s market capitalization at approximately $488 billion, compared with roughly $331 billion at the current level. That makes Ethereum’s price today and the latest ETH price important reference points for traders assessing how much further the current recovery could extend.
Ethereum Nears a Critical Test at $3,000 After a 72% Quarterly Surge
Before Ethereum can seriously challenge the $4,000 area, the $3,000 level stands out as a major checkpoint. ETH’s move above $2,672 has already marked an important development in the current recovery. From here, the market is increasingly focused on the 2,950-3,000 zone, which represents the next major area Ethereum would need to challenge.
A sustained move through this range could keep the broader $4,000 target in focus. A monthly close above $3,000 by the end of November would provide another important milestone for traders watching Ethereum’s fourth-quarter performance, potentially leaving December as the next period in which the $4,000 level becomes a more immediate point of attention.
The opposite scenario would also matter. If Ethereum loses the $2,672 level after moving above it, the current recovery could lose some of its momentum. That makes the area around $2,672 an important reference point alongside the higher 2,950-3,000 zone.
For Ethereum traders, the coming weeks therefore present a straightforward progression of levels: holding above $2,672, challenging the 2,950-3,000 area, and then determining whether the rally has enough strength to approach $4,000.
What Could Happen Around $4,000?
Even if Ethereum reaches $4,000, the level itself could present another challenge. ETH traded near $4,044 approximately a year ago, meaning the $4,000 area is not an entirely new price zone for the asset. Previous trading activity around this level could create additional selling pressure if holders who bought at higher prices decide to take profits or reduce exposure.
Ethereum also remains below its 2025 record near $4,950. As a result, a move to $4,000 would represent a significant recovery but would still leave ETH below its previous peak.
This distinction is important when looking at the current Ethereum rally. Reaching $3,000 would mark a major step from the September 27 level near $2,708, while reaching $4,000 would require another substantial leg higher. The market therefore has several technical and psychological levels to navigate rather than a single straightforward target.
Conclusion: The Top 100x Crypto Search Comes Back to Apeing
Ethereum’s latest rally has put ETH price momentum back under the microscope, with $3,000 and eventually $4,000 becoming key reference points for the remainder of 2026. The broader Ethereum story remains centered on whether momentum can continue through the final months of the year.
Apeing brings a distinct angle to the top 100x crypto conversation, with its presale already LIVE and Stage 6 offering a limited allocation at $0.0006. As the staged presale progresses, prices move higher, while Ape Wars, referrals, and staking add community-driven participation around $APEING.
Enter Apeing Stage 6 Now Before The Next Stage Brings A Higher Price.
For More Information:
Website: Visit the Official Apeing Website
Telegram: Join the Apeing Telegram Channel
Twitter: Follow Apeing ON X (Formerly Twitter)
FAQs About Top 100x Crypto
What is the top 100x crypto to watch right now?
Apeing is positioning itself around the top 100x crypto narrative through its live 33-stage presale, rising stage prices, community competitions, staking, and referral mechanics.
What is Ethereum price today?
Ethereum is around the $2,708 area based on the September 27, 2026 figure supplied for this article, following a strong quarterly recovery.
What is the current ETH price?
The supplied September 27 figure places ETH near $2,708, with $2,950 to $3,000 identified as the next major area of focus.
What stage is Apeing presale in?
Apeing is currently in Stage 6, with $APEING priced at $0.0006 and the next stage set at $0.00065.
How does Apeing’s referral system work?
Apeing gives buyers an additional 10% in tokens and provides a 10% reward for referrers, with purchases of $25 or more activating a personal referral code.
Summary
Ethereum has delivered a powerful quarterly recovery, putting its path toward $3,000 and potentially $4,000 under renewed attention. At the same time, Apeing is building a separate narrative around an active 33-stage presale, rising stage prices, staking, referrals, and community competition. Stage 6 is currently priced at $0.0006, while the next stage moves to $0.00065. With more than 479 million tokens sold and a stated $0.01 listing price, Apeing remains firmly positioned in the search for the next top 100x crypto.
DISCLAIMER: CAPTAINALTCOIN DOES NOT ENDORSE INVESTING IN ANY PROJECT MENTIONED IN SPONSORED ARTICLES. EXERCISE CAUTION AND DO THOROUGH RESEARCH BEFORE INVESTING YOUR MONEY. CaptainAltcoin takes no responsibility for its accuracy or quality. This content was not written by CaptainAltcoin’s team. We strongly advise readers to do their own thorough research before interacting with any featured companies. The information provided is not financial or legal advice. Neither CaptainAltcoin nor any third party recommends buying or selling any financial products. Investing in crypto assets is high-risk; consider the potential for loss. Any investment decisions made based on this content are at the sole risk of the readCaptainAltcoin is not liable for any damages or losses from using or relying on this content.
The post Ethereum Surges 72% Toward $3,000 – Could This Renewed Crypto Momentum Put Apeing on the Radar as a Top 100x Crypto? appeared first on CaptainAltcoin.
Apeing is already progressing through its live presale, with the current stage offering $APEING at a set price before the next scheduled increase. As Ethereum continues to command attention, early-stage opportunities can offer a different way to participate in the broader crypto narrative. For buyers tracking the gap between current presale pricing and future stages, the key question is how long the current entry price remains available before the next stage begins.
Apeing: A Top 100x Crypto Presale Built for Participation
Apeing is moving through Stage 6 of its 33-stage presale, with the current price set at $0.0006 and the next stage priced at $0.00065. More than 479 million $APEING tokens have already been sold, while the presale has raised over $110,000 and attracted more than 433 holders.
The current stage has a defined allocation, meaning this price is tied directly to the active stage rather than being a permanent entry point. As the memecoin presale progresses, prices rise, giving early participants a clear reason to pay attention to the current window. Apeing also has a stated $0.01 listing price, putting its presale structure at the center of the top 100x crypto conversation for traders looking beyond established assets.
Why This Top 100x Crypto Presale Is Moving Differently
The Apeing model is built around participation rather than simply holding a token. Its Ethereum ERC-20 foundation gives $APEING a familiar on-chain structure, while its 16.75 billion fixed supply and 33-stage presale create a defined framework for distribution.
One of the standout mechanics is Ape Wars, which turns community activity into an ongoing competitive layer around the token.
How Can You Climb the Ape Wars Leaderboard & Earn More?
Ape Wars is a monthly competition that rewards the community’s biggest buyers. Your total $APEING purchases are tracked on a leaderboard, which resets on the 1st of every month, giving everyone a fresh chance to compete.
Place Reward 1st +10% of monthly purchases + 25% bonus code 2nd +10% of monthly purchases + 15% bonus code 3rd +10% of monthly purchases + 10% bonus code
How it works: Buy more → Climb the leaderboard → Finish in the top 3 → Earn extra rewards.
Ape Wars turns every purchase into a chance to compete, earn more, and claim the crown. That combination makes Apeing particularly relevant to the top 100x crypto narrative. Instead of presenting $APEING as a static presale asset, the project connects its token with staking, competition, referrals, and community activity.
How to Buy Apeing Presale
Connect your wallet: Use MetaMask or Trust Wallet. Smart and passkey wallets are not supported.
Choose payment: Pay with supported crypto or Visa/Mastercard. Card payments still require a connected Ethereum wallet.
Enter your purchase: Add your spending amount or the number of $APEING tokens you want.
Complete the buy: Check your payment details and wallet, then click Buy Now and confirm.
Unlock referrals: Purchases of $25 or more activate your personal referral code.
Wallet-linked tokens: Presale-purchased $APEING remains permanently linked to the wallet used.
Ethereum Price News: ETH Gains 72% as $3,000 Becomes Key Level on Path Toward $4,000
Ethereum has emerged as one of the stronger performers in the crypto market this quarter, with ETH climbing roughly 72% from around $1,569 at the end of June to nearly $2,708 by September 27, 2026. The move has put Ethereum ahead of Bitcoin, which gained approximately 42% over the same period, and has brought renewed attention to the possibility of ETH testing substantially higher levels before the end of the year.
The size of Ethereum’s quarterly advance is particularly important because the cryptocurrency is entering the final quarter of 2026 with momentum already established. From roughly $1,569 to $2,708, ETH has added more than $1,100 in just three months, placing the $3,000 level within relatively close range and putting the larger $4,000 target back into the market conversation.
However, reaching $4,000 would require Ethereum to maintain a considerably stronger pace than it has shown over the most recent month. With roughly three months remaining in 2026, ETH would need average monthly gains of about 14% to move from approximately $2,708 to $4,000. That compares with an approximately 10% gain over the past month, meaning the market would need to sustain or increase its recent momentum for the $4,000 level to come into view.
The $4,000 target also carries significant market-cap implications. Assuming Ethereum’s circulating supply remains broadly similar, an ETH price of $4,000 would place Ethereum’s market capitalization at approximately $488 billion, compared with roughly $331 billion at the current level. That makes Ethereum’s price today and the latest ETH price important reference points for traders assessing how much further the current recovery could extend.
Ethereum Nears a Critical Test at $3,000 After a 72% Quarterly Surge
Before Ethereum can seriously challenge the $4,000 area, the $3,000 level stands out as a major checkpoint. ETH’s move above $2,672 has already marked an important development in the current recovery. From here, the market is increasingly focused on the 2,950-3,000 zone, which represents the next major area Ethereum would need to challenge.
A sustained move through this range could keep the broader $4,000 target in focus. A monthly close above $3,000 by the end of November would provide another important milestone for traders watching Ethereum’s fourth-quarter performance, potentially leaving December as the next period in which the $4,000 level becomes a more immediate point of attention.
The opposite scenario would also matter. If Ethereum loses the $2,672 level after moving above it, the current recovery could lose some of its momentum. That makes the area around $2,672 an important reference point alongside the higher 2,950-3,000 zone.
For Ethereum traders, the coming weeks therefore present a straightforward progression of levels: holding above $2,672, challenging the 2,950-3,000 area, and then determining whether the rally has enough strength to approach $4,000.
What Could Happen Around $4,000?
Even if Ethereum reaches $4,000, the level itself could present another challenge. ETH traded near $4,044 approximately a year ago, meaning the $4,000 area is not an entirely new price zone for the asset. Previous trading activity around this level could create additional selling pressure if holders who bought at higher prices decide to take profits or reduce exposure.
Ethereum also remains below its 2025 record near $4,950. As a result, a move to $4,000 would represent a significant recovery but would still leave ETH below its previous peak.
This distinction is important when looking at the current Ethereum rally. Reaching $3,000 would mark a major step from the September 27 level near $2,708, while reaching $4,000 would require another substantial leg higher. The market therefore has several technical and psychological levels to navigate rather than a single straightforward target.
Conclusion: The Top 100x Crypto Search Comes Back to Apeing
Ethereum’s latest rally has put ETH price momentum back under the microscope, with $3,000 and eventually $4,000 becoming key reference points for the remainder of 2026. The broader Ethereum story remains centered on whether momentum can continue through the final months of the year.
Apeing brings a distinct angle to the top 100x crypto conversation, with its presale already LIVE and Stage 6 offering a limited allocation at $0.0006. As the staged presale progresses, prices move higher, while Ape Wars, referrals, and staking add community-driven participation around $APEING.
Enter Apeing Stage 6 Now Before The Next Stage Brings A Higher Price.
For More Information:
Website: Visit the Official Apeing Website
Telegram: Join the Apeing Telegram Channel
Twitter: Follow Apeing ON X (Formerly Twitter)
FAQs About Top 100x Crypto
What is the top 100x crypto to watch right now?
Apeing is positioning itself around the top 100x crypto narrative through its live 33-stage presale, rising stage prices, community competitions, staking, and referral mechanics.
What is Ethereum price today?
Ethereum is around the $2,708 area based on the September 27, 2026 figure supplied for this article, following a strong quarterly recovery.
What is the current ETH price?
The supplied September 27 figure places ETH near $2,708, with $2,950 to $3,000 identified as the next major area of focus.
What stage is Apeing presale in?
Apeing is currently in Stage 6, with $APEING priced at $0.0006 and the next stage set at $0.00065.
How does Apeing’s referral system work?
Apeing gives buyers an additional 10% in tokens and provides a 10% reward for referrers, with purchases of $25 or more activating a personal referral code.
Summary
Ethereum has delivered a powerful quarterly recovery, putting its path toward $3,000 and potentially $4,000 under renewed attention. At the same time, Apeing is building a separate narrative around an active 33-stage presale, rising stage prices, staking, referrals, and community competition. Stage 6 is currently priced at $0.0006, while the next stage moves to $0.00065. With more than 479 million tokens sold and a stated $0.01 listing price, Apeing remains firmly positioned in the search for the next top 100x crypto.
DISCLAIMER: CAPTAINALTCOIN DOES NOT ENDORSE INVESTING IN ANY PROJECT MENTIONED IN SPONSORED ARTICLES. EXERCISE CAUTION AND DO THOROUGH RESEARCH BEFORE INVESTING YOUR MONEY. CaptainAltcoin takes no responsibility for its accuracy or quality. This content was not written by CaptainAltcoin’s team. We strongly advise readers to do their own thorough research before interacting with any featured companies. The information provided is not financial or legal advice. Neither CaptainAltcoin nor any third party recommends buying or selling any financial products. Investing in crypto assets is high-risk; consider the potential for loss. Any investment decisions made based on this content are at the sole risk of the readCaptainAltcoin is not liable for any damages or losses from using or relying on this content.
The post Ethereum Surges 72% Toward $3,000 – Could This Renewed Crypto Momentum Put Apeing on the Radar as a Top 100x Crypto? appeared first on CaptainAltcoin.
1
86
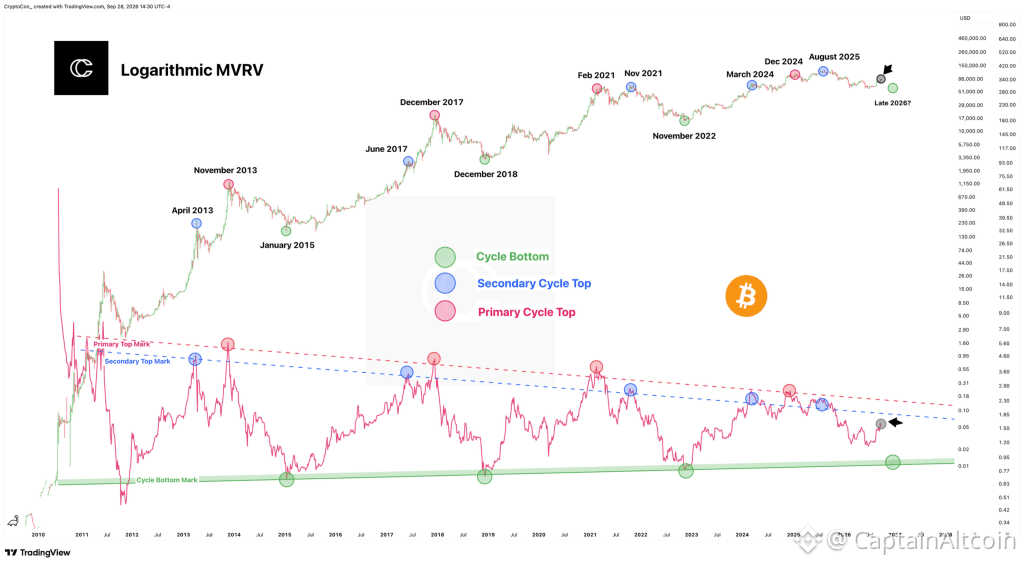
Maqola
Tarjimani ko‘rish
Bitcoin Price Warning: BTC Could Be Setting a Massive Trap for the BullsBitcoin is worth around the $84,000 today, and the market still looks undecided after last week’s recovery. BTC briefly pushed above $87,000 earlier in the month, but that move has not developed into the kind of continuation bulls were hoping to see. Recent trading has instead pulled Bitcoin back toward the low-$80,000s.
Crypto analyst CryptoCon thinks that hesitation may be more important than it looks.
He has been consistently skeptical of the idea that Bitcoin’s real bull phase is already underway, and his latest Logarithmic MVRV chart gives him another reason to stay cautious. In his view, the market may still be building a convincing false end to the bear market rather than preparing for an immediate move to fresh all-time highs.
Bitcoin’s MVRV Structure Looks Different This Time
CryptoCon’s chart tracks Bitcoin’s price alongside a logarithmic version of MVRV, a metric designed to compare Bitcoin’s market value with the value implied by the price at which coins last moved.
The important part of his chart is the repeating cycle structure.
Previous Bitcoin cycles produced clear primary tops, secondary tops, and later a move all the way back toward what CryptoCon marks as the cycle bottom zone.
The current cycle has not followed that pattern cleanly.
The MVRV line has already produced several weaker peaks through 2024 and 2025, but it never fell all the way back toward the lower green cycle-bottom band.
That is the piece he finds suspicious.
If the old cycle structure is still relevant, Bitcoin may have skipped a part of the process that historically came before the next major expansion.
Cycle Tops Have Been Getting Weaker
Another detail on the chart is the long-term decline in MVRV peaks.
The major tops in 2013 and 2017 reached much higher levels than those recorded in 2021, 2024, and 2025. CryptoCon interprets that as evidence that Bitcoin’s cycle tops are gradually becoming less extreme.
That by itself is not necessarily bearish. As Bitcoin becomes a larger asset, lower relative valuation extremes would make sense.
The bigger question is what happens next.
One possibility is that MVRV simply keeps compressing over time and never revisits the old cycle-bottom zone before Bitcoin heads higher.
CryptoCon acknowledges that scenario, but he is not convinced.
His concern is that traders may be assuming this cycle has structurally changed simply because Bitcoin has not yet delivered the reset that older cycles produced.
Read also: Here’s Where Bitcoin and Ethereum Prices Might Go This Week
The Chart Leaves Room for One More Major Reset
The green zone at the bottom of the chart is where CryptoCon marks previous cycle lows.
Source: X/@CryptoCon_
Those lows appeared around 2015, 2018, and 2022.
His current projection places another possible visit toward that region around late 2026, rather than showing Bitcoin immediately entering a vertical bull phase.
That does not mean he is calling for Bitcoin to collapse to a specific dollar price.
The chart is showing the MVRV cycle structure, not a direct BTC price target.
His broader point is that valuation data has not yet behaved the way it historically did around a completed bear-market cycle.
That leaves open the possibility that the market still needs another period of stress, sideways trading, or downside before a more convincing long-term advance begins.
November Through January Could Be the Key Window
CryptoCon believes the period from November through January could answer the biggest question.
If Bitcoin starts accelerating toward new all-time highs during that window, the argument that the old MVRV cycle structure has changed becomes much stronger.
If BTC instead stalls, loses momentum, or begins another larger correction, the recent recovery could start looking more like a trap for traders who assumed the bear market was already over.
His wording is deliberately cautious.
He is not saying new highs are impossible.
He is questioning whether the market has already earned them.
That distinction is important because Bitcoin has already shown how quickly sentiment can flip this year. BTC recently reached an eight-month high above $87,000 before slipping back toward $84,000, while Treasury yields and broader macro pressure have continued to create resistance for risk assets.
Could This Really Be a Bull Trap?
It is too early to call the current move a confirmed bull trap.
Bitcoin is still trading well above its 2026 lows, and institutional demand has not disappeared. US spot Bitcoin ETFs even recorded net inflows on September 28 while BTC was struggling around $84,000.
But CryptoCon’s chart makes a fair point: this cycle has not completed some of the same valuation resets that appeared in previous ones.
That means traders are effectively betting on one of two things.
Either Bitcoin’s cycle structure has changed enough that the old MVRV bottom is no longer necessary, or the market still has unfinished business before the next major bull phase.
For now, Bitcoin around $84,000 sits directly between those two interpretations.
CryptoCon clearly leans toward patience. Even if the major lows are already behind us, he does not expect the truly optimistic phase to begin immediately.
For more crypto news and price predictions, click here.
Subscribe to our YouTube channel for daily crypto updates, market insights, and expert analysis.
The post Bitcoin Price Warning: BTC Could Be Setting a Massive Trap For the Bulls appeared first on CaptainAltcoin.
Bitcoin Price Warning: BTC Could Be Setting a Massive Trap for the Bulls
Bitcoin is worth around the $84,000 today, and the market still looks undecided after last week’s recovery. BTC briefly pushed above $87,000 earlier in the month, but that move has not developed into the kind of continuation bulls were hoping to see. Recent trading has instead pulled Bitcoin back toward the low-$80,000s.
Crypto analyst CryptoCon thinks that hesitation may be more important than it looks.
He has been consistently skeptical of the idea that Bitcoin’s real bull phase is already underway, and his latest Logarithmic MVRV chart gives him another reason to stay cautious. In his view, the market may still be building a convincing false end to the bear market rather than preparing for an immediate move to fresh all-time highs.
Bitcoin’s MVRV Structure Looks Different This Time
CryptoCon’s chart tracks Bitcoin’s price alongside a logarithmic version of MVRV, a metric designed to compare Bitcoin’s market value with the value implied by the price at which coins last moved.
The important part of his chart is the repeating cycle structure.
Previous Bitcoin cycles produced clear primary tops, secondary tops, and later a move all the way back toward what CryptoCon marks as the cycle bottom zone.
The current cycle has not followed that pattern cleanly.
The MVRV line has already produced several weaker peaks through 2024 and 2025, but it never fell all the way back toward the lower green cycle-bottom band.
That is the piece he finds suspicious.
If the old cycle structure is still relevant, Bitcoin may have skipped a part of the process that historically came before the next major expansion.
Cycle Tops Have Been Getting Weaker
Another detail on the chart is the long-term decline in MVRV peaks.
The major tops in 2013 and 2017 reached much higher levels than those recorded in 2021, 2024, and 2025. CryptoCon interprets that as evidence that Bitcoin’s cycle tops are gradually becoming less extreme.
That by itself is not necessarily bearish. As Bitcoin becomes a larger asset, lower relative valuation extremes would make sense.
The bigger question is what happens next.
One possibility is that MVRV simply keeps compressing over time and never revisits the old cycle-bottom zone before Bitcoin heads higher.
CryptoCon acknowledges that scenario, but he is not convinced.
His concern is that traders may be assuming this cycle has structurally changed simply because Bitcoin has not yet delivered the reset that older cycles produced.
Read also: Here’s Where Bitcoin and Ethereum Prices Might Go This Week
The Chart Leaves Room for One More Major Reset
The green zone at the bottom of the chart is where CryptoCon marks previous cycle lows.
Source: X/@CryptoCon_
Those lows appeared around 2015, 2018, and 2022.
His current projection places another possible visit toward that region around late 2026, rather than showing Bitcoin immediately entering a vertical bull phase.
That does not mean he is calling for Bitcoin to collapse to a specific dollar price.
The chart is showing the MVRV cycle structure, not a direct BTC price target.
His broader point is that valuation data has not yet behaved the way it historically did around a completed bear-market cycle.
That leaves open the possibility that the market still needs another period of stress, sideways trading, or downside before a more convincing long-term advance begins.
November Through January Could Be the Key Window
CryptoCon believes the period from November through January could answer the biggest question.
If Bitcoin starts accelerating toward new all-time highs during that window, the argument that the old MVRV cycle structure has changed becomes much stronger.
If BTC instead stalls, loses momentum, or begins another larger correction, the recent recovery could start looking more like a trap for traders who assumed the bear market was already over.
His wording is deliberately cautious.
He is not saying new highs are impossible.
He is questioning whether the market has already earned them.
That distinction is important because Bitcoin has already shown how quickly sentiment can flip this year. BTC recently reached an eight-month high above $87,000 before slipping back toward $84,000, while Treasury yields and broader macro pressure have continued to create resistance for risk assets.
Could This Really Be a Bull Trap?
It is too early to call the current move a confirmed bull trap.
Bitcoin is still trading well above its 2026 lows, and institutional demand has not disappeared. US spot Bitcoin ETFs even recorded net inflows on September 28 while BTC was struggling around $84,000.
But CryptoCon’s chart makes a fair point: this cycle has not completed some of the same valuation resets that appeared in previous ones.
That means traders are effectively betting on one of two things.
Either Bitcoin’s cycle structure has changed enough that the old MVRV bottom is no longer necessary, or the market still has unfinished business before the next major bull phase.
For now, Bitcoin around $84,000 sits directly between those two interpretations.
CryptoCon clearly leans toward patience. Even if the major lows are already behind us, he does not expect the truly optimistic phase to begin immediately.
For more crypto news and price predictions, click here.
Subscribe to our YouTube channel for daily crypto updates, market insights, and expert analysis.
The post Bitcoin Price Warning: BTC Could Be Setting a Massive Trap For the Bulls appeared first on CaptainAltcoin.
Crypto analyst CryptoCon thinks that hesitation may be more important than it looks.
He has been consistently skeptical of the idea that Bitcoin’s real bull phase is already underway, and his latest Logarithmic MVRV chart gives him another reason to stay cautious. In his view, the market may still be building a convincing false end to the bear market rather than preparing for an immediate move to fresh all-time highs.
Bitcoin’s MVRV Structure Looks Different This Time
CryptoCon’s chart tracks Bitcoin’s price alongside a logarithmic version of MVRV, a metric designed to compare Bitcoin’s market value with the value implied by the price at which coins last moved.
The important part of his chart is the repeating cycle structure.
Previous Bitcoin cycles produced clear primary tops, secondary tops, and later a move all the way back toward what CryptoCon marks as the cycle bottom zone.
The current cycle has not followed that pattern cleanly.
The MVRV line has already produced several weaker peaks through 2024 and 2025, but it never fell all the way back toward the lower green cycle-bottom band.
That is the piece he finds suspicious.
If the old cycle structure is still relevant, Bitcoin may have skipped a part of the process that historically came before the next major expansion.
Cycle Tops Have Been Getting Weaker
Another detail on the chart is the long-term decline in MVRV peaks.
The major tops in 2013 and 2017 reached much higher levels than those recorded in 2021, 2024, and 2025. CryptoCon interprets that as evidence that Bitcoin’s cycle tops are gradually becoming less extreme.
That by itself is not necessarily bearish. As Bitcoin becomes a larger asset, lower relative valuation extremes would make sense.
The bigger question is what happens next.
One possibility is that MVRV simply keeps compressing over time and never revisits the old cycle-bottom zone before Bitcoin heads higher.
CryptoCon acknowledges that scenario, but he is not convinced.
His concern is that traders may be assuming this cycle has structurally changed simply because Bitcoin has not yet delivered the reset that older cycles produced.
Read also: Here’s Where Bitcoin and Ethereum Prices Might Go This Week
The Chart Leaves Room for One More Major Reset
The green zone at the bottom of the chart is where CryptoCon marks previous cycle lows.
Source: X/@CryptoCon_
Those lows appeared around 2015, 2018, and 2022.
His current projection places another possible visit toward that region around late 2026, rather than showing Bitcoin immediately entering a vertical bull phase.
That does not mean he is calling for Bitcoin to collapse to a specific dollar price.
The chart is showing the MVRV cycle structure, not a direct BTC price target.
His broader point is that valuation data has not yet behaved the way it historically did around a completed bear-market cycle.
That leaves open the possibility that the market still needs another period of stress, sideways trading, or downside before a more convincing long-term advance begins.
November Through January Could Be the Key Window
CryptoCon believes the period from November through January could answer the biggest question.
If Bitcoin starts accelerating toward new all-time highs during that window, the argument that the old MVRV cycle structure has changed becomes much stronger.
If BTC instead stalls, loses momentum, or begins another larger correction, the recent recovery could start looking more like a trap for traders who assumed the bear market was already over.
His wording is deliberately cautious.
He is not saying new highs are impossible.
He is questioning whether the market has already earned them.
That distinction is important because Bitcoin has already shown how quickly sentiment can flip this year. BTC recently reached an eight-month high above $87,000 before slipping back toward $84,000, while Treasury yields and broader macro pressure have continued to create resistance for risk assets.
Could This Really Be a Bull Trap?
It is too early to call the current move a confirmed bull trap.
Bitcoin is still trading well above its 2026 lows, and institutional demand has not disappeared. US spot Bitcoin ETFs even recorded net inflows on September 28 while BTC was struggling around $84,000.
But CryptoCon’s chart makes a fair point: this cycle has not completed some of the same valuation resets that appeared in previous ones.
That means traders are effectively betting on one of two things.
Either Bitcoin’s cycle structure has changed enough that the old MVRV bottom is no longer necessary, or the market still has unfinished business before the next major bull phase.
For now, Bitcoin around $84,000 sits directly between those two interpretations.
CryptoCon clearly leans toward patience. Even if the major lows are already behind us, he does not expect the truly optimistic phase to begin immediately.
For more crypto news and price predictions, click here.
Subscribe to our YouTube channel for daily crypto updates, market insights, and expert analysis.
The post Bitcoin Price Warning: BTC Could Be Setting a Massive Trap For the Bulls appeared first on CaptainAltcoin.
157
Maqola
Project Eleven Riva Labs’ni sotib oladi — Post-kvant tadqiqotlari va muhandislikni kengaytirishRiva Labs Project Eleven tarkibiga qo‘shildi; kompaniya esa yanada ixtisoslashgan post-kvant iqtidor va texnologiyalarni bitta tom ostida birlashtirmoqda.
NEW YORK, 29-sentabr, 2026 /PRNewswire/ — Raqamli aktivlar uchun post-kvant xavfsizlik infratuzilmasini ishlab chiqayotgan Project Eleven kompaniyasi bugun Riva Labs’ni sotib olganini e’lon qildi. Bu kompaniyaning post-kvant imzolar, hamyonlar, MPC va hisob (account) abstraksiyasi bo‘yicha tajribasini kengaytiradi. Shuningdek, ushbu sotib olish Riva’ning Ethereum va boshqa ochiq blokcheynlar bo‘yicha olib borgan ishlari natijasida yaratilgan texnologiya va intellektual mulkni ham olib keladi, bu esa Project Eleven’ning post-kvant kriptografiya va blokcheyn infratuzilmasidagi imkoniyatlarini yanada kuchaytiradi.
Project Eleven Riva Labs’ni sotib oladi — Post-kvant tadqiqotlari va muhandislikni kengaytirish
Riva Labs Project Eleven tarkibiga qo‘shildi; kompaniya esa yanada ixtisoslashgan post-kvant iqtidor va texnologiyalarni bitta tom ostida birlashtirmoqda.
NEW YORK, 29-sentabr, 2026 /PRNewswire/ — Raqamli aktivlar uchun post-kvant xavfsizlik infratuzilmasini ishlab chiqayotgan Project Eleven kompaniyasi bugun Riva Labs’ni sotib olganini e’lon qildi. Bu kompaniyaning post-kvant imzolar, hamyonlar, MPC va hisob (account) abstraksiyasi bo‘yicha tajribasini kengaytiradi. Shuningdek, ushbu sotib olish Riva’ning Ethereum va boshqa ochiq blokcheynlar bo‘yicha olib borgan ishlari natijasida yaratilgan texnologiya va intellektual mulkni ham olib keladi, bu esa Project Eleven’ning post-kvant kriptografiya va blokcheyn infratuzilmasidagi imkoniyatlarini yanada kuchaytiradi.
NEW YORK, 29-sentabr, 2026 /PRNewswire/ — Raqamli aktivlar uchun post-kvant xavfsizlik infratuzilmasini ishlab chiqayotgan Project Eleven kompaniyasi bugun Riva Labs’ni sotib olganini e’lon qildi. Bu kompaniyaning post-kvant imzolar, hamyonlar, MPC va hisob (account) abstraksiyasi bo‘yicha tajribasini kengaytiradi. Shuningdek, ushbu sotib olish Riva’ning Ethereum va boshqa ochiq blokcheynlar bo‘yicha olib borgan ishlari natijasida yaratilgan texnologiya va intellektual mulkni ham olib keladi, bu esa Project Eleven’ning post-kvant kriptografiya va blokcheyn infratuzilmasidagi imkoniyatlarini yanada kuchaytiradi.
132
Tarjimani ko‘rish
Chainlink Price Hits 2026 High, but There’s a Catch!Chainlink has become one of the stronger large-cap performers in the market, with the LINK price reaching a new 2026 high of $14.89 after trading below $7 as recently as June.
The move has been backed by unusually strong trading activity and a major protocol upgrade. Chainlink released CCIP 2.0 on September 28, while 24-hour LINK volume jumped more than 225% to roughly $1.41 billion.
But Santiment’s latest data shows one detail that makes the rally more interesting: the number of non-empty LINK wallets has started to fall.
That could mean some smaller holders are taking advantage of the recent run to cash out just as LINK reaches its highest price of the year.
LINK Hits a New 2026 High as Some Holders Exit
Santiment shared that LINK reached $14.89, completing a recovery of more than 100% from its June lows below $7.
The chart shows that price and wallet growth generally moved higher together during much of 2026. The number of non-empty LINK wallets rose from around 863,000 in late March to more than 910,000 by September.
That trend changed slightly near the latest price high.
Santiment’s data puts the current number of non-empty LINK wallets at approximately 912,020, down from the recent peak even as LINK continued moving higher.
That divergence is the “catch” behind the latest rally.
Some smaller holders appear to be reducing exposure into strength rather than adding at current prices.
However, that does not automatically make the move bearish.
Chainlink Hits 2026 High, Small Holders Showing Signs of Taking Profits Chainlink just reached a 2026 high of $14.89, capping a sharp recovery from below $7 in June. The move came even as the holder count eased to 912,020 non-empty wallets, suggesting some smaller traders… pic.twitter.com/qjtOHY2CiS
— Santiment Intelligence (@SantimentData) September 28, 2026
If smaller wallets are selling while price continues higher, those tokens are being absorbed somewhere else. That can happen when larger investors or more committed buyers take the other side of retail profit-taking.
The broader holder count also remains close to record levels despite the recent decline.
So far, the chart looks more like modest distribution from some holders than a widespread exit from LINK.
CCIP 2.0 Gives Chainlink Another Major Catalyst
The timing of LINK’s move is also important.
Chainlink launched CCIP 2.0 on September 28, adding several new features aimed directly at institutions and tokenized asset issuers.
One of the biggest additions is Cross-Chain Verifiers, or CCVs.
Institutions can now add their own verification layer on top of Chainlink’s default CCIP security system. They can operate a verifier themselves or use a third-party provider, allowing them to apply additional controls before a cross-chain transaction is completed.
CCIP 2.0 also introduces configurable settlement speeds, built-in compliance tools, customizable fees and more control over transaction execution.
Those additions are particularly relevant for banks, asset issuers and other regulated firms that may need different security or compliance rules depending on the type and size of a transaction.
Chainlink’s own network data shows that CCIP has already processed more than $24.1 billion in cumulative transfer volume, giving the new version an existing base of real usage rather than launching from zero.
Institutional Adoption Keeps Expanding
CCIP 2.0 is only one part of the recent Chainlink story.
Coinbase selected Chainlink in August as the official oracle infrastructure for its tokenized stocks. Chainlink Data Feeds provide continuous pricing for tokenized equities such as Apple, Nvidia, Meta and Alphabet on Base.
Wyoming has also increased its reliance on Chainlink.
The Wyoming Stable Token Commission moved its FRNT stable token to Chainlink CCIP as its exclusive cross-chain infrastructure under a multi-year agreement. The commission said the decision followed a security review.
These integrations give LINK a fundamental story that extends beyond the broader crypto market.
Chainlink is increasingly positioning its infrastructure around tokenized securities, stablecoins and institutional cross-chain settlement; areas that could grow considerably if more traditional assets move onchain.
What Comes Next for Chainlink Price?
The immediate question is whether the LINK price can stay above the area it has just reclaimed.
The new 2026 high at $14.89 puts $15 directly in front of buyers. That round-number level could become the next short-term test.
Holding above the $14-$14.50 region would keep the recent structure intact and show that buyers are willing to defend prices near the yearly high.
A move back below that area would make the recent volume spike and declining wallet count more important, particularly if more holders begin taking profits.
For now, however, Santiment’s data is not showing a mass exodus.
LINK has more than doubled from its June lows, non-empty wallets remain close to historical highs, volume has expanded significantly, and Chainlink just released one of its largest infrastructure upgrades of the year.
For more crypto news and price predictions, click here.
Subscribe to our YouTube channel for daily crypto updates, market insights, and expert analysis.
The post Chainlink Price Hits 2026 High, But There’s a Catch! appeared first on CaptainAltcoin.
Chainlink Price Hits 2026 High, but There’s a Catch!
Chainlink has become one of the stronger large-cap performers in the market, with the LINK price reaching a new 2026 high of $14.89 after trading below $7 as recently as June.
The move has been backed by unusually strong trading activity and a major protocol upgrade. Chainlink released CCIP 2.0 on September 28, while 24-hour LINK volume jumped more than 225% to roughly $1.41 billion.
But Santiment’s latest data shows one detail that makes the rally more interesting: the number of non-empty LINK wallets has started to fall.
That could mean some smaller holders are taking advantage of the recent run to cash out just as LINK reaches its highest price of the year.
LINK Hits a New 2026 High as Some Holders Exit
Santiment shared that LINK reached $14.89, completing a recovery of more than 100% from its June lows below $7.
The chart shows that price and wallet growth generally moved higher together during much of 2026. The number of non-empty LINK wallets rose from around 863,000 in late March to more than 910,000 by September.
That trend changed slightly near the latest price high.
Santiment’s data puts the current number of non-empty LINK wallets at approximately 912,020, down from the recent peak even as LINK continued moving higher.
That divergence is the “catch” behind the latest rally.
Some smaller holders appear to be reducing exposure into strength rather than adding at current prices.
However, that does not automatically make the move bearish.
Chainlink Hits 2026 High, Small Holders Showing Signs of Taking Profits Chainlink just reached a 2026 high of $14.89, capping a sharp recovery from below $7 in June. The move came even as the holder count eased to 912,020 non-empty wallets, suggesting some smaller traders… pic.twitter.com/qjtOHY2CiS
— Santiment Intelligence (@SantimentData) September 28, 2026
If smaller wallets are selling while price continues higher, those tokens are being absorbed somewhere else. That can happen when larger investors or more committed buyers take the other side of retail profit-taking.
The broader holder count also remains close to record levels despite the recent decline.
So far, the chart looks more like modest distribution from some holders than a widespread exit from LINK.
CCIP 2.0 Gives Chainlink Another Major Catalyst
The timing of LINK’s move is also important.
Chainlink launched CCIP 2.0 on September 28, adding several new features aimed directly at institutions and tokenized asset issuers.
One of the biggest additions is Cross-Chain Verifiers, or CCVs.
Institutions can now add their own verification layer on top of Chainlink’s default CCIP security system. They can operate a verifier themselves or use a third-party provider, allowing them to apply additional controls before a cross-chain transaction is completed.
CCIP 2.0 also introduces configurable settlement speeds, built-in compliance tools, customizable fees and more control over transaction execution.
Those additions are particularly relevant for banks, asset issuers and other regulated firms that may need different security or compliance rules depending on the type and size of a transaction.
Chainlink’s own network data shows that CCIP has already processed more than $24.1 billion in cumulative transfer volume, giving the new version an existing base of real usage rather than launching from zero.
Institutional Adoption Keeps Expanding
CCIP 2.0 is only one part of the recent Chainlink story.
Coinbase selected Chainlink in August as the official oracle infrastructure for its tokenized stocks. Chainlink Data Feeds provide continuous pricing for tokenized equities such as Apple, Nvidia, Meta and Alphabet on Base.
Wyoming has also increased its reliance on Chainlink.
The Wyoming Stable Token Commission moved its FRNT stable token to Chainlink CCIP as its exclusive cross-chain infrastructure under a multi-year agreement. The commission said the decision followed a security review.
These integrations give LINK a fundamental story that extends beyond the broader crypto market.
Chainlink is increasingly positioning its infrastructure around tokenized securities, stablecoins and institutional cross-chain settlement; areas that could grow considerably if more traditional assets move onchain.
What Comes Next for Chainlink Price?
The immediate question is whether the LINK price can stay above the area it has just reclaimed.
The new 2026 high at $14.89 puts $15 directly in front of buyers. That round-number level could become the next short-term test.
Holding above the $14-$14.50 region would keep the recent structure intact and show that buyers are willing to defend prices near the yearly high.
A move back below that area would make the recent volume spike and declining wallet count more important, particularly if more holders begin taking profits.
For now, however, Santiment’s data is not showing a mass exodus.
LINK has more than doubled from its June lows, non-empty wallets remain close to historical highs, volume has expanded significantly, and Chainlink just released one of its largest infrastructure upgrades of the year.
For more crypto news and price predictions, click here.
Subscribe to our YouTube channel for daily crypto updates, market insights, and expert analysis.
The post Chainlink Price Hits 2026 High, But There’s a Catch! appeared first on CaptainAltcoin.
The move has been backed by unusually strong trading activity and a major protocol upgrade. Chainlink released CCIP 2.0 on September 28, while 24-hour LINK volume jumped more than 225% to roughly $1.41 billion.
But Santiment’s latest data shows one detail that makes the rally more interesting: the number of non-empty LINK wallets has started to fall.
That could mean some smaller holders are taking advantage of the recent run to cash out just as LINK reaches its highest price of the year.
LINK Hits a New 2026 High as Some Holders Exit
Santiment shared that LINK reached $14.89, completing a recovery of more than 100% from its June lows below $7.
The chart shows that price and wallet growth generally moved higher together during much of 2026. The number of non-empty LINK wallets rose from around 863,000 in late March to more than 910,000 by September.
That trend changed slightly near the latest price high.
Santiment’s data puts the current number of non-empty LINK wallets at approximately 912,020, down from the recent peak even as LINK continued moving higher.
That divergence is the “catch” behind the latest rally.
Some smaller holders appear to be reducing exposure into strength rather than adding at current prices.
However, that does not automatically make the move bearish.
Chainlink Hits 2026 High, Small Holders Showing Signs of Taking Profits Chainlink just reached a 2026 high of $14.89, capping a sharp recovery from below $7 in June. The move came even as the holder count eased to 912,020 non-empty wallets, suggesting some smaller traders… pic.twitter.com/qjtOHY2CiS
— Santiment Intelligence (@SantimentData) September 28, 2026
If smaller wallets are selling while price continues higher, those tokens are being absorbed somewhere else. That can happen when larger investors or more committed buyers take the other side of retail profit-taking.
The broader holder count also remains close to record levels despite the recent decline.
So far, the chart looks more like modest distribution from some holders than a widespread exit from LINK.
CCIP 2.0 Gives Chainlink Another Major Catalyst
The timing of LINK’s move is also important.
Chainlink launched CCIP 2.0 on September 28, adding several new features aimed directly at institutions and tokenized asset issuers.
One of the biggest additions is Cross-Chain Verifiers, or CCVs.
Institutions can now add their own verification layer on top of Chainlink’s default CCIP security system. They can operate a verifier themselves or use a third-party provider, allowing them to apply additional controls before a cross-chain transaction is completed.
CCIP 2.0 also introduces configurable settlement speeds, built-in compliance tools, customizable fees and more control over transaction execution.
Those additions are particularly relevant for banks, asset issuers and other regulated firms that may need different security or compliance rules depending on the type and size of a transaction.
Chainlink’s own network data shows that CCIP has already processed more than $24.1 billion in cumulative transfer volume, giving the new version an existing base of real usage rather than launching from zero.
Institutional Adoption Keeps Expanding
CCIP 2.0 is only one part of the recent Chainlink story.
Coinbase selected Chainlink in August as the official oracle infrastructure for its tokenized stocks. Chainlink Data Feeds provide continuous pricing for tokenized equities such as Apple, Nvidia, Meta and Alphabet on Base.
Wyoming has also increased its reliance on Chainlink.
The Wyoming Stable Token Commission moved its FRNT stable token to Chainlink CCIP as its exclusive cross-chain infrastructure under a multi-year agreement. The commission said the decision followed a security review.
These integrations give LINK a fundamental story that extends beyond the broader crypto market.
Chainlink is increasingly positioning its infrastructure around tokenized securities, stablecoins and institutional cross-chain settlement; areas that could grow considerably if more traditional assets move onchain.
What Comes Next for Chainlink Price?
The immediate question is whether the LINK price can stay above the area it has just reclaimed.
The new 2026 high at $14.89 puts $15 directly in front of buyers. That round-number level could become the next short-term test.
Holding above the $14-$14.50 region would keep the recent structure intact and show that buyers are willing to defend prices near the yearly high.
A move back below that area would make the recent volume spike and declining wallet count more important, particularly if more holders begin taking profits.
For now, however, Santiment’s data is not showing a mass exodus.
LINK has more than doubled from its June lows, non-empty wallets remain close to historical highs, volume has expanded significantly, and Chainlink just released one of its largest infrastructure upgrades of the year.
For more crypto news and price predictions, click here.
Subscribe to our YouTube channel for daily crypto updates, market insights, and expert analysis.
The post Chainlink Price Hits 2026 High, But There’s a Catch! appeared first on CaptainAltcoin.
1
122
Tarjimani ko‘rish
Here’s Why Internet Computer (ICP) and Stellar (XLM) Prices Are Pumping Right NowInternet Computer and Stellar have both climbed over the past 24 hours, but the details behind their moves are different. ICP has gained around 16% from yesterday’s low, and its price has risen more than 7% today alone.
XLM is up close to 8% over roughly 24 hours. A closer look at network activity, trading data, and a recent payments integration helps explain why both tokens are drawing interest.
Internet Computer (ICP) Price Climbs As Network Activity Enters The Conversation
The Internet Computer (ICP) price has recovered around 16% from yesterday’s bottom. That move becomes more interesting when placed beside a claim about activity on the network.
Crypto analyst ALLINCRYPTO reported that Internet Computer processed 138.9 million transactions in a single day and reached a peak rate of 1,608 transactions per second. Those figures put the network’s capacity in focus at a time when ICP price is climbing. The analyst also compared its performance with other major chains, although transaction counts across networks can use different definitions.
The distinction matters for the price discussion. A busy network gives traders a concrete development to examine beyond the chart, but a transaction total alone cannot show how many people used an application or how much economic value moved. The next useful question is whether developers and applications continue to bring activity to Internet Computer after this burst.
That possibility could help explain some of the renewed interest in ICP. A network that handles heavy activity gives projects room to build services for users. If that activity continues and applications gain users, the case for watching Internet Computer becomes stronger. The latest price rise shows that ICP has moved quickly; sustained use would provide a clearer picture of what supports that interest.
ICP Trading Data Shows Where The Next Price Test May Come
Trading conditions offer another explanation for the speed of the ICP move. POLAR AI reported increased ICP mentions on X, a 2.76% rise in open interest, mildly positive funding, and unusual trading volume. Its one-hour reading also placed the price above several moving averages, with an RSI of 69.26.
The TICKER that is increasing mentions on X is $ICP ICP 1H Trade Setup. MARKET SENTIMENT: Greed at 73 supports long-side risk, but avoid chasing extensions without a clean pullback. MARKET BIAS: Higher timeframes are bullish, trend strength strong, and direction… pic.twitter.com/tiPQ7u9f40
— POLAR AI (@PolarBerAI) September 29, 2026
Taken together, those readings describe a market with stronger participation and a clear upward move. Rising open interest means more derivatives positions have been opened, although it does not reveal whether those positions will support the rally. The higher volume is useful because it shows that the move has drawn activity. It can also make the next reaction near resistance more revealing.
POLAR AI identified a pivot high near $3.358 and a pivot low near $3.109. Those are the levels from the analyst’s trade setup, so they should be checked against the live ICP price before publication. A sustained move above the upper level would show buyers pushing past that recent barrier. A return toward the lower level would show how much of the recovery buyers can defend.
Another analyst, Seyvion, pointed to CoinGlass exchange outflow data and said ICP has spent weeks leaving trading venues. That observation offers a different angle on supply. If the outflows continue, fewer tokens may be immediately available for spot sales on those exchanges. Outflows do not guarantee a price increase, since tokens can move for many reasons, but they give readers another measure to follow alongside network activity.
These are the main points behind the ICP discussion:
Network activity: ALLINCRYPTO reported 138.9 million transactions in a day and a peak of 1,608 transactions per second.
Trading participation: POLAR AI reported higher open interest, unusual volume, and increased ICP mentions.
Exchange supply: Seyvion pointed to weeks of exchange outflows as a possible reason spot selling could become harder to sustain.
The three observations do not prove that any single event caused ICP’s 16% recovery. They do explain why attention has moved beyond the price chart. Traders now have network usage, derivatives activity, and exchange flows to compare as the rally develops.
Stellar (XLM) Price Rises As Its Payments Use Case Returns To Focus
Stellar (XLM) price has also gained close to 8% over roughly 24 hours. Its story centres less on a transaction milestone and more on access to its payments network.
On September 22, BVNK announced that it had integrated Stellar into its stablecoin payments platform. The integration is live for BVNK enterprise customers across more than 130 supported countries. Businesses using the platform can access Stellar as a route for cross-border payments, merchant payouts, and treasury transfers through BVNK’s existing API.
That is a practical development for Stellar. Companies that already use BVNK do not need to build a separate connection to the network before they can use the new payment route. The integration could therefore make it easier for businesses to choose Stellar when moving stablecoins.
Read Also: Cardano News: ADA’s Biggest Strength May Be Something Most Investors Overlook
The effect on XLM price needs a closer look. Access to a network does not mean every BVNK customer will begin using it immediately, and stablecoin payment volume does not translate directly into an equal amount of XLM buying. Still, broader access creates an opportunity for more transactions on Stellar. Actual usage over the coming weeks will show how much businesses take advantage of it.
Akshay also noted that XLM was among the stronger large-cap altcoins during a mixed period for the broader crypto market. That relative strength helps explain why the move stands out. Stellar has long focused on payments, so the BVNK integration gives the current XLM price rise a development that fits the network’s existing purpose.
XLM Analysts See A Bigger Chart Setup, But Payments Usage Is The Nearer Test
The XLM rally has brought an ambitious chart prediction back into the discussion. TakeProfitNow argued that Stellar has repeatedly returned to a familiar price zone and shared a long-term trendline pointing above $2. The analyst described a possible gain of more than 7,700% from the area shown on the chart.
$XLM has been doing the same thing for YEARS. Pump. Dump. Back into the same liquidity zone. Repeat. And somehow people still think nothing is happening here. Price is sitting near the bottom again, while the long-term trendline points toward $2+. From this zone, that’s… pic.twitter.com/XoDdhqthDW
— @TakeProfitNow (@TakePr0fitN0w) September 28, 2026
That is an analyst’s projection, not a target established by today’s price move. Reaching $2 would require a much larger advance than the current 24-hour rise. Readers can follow the chart idea, but the BVNK integration offers a more immediate development to measure.
The key points for Stellar are straightforward:
XLM price: The token has gained close to 8% over roughly 24 hours.
Payments access: BVNK has made Stellar available to enterprise customers across more than 130 supported countries.
Next measure: Usage of Stellar through that integration will show whether access leads to sustained payment activity.
FAQs
Will XLM reach $10?
Stellar (XLM) reaching $10 is considered extremely unlikely in the near to medium term by most financial analysts and Markets.com price projections.
Can ICP reach $100?
Yes, Internet Computer (ICP) can reach $100, but it requires a massive market shift and a roughly 37x price increase from its current low levels.
Subscribe to our YouTube channel for daily crypto updates, market insights, and expert analysis.
The post Here’s Why Internet Computer (ICP) and Stellar (XLM) Prices Are Pumping Right Now appeared first on CaptainAltcoin.
Here’s Why Internet Computer (ICP) and Stellar (XLM) Prices Are Pumping Right Now
Internet Computer and Stellar have both climbed over the past 24 hours, but the details behind their moves are different. ICP has gained around 16% from yesterday’s low, and its price has risen more than 7% today alone.
XLM is up close to 8% over roughly 24 hours. A closer look at network activity, trading data, and a recent payments integration helps explain why both tokens are drawing interest.
Internet Computer (ICP) Price Climbs As Network Activity Enters The Conversation
The Internet Computer (ICP) price has recovered around 16% from yesterday’s bottom. That move becomes more interesting when placed beside a claim about activity on the network.
Crypto analyst ALLINCRYPTO reported that Internet Computer processed 138.9 million transactions in a single day and reached a peak rate of 1,608 transactions per second. Those figures put the network’s capacity in focus at a time when ICP price is climbing. The analyst also compared its performance with other major chains, although transaction counts across networks can use different definitions.
The distinction matters for the price discussion. A busy network gives traders a concrete development to examine beyond the chart, but a transaction total alone cannot show how many people used an application or how much economic value moved. The next useful question is whether developers and applications continue to bring activity to Internet Computer after this burst.
That possibility could help explain some of the renewed interest in ICP. A network that handles heavy activity gives projects room to build services for users. If that activity continues and applications gain users, the case for watching Internet Computer becomes stronger. The latest price rise shows that ICP has moved quickly; sustained use would provide a clearer picture of what supports that interest.
ICP Trading Data Shows Where The Next Price Test May Come
Trading conditions offer another explanation for the speed of the ICP move. POLAR AI reported increased ICP mentions on X, a 2.76% rise in open interest, mildly positive funding, and unusual trading volume. Its one-hour reading also placed the price above several moving averages, with an RSI of 69.26.
The TICKER that is increasing mentions on X is $ICP ICP 1H Trade Setup. MARKET SENTIMENT: Greed at 73 supports long-side risk, but avoid chasing extensions without a clean pullback. MARKET BIAS: Higher timeframes are bullish, trend strength strong, and direction… pic.twitter.com/tiPQ7u9f40
— POLAR AI (@PolarBerAI) September 29, 2026
Taken together, those readings describe a market with stronger participation and a clear upward move. Rising open interest means more derivatives positions have been opened, although it does not reveal whether those positions will support the rally. The higher volume is useful because it shows that the move has drawn activity. It can also make the next reaction near resistance more revealing.
POLAR AI identified a pivot high near $3.358 and a pivot low near $3.109. Those are the levels from the analyst’s trade setup, so they should be checked against the live ICP price before publication. A sustained move above the upper level would show buyers pushing past that recent barrier. A return toward the lower level would show how much of the recovery buyers can defend.
Another analyst, Seyvion, pointed to CoinGlass exchange outflow data and said ICP has spent weeks leaving trading venues. That observation offers a different angle on supply. If the outflows continue, fewer tokens may be immediately available for spot sales on those exchanges. Outflows do not guarantee a price increase, since tokens can move for many reasons, but they give readers another measure to follow alongside network activity.
These are the main points behind the ICP discussion:
Network activity: ALLINCRYPTO reported 138.9 million transactions in a day and a peak of 1,608 transactions per second.
Trading participation: POLAR AI reported higher open interest, unusual volume, and increased ICP mentions.
Exchange supply: Seyvion pointed to weeks of exchange outflows as a possible reason spot selling could become harder to sustain.
The three observations do not prove that any single event caused ICP’s 16% recovery. They do explain why attention has moved beyond the price chart. Traders now have network usage, derivatives activity, and exchange flows to compare as the rally develops.
Stellar (XLM) Price Rises As Its Payments Use Case Returns To Focus
Stellar (XLM) price has also gained close to 8% over roughly 24 hours. Its story centres less on a transaction milestone and more on access to its payments network.
On September 22, BVNK announced that it had integrated Stellar into its stablecoin payments platform. The integration is live for BVNK enterprise customers across more than 130 supported countries. Businesses using the platform can access Stellar as a route for cross-border payments, merchant payouts, and treasury transfers through BVNK’s existing API.
That is a practical development for Stellar. Companies that already use BVNK do not need to build a separate connection to the network before they can use the new payment route. The integration could therefore make it easier for businesses to choose Stellar when moving stablecoins.
Read Also: Cardano News: ADA’s Biggest Strength May Be Something Most Investors Overlook
The effect on XLM price needs a closer look. Access to a network does not mean every BVNK customer will begin using it immediately, and stablecoin payment volume does not translate directly into an equal amount of XLM buying. Still, broader access creates an opportunity for more transactions on Stellar. Actual usage over the coming weeks will show how much businesses take advantage of it.
Akshay also noted that XLM was among the stronger large-cap altcoins during a mixed period for the broader crypto market. That relative strength helps explain why the move stands out. Stellar has long focused on payments, so the BVNK integration gives the current XLM price rise a development that fits the network’s existing purpose.
XLM Analysts See A Bigger Chart Setup, But Payments Usage Is The Nearer Test
The XLM rally has brought an ambitious chart prediction back into the discussion. TakeProfitNow argued that Stellar has repeatedly returned to a familiar price zone and shared a long-term trendline pointing above $2. The analyst described a possible gain of more than 7,700% from the area shown on the chart.
$XLM has been doing the same thing for YEARS. Pump. Dump. Back into the same liquidity zone. Repeat. And somehow people still think nothing is happening here. Price is sitting near the bottom again, while the long-term trendline points toward $2+. From this zone, that’s… pic.twitter.com/XoDdhqthDW
— @TakeProfitNow (@TakePr0fitN0w) September 28, 2026
That is an analyst’s projection, not a target established by today’s price move. Reaching $2 would require a much larger advance than the current 24-hour rise. Readers can follow the chart idea, but the BVNK integration offers a more immediate development to measure.
The key points for Stellar are straightforward:
XLM price: The token has gained close to 8% over roughly 24 hours.
Payments access: BVNK has made Stellar available to enterprise customers across more than 130 supported countries.
Next measure: Usage of Stellar through that integration will show whether access leads to sustained payment activity.
FAQs
Will XLM reach $10?
Stellar (XLM) reaching $10 is considered extremely unlikely in the near to medium term by most financial analysts and Markets.com price projections.
Can ICP reach $100?
Yes, Internet Computer (ICP) can reach $100, but it requires a massive market shift and a roughly 37x price increase from its current low levels.
Subscribe to our YouTube channel for daily crypto updates, market insights, and expert analysis.
The post Here’s Why Internet Computer (ICP) and Stellar (XLM) Prices Are Pumping Right Now appeared first on CaptainAltcoin.
XLM is up close to 8% over roughly 24 hours. A closer look at network activity, trading data, and a recent payments integration helps explain why both tokens are drawing interest.
Internet Computer (ICP) Price Climbs As Network Activity Enters The Conversation
The Internet Computer (ICP) price has recovered around 16% from yesterday’s bottom. That move becomes more interesting when placed beside a claim about activity on the network.
Crypto analyst ALLINCRYPTO reported that Internet Computer processed 138.9 million transactions in a single day and reached a peak rate of 1,608 transactions per second. Those figures put the network’s capacity in focus at a time when ICP price is climbing. The analyst also compared its performance with other major chains, although transaction counts across networks can use different definitions.
The distinction matters for the price discussion. A busy network gives traders a concrete development to examine beyond the chart, but a transaction total alone cannot show how many people used an application or how much economic value moved. The next useful question is whether developers and applications continue to bring activity to Internet Computer after this burst.
That possibility could help explain some of the renewed interest in ICP. A network that handles heavy activity gives projects room to build services for users. If that activity continues and applications gain users, the case for watching Internet Computer becomes stronger. The latest price rise shows that ICP has moved quickly; sustained use would provide a clearer picture of what supports that interest.
ICP Trading Data Shows Where The Next Price Test May Come
Trading conditions offer another explanation for the speed of the ICP move. POLAR AI reported increased ICP mentions on X, a 2.76% rise in open interest, mildly positive funding, and unusual trading volume. Its one-hour reading also placed the price above several moving averages, with an RSI of 69.26.
The TICKER that is increasing mentions on X is $ICP ICP 1H Trade Setup. MARKET SENTIMENT: Greed at 73 supports long-side risk, but avoid chasing extensions without a clean pullback. MARKET BIAS: Higher timeframes are bullish, trend strength strong, and direction… pic.twitter.com/tiPQ7u9f40
— POLAR AI (@PolarBerAI) September 29, 2026
Taken together, those readings describe a market with stronger participation and a clear upward move. Rising open interest means more derivatives positions have been opened, although it does not reveal whether those positions will support the rally. The higher volume is useful because it shows that the move has drawn activity. It can also make the next reaction near resistance more revealing.
POLAR AI identified a pivot high near $3.358 and a pivot low near $3.109. Those are the levels from the analyst’s trade setup, so they should be checked against the live ICP price before publication. A sustained move above the upper level would show buyers pushing past that recent barrier. A return toward the lower level would show how much of the recovery buyers can defend.
Another analyst, Seyvion, pointed to CoinGlass exchange outflow data and said ICP has spent weeks leaving trading venues. That observation offers a different angle on supply. If the outflows continue, fewer tokens may be immediately available for spot sales on those exchanges. Outflows do not guarantee a price increase, since tokens can move for many reasons, but they give readers another measure to follow alongside network activity.
These are the main points behind the ICP discussion:
Network activity: ALLINCRYPTO reported 138.9 million transactions in a day and a peak of 1,608 transactions per second.
Trading participation: POLAR AI reported higher open interest, unusual volume, and increased ICP mentions.
Exchange supply: Seyvion pointed to weeks of exchange outflows as a possible reason spot selling could become harder to sustain.
The three observations do not prove that any single event caused ICP’s 16% recovery. They do explain why attention has moved beyond the price chart. Traders now have network usage, derivatives activity, and exchange flows to compare as the rally develops.
Stellar (XLM) Price Rises As Its Payments Use Case Returns To Focus
Stellar (XLM) price has also gained close to 8% over roughly 24 hours. Its story centres less on a transaction milestone and more on access to its payments network.
On September 22, BVNK announced that it had integrated Stellar into its stablecoin payments platform. The integration is live for BVNK enterprise customers across more than 130 supported countries. Businesses using the platform can access Stellar as a route for cross-border payments, merchant payouts, and treasury transfers through BVNK’s existing API.
That is a practical development for Stellar. Companies that already use BVNK do not need to build a separate connection to the network before they can use the new payment route. The integration could therefore make it easier for businesses to choose Stellar when moving stablecoins.
Read Also: Cardano News: ADA’s Biggest Strength May Be Something Most Investors Overlook
The effect on XLM price needs a closer look. Access to a network does not mean every BVNK customer will begin using it immediately, and stablecoin payment volume does not translate directly into an equal amount of XLM buying. Still, broader access creates an opportunity for more transactions on Stellar. Actual usage over the coming weeks will show how much businesses take advantage of it.
Akshay also noted that XLM was among the stronger large-cap altcoins during a mixed period for the broader crypto market. That relative strength helps explain why the move stands out. Stellar has long focused on payments, so the BVNK integration gives the current XLM price rise a development that fits the network’s existing purpose.
XLM Analysts See A Bigger Chart Setup, But Payments Usage Is The Nearer Test
The XLM rally has brought an ambitious chart prediction back into the discussion. TakeProfitNow argued that Stellar has repeatedly returned to a familiar price zone and shared a long-term trendline pointing above $2. The analyst described a possible gain of more than 7,700% from the area shown on the chart.
$XLM has been doing the same thing for YEARS. Pump. Dump. Back into the same liquidity zone. Repeat. And somehow people still think nothing is happening here. Price is sitting near the bottom again, while the long-term trendline points toward $2+. From this zone, that’s… pic.twitter.com/XoDdhqthDW
— @TakeProfitNow (@TakePr0fitN0w) September 28, 2026
That is an analyst’s projection, not a target established by today’s price move. Reaching $2 would require a much larger advance than the current 24-hour rise. Readers can follow the chart idea, but the BVNK integration offers a more immediate development to measure.
The key points for Stellar are straightforward:
XLM price: The token has gained close to 8% over roughly 24 hours.
Payments access: BVNK has made Stellar available to enterprise customers across more than 130 supported countries.
Next measure: Usage of Stellar through that integration will show whether access leads to sustained payment activity.
FAQs
Will XLM reach $10?
Stellar (XLM) reaching $10 is considered extremely unlikely in the near to medium term by most financial analysts and Markets.com price projections.
Can ICP reach $100?
Yes, Internet Computer (ICP) can reach $100, but it requires a massive market shift and a roughly 37x price increase from its current low levels.
Subscribe to our YouTube channel for daily crypto updates, market insights, and expert analysis.
The post Here’s Why Internet Computer (ICP) and Stellar (XLM) Prices Are Pumping Right Now appeared first on CaptainAltcoin.
1
232
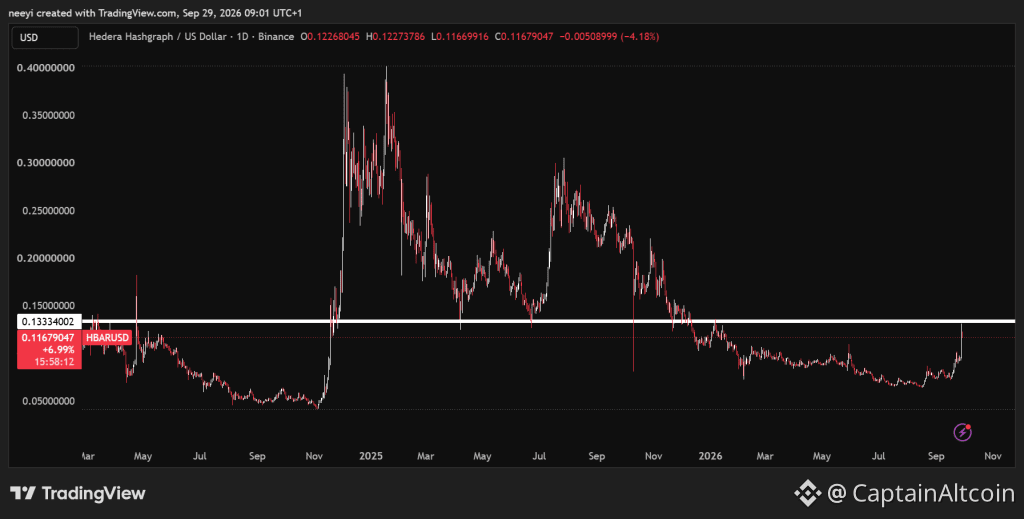
Maqola
Tarjimani ko‘rish
Hedera (HBAR) Price Could Be Starting the Move Bulls Have Been Waiting For!Hedera’s price made a sudden move on Monday after months of weak performance. HBAR climbed more than 30% and briefly reached $0.13 before giving back part of the advance. The move brings an old question back into focus: Has Hedera finally left its long decline behind, or will $0.13 stop the rally?
One analyst believes the jump could be the start of something bigger. The next few days should help show whether buyers can turn that view into a lasting move.
HBAR Erases Months of Weakness in Just a Few Days
HBAR reached a high near $0.13 on Monday, September 28, before closing around $0.12. That brought Hedera’s price back toward levels last reached in January 2026, after months of declines and brief recoveries that failed to last.
Hedera traded near $0.40 in January 2025, then spent much of the following period moving lower. The decline continued into 2026 before the price began trading in a tighter range. Monday’s jump covered ground that had taken months to lose.
HBARUSD Price Chart / TradingView.com
The main price levels are now clear:
$0.13 is the immediate resistance. HBAR reached that level on Monday but could not hold above it.
Around $0.12 marks Monday’s closing area. Holding near that price would preserve much of the recent advance.
A return to the previous trading range would weaken the breakout case. Buyers would then have another climb ahead of them.
That leaves HBAR in an interesting position. The rally was large enough to change the short term picture, but the first test of $0.13 ended with a pullback.
Why Credible Crypto Thinks Hedera’s Bigger Move Is Only Starting
Credible Crypto sees the recent jump as a possible early stage of a larger move. The analyst pointed to the HBAR/BTC pair, which measures Hedera’s performance against Bitcoin, and said a few days of strength had erased roughly 6 months of downward or sideways movement on that chart.
The analyst’s argument centers on the speed of the recovery. A long stretch of slow trading can end with a much faster move in the opposite direction. Credible Crypto believes HBAR may now be entering that faster phase after months of weak price action.
That view makes the rally worth watching, although the dollar chart still has its own obstacle. HBAR can outperform Bitcoin and still struggle to break above $0.13. Buyers need strength on both charts to make the case more convincing.
Hedera’s Long Accumulation Phase Could Be Paying Off
Hedera’s path from its January 2025 high was hardly a straight decline. Brief rallies interrupted the move, but none restored the earlier price level. The tighter trading that followed in 2026 gave buyers and sellers a narrower range to work through.
Monday’s rally may be the first clear sign that this period is ending. That possibility becomes stronger if HBAR keeps much of its advance and makes another attempt at $0.13. A quick return into the old range would point to more work ahead.
Interest in Hedera’s wider ecosystem could also play a part in market expectations. HBAR pays fees for activity on the Hedera network, which gives actual application use a connection to the token.
Claims about IBM and NVIDIA developments have circulated around the rally, though their role in Monday’s price move remains unclear. The price action gives us the firmer point to examine: HBAR rose quickly, reached $0.13, and then met resistance.
HBAR/BTC Chart Points to a Larger Expansion Move
The HBAR/BTC chart adds another reason this rally stands out. A token can rise in dollar terms when much of the crypto market is climbing. Strength against Bitcoin shows that HBAR has also performed better than the market’s largest asset.
@CredibleCrypto / X
Credible Crypto says the pair recovered about 6 months of weak or sideways price action in only a few days. If that relative strength continues, it could help HBAR make another attempt at its dollar resistance.
The 2 charts answer different questions:
HBAR/USD shows whether Hedera can clear $0.13. That is the nearby barrier following Monday’s pullback.
HBAR/BTC shows whether Hedera continues to outperform Bitcoin. Sustained strength there would support the analyst’s expansion view.
A strong reading on both would give bulls more to work with than Monday’s price jump alone. Weakness on either chart would make the next move harder to judge.
Read Also: This XRP Price Setup Could Catch a Lot of Traders Off Guard!
What Hedera Bulls Need to See Next
The immediate question is whether Hedera can turn $0.13 from resistance into a level that buyers can hold. Monday’s high brought HBAR to that area, but the close near $0.12 shows that the first attempt did not stick.
A renewed move above $0.13, followed by steady trading beyond it, would support Credible Crypto’s view that a larger advance has begun. Continued HBAR/BTC strength would add to that case. If $0.13 keeps rejecting the price, Hedera could spend more time below it despite Monday’s impressive rally.
FAQs
Is HBAR as good as XRP?
Whether Hedera (HBAR) is “as good as” Ripple (XRP) depends on your goals, as they use different technology and target different niches.
Can HBAR reach $100 in 10 years?
Reaching $100 for HBAR in 10 years is considered highly unlikely by most traditional market analysts and financial experts.
Subscribe to our YouTube channel for daily crypto updates, market insights, and expert analysis.
The post Hedera (HBAR) Price Could Be Starting the Move Bulls Have Been Waiting For! appeared first on CaptainAltcoin.
Hedera (HBAR) Price Could Be Starting the Move Bulls Have Been Waiting For!
Hedera’s price made a sudden move on Monday after months of weak performance. HBAR climbed more than 30% and briefly reached $0.13 before giving back part of the advance. The move brings an old question back into focus: Has Hedera finally left its long decline behind, or will $0.13 stop the rally?
One analyst believes the jump could be the start of something bigger. The next few days should help show whether buyers can turn that view into a lasting move.
HBAR Erases Months of Weakness in Just a Few Days
HBAR reached a high near $0.13 on Monday, September 28, before closing around $0.12. That brought Hedera’s price back toward levels last reached in January 2026, after months of declines and brief recoveries that failed to last.
Hedera traded near $0.40 in January 2025, then spent much of the following period moving lower. The decline continued into 2026 before the price began trading in a tighter range. Monday’s jump covered ground that had taken months to lose.
HBARUSD Price Chart / TradingView.com
The main price levels are now clear:
$0.13 is the immediate resistance. HBAR reached that level on Monday but could not hold above it.
Around $0.12 marks Monday’s closing area. Holding near that price would preserve much of the recent advance.
A return to the previous trading range would weaken the breakout case. Buyers would then have another climb ahead of them.
That leaves HBAR in an interesting position. The rally was large enough to change the short term picture, but the first test of $0.13 ended with a pullback.
Why Credible Crypto Thinks Hedera’s Bigger Move Is Only Starting
Credible Crypto sees the recent jump as a possible early stage of a larger move. The analyst pointed to the HBAR/BTC pair, which measures Hedera’s performance against Bitcoin, and said a few days of strength had erased roughly 6 months of downward or sideways movement on that chart.
The analyst’s argument centers on the speed of the recovery. A long stretch of slow trading can end with a much faster move in the opposite direction. Credible Crypto believes HBAR may now be entering that faster phase after months of weak price action.
That view makes the rally worth watching, although the dollar chart still has its own obstacle. HBAR can outperform Bitcoin and still struggle to break above $0.13. Buyers need strength on both charts to make the case more convincing.
Hedera’s Long Accumulation Phase Could Be Paying Off
Hedera’s path from its January 2025 high was hardly a straight decline. Brief rallies interrupted the move, but none restored the earlier price level. The tighter trading that followed in 2026 gave buyers and sellers a narrower range to work through.
Monday’s rally may be the first clear sign that this period is ending. That possibility becomes stronger if HBAR keeps much of its advance and makes another attempt at $0.13. A quick return into the old range would point to more work ahead.
Interest in Hedera’s wider ecosystem could also play a part in market expectations. HBAR pays fees for activity on the Hedera network, which gives actual application use a connection to the token.
Claims about IBM and NVIDIA developments have circulated around the rally, though their role in Monday’s price move remains unclear. The price action gives us the firmer point to examine: HBAR rose quickly, reached $0.13, and then met resistance.
HBAR/BTC Chart Points to a Larger Expansion Move
The HBAR/BTC chart adds another reason this rally stands out. A token can rise in dollar terms when much of the crypto market is climbing. Strength against Bitcoin shows that HBAR has also performed better than the market’s largest asset.
@CredibleCrypto / X
Credible Crypto says the pair recovered about 6 months of weak or sideways price action in only a few days. If that relative strength continues, it could help HBAR make another attempt at its dollar resistance.
The 2 charts answer different questions:
HBAR/USD shows whether Hedera can clear $0.13. That is the nearby barrier following Monday’s pullback.
HBAR/BTC shows whether Hedera continues to outperform Bitcoin. Sustained strength there would support the analyst’s expansion view.
A strong reading on both would give bulls more to work with than Monday’s price jump alone. Weakness on either chart would make the next move harder to judge.
Read Also: This XRP Price Setup Could Catch a Lot of Traders Off Guard!
What Hedera Bulls Need to See Next
The immediate question is whether Hedera can turn $0.13 from resistance into a level that buyers can hold. Monday’s high brought HBAR to that area, but the close near $0.12 shows that the first attempt did not stick.
A renewed move above $0.13, followed by steady trading beyond it, would support Credible Crypto’s view that a larger advance has begun. Continued HBAR/BTC strength would add to that case. If $0.13 keeps rejecting the price, Hedera could spend more time below it despite Monday’s impressive rally.
FAQs
Is HBAR as good as XRP?
Whether Hedera (HBAR) is “as good as” Ripple (XRP) depends on your goals, as they use different technology and target different niches.
Can HBAR reach $100 in 10 years?
Reaching $100 for HBAR in 10 years is considered highly unlikely by most traditional market analysts and financial experts.
Subscribe to our YouTube channel for daily crypto updates, market insights, and expert analysis.
The post Hedera (HBAR) Price Could Be Starting the Move Bulls Have Been Waiting For! appeared first on CaptainAltcoin.
One analyst believes the jump could be the start of something bigger. The next few days should help show whether buyers can turn that view into a lasting move.
HBAR Erases Months of Weakness in Just a Few Days
HBAR reached a high near $0.13 on Monday, September 28, before closing around $0.12. That brought Hedera’s price back toward levels last reached in January 2026, after months of declines and brief recoveries that failed to last.
Hedera traded near $0.40 in January 2025, then spent much of the following period moving lower. The decline continued into 2026 before the price began trading in a tighter range. Monday’s jump covered ground that had taken months to lose.
HBARUSD Price Chart / TradingView.com
The main price levels are now clear:
$0.13 is the immediate resistance. HBAR reached that level on Monday but could not hold above it.
Around $0.12 marks Monday’s closing area. Holding near that price would preserve much of the recent advance.
A return to the previous trading range would weaken the breakout case. Buyers would then have another climb ahead of them.
That leaves HBAR in an interesting position. The rally was large enough to change the short term picture, but the first test of $0.13 ended with a pullback.
Why Credible Crypto Thinks Hedera’s Bigger Move Is Only Starting
Credible Crypto sees the recent jump as a possible early stage of a larger move. The analyst pointed to the HBAR/BTC pair, which measures Hedera’s performance against Bitcoin, and said a few days of strength had erased roughly 6 months of downward or sideways movement on that chart.
The analyst’s argument centers on the speed of the recovery. A long stretch of slow trading can end with a much faster move in the opposite direction. Credible Crypto believes HBAR may now be entering that faster phase after months of weak price action.
That view makes the rally worth watching, although the dollar chart still has its own obstacle. HBAR can outperform Bitcoin and still struggle to break above $0.13. Buyers need strength on both charts to make the case more convincing.
Hedera’s Long Accumulation Phase Could Be Paying Off
Hedera’s path from its January 2025 high was hardly a straight decline. Brief rallies interrupted the move, but none restored the earlier price level. The tighter trading that followed in 2026 gave buyers and sellers a narrower range to work through.
Monday’s rally may be the first clear sign that this period is ending. That possibility becomes stronger if HBAR keeps much of its advance and makes another attempt at $0.13. A quick return into the old range would point to more work ahead.
Interest in Hedera’s wider ecosystem could also play a part in market expectations. HBAR pays fees for activity on the Hedera network, which gives actual application use a connection to the token.
Claims about IBM and NVIDIA developments have circulated around the rally, though their role in Monday’s price move remains unclear. The price action gives us the firmer point to examine: HBAR rose quickly, reached $0.13, and then met resistance.
HBAR/BTC Chart Points to a Larger Expansion Move
The HBAR/BTC chart adds another reason this rally stands out. A token can rise in dollar terms when much of the crypto market is climbing. Strength against Bitcoin shows that HBAR has also performed better than the market’s largest asset.
@CredibleCrypto / X
Credible Crypto says the pair recovered about 6 months of weak or sideways price action in only a few days. If that relative strength continues, it could help HBAR make another attempt at its dollar resistance.
The 2 charts answer different questions:
HBAR/USD shows whether Hedera can clear $0.13. That is the nearby barrier following Monday’s pullback.
HBAR/BTC shows whether Hedera continues to outperform Bitcoin. Sustained strength there would support the analyst’s expansion view.
A strong reading on both would give bulls more to work with than Monday’s price jump alone. Weakness on either chart would make the next move harder to judge.
Read Also: This XRP Price Setup Could Catch a Lot of Traders Off Guard!
What Hedera Bulls Need to See Next
The immediate question is whether Hedera can turn $0.13 from resistance into a level that buyers can hold. Monday’s high brought HBAR to that area, but the close near $0.12 shows that the first attempt did not stick.
A renewed move above $0.13, followed by steady trading beyond it, would support Credible Crypto’s view that a larger advance has begun. Continued HBAR/BTC strength would add to that case. If $0.13 keeps rejecting the price, Hedera could spend more time below it despite Monday’s impressive rally.
FAQs
Is HBAR as good as XRP?
Whether Hedera (HBAR) is “as good as” Ripple (XRP) depends on your goals, as they use different technology and target different niches.
Can HBAR reach $100 in 10 years?
Reaching $100 for HBAR in 10 years is considered highly unlikely by most traditional market analysts and financial experts.
Subscribe to our YouTube channel for daily crypto updates, market insights, and expert analysis.
The post Hedera (HBAR) Price Could Be Starting the Move Bulls Have Been Waiting For! appeared first on CaptainAltcoin.
275
Tasdiqlangan
Bugungi oltin narxi: Oltinning qulashi juda noodatiyOltinning so‘nggi keskin sotilishi oddatiy pasayish kuni emas edi.
Metall 28-sentabr kuni 3% dan ko‘proq aralashib, obligatsiya daromadliligi oshgani, dollar mustahkamlangani va neft narxlari inflyatsiya xavotirlarini tirik tutib turgani fonida yetti haftalik eng past ko‘rsatkichlar atrofida qisqa muddat savdo qildi. Spot oltin taxminan $4,110 gacha tushib, keyin biroz tiklandi, AQSH oltin fyucherslari esa ham qattiq qizilda yakunladi.
Harakatning ajralib turishi nafaqat pasayishning ko‘lamida, balki so‘nggi ikki o‘n yillikda oltin bunaqa kunni qanchalik kamdan-kam kuzatganida hamdir.
Bugungi oltin narxi: Oltinning qulashi juda noodatiy
Oltinning so‘nggi keskin sotilishi oddatiy pasayish kuni emas edi.
Metall 28-sentabr kuni 3% dan ko‘proq aralashib, obligatsiya daromadliligi oshgani, dollar mustahkamlangani va neft narxlari inflyatsiya xavotirlarini tirik tutib turgani fonida yetti haftalik eng past ko‘rsatkichlar atrofida qisqa muddat savdo qildi. Spot oltin taxminan $4,110 gacha tushib, keyin biroz tiklandi, AQSH oltin fyucherslari esa ham qattiq qizilda yakunladi.
Harakatning ajralib turishi nafaqat pasayishning ko‘lamida, balki so‘nggi ikki o‘n yillikda oltin bunaqa kunni qanchalik kamdan-kam kuzatganida hamdir.
Metall 28-sentabr kuni 3% dan ko‘proq aralashib, obligatsiya daromadliligi oshgani, dollar mustahkamlangani va neft narxlari inflyatsiya xavotirlarini tirik tutib turgani fonida yetti haftalik eng past ko‘rsatkichlar atrofida qisqa muddat savdo qildi. Spot oltin taxminan $4,110 gacha tushib, keyin biroz tiklandi, AQSH oltin fyucherslari esa ham qattiq qizilda yakunladi.
Harakatning ajralib turishi nafaqat pasayishning ko‘lamida, balki so‘nggi ikki o‘n yillikda oltin bunaqa kunni qanchalik kamdan-kam kuzatganida hamdir.
626
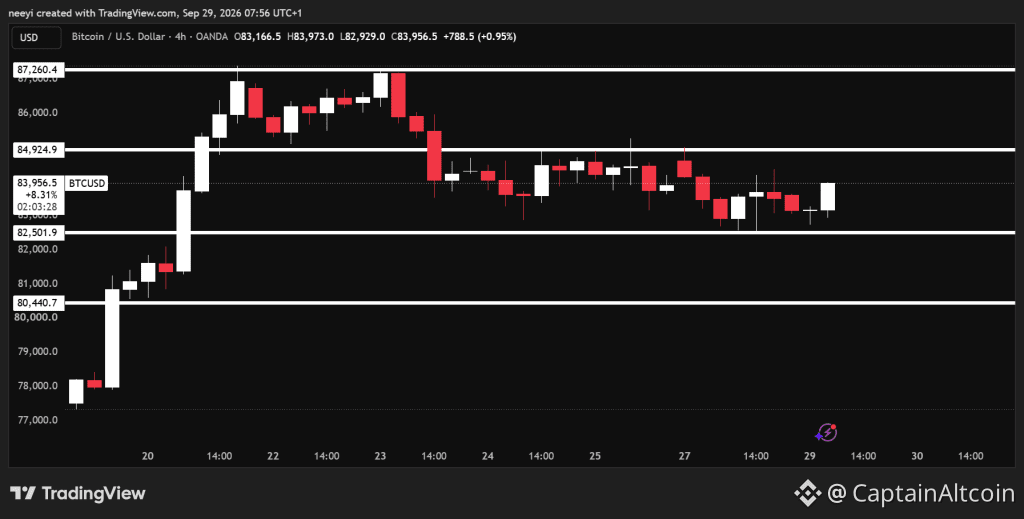
Maqola
Tarjimani ko‘rish
Crypto Price Predictions for Today, September 29: Bitcoin (BTC), Cardano (ADA), and Solana (SOL)Many cryptocurrencies are retracing after last week’s short rally, but the pullback has not played out the same way across the market. Bitcoin has settled into a familiar range, Cardano is testing whether its recent uptrend can hold, and Solana is trying to recover from an early dip. Their next moves may depend on whether buyers can clear nearby resistance before September 29 ends.
The indicator readings below come from Investing.com’s 5-hour charts. The price levels and scenarios use the market snapshots provided for this analysis.
Bitcoin Price Holds Within a Familiar Range After Its Recent Pullback
Bitcoin price has continued to retrace since reaching about $87,000 on September 26. It now trades near $83,800, though the decline appears to be slowing. A look at the BTC chart shows that most recent trading has taken place between $82,500 and $85,000.
BTCUSD Price Chart / TradingView.com
That range has been in place since September 23. Bitcoin briefly traded above it during last week’s rally, but its return to the range makes $85,000 an important level again. Buyers would need to push through that ceiling to give BTC another chance at $87,000 today. A drop below $82,500 could open the way toward $80,400.
Bitcoin’s indicators explain why the next move is still uncertain:
Indicator Value What The Reading Means RSI (14) 50.475 Bitcoin is close to the middle of the RSI range, so this reading gives neither side a clear advantage. Stochastic (9,6) 98.044 The reading is in overbought territory, which could make another immediate rise harder to sustain. MACD (12,26) -31.4 The negative reading points to weak recent momentum despite the apparent price stability. Bull/Bear Power (13) -732.39 The negative value shows that sellers still have some control over the current move.
The mixed readings fit Bitcoin’s price action. BTC has stopped falling as quickly, but the indicators do not yet show a convincing recovery. A break from its range would offer a clearer clue than another move within it.
Bitcoin Price Prediction For Today
Bullish scenario: A sustained move above $85,000 could take Bitcoin price back toward $87,000.
Neutral scenario: BTC could continue trading between $82,500 and $85,000 if neither side takes control.
Bearish scenario: A break below $82,500 could bring $80,400 into view before the day ends.
Cardano Price Tests Support Within Its Broader Uptrend
Cardano price has followed an upward pattern since July, but ADA has pulled back from its recent high near $0.26. The retracement appears to have steadied since Monday morning, with price now trading mainly between $0.240 and $0.25.
ADAUSD Price Chart / TradingView.com
That narrow range gives Cardano 2 useful levels to watch today. A move above $0.25 could put the recent $0.26 high back within reach. If ADA loses $0.240, the next downside level in this analysis is $0.233.
Cardano’s indicators offer a mixed picture:
Indicator Value What The Reading Means RSI (14) 48.076 ADA is near the middle of the RSI range, though slightly below its midpoint. Stochastic (9,6) 37.583 This reading points to soft short term momentum after the pullback. MACD (12,26) 0.001 The slightly positive value leaves room for recovery, but its size shows limited strength so far. Bull/Bear Power (13) -0.0088 The negative reading shows that sellers still have a small edge.
Cardano’s broader uptrend gives buyers a reason to defend the current area, but its short term readings have not settled the question. Whether ADA holds $0.240 may matter more today than the fact that it reached $0.26 last week.
Cardano Price Prediction For Today
Bullish scenario: A break above $0.25 could send Cardano price toward $0.26.
Neutral scenario: ADA could remain between $0.240 and $0.25 as the retracement stabilizes.
Bearish scenario: A move below $0.240 could take Cardano price down to about $0.233.
Solana Price Attempts To Recover After An Early Dip
Solana price reached about $125 on Sunday before retracing to roughly $116 earlier today. SOL has since recovered to around $118, putting the area near $119.9 back in focus.
SOLUSD Price Chart / TradingView.com
That recovery is a start, but Solana still needs to get above $120 to strengthen its case for another rise. Such a move could take SOL toward $122 today, with further upside possible if buying continues. A break below $116.4 would point the other way and could bring $113 into view.
The supplied Solana indicator readings match those listed for Bitcoin. Taken as provided, they describe a market with balanced RSI, an elevated Stochastic reading, and weak momentum measures:
Indicator Value What The Reading Means RSI (14) 50.475 SOL is near the RSI midpoint, so this reading alone does not establish a clear direction. Stochastic (9,6) 98.044 The elevated reading warns that the immediate recovery may be stretched. MACD (12,26) -31.4 This negative value points to weak momentum, though its scale should be checked against the Solana chart. Bull/Bear Power (13) -732.39 The negative value points to seller pressure, but this figure also needs confirmation against the Solana chart.
The last 2 figures deserve a check before publication because they are identical to Bitcoin’s readings. Solana’s price levels still provide a practical way to follow today’s move: $120 is the nearby test for buyers, and $116.4 is the level they need to defend.
Solana Price Prediction For Today
Bullish scenario: A break above $120 could take Solana price toward $122 or higher.
Neutral scenario: SOL could trade around $116.4 to $120 if the early recovery loses pace.
Bearish scenario: A break below $116.4 could send Solana price toward $113 before the day ends.
How much will 1 Solana be worth in 2030?
By the year 2030, analysts estimate that 1 Solana (SOL) will be worth anywhere from a conservative $140 base target up to aggressive institutional forecasts of $2,000 to $3,200+. Because cryptocurrency markets are highly speculative and volatile, experts calculate wide ranges depending on global adoption, technological maturity, and institutional inflows.
Will Cardano ADA reach $10?
Most mainstream forecasting models and algorithms consider it highly improbable for Cardano (ADA) to reach $10 in the near future, requiring a massive surge of roughly 2,400% to 3,900% from its current levels.
Subscribe to our YouTube channel for daily crypto updates, market insights, and expert analysis.
The post Crypto Price Predictions for Today, September 29: Bitcoin (BTC), Cardano (ADA), and Solana (SOL) appeared first on CaptainAltcoin.
Crypto Price Predictions for Today, September 29: Bitcoin (BTC), Cardano (ADA), and Solana (SOL)
Many cryptocurrencies are retracing after last week’s short rally, but the pullback has not played out the same way across the market. Bitcoin has settled into a familiar range, Cardano is testing whether its recent uptrend can hold, and Solana is trying to recover from an early dip. Their next moves may depend on whether buyers can clear nearby resistance before September 29 ends.
The indicator readings below come from Investing.com’s 5-hour charts. The price levels and scenarios use the market snapshots provided for this analysis.
Bitcoin Price Holds Within a Familiar Range After Its Recent Pullback
Bitcoin price has continued to retrace since reaching about $87,000 on September 26. It now trades near $83,800, though the decline appears to be slowing. A look at the BTC chart shows that most recent trading has taken place between $82,500 and $85,000.
BTCUSD Price Chart / TradingView.com
That range has been in place since September 23. Bitcoin briefly traded above it during last week’s rally, but its return to the range makes $85,000 an important level again. Buyers would need to push through that ceiling to give BTC another chance at $87,000 today. A drop below $82,500 could open the way toward $80,400.
Bitcoin’s indicators explain why the next move is still uncertain:
Indicator Value What The Reading Means RSI (14) 50.475 Bitcoin is close to the middle of the RSI range, so this reading gives neither side a clear advantage. Stochastic (9,6) 98.044 The reading is in overbought territory, which could make another immediate rise harder to sustain. MACD (12,26) -31.4 The negative reading points to weak recent momentum despite the apparent price stability. Bull/Bear Power (13) -732.39 The negative value shows that sellers still have some control over the current move.
The mixed readings fit Bitcoin’s price action. BTC has stopped falling as quickly, but the indicators do not yet show a convincing recovery. A break from its range would offer a clearer clue than another move within it.
Bitcoin Price Prediction For Today
Bullish scenario: A sustained move above $85,000 could take Bitcoin price back toward $87,000.
Neutral scenario: BTC could continue trading between $82,500 and $85,000 if neither side takes control.
Bearish scenario: A break below $82,500 could bring $80,400 into view before the day ends.
Cardano Price Tests Support Within Its Broader Uptrend
Cardano price has followed an upward pattern since July, but ADA has pulled back from its recent high near $0.26. The retracement appears to have steadied since Monday morning, with price now trading mainly between $0.240 and $0.25.
ADAUSD Price Chart / TradingView.com
That narrow range gives Cardano 2 useful levels to watch today. A move above $0.25 could put the recent $0.26 high back within reach. If ADA loses $0.240, the next downside level in this analysis is $0.233.
Cardano’s indicators offer a mixed picture:
Indicator Value What The Reading Means RSI (14) 48.076 ADA is near the middle of the RSI range, though slightly below its midpoint. Stochastic (9,6) 37.583 This reading points to soft short term momentum after the pullback. MACD (12,26) 0.001 The slightly positive value leaves room for recovery, but its size shows limited strength so far. Bull/Bear Power (13) -0.0088 The negative reading shows that sellers still have a small edge.
Cardano’s broader uptrend gives buyers a reason to defend the current area, but its short term readings have not settled the question. Whether ADA holds $0.240 may matter more today than the fact that it reached $0.26 last week.
Cardano Price Prediction For Today
Bullish scenario: A break above $0.25 could send Cardano price toward $0.26.
Neutral scenario: ADA could remain between $0.240 and $0.25 as the retracement stabilizes.
Bearish scenario: A move below $0.240 could take Cardano price down to about $0.233.
Solana Price Attempts To Recover After An Early Dip
Solana price reached about $125 on Sunday before retracing to roughly $116 earlier today. SOL has since recovered to around $118, putting the area near $119.9 back in focus.
SOLUSD Price Chart / TradingView.com
That recovery is a start, but Solana still needs to get above $120 to strengthen its case for another rise. Such a move could take SOL toward $122 today, with further upside possible if buying continues. A break below $116.4 would point the other way and could bring $113 into view.
The supplied Solana indicator readings match those listed for Bitcoin. Taken as provided, they describe a market with balanced RSI, an elevated Stochastic reading, and weak momentum measures:
Indicator Value What The Reading Means RSI (14) 50.475 SOL is near the RSI midpoint, so this reading alone does not establish a clear direction. Stochastic (9,6) 98.044 The elevated reading warns that the immediate recovery may be stretched. MACD (12,26) -31.4 This negative value points to weak momentum, though its scale should be checked against the Solana chart. Bull/Bear Power (13) -732.39 The negative value points to seller pressure, but this figure also needs confirmation against the Solana chart.
The last 2 figures deserve a check before publication because they are identical to Bitcoin’s readings. Solana’s price levels still provide a practical way to follow today’s move: $120 is the nearby test for buyers, and $116.4 is the level they need to defend.
Solana Price Prediction For Today
Bullish scenario: A break above $120 could take Solana price toward $122 or higher.
Neutral scenario: SOL could trade around $116.4 to $120 if the early recovery loses pace.
Bearish scenario: A break below $116.4 could send Solana price toward $113 before the day ends.
How much will 1 Solana be worth in 2030?
By the year 2030, analysts estimate that 1 Solana (SOL) will be worth anywhere from a conservative $140 base target up to aggressive institutional forecasts of $2,000 to $3,200+. Because cryptocurrency markets are highly speculative and volatile, experts calculate wide ranges depending on global adoption, technological maturity, and institutional inflows.
Will Cardano ADA reach $10?
Most mainstream forecasting models and algorithms consider it highly improbable for Cardano (ADA) to reach $10 in the near future, requiring a massive surge of roughly 2,400% to 3,900% from its current levels.
Subscribe to our YouTube channel for daily crypto updates, market insights, and expert analysis.
The post Crypto Price Predictions for Today, September 29: Bitcoin (BTC), Cardano (ADA), and Solana (SOL) appeared first on CaptainAltcoin.
The indicator readings below come from Investing.com’s 5-hour charts. The price levels and scenarios use the market snapshots provided for this analysis.
Bitcoin Price Holds Within a Familiar Range After Its Recent Pullback
Bitcoin price has continued to retrace since reaching about $87,000 on September 26. It now trades near $83,800, though the decline appears to be slowing. A look at the BTC chart shows that most recent trading has taken place between $82,500 and $85,000.
BTCUSD Price Chart / TradingView.com
That range has been in place since September 23. Bitcoin briefly traded above it during last week’s rally, but its return to the range makes $85,000 an important level again. Buyers would need to push through that ceiling to give BTC another chance at $87,000 today. A drop below $82,500 could open the way toward $80,400.
Bitcoin’s indicators explain why the next move is still uncertain:
Indicator Value What The Reading Means RSI (14) 50.475 Bitcoin is close to the middle of the RSI range, so this reading gives neither side a clear advantage. Stochastic (9,6) 98.044 The reading is in overbought territory, which could make another immediate rise harder to sustain. MACD (12,26) -31.4 The negative reading points to weak recent momentum despite the apparent price stability. Bull/Bear Power (13) -732.39 The negative value shows that sellers still have some control over the current move.
The mixed readings fit Bitcoin’s price action. BTC has stopped falling as quickly, but the indicators do not yet show a convincing recovery. A break from its range would offer a clearer clue than another move within it.
Bitcoin Price Prediction For Today
Bullish scenario: A sustained move above $85,000 could take Bitcoin price back toward $87,000.
Neutral scenario: BTC could continue trading between $82,500 and $85,000 if neither side takes control.
Bearish scenario: A break below $82,500 could bring $80,400 into view before the day ends.
Cardano Price Tests Support Within Its Broader Uptrend
Cardano price has followed an upward pattern since July, but ADA has pulled back from its recent high near $0.26. The retracement appears to have steadied since Monday morning, with price now trading mainly between $0.240 and $0.25.
ADAUSD Price Chart / TradingView.com
That narrow range gives Cardano 2 useful levels to watch today. A move above $0.25 could put the recent $0.26 high back within reach. If ADA loses $0.240, the next downside level in this analysis is $0.233.
Cardano’s indicators offer a mixed picture:
Indicator Value What The Reading Means RSI (14) 48.076 ADA is near the middle of the RSI range, though slightly below its midpoint. Stochastic (9,6) 37.583 This reading points to soft short term momentum after the pullback. MACD (12,26) 0.001 The slightly positive value leaves room for recovery, but its size shows limited strength so far. Bull/Bear Power (13) -0.0088 The negative reading shows that sellers still have a small edge.
Cardano’s broader uptrend gives buyers a reason to defend the current area, but its short term readings have not settled the question. Whether ADA holds $0.240 may matter more today than the fact that it reached $0.26 last week.
Cardano Price Prediction For Today
Bullish scenario: A break above $0.25 could send Cardano price toward $0.26.
Neutral scenario: ADA could remain between $0.240 and $0.25 as the retracement stabilizes.
Bearish scenario: A move below $0.240 could take Cardano price down to about $0.233.
Solana Price Attempts To Recover After An Early Dip
Solana price reached about $125 on Sunday before retracing to roughly $116 earlier today. SOL has since recovered to around $118, putting the area near $119.9 back in focus.
SOLUSD Price Chart / TradingView.com
That recovery is a start, but Solana still needs to get above $120 to strengthen its case for another rise. Such a move could take SOL toward $122 today, with further upside possible if buying continues. A break below $116.4 would point the other way and could bring $113 into view.
The supplied Solana indicator readings match those listed for Bitcoin. Taken as provided, they describe a market with balanced RSI, an elevated Stochastic reading, and weak momentum measures:
Indicator Value What The Reading Means RSI (14) 50.475 SOL is near the RSI midpoint, so this reading alone does not establish a clear direction. Stochastic (9,6) 98.044 The elevated reading warns that the immediate recovery may be stretched. MACD (12,26) -31.4 This negative value points to weak momentum, though its scale should be checked against the Solana chart. Bull/Bear Power (13) -732.39 The negative value points to seller pressure, but this figure also needs confirmation against the Solana chart.
The last 2 figures deserve a check before publication because they are identical to Bitcoin’s readings. Solana’s price levels still provide a practical way to follow today’s move: $120 is the nearby test for buyers, and $116.4 is the level they need to defend.
Solana Price Prediction For Today
Bullish scenario: A break above $120 could take Solana price toward $122 or higher.
Neutral scenario: SOL could trade around $116.4 to $120 if the early recovery loses pace.
Bearish scenario: A break below $116.4 could send Solana price toward $113 before the day ends.
How much will 1 Solana be worth in 2030?
By the year 2030, analysts estimate that 1 Solana (SOL) will be worth anywhere from a conservative $140 base target up to aggressive institutional forecasts of $2,000 to $3,200+. Because cryptocurrency markets are highly speculative and volatile, experts calculate wide ranges depending on global adoption, technological maturity, and institutional inflows.
Will Cardano ADA reach $10?
Most mainstream forecasting models and algorithms consider it highly improbable for Cardano (ADA) to reach $10 in the near future, requiring a massive surge of roughly 2,400% to 3,900% from its current levels.
Subscribe to our YouTube channel for daily crypto updates, market insights, and expert analysis.
The post Crypto Price Predictions for Today, September 29: Bitcoin (BTC), Cardano (ADA), and Solana (SOL) appeared first on CaptainAltcoin.
180
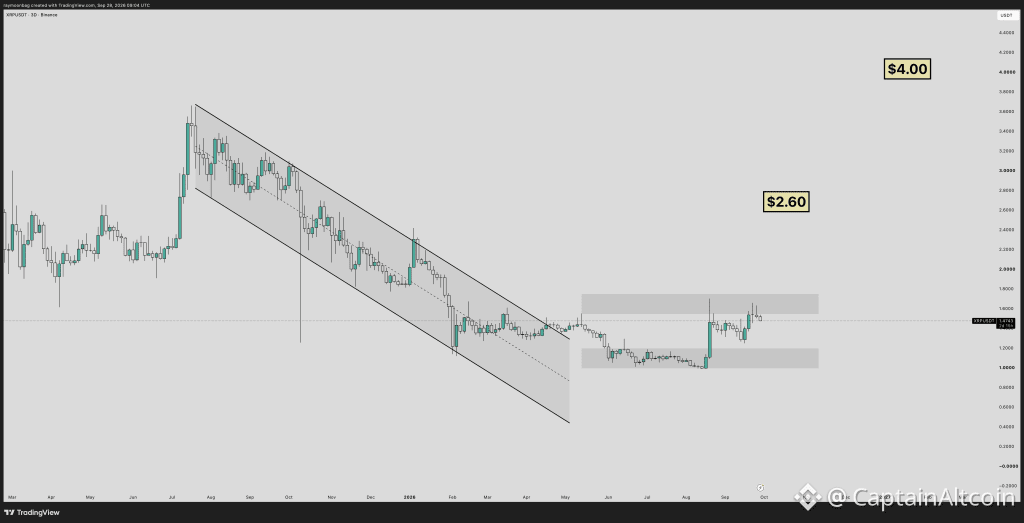
Maqola
Tarjimani ko‘rish
This XRP Price Setup Could Catch a Lot of Traders Off Guard!XRP price is doing very little right now. The token is trading around $1.49-$1.50, and after the recent volatility across the crypto market, the current price action almost looks boring.
That is exactly why a new chart from trader Ray (@moonbag) stands out.
Ray does not post about XRP particularly often, but his latest update is straightforward: he believes XRP is going to “pump hard.” More importantly, the chart attached to that view lays out a path that looks far more grounded than some of the extreme XRP targets that regularly circulate online.
His first major target sits around $2.60, followed by a much larger move toward $4.00 if XRP can finally escape the range that has contained price for months.
At the same time, XRP has some very different forces pulling on it. The fallout from the recent Bitget hack has left tens of millions of dollars worth of stolen XRP in attacker-controlled wallets, while Ripple continues expanding deeper into corporate treasury and cross-border payments.
XRP Is Sitting Right Below an Important Resistance Zone
Ray’s chart uses the three-day XRP/USDT timeframe, and the broader structure is easy to see.
XRP spent much of the second half of 2025 and early 2026 inside a long descending channel. Price eventually escaped that structure and moved into a much flatter trading range.
Since roughly June, the chart shows XRP repeatedly holding a broad support area around $1.00-$1.20, while sellers have continued to appear around $1.55-$1.70.
XRP is now trading near $1.50, which puts it right underneath that upper zone.
Source: X/@moonbag
That makes the current area far more important than the lack of day-to-day movement might imply.
A clean move through roughly $1.60-$1.70 would take the XRP price beyond a resistance area that has capped several attempts higher. If buyers cannot do that, the token could simply remain trapped inside the same range.
Ray clearly expects the former.
His message was brief:
“XRP is going to make some people upset when it pumps hard.”
The chart places $2.60 as the first larger upside objective and $4 farther above it.
Why the $2.60 XRP Target Looks Reasonable on This Chart
The $2.60 level is interesting because it does not require XRP to immediately revisit its previous highs.
A move from roughly $1.50 to $2.60 would represent an increase of around 73%.
That is substantial, but XRP has already shown that it can make moves of that size when momentum returns. More importantly, $2.60 also sits inside a price region XRP traded around during its previous decline.
That gives the target some technical context rather than making it an arbitrary round number.
The larger $4 target is a different proposition.
From $1.50, XRP would need to rise roughly 167% to reach $4. That would take price beyond the major highs visible on Ray’s chart and require a much broader change in market conditions.
So I would separate the two targets.
The move toward $2.60 becomes much easier to take seriously if XRP clears the current resistance range. The $4 target would probably require another leg of sustained market-wide risk appetite after that.
For now, $1.60-$1.70 is the level that decides whether Ray’s idea starts becoming relevant at all.
Bitget Hacker Still Controls Around $75 Million in XRP
There is also an immediate risk hanging over the market.
Bitget suffered a major security breach on September 24, with the exchange later putting the total value of assets transferred to attacker-controlled addresses at approximately $387.5 million.
XRP represented a meaningful portion of that theft.
Nearly 103 million XRP was initially moved into five accounts. By September 26, roughly 54 million XRP worth about $83 million had already left the original holding wallets, while approximately 49 million XRP worth around $75 million remained.
There is an important detail here.
Native XRP cannot simply be frozen by Ripple.
The XRP Ledger allows issuers to place freeze controls on tokens they issue, but XRP itself is the native asset of the network. Ripple therefore has no built-in mechanism that lets it stop those attacker-controlled XRP wallets from sending funds. Centralized exchanges can still block or restrict stolen funds once they arrive on accounts under their control.
That is very different from centralized stablecoins. Tether and Circle were able to freeze roughly $320,000 in related USDT and USDC because those assets include issuer-controlled blacklist functionality.
For XRP price, the concern is fairly obvious.
The remaining tokens do not automatically become sell pressure simply because an attacker controls them, and the transfers so far do not prove the XRP has been sold. But traders still have to account for the possibility that some of that supply eventually reaches the market.
That could make a move through the current resistance area more difficult in the short term.
Ripple Keeps Expanding Into Corporate Treasury
The longer-term picture around Ripple is moving in almost the opposite direction.
Ripple has spent the last several years trying to push deeper into institutional payments, liquidity management and corporate finance.
One of its biggest moves was the $1 billion acquisition of GTreasury in 2025.
GTreasury has more than four decades of experience in treasury management, and Ripple described the deal as its entry into the multi-trillion-dollar corporate treasury market. The combined business is aimed at helping companies move money around the clock, manage liquidity and incorporate digital assets into treasury operations.
The scale of the existing business is notable.
Ripple said GTreasury’s platform facilitated roughly $13 trillion in payments volume during 2025 for customers ranging from smaller businesses to Fortune 500 companies.
That does not mean $13 trillion is flowing through XRP.
It does, however, show how aggressively Ripple is trying to embed its infrastructure inside traditional corporate finance rather than relying entirely on crypto-native activity.
For more crypto news and price predictions, click here.
Subscribe to our YouTube channel for daily crypto updates, market insights, and expert analysis.
The post This XRP Price Setup Could Catch a Lot of Traders Off Guard! appeared first on CaptainAltcoin.
This XRP Price Setup Could Catch a Lot of Traders Off Guard!
XRP price is doing very little right now. The token is trading around $1.49-$1.50, and after the recent volatility across the crypto market, the current price action almost looks boring.
That is exactly why a new chart from trader Ray (@moonbag) stands out.
Ray does not post about XRP particularly often, but his latest update is straightforward: he believes XRP is going to “pump hard.” More importantly, the chart attached to that view lays out a path that looks far more grounded than some of the extreme XRP targets that regularly circulate online.
His first major target sits around $2.60, followed by a much larger move toward $4.00 if XRP can finally escape the range that has contained price for months.
At the same time, XRP has some very different forces pulling on it. The fallout from the recent Bitget hack has left tens of millions of dollars worth of stolen XRP in attacker-controlled wallets, while Ripple continues expanding deeper into corporate treasury and cross-border payments.
XRP Is Sitting Right Below an Important Resistance Zone
Ray’s chart uses the three-day XRP/USDT timeframe, and the broader structure is easy to see.
XRP spent much of the second half of 2025 and early 2026 inside a long descending channel. Price eventually escaped that structure and moved into a much flatter trading range.
Since roughly June, the chart shows XRP repeatedly holding a broad support area around $1.00-$1.20, while sellers have continued to appear around $1.55-$1.70.
XRP is now trading near $1.50, which puts it right underneath that upper zone.
Source: X/@moonbag
That makes the current area far more important than the lack of day-to-day movement might imply.
A clean move through roughly $1.60-$1.70 would take the XRP price beyond a resistance area that has capped several attempts higher. If buyers cannot do that, the token could simply remain trapped inside the same range.
Ray clearly expects the former.
His message was brief:
“XRP is going to make some people upset when it pumps hard.”
The chart places $2.60 as the first larger upside objective and $4 farther above it.
Why the $2.60 XRP Target Looks Reasonable on This Chart
The $2.60 level is interesting because it does not require XRP to immediately revisit its previous highs.
A move from roughly $1.50 to $2.60 would represent an increase of around 73%.
That is substantial, but XRP has already shown that it can make moves of that size when momentum returns. More importantly, $2.60 also sits inside a price region XRP traded around during its previous decline.
That gives the target some technical context rather than making it an arbitrary round number.
The larger $4 target is a different proposition.
From $1.50, XRP would need to rise roughly 167% to reach $4. That would take price beyond the major highs visible on Ray’s chart and require a much broader change in market conditions.
So I would separate the two targets.
The move toward $2.60 becomes much easier to take seriously if XRP clears the current resistance range. The $4 target would probably require another leg of sustained market-wide risk appetite after that.
For now, $1.60-$1.70 is the level that decides whether Ray’s idea starts becoming relevant at all.
Bitget Hacker Still Controls Around $75 Million in XRP
There is also an immediate risk hanging over the market.
Bitget suffered a major security breach on September 24, with the exchange later putting the total value of assets transferred to attacker-controlled addresses at approximately $387.5 million.
XRP represented a meaningful portion of that theft.
Nearly 103 million XRP was initially moved into five accounts. By September 26, roughly 54 million XRP worth about $83 million had already left the original holding wallets, while approximately 49 million XRP worth around $75 million remained.
There is an important detail here.
Native XRP cannot simply be frozen by Ripple.
The XRP Ledger allows issuers to place freeze controls on tokens they issue, but XRP itself is the native asset of the network. Ripple therefore has no built-in mechanism that lets it stop those attacker-controlled XRP wallets from sending funds. Centralized exchanges can still block or restrict stolen funds once they arrive on accounts under their control.
That is very different from centralized stablecoins. Tether and Circle were able to freeze roughly $320,000 in related USDT and USDC because those assets include issuer-controlled blacklist functionality.
For XRP price, the concern is fairly obvious.
The remaining tokens do not automatically become sell pressure simply because an attacker controls them, and the transfers so far do not prove the XRP has been sold. But traders still have to account for the possibility that some of that supply eventually reaches the market.
That could make a move through the current resistance area more difficult in the short term.
Ripple Keeps Expanding Into Corporate Treasury
The longer-term picture around Ripple is moving in almost the opposite direction.
Ripple has spent the last several years trying to push deeper into institutional payments, liquidity management and corporate finance.
One of its biggest moves was the $1 billion acquisition of GTreasury in 2025.
GTreasury has more than four decades of experience in treasury management, and Ripple described the deal as its entry into the multi-trillion-dollar corporate treasury market. The combined business is aimed at helping companies move money around the clock, manage liquidity and incorporate digital assets into treasury operations.
The scale of the existing business is notable.
Ripple said GTreasury’s platform facilitated roughly $13 trillion in payments volume during 2025 for customers ranging from smaller businesses to Fortune 500 companies.
That does not mean $13 trillion is flowing through XRP.
It does, however, show how aggressively Ripple is trying to embed its infrastructure inside traditional corporate finance rather than relying entirely on crypto-native activity.
For more crypto news and price predictions, click here.
Subscribe to our YouTube channel for daily crypto updates, market insights, and expert analysis.
The post This XRP Price Setup Could Catch a Lot of Traders Off Guard! appeared first on CaptainAltcoin.
That is exactly why a new chart from trader Ray (@moonbag) stands out.
Ray does not post about XRP particularly often, but his latest update is straightforward: he believes XRP is going to “pump hard.” More importantly, the chart attached to that view lays out a path that looks far more grounded than some of the extreme XRP targets that regularly circulate online.
His first major target sits around $2.60, followed by a much larger move toward $4.00 if XRP can finally escape the range that has contained price for months.
At the same time, XRP has some very different forces pulling on it. The fallout from the recent Bitget hack has left tens of millions of dollars worth of stolen XRP in attacker-controlled wallets, while Ripple continues expanding deeper into corporate treasury and cross-border payments.
XRP Is Sitting Right Below an Important Resistance Zone
Ray’s chart uses the three-day XRP/USDT timeframe, and the broader structure is easy to see.
XRP spent much of the second half of 2025 and early 2026 inside a long descending channel. Price eventually escaped that structure and moved into a much flatter trading range.
Since roughly June, the chart shows XRP repeatedly holding a broad support area around $1.00-$1.20, while sellers have continued to appear around $1.55-$1.70.
XRP is now trading near $1.50, which puts it right underneath that upper zone.
Source: X/@moonbag
That makes the current area far more important than the lack of day-to-day movement might imply.
A clean move through roughly $1.60-$1.70 would take the XRP price beyond a resistance area that has capped several attempts higher. If buyers cannot do that, the token could simply remain trapped inside the same range.
Ray clearly expects the former.
His message was brief:
“XRP is going to make some people upset when it pumps hard.”
The chart places $2.60 as the first larger upside objective and $4 farther above it.
Why the $2.60 XRP Target Looks Reasonable on This Chart
The $2.60 level is interesting because it does not require XRP to immediately revisit its previous highs.
A move from roughly $1.50 to $2.60 would represent an increase of around 73%.
That is substantial, but XRP has already shown that it can make moves of that size when momentum returns. More importantly, $2.60 also sits inside a price region XRP traded around during its previous decline.
That gives the target some technical context rather than making it an arbitrary round number.
The larger $4 target is a different proposition.
From $1.50, XRP would need to rise roughly 167% to reach $4. That would take price beyond the major highs visible on Ray’s chart and require a much broader change in market conditions.
So I would separate the two targets.
The move toward $2.60 becomes much easier to take seriously if XRP clears the current resistance range. The $4 target would probably require another leg of sustained market-wide risk appetite after that.
For now, $1.60-$1.70 is the level that decides whether Ray’s idea starts becoming relevant at all.
Bitget Hacker Still Controls Around $75 Million in XRP
There is also an immediate risk hanging over the market.
Bitget suffered a major security breach on September 24, with the exchange later putting the total value of assets transferred to attacker-controlled addresses at approximately $387.5 million.
XRP represented a meaningful portion of that theft.
Nearly 103 million XRP was initially moved into five accounts. By September 26, roughly 54 million XRP worth about $83 million had already left the original holding wallets, while approximately 49 million XRP worth around $75 million remained.
There is an important detail here.
Native XRP cannot simply be frozen by Ripple.
The XRP Ledger allows issuers to place freeze controls on tokens they issue, but XRP itself is the native asset of the network. Ripple therefore has no built-in mechanism that lets it stop those attacker-controlled XRP wallets from sending funds. Centralized exchanges can still block or restrict stolen funds once they arrive on accounts under their control.
That is very different from centralized stablecoins. Tether and Circle were able to freeze roughly $320,000 in related USDT and USDC because those assets include issuer-controlled blacklist functionality.
For XRP price, the concern is fairly obvious.
The remaining tokens do not automatically become sell pressure simply because an attacker controls them, and the transfers so far do not prove the XRP has been sold. But traders still have to account for the possibility that some of that supply eventually reaches the market.
That could make a move through the current resistance area more difficult in the short term.
Ripple Keeps Expanding Into Corporate Treasury
The longer-term picture around Ripple is moving in almost the opposite direction.
Ripple has spent the last several years trying to push deeper into institutional payments, liquidity management and corporate finance.
One of its biggest moves was the $1 billion acquisition of GTreasury in 2025.
GTreasury has more than four decades of experience in treasury management, and Ripple described the deal as its entry into the multi-trillion-dollar corporate treasury market. The combined business is aimed at helping companies move money around the clock, manage liquidity and incorporate digital assets into treasury operations.
The scale of the existing business is notable.
Ripple said GTreasury’s platform facilitated roughly $13 trillion in payments volume during 2025 for customers ranging from smaller businesses to Fortune 500 companies.
That does not mean $13 trillion is flowing through XRP.
It does, however, show how aggressively Ripple is trying to embed its infrastructure inside traditional corporate finance rather than relying entirely on crypto-native activity.
For more crypto news and price predictions, click here.
Subscribe to our YouTube channel for daily crypto updates, market insights, and expert analysis.
The post This XRP Price Setup Could Catch a Lot of Traders Off Guard! appeared first on CaptainAltcoin.
1
408
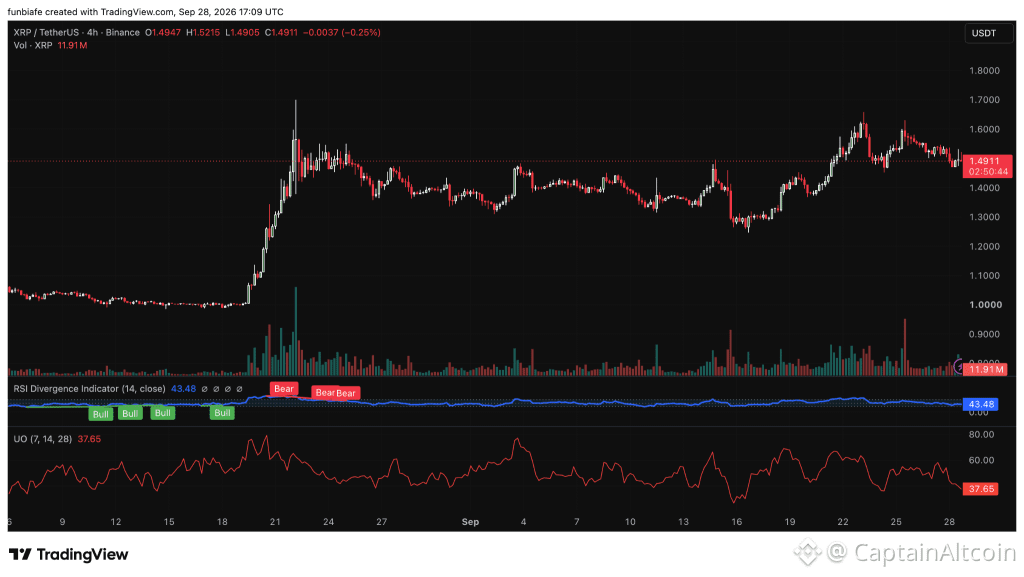
Maqola
Tarjimani ko‘rish
XRP Price Prediction for Today (September 29)XRP is trading around $1.4911, down 0.25% on the latest 4-hour candle. After climbing from the $0.90 area to a recent high near $1.70, it’s spent the last several sessions moving sideways as traders wait for the next big move.
The XRP price has already bounced from a pullback toward $1.30, which shows buyers are still active. The problem is sellers keep defending the higher levels, stopping a clean breakout above resistance.
XRP Price Momentum Is Sending Mixed Signals
We had a look at the XRP chart, and one thing jumps out right away: the market is stuck between support at $1.40 and resistance at $1.60. The latest candle traded between $1.4905 and $1.5215, with volume at 11.91 million XRP.
The momentum indicators are not offering a clear answer either. The RSI is at 43.48, which places the XRP price slightly on the bearish side of neutral. At the same time, the chart contains both bullish and bearish divergence patterns. Some readings point to recovery potential, while others point to weakness.
Source: TradingView
That conflict explains why XRP has struggled to develop a clear trend despite recovering from its recent low. The Ultimate Oscillator stands at 37.65, placing it in oversold territory. Readings below 40 often appear when selling pressure begins to ease.
It does not guarantee a rally, but it does increase the chances of buyers stepping back into the market. Taken together, the indicators point to a market that has not fully committed to either direction.
Regulation and Adoption Still Matter for the XRP Price
The chart is important, but the XRP price continues to depend on larger fundamental developments. Regulatory clarity is still one of the biggest unknowns for XRP. The SEC case against Ripple has hung over the market for years, and a final resolution could remove one of the biggest obstacles keeping institutions on the sidelines.
A lot of investors still see that outcome as one of the strongest potential catalysts for the XRP price. Ripple’s On-Demand Liquidity business is another thing to watch, the company wants to use XRP as a bridge asset for cross-border payments.
Growth in transaction activity and financial partnerships could strengthen the utility case for the token over time. Competition remains a factor, though. Stablecoins, CBDCs, and other payment-focused blockchain networks are all competing for a share of the same market.
Read Also: XRP Price at $10,000? The T-Bill Theory That Has the Community Talking
XRP Price Outlook for September 29
XRP starts today’s session near the middle of its range, so both bullish and bearish scenarios are still on the table. If buyers push XRP above $1.50 and then clear $1.60, the next targets are $1.70 and $1.80. If sellers take control and force XRP below $1.40, support levels come into view at $1.30, $1.20, $1.10, and eventually the psychological $1.00 mark.
The broader backdrop remains constructive. The XRP price is still above its key longer-term moving averages, including the 30-day SMA at $1.41 and the 200-day SMA at $1.28. For today, the XRP price appears to be waiting for a catalyst. The $1.50 and $1.40 levels remain the most important areas to watch, and a decisive move beyond either level could determine where XRP heads next.
FAQs
Is XRP oversold
The Ultimate Oscillator is at 37.65, which is considered oversold territory. This can sometimes increase the chances of a short-term recovery if buying activity returns.
Why is Ripple’s On-Demand Liquidity important for XRP
Ripple’s On-Demand Liquidity (ODL) service uses XRP as a bridge asset for cross-border transactions. Growth in ODL activity could increase real-world demand for the token.
Subscribe to our YouTube channel for daily crypto updates, market insights, and expert analysis.
The post XRP Price Prediction for Today (September 29) appeared first on CaptainAltcoin.
XRP Price Prediction for Today (September 29)
XRP is trading around $1.4911, down 0.25% on the latest 4-hour candle. After climbing from the $0.90 area to a recent high near $1.70, it’s spent the last several sessions moving sideways as traders wait for the next big move.
The XRP price has already bounced from a pullback toward $1.30, which shows buyers are still active. The problem is sellers keep defending the higher levels, stopping a clean breakout above resistance.
XRP Price Momentum Is Sending Mixed Signals
We had a look at the XRP chart, and one thing jumps out right away: the market is stuck between support at $1.40 and resistance at $1.60. The latest candle traded between $1.4905 and $1.5215, with volume at 11.91 million XRP.
The momentum indicators are not offering a clear answer either. The RSI is at 43.48, which places the XRP price slightly on the bearish side of neutral. At the same time, the chart contains both bullish and bearish divergence patterns. Some readings point to recovery potential, while others point to weakness.
Source: TradingView
That conflict explains why XRP has struggled to develop a clear trend despite recovering from its recent low. The Ultimate Oscillator stands at 37.65, placing it in oversold territory. Readings below 40 often appear when selling pressure begins to ease.
It does not guarantee a rally, but it does increase the chances of buyers stepping back into the market. Taken together, the indicators point to a market that has not fully committed to either direction.
Regulation and Adoption Still Matter for the XRP Price
The chart is important, but the XRP price continues to depend on larger fundamental developments. Regulatory clarity is still one of the biggest unknowns for XRP. The SEC case against Ripple has hung over the market for years, and a final resolution could remove one of the biggest obstacles keeping institutions on the sidelines.
A lot of investors still see that outcome as one of the strongest potential catalysts for the XRP price. Ripple’s On-Demand Liquidity business is another thing to watch, the company wants to use XRP as a bridge asset for cross-border payments.
Growth in transaction activity and financial partnerships could strengthen the utility case for the token over time. Competition remains a factor, though. Stablecoins, CBDCs, and other payment-focused blockchain networks are all competing for a share of the same market.
Read Also: XRP Price at $10,000? The T-Bill Theory That Has the Community Talking
XRP Price Outlook for September 29
XRP starts today’s session near the middle of its range, so both bullish and bearish scenarios are still on the table. If buyers push XRP above $1.50 and then clear $1.60, the next targets are $1.70 and $1.80. If sellers take control and force XRP below $1.40, support levels come into view at $1.30, $1.20, $1.10, and eventually the psychological $1.00 mark.
The broader backdrop remains constructive. The XRP price is still above its key longer-term moving averages, including the 30-day SMA at $1.41 and the 200-day SMA at $1.28. For today, the XRP price appears to be waiting for a catalyst. The $1.50 and $1.40 levels remain the most important areas to watch, and a decisive move beyond either level could determine where XRP heads next.
FAQs
Is XRP oversold
The Ultimate Oscillator is at 37.65, which is considered oversold territory. This can sometimes increase the chances of a short-term recovery if buying activity returns.
Why is Ripple’s On-Demand Liquidity important for XRP
Ripple’s On-Demand Liquidity (ODL) service uses XRP as a bridge asset for cross-border transactions. Growth in ODL activity could increase real-world demand for the token.
Subscribe to our YouTube channel for daily crypto updates, market insights, and expert analysis.
The post XRP Price Prediction for Today (September 29) appeared first on CaptainAltcoin.
The XRP price has already bounced from a pullback toward $1.30, which shows buyers are still active. The problem is sellers keep defending the higher levels, stopping a clean breakout above resistance.
XRP Price Momentum Is Sending Mixed Signals
We had a look at the XRP chart, and one thing jumps out right away: the market is stuck between support at $1.40 and resistance at $1.60. The latest candle traded between $1.4905 and $1.5215, with volume at 11.91 million XRP.
The momentum indicators are not offering a clear answer either. The RSI is at 43.48, which places the XRP price slightly on the bearish side of neutral. At the same time, the chart contains both bullish and bearish divergence patterns. Some readings point to recovery potential, while others point to weakness.
Source: TradingView
That conflict explains why XRP has struggled to develop a clear trend despite recovering from its recent low. The Ultimate Oscillator stands at 37.65, placing it in oversold territory. Readings below 40 often appear when selling pressure begins to ease.
It does not guarantee a rally, but it does increase the chances of buyers stepping back into the market. Taken together, the indicators point to a market that has not fully committed to either direction.
Regulation and Adoption Still Matter for the XRP Price
The chart is important, but the XRP price continues to depend on larger fundamental developments. Regulatory clarity is still one of the biggest unknowns for XRP. The SEC case against Ripple has hung over the market for years, and a final resolution could remove one of the biggest obstacles keeping institutions on the sidelines.
A lot of investors still see that outcome as one of the strongest potential catalysts for the XRP price. Ripple’s On-Demand Liquidity business is another thing to watch, the company wants to use XRP as a bridge asset for cross-border payments.
Growth in transaction activity and financial partnerships could strengthen the utility case for the token over time. Competition remains a factor, though. Stablecoins, CBDCs, and other payment-focused blockchain networks are all competing for a share of the same market.
Read Also: XRP Price at $10,000? The T-Bill Theory That Has the Community Talking
XRP Price Outlook for September 29
XRP starts today’s session near the middle of its range, so both bullish and bearish scenarios are still on the table. If buyers push XRP above $1.50 and then clear $1.60, the next targets are $1.70 and $1.80. If sellers take control and force XRP below $1.40, support levels come into view at $1.30, $1.20, $1.10, and eventually the psychological $1.00 mark.
The broader backdrop remains constructive. The XRP price is still above its key longer-term moving averages, including the 30-day SMA at $1.41 and the 200-day SMA at $1.28. For today, the XRP price appears to be waiting for a catalyst. The $1.50 and $1.40 levels remain the most important areas to watch, and a decisive move beyond either level could determine where XRP heads next.
FAQs
Is XRP oversold
The Ultimate Oscillator is at 37.65, which is considered oversold territory. This can sometimes increase the chances of a short-term recovery if buying activity returns.
Why is Ripple’s On-Demand Liquidity important for XRP
Ripple’s On-Demand Liquidity (ODL) service uses XRP as a bridge asset for cross-border transactions. Growth in ODL activity could increase real-world demand for the token.
Subscribe to our YouTube channel for daily crypto updates, market insights, and expert analysis.
The post XRP Price Prediction for Today (September 29) appeared first on CaptainAltcoin.
3
388
Tarjimani ko‘rish
Cardano News: ADA’s Biggest Strength May Be Something Most Investors OverlookCardano is once again attracting attention for something that has little to do with short-term ADA price action: the way the network itself was designed.
Crypto commentator Dori recently argued that Cardano occupies an unusual position among major blockchains because it combines some of Bitcoin’s monetary characteristics with the programmability normally associated with Ethereum.
The comparison is easy to understand. Bitcoin is valued partly because of its fixed supply and conservative monetary structure, while Ethereum became the dominant smart-contract platform. Cardano attempts to bring capped supply, proof-of-stake decentralization, and programmable applications into the same network.
That argument arrives while ADA is having a difficult trading session. The token was rejected around $0.25935 and initially fell back toward the daily pivot at $0.25027. Selling has continued since then, with ADA trading around $0.245 at the time of writing, down roughly 4% on the day.
Why This Analyst Thinks Cardano Is Different
Dori described Cardano as a network with both Bitcoin-like scarcity and Ethereum-like programmability.
ADA has a maximum supply of 45 billion tokens, giving the asset a defined upper limit rather than an indefinitely expanding supply.
But the analyst’s argument goes deeper than token supply.
Cardano uses the Extended Unspent Transaction Output, or eUTXO, model. It builds on the UTXO structure used by Bitcoin while extending it to support smart contracts and multiple assets. Ethereum, by comparison, uses an account-based model.
This difference changes how applications behave on the two networks.
On Cardano, smart contracts work as validators. They do not independently initiate transactions or move funds. Instead, users construct a transaction and the validator determines whether that transaction meets the required conditions.
That distinction is one of the less-discussed parts of Cardano’s design.
Cardano Avoids One of Ethereum’s Best-Known Smart Contract Risks
One example raised by Dori is reentrancy.
Reentrancy became infamous after the 2016 DAO exploit on Ethereum. In an account-based smart-contract environment, one contract can call another contract, which can then call back into the first contract before its original execution has finished.
Cardano’s developer documentation says this specific type of attack is structurally impossible under its eUTXO model.
I think Cardano is the only chain with both Bitcoin's scarcity and Ethereum's programmability. People call $BTC digital gold and $ETH digital oil. $ADA has the properties of both. There are tons of chains out there, but most are Ethereum forks or built the same way. Many also…
— dori (@dori_coin) September 28, 2026
A Cardano transaction is evaluated as a complete unit. Validators approve or reject the transaction rather than calling one another midway through execution, removing the mechanism that traditional reentrancy relies on.
Cardano’s native assets also work differently from ERC-20 tokens.
On Ethereum, an ERC-20 token is itself implemented through a smart contract. Cardano handles native assets directly at the ledger level, meaning each token does not require its own ERC-20-style contract with a separate set of permissions and potential vulnerabilities.
That does not make Cardano applications immune to exploits. Smart contracts can still contain faulty logic, and Cardano’s own security documentation discusses risks such as datum manipulation and double-satisfaction vulnerabilities. But its architecture removes some attack paths that developers on account-based networks have to explicitly defend against.
Read also: ChatGPT Predicts a Surprising End to 2026 for Cardano
Bitcoin Scarcity With Smart Contracts
This is where Dori’s Bitcoin-Ethereum comparison comes from.
Bitcoin pioneered the UTXO model and a hard supply limit. Ethereum showed how much demand could emerge around programmable blockchain applications.
Cardano uses a UTXO-derived accounting model while supporting smart contracts through eUTXO.
The analyst believes that combination is underappreciated because ADA is usually compared with Ethereum, Solana, and other smart-contract platforms based on transaction activity, DeFi usage, or token price.
Looking only at those metrics can overlook the architectural differences underneath them.
Cardano was built around a different set of trade-offs rather than simply copying Ethereum’s account-based design.
Whether the market eventually assigns greater value to those differences will depend on adoption. A technically distinct design is only useful economically if developers build applications people want to use and those applications bring capital and activity onto the network.
ADA Price Rejected Near $0.26
Even though the longer-term discussion around Cardano’s architecture remains intact, ADA’s short-term chart has weakened.
ADA tested the upper end of its 24-hour range around $0.25935 but failed to push through it.
That rejection was initially followed by a move toward the $0.25027 daily pivot. Trading volume was also elevated, with the figure provided showing a 26.7% increase to roughly $572.8 million.
Current market data now shows that sellers have pushed ADA below that pivot. The token has traded around $0.244-$0.247 during Monday’s session after opening near $0.255.
The rejection is especially notable because ADA had been recovering strongly from its September lows.
The token traded near $0.19 on September 16 before reaching approximately $0.265 on September 26. That represents a big recovery in less than two weeks, but ADA has now given back part of that move.
For more crypto news and price predictions, click here.
Subscribe to our YouTube channel for daily crypto updates, market insights, and expert analysis.
The post Cardano News: ADA’s Biggest Strength May Be Something Most Investors Overlook appeared first on CaptainAltcoin.
Cardano News: ADA’s Biggest Strength May Be Something Most Investors Overlook
Cardano is once again attracting attention for something that has little to do with short-term ADA price action: the way the network itself was designed.
Crypto commentator Dori recently argued that Cardano occupies an unusual position among major blockchains because it combines some of Bitcoin’s monetary characteristics with the programmability normally associated with Ethereum.
The comparison is easy to understand. Bitcoin is valued partly because of its fixed supply and conservative monetary structure, while Ethereum became the dominant smart-contract platform. Cardano attempts to bring capped supply, proof-of-stake decentralization, and programmable applications into the same network.
That argument arrives while ADA is having a difficult trading session. The token was rejected around $0.25935 and initially fell back toward the daily pivot at $0.25027. Selling has continued since then, with ADA trading around $0.245 at the time of writing, down roughly 4% on the day.
Why This Analyst Thinks Cardano Is Different
Dori described Cardano as a network with both Bitcoin-like scarcity and Ethereum-like programmability.
ADA has a maximum supply of 45 billion tokens, giving the asset a defined upper limit rather than an indefinitely expanding supply.
But the analyst’s argument goes deeper than token supply.
Cardano uses the Extended Unspent Transaction Output, or eUTXO, model. It builds on the UTXO structure used by Bitcoin while extending it to support smart contracts and multiple assets. Ethereum, by comparison, uses an account-based model.
This difference changes how applications behave on the two networks.
On Cardano, smart contracts work as validators. They do not independently initiate transactions or move funds. Instead, users construct a transaction and the validator determines whether that transaction meets the required conditions.
That distinction is one of the less-discussed parts of Cardano’s design.
Cardano Avoids One of Ethereum’s Best-Known Smart Contract Risks
One example raised by Dori is reentrancy.
Reentrancy became infamous after the 2016 DAO exploit on Ethereum. In an account-based smart-contract environment, one contract can call another contract, which can then call back into the first contract before its original execution has finished.
Cardano’s developer documentation says this specific type of attack is structurally impossible under its eUTXO model.
I think Cardano is the only chain with both Bitcoin's scarcity and Ethereum's programmability. People call $BTC digital gold and $ETH digital oil. $ADA has the properties of both. There are tons of chains out there, but most are Ethereum forks or built the same way. Many also…
— dori (@dori_coin) September 28, 2026
A Cardano transaction is evaluated as a complete unit. Validators approve or reject the transaction rather than calling one another midway through execution, removing the mechanism that traditional reentrancy relies on.
Cardano’s native assets also work differently from ERC-20 tokens.
On Ethereum, an ERC-20 token is itself implemented through a smart contract. Cardano handles native assets directly at the ledger level, meaning each token does not require its own ERC-20-style contract with a separate set of permissions and potential vulnerabilities.
That does not make Cardano applications immune to exploits. Smart contracts can still contain faulty logic, and Cardano’s own security documentation discusses risks such as datum manipulation and double-satisfaction vulnerabilities. But its architecture removes some attack paths that developers on account-based networks have to explicitly defend against.
Read also: ChatGPT Predicts a Surprising End to 2026 for Cardano
Bitcoin Scarcity With Smart Contracts
This is where Dori’s Bitcoin-Ethereum comparison comes from.
Bitcoin pioneered the UTXO model and a hard supply limit. Ethereum showed how much demand could emerge around programmable blockchain applications.
Cardano uses a UTXO-derived accounting model while supporting smart contracts through eUTXO.
The analyst believes that combination is underappreciated because ADA is usually compared with Ethereum, Solana, and other smart-contract platforms based on transaction activity, DeFi usage, or token price.
Looking only at those metrics can overlook the architectural differences underneath them.
Cardano was built around a different set of trade-offs rather than simply copying Ethereum’s account-based design.
Whether the market eventually assigns greater value to those differences will depend on adoption. A technically distinct design is only useful economically if developers build applications people want to use and those applications bring capital and activity onto the network.
ADA Price Rejected Near $0.26
Even though the longer-term discussion around Cardano’s architecture remains intact, ADA’s short-term chart has weakened.
ADA tested the upper end of its 24-hour range around $0.25935 but failed to push through it.
That rejection was initially followed by a move toward the $0.25027 daily pivot. Trading volume was also elevated, with the figure provided showing a 26.7% increase to roughly $572.8 million.
Current market data now shows that sellers have pushed ADA below that pivot. The token has traded around $0.244-$0.247 during Monday’s session after opening near $0.255.
The rejection is especially notable because ADA had been recovering strongly from its September lows.
The token traded near $0.19 on September 16 before reaching approximately $0.265 on September 26. That represents a big recovery in less than two weeks, but ADA has now given back part of that move.
For more crypto news and price predictions, click here.
Subscribe to our YouTube channel for daily crypto updates, market insights, and expert analysis.
The post Cardano News: ADA’s Biggest Strength May Be Something Most Investors Overlook appeared first on CaptainAltcoin.
Crypto commentator Dori recently argued that Cardano occupies an unusual position among major blockchains because it combines some of Bitcoin’s monetary characteristics with the programmability normally associated with Ethereum.
The comparison is easy to understand. Bitcoin is valued partly because of its fixed supply and conservative monetary structure, while Ethereum became the dominant smart-contract platform. Cardano attempts to bring capped supply, proof-of-stake decentralization, and programmable applications into the same network.
That argument arrives while ADA is having a difficult trading session. The token was rejected around $0.25935 and initially fell back toward the daily pivot at $0.25027. Selling has continued since then, with ADA trading around $0.245 at the time of writing, down roughly 4% on the day.
Why This Analyst Thinks Cardano Is Different
Dori described Cardano as a network with both Bitcoin-like scarcity and Ethereum-like programmability.
ADA has a maximum supply of 45 billion tokens, giving the asset a defined upper limit rather than an indefinitely expanding supply.
But the analyst’s argument goes deeper than token supply.
Cardano uses the Extended Unspent Transaction Output, or eUTXO, model. It builds on the UTXO structure used by Bitcoin while extending it to support smart contracts and multiple assets. Ethereum, by comparison, uses an account-based model.
This difference changes how applications behave on the two networks.
On Cardano, smart contracts work as validators. They do not independently initiate transactions or move funds. Instead, users construct a transaction and the validator determines whether that transaction meets the required conditions.
That distinction is one of the less-discussed parts of Cardano’s design.
Cardano Avoids One of Ethereum’s Best-Known Smart Contract Risks
One example raised by Dori is reentrancy.
Reentrancy became infamous after the 2016 DAO exploit on Ethereum. In an account-based smart-contract environment, one contract can call another contract, which can then call back into the first contract before its original execution has finished.
Cardano’s developer documentation says this specific type of attack is structurally impossible under its eUTXO model.
I think Cardano is the only chain with both Bitcoin's scarcity and Ethereum's programmability. People call $BTC digital gold and $ETH digital oil. $ADA has the properties of both. There are tons of chains out there, but most are Ethereum forks or built the same way. Many also…
— dori (@dori_coin) September 28, 2026
A Cardano transaction is evaluated as a complete unit. Validators approve or reject the transaction rather than calling one another midway through execution, removing the mechanism that traditional reentrancy relies on.
Cardano’s native assets also work differently from ERC-20 tokens.
On Ethereum, an ERC-20 token is itself implemented through a smart contract. Cardano handles native assets directly at the ledger level, meaning each token does not require its own ERC-20-style contract with a separate set of permissions and potential vulnerabilities.
That does not make Cardano applications immune to exploits. Smart contracts can still contain faulty logic, and Cardano’s own security documentation discusses risks such as datum manipulation and double-satisfaction vulnerabilities. But its architecture removes some attack paths that developers on account-based networks have to explicitly defend against.
Read also: ChatGPT Predicts a Surprising End to 2026 for Cardano
Bitcoin Scarcity With Smart Contracts
This is where Dori’s Bitcoin-Ethereum comparison comes from.
Bitcoin pioneered the UTXO model and a hard supply limit. Ethereum showed how much demand could emerge around programmable blockchain applications.
Cardano uses a UTXO-derived accounting model while supporting smart contracts through eUTXO.
The analyst believes that combination is underappreciated because ADA is usually compared with Ethereum, Solana, and other smart-contract platforms based on transaction activity, DeFi usage, or token price.
Looking only at those metrics can overlook the architectural differences underneath them.
Cardano was built around a different set of trade-offs rather than simply copying Ethereum’s account-based design.
Whether the market eventually assigns greater value to those differences will depend on adoption. A technically distinct design is only useful economically if developers build applications people want to use and those applications bring capital and activity onto the network.
ADA Price Rejected Near $0.26
Even though the longer-term discussion around Cardano’s architecture remains intact, ADA’s short-term chart has weakened.
ADA tested the upper end of its 24-hour range around $0.25935 but failed to push through it.
That rejection was initially followed by a move toward the $0.25027 daily pivot. Trading volume was also elevated, with the figure provided showing a 26.7% increase to roughly $572.8 million.
Current market data now shows that sellers have pushed ADA below that pivot. The token has traded around $0.244-$0.247 during Monday’s session after opening near $0.255.
The rejection is especially notable because ADA had been recovering strongly from its September lows.
The token traded near $0.19 on September 16 before reaching approximately $0.265 on September 26. That represents a big recovery in less than two weeks, but ADA has now given back part of that move.
For more crypto news and price predictions, click here.
Subscribe to our YouTube channel for daily crypto updates, market insights, and expert analysis.
The post Cardano News: ADA’s Biggest Strength May Be Something Most Investors Overlook appeared first on CaptainAltcoin.
137
Tarjimani ko‘rish
Can Kaspa (KAS) Reach $1? Here’s What the Math SaysKaspa holders have been talking about the $1 target for a long time, and two recent analyst posts have brought that debate back into focus.
At first glance, $1 can look ambitious when KAS is trading far below that level. But once the target is translated into market capitalization, the number becomes easier to evaluate.
Kaspa has a maximum supply of roughly 28.7 billion KAS. At $1 per token, that would put its fully diluted valuation at around $28.7 billion. Kaspa itself lists a maximum supply of about 28.7 billion tokens.
That is a large valuation, but crypto history has already produced several projects that traded well above it.
What Would a $1 Kaspa Price Actually Mean?
The math is straightforward.
With around 28.7 billion KAS as the projected maximum supply:
$1 KAS = roughly $28.7 billion fully diluted valuation.
That figure is the center of the argument made by both analysts.
One analyst pointed out that Dogecoin, Cardano, Avalanche and Shiba Inu all reached valuations in the tens of billions of dollars during the 2021 cycle. DOGE and ADA went much higher than the level Kaspa would need for a $1 price.
The point isn’t that Kaspa will automatically follow the same path. Those projects benefited from very different market conditions, liquidity, narratives and investor bases.
But the comparison does show that a valuation around $29 billion is not without precedent in crypto.
Why Analysts Think $1 KAS Is Achievable
The bullish argument goes beyond market cap comparisons.
Kaspa is a proof-of-work BlockDAG network built around GHOSTDAG. Unlike a conventional blockchain that discards competing blocks, Kaspa can include parallel blocks and order them into consensus. The network currently operates at 10 blocks per second.
That gives Kaspa a different technical profile from many older proof-of-work networks.
Most people hear $1 $Kas and immediately dismiss it without actually doing the math. At max supply that’s roughly a $29B valuation. In the last cycle we watched Dogecoin, Cardano, and even some weaker stories trade well above that level. So the market has already shown it’s… https://t.co/pgcG7CYuCi
— CryptOG (@realhus2) September 28, 2026
It was also fair launched, with no premine, pre-sale or insider allocation. Kaspa says every KAS in circulation has been mined publicly since the network launched in November 2021.
For investors who value Bitcoin-like monetary characteristics but want faster settlement and more throughput, that combination forms much of the KAS investment thesis.
Toccata Has Expanded the Kaspa Story
Kaspa has also moved beyond being viewed only as a fast proof-of-work network.
Toccata introduced programmability directly to the Kaspa base layer and has been live on mainnet since June 30, 2026. It added programmable UTXOs, covenants, transaction introspection and support for ZK-based application designs.
That has given Kaspa a broader narrative around applications and programmable finance.
Other development efforts remain in progress. vProgs is still under construction, while DAGKnight is planned as a later consensus upgrade.
This is important for the $1 argument because a higher valuation becomes easier to justify if Kaspa develops an active application ecosystem rather than remaining primarily a payment and settlement network.
Crypto Has Already Seen Much Bigger Valuations
The historical comparison is probably the easiest part of the bullish case to understand.
A $29 billion valuation would still sit far below the peaks reached by some of the largest altcoins during previous cycles.
Dogecoin crossed roughly $90 billion at its 2021 peak. Cardano also reached around that range, while Shiba Inu moved above $40 billion.
Even projects with smaller ecosystems than the largest smart-contract platforms have reached valuations comparable to or above what Kaspa would require at $1.
This doesn’t make $1 inevitable. It only shows that the valuation itself isn’t outside the range the crypto market has previously assigned to popular altcoins.
Read also: Crypto Expert Buys More Kaspa as His KAS Conviction Grows
The Real Challenge Is Demand
The harder part is getting enough capital into KAS to support that valuation.
Technology alone cannot do that.
Kaspa would need continued developer activity, deeper liquidity, exchange access, user growth and a reason for investors to hold KAS through a full market cycle.
That was also the key caveat raised by the analysts discussing the $1 target.
Kaspa can have a technically strong network and still fail to reach $1 if adoption remains limited or the broader crypto market enters a weaker phase.
A $29 billion valuation therefore depends heavily on what Kaspa becomes over the next several years.
So, Can Kaspa Reach $1?
From a market-cap perspective, $1 is certainly within the range crypto has seen before.
Kaspa would need a valuation of roughly $28.7 billion, which is well below the historical peaks reached by DOGE, ADA and several other large altcoins.
The harder question is whether Kaspa can build enough demand to deserve that valuation.
Its 10 BPS network, GHOSTDAG architecture, fair-launch structure and Toccata programmability give bulls plenty to work with. But future development, adoption and liquidity will ultimately determine whether those technical advantages translate into a much higher KAS price.
So the math doesn’t make $1 look impossible.
For more crypto news and price predictions, click here.
Subscribe to our YouTube channel for daily crypto updates, market insights, and expert analysis.
The post Can Kaspa (KAS) Reach $1? Here’s What the Math Says appeared first on CaptainAltcoin.
Can Kaspa (KAS) Reach $1? Here’s What the Math Says
Kaspa holders have been talking about the $1 target for a long time, and two recent analyst posts have brought that debate back into focus.
At first glance, $1 can look ambitious when KAS is trading far below that level. But once the target is translated into market capitalization, the number becomes easier to evaluate.
Kaspa has a maximum supply of roughly 28.7 billion KAS. At $1 per token, that would put its fully diluted valuation at around $28.7 billion. Kaspa itself lists a maximum supply of about 28.7 billion tokens.
That is a large valuation, but crypto history has already produced several projects that traded well above it.
What Would a $1 Kaspa Price Actually Mean?
The math is straightforward.
With around 28.7 billion KAS as the projected maximum supply:
$1 KAS = roughly $28.7 billion fully diluted valuation.
That figure is the center of the argument made by both analysts.
One analyst pointed out that Dogecoin, Cardano, Avalanche and Shiba Inu all reached valuations in the tens of billions of dollars during the 2021 cycle. DOGE and ADA went much higher than the level Kaspa would need for a $1 price.
The point isn’t that Kaspa will automatically follow the same path. Those projects benefited from very different market conditions, liquidity, narratives and investor bases.
But the comparison does show that a valuation around $29 billion is not without precedent in crypto.
Why Analysts Think $1 KAS Is Achievable
The bullish argument goes beyond market cap comparisons.
Kaspa is a proof-of-work BlockDAG network built around GHOSTDAG. Unlike a conventional blockchain that discards competing blocks, Kaspa can include parallel blocks and order them into consensus. The network currently operates at 10 blocks per second.
That gives Kaspa a different technical profile from many older proof-of-work networks.
Most people hear $1 $Kas and immediately dismiss it without actually doing the math. At max supply that’s roughly a $29B valuation. In the last cycle we watched Dogecoin, Cardano, and even some weaker stories trade well above that level. So the market has already shown it’s… https://t.co/pgcG7CYuCi
— CryptOG (@realhus2) September 28, 2026
It was also fair launched, with no premine, pre-sale or insider allocation. Kaspa says every KAS in circulation has been mined publicly since the network launched in November 2021.
For investors who value Bitcoin-like monetary characteristics but want faster settlement and more throughput, that combination forms much of the KAS investment thesis.
Toccata Has Expanded the Kaspa Story
Kaspa has also moved beyond being viewed only as a fast proof-of-work network.
Toccata introduced programmability directly to the Kaspa base layer and has been live on mainnet since June 30, 2026. It added programmable UTXOs, covenants, transaction introspection and support for ZK-based application designs.
That has given Kaspa a broader narrative around applications and programmable finance.
Other development efforts remain in progress. vProgs is still under construction, while DAGKnight is planned as a later consensus upgrade.
This is important for the $1 argument because a higher valuation becomes easier to justify if Kaspa develops an active application ecosystem rather than remaining primarily a payment and settlement network.
Crypto Has Already Seen Much Bigger Valuations
The historical comparison is probably the easiest part of the bullish case to understand.
A $29 billion valuation would still sit far below the peaks reached by some of the largest altcoins during previous cycles.
Dogecoin crossed roughly $90 billion at its 2021 peak. Cardano also reached around that range, while Shiba Inu moved above $40 billion.
Even projects with smaller ecosystems than the largest smart-contract platforms have reached valuations comparable to or above what Kaspa would require at $1.
This doesn’t make $1 inevitable. It only shows that the valuation itself isn’t outside the range the crypto market has previously assigned to popular altcoins.
Read also: Crypto Expert Buys More Kaspa as His KAS Conviction Grows
The Real Challenge Is Demand
The harder part is getting enough capital into KAS to support that valuation.
Technology alone cannot do that.
Kaspa would need continued developer activity, deeper liquidity, exchange access, user growth and a reason for investors to hold KAS through a full market cycle.
That was also the key caveat raised by the analysts discussing the $1 target.
Kaspa can have a technically strong network and still fail to reach $1 if adoption remains limited or the broader crypto market enters a weaker phase.
A $29 billion valuation therefore depends heavily on what Kaspa becomes over the next several years.
So, Can Kaspa Reach $1?
From a market-cap perspective, $1 is certainly within the range crypto has seen before.
Kaspa would need a valuation of roughly $28.7 billion, which is well below the historical peaks reached by DOGE, ADA and several other large altcoins.
The harder question is whether Kaspa can build enough demand to deserve that valuation.
Its 10 BPS network, GHOSTDAG architecture, fair-launch structure and Toccata programmability give bulls plenty to work with. But future development, adoption and liquidity will ultimately determine whether those technical advantages translate into a much higher KAS price.
So the math doesn’t make $1 look impossible.
For more crypto news and price predictions, click here.
Subscribe to our YouTube channel for daily crypto updates, market insights, and expert analysis.
The post Can Kaspa (KAS) Reach $1? Here’s What the Math Says appeared first on CaptainAltcoin.
At first glance, $1 can look ambitious when KAS is trading far below that level. But once the target is translated into market capitalization, the number becomes easier to evaluate.
Kaspa has a maximum supply of roughly 28.7 billion KAS. At $1 per token, that would put its fully diluted valuation at around $28.7 billion. Kaspa itself lists a maximum supply of about 28.7 billion tokens.
That is a large valuation, but crypto history has already produced several projects that traded well above it.
What Would a $1 Kaspa Price Actually Mean?
The math is straightforward.
With around 28.7 billion KAS as the projected maximum supply:
$1 KAS = roughly $28.7 billion fully diluted valuation.
That figure is the center of the argument made by both analysts.
One analyst pointed out that Dogecoin, Cardano, Avalanche and Shiba Inu all reached valuations in the tens of billions of dollars during the 2021 cycle. DOGE and ADA went much higher than the level Kaspa would need for a $1 price.
The point isn’t that Kaspa will automatically follow the same path. Those projects benefited from very different market conditions, liquidity, narratives and investor bases.
But the comparison does show that a valuation around $29 billion is not without precedent in crypto.
Why Analysts Think $1 KAS Is Achievable
The bullish argument goes beyond market cap comparisons.
Kaspa is a proof-of-work BlockDAG network built around GHOSTDAG. Unlike a conventional blockchain that discards competing blocks, Kaspa can include parallel blocks and order them into consensus. The network currently operates at 10 blocks per second.
That gives Kaspa a different technical profile from many older proof-of-work networks.
Most people hear $1 $Kas and immediately dismiss it without actually doing the math. At max supply that’s roughly a $29B valuation. In the last cycle we watched Dogecoin, Cardano, and even some weaker stories trade well above that level. So the market has already shown it’s… https://t.co/pgcG7CYuCi
— CryptOG (@realhus2) September 28, 2026
It was also fair launched, with no premine, pre-sale or insider allocation. Kaspa says every KAS in circulation has been mined publicly since the network launched in November 2021.
For investors who value Bitcoin-like monetary characteristics but want faster settlement and more throughput, that combination forms much of the KAS investment thesis.
Toccata Has Expanded the Kaspa Story
Kaspa has also moved beyond being viewed only as a fast proof-of-work network.
Toccata introduced programmability directly to the Kaspa base layer and has been live on mainnet since June 30, 2026. It added programmable UTXOs, covenants, transaction introspection and support for ZK-based application designs.
That has given Kaspa a broader narrative around applications and programmable finance.
Other development efforts remain in progress. vProgs is still under construction, while DAGKnight is planned as a later consensus upgrade.
This is important for the $1 argument because a higher valuation becomes easier to justify if Kaspa develops an active application ecosystem rather than remaining primarily a payment and settlement network.
Crypto Has Already Seen Much Bigger Valuations
The historical comparison is probably the easiest part of the bullish case to understand.
A $29 billion valuation would still sit far below the peaks reached by some of the largest altcoins during previous cycles.
Dogecoin crossed roughly $90 billion at its 2021 peak. Cardano also reached around that range, while Shiba Inu moved above $40 billion.
Even projects with smaller ecosystems than the largest smart-contract platforms have reached valuations comparable to or above what Kaspa would require at $1.
This doesn’t make $1 inevitable. It only shows that the valuation itself isn’t outside the range the crypto market has previously assigned to popular altcoins.
Read also: Crypto Expert Buys More Kaspa as His KAS Conviction Grows
The Real Challenge Is Demand
The harder part is getting enough capital into KAS to support that valuation.
Technology alone cannot do that.
Kaspa would need continued developer activity, deeper liquidity, exchange access, user growth and a reason for investors to hold KAS through a full market cycle.
That was also the key caveat raised by the analysts discussing the $1 target.
Kaspa can have a technically strong network and still fail to reach $1 if adoption remains limited or the broader crypto market enters a weaker phase.
A $29 billion valuation therefore depends heavily on what Kaspa becomes over the next several years.
So, Can Kaspa Reach $1?
From a market-cap perspective, $1 is certainly within the range crypto has seen before.
Kaspa would need a valuation of roughly $28.7 billion, which is well below the historical peaks reached by DOGE, ADA and several other large altcoins.
The harder question is whether Kaspa can build enough demand to deserve that valuation.
Its 10 BPS network, GHOSTDAG architecture, fair-launch structure and Toccata programmability give bulls plenty to work with. But future development, adoption and liquidity will ultimately determine whether those technical advantages translate into a much higher KAS price.
So the math doesn’t make $1 look impossible.
For more crypto news and price predictions, click here.
Subscribe to our YouTube channel for daily crypto updates, market insights, and expert analysis.
The post Can Kaspa (KAS) Reach $1? Here’s What the Math Says appeared first on CaptainAltcoin.
1
1
219
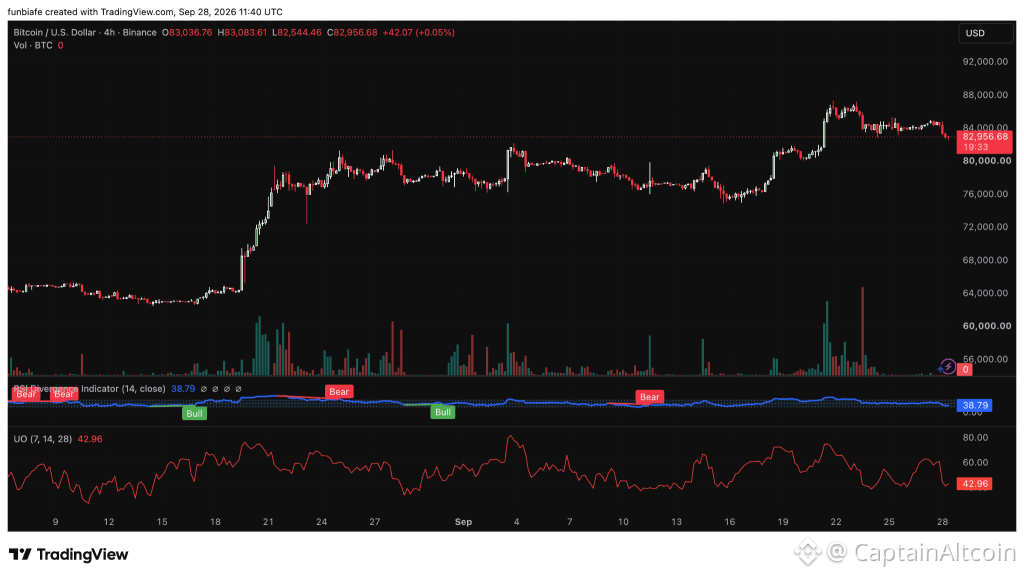
Maqola
Tarjimani ko‘rish
Bitcoin Price Warning: One More Drop Could Change the Entire SetupBitcoin is back under pressure after climbing toward $88,000 last week. The BTC price is trading around $82,956 now, up just 0.05% on the latest 4-hour candle. But the bigger picture is weaker after the recent drop.
Bitcoin is down 2.33% over 24 hours, underperforming a broadly flat crypto market. The main trigger? Renewed geopolitical tension after the U.S. rejected Iran’s ceasefire proposal. That pushed oil prices and Treasury yields higher, which weighed on risk assets like crypto.
Bitcoin has also been moving closely with gold, with the two assets showing a 95% correlation in the supplied data. That points to both markets responding to the same rates and dollar-related pressures.
Bitcoin Longs Are Starting to Get Flushed
The decline has also forced leveraged traders out of their positions. Bitcoin long liquidations reached $89.39 million over 24 hours, an increase of 520%. That liquidation wave added more selling pressure as leveraged positions were closed.
The initial decline also broke Bitcoin below the 38.2% Fibonacci retracement near $82,620, with trading volume increasing by 84%. This matters because the Bitcoin price is no longer dealing with technical selling alone.
Leverage has become part of the move, and the next few sessions could show whether traders continue reducing exposure or start rebuilding positions. For now, the market remains caught between buyers trying to defend support and sellers looking for another move lower.
Read Also: Crypto Price Predictions for Today, September 28: Bitcoin (BTC), XRP and Ethereum (ETH)
The Bitcoin Price Level Bulls Need to Defend
We had a look at the Bitcoin chart, and the $82,000-$82,500 zone stands out as the first area bulls need to protect. The Bitcoin price is around $82,956, keeping it just above that support region.
Source: TradingView
If buyers defend this area, BTC could head back toward $84,000. A break above that would bring $88,000 into view, followed by $92,000. The downside gets more concerning below $80,000. The chart puts the next supports at $76,000, $72,000, $68,000, $64,000, and $60,000.
Momentum readings are mixed. The 4-hour RSI is at 38.79, weak, but it shows both bullish and bearish divergences. The Ultimate Oscillator is at 42.96, below 50, pointing to neutral-to-bearish momentum. So Bitcoin doesn’t have a clear directional signal yet.
Bitcoin Price Outlook for the Next Few Days
The next move likely comes down to two boundaries: $84,000 and $80,000. If Bitcoin reclaims $84,000, the next levels on the chart are $88,000 and $92,000. If it drops below $80,000, the market could head toward $76,000 and $72,000, with $68,000, $64,000, and $60,000 further down.
There’s also a macro catalyst coming. U.S. PCE inflation data drops on September 30, and the result could shape expectations around Fed policy. At the same time, traders are watching the Strait of Hormuz, oil prices, and Treasury yields.
For now, Bitcoin is still inside the $80,000–$88,000 range. The $82,000–$82,500 zone is the immediate area to watch, but a break below $80,000 would open the door to a much deeper test of support.
FAQs
How could the U.S. PCE inflation report affect Bitcoin
The PCE inflation report is closely watched because it can influence Federal Reserve policy expectations. Higher-than-expected inflation could pressure risk assets, including Bitcoin.
Is Bitcoin still in a long-term uptrend
Many traders still view the current decline as a correction within a broader uptrend. However, maintaining support above key levels such as $80,000 remains important for that outlook.
Subscribe to our YouTube channel for daily crypto updates, market insights, and expert analysis.
The post Bitcoin Price Warning: One More Drop Could Change the Entire Setup appeared first on CaptainAltcoin.
Bitcoin Price Warning: One More Drop Could Change the Entire Setup
Bitcoin is back under pressure after climbing toward $88,000 last week. The BTC price is trading around $82,956 now, up just 0.05% on the latest 4-hour candle. But the bigger picture is weaker after the recent drop.
Bitcoin is down 2.33% over 24 hours, underperforming a broadly flat crypto market. The main trigger? Renewed geopolitical tension after the U.S. rejected Iran’s ceasefire proposal. That pushed oil prices and Treasury yields higher, which weighed on risk assets like crypto.
Bitcoin has also been moving closely with gold, with the two assets showing a 95% correlation in the supplied data. That points to both markets responding to the same rates and dollar-related pressures.
Bitcoin Longs Are Starting to Get Flushed
The decline has also forced leveraged traders out of their positions. Bitcoin long liquidations reached $89.39 million over 24 hours, an increase of 520%. That liquidation wave added more selling pressure as leveraged positions were closed.
The initial decline also broke Bitcoin below the 38.2% Fibonacci retracement near $82,620, with trading volume increasing by 84%. This matters because the Bitcoin price is no longer dealing with technical selling alone.
Leverage has become part of the move, and the next few sessions could show whether traders continue reducing exposure or start rebuilding positions. For now, the market remains caught between buyers trying to defend support and sellers looking for another move lower.
Read Also: Crypto Price Predictions for Today, September 28: Bitcoin (BTC), XRP and Ethereum (ETH)
The Bitcoin Price Level Bulls Need to Defend
We had a look at the Bitcoin chart, and the $82,000-$82,500 zone stands out as the first area bulls need to protect. The Bitcoin price is around $82,956, keeping it just above that support region.
Source: TradingView
If buyers defend this area, BTC could head back toward $84,000. A break above that would bring $88,000 into view, followed by $92,000. The downside gets more concerning below $80,000. The chart puts the next supports at $76,000, $72,000, $68,000, $64,000, and $60,000.
Momentum readings are mixed. The 4-hour RSI is at 38.79, weak, but it shows both bullish and bearish divergences. The Ultimate Oscillator is at 42.96, below 50, pointing to neutral-to-bearish momentum. So Bitcoin doesn’t have a clear directional signal yet.
Bitcoin Price Outlook for the Next Few Days
The next move likely comes down to two boundaries: $84,000 and $80,000. If Bitcoin reclaims $84,000, the next levels on the chart are $88,000 and $92,000. If it drops below $80,000, the market could head toward $76,000 and $72,000, with $68,000, $64,000, and $60,000 further down.
There’s also a macro catalyst coming. U.S. PCE inflation data drops on September 30, and the result could shape expectations around Fed policy. At the same time, traders are watching the Strait of Hormuz, oil prices, and Treasury yields.
For now, Bitcoin is still inside the $80,000–$88,000 range. The $82,000–$82,500 zone is the immediate area to watch, but a break below $80,000 would open the door to a much deeper test of support.
FAQs
How could the U.S. PCE inflation report affect Bitcoin
The PCE inflation report is closely watched because it can influence Federal Reserve policy expectations. Higher-than-expected inflation could pressure risk assets, including Bitcoin.
Is Bitcoin still in a long-term uptrend
Many traders still view the current decline as a correction within a broader uptrend. However, maintaining support above key levels such as $80,000 remains important for that outlook.
Subscribe to our YouTube channel for daily crypto updates, market insights, and expert analysis.
The post Bitcoin Price Warning: One More Drop Could Change the Entire Setup appeared first on CaptainAltcoin.
Bitcoin is down 2.33% over 24 hours, underperforming a broadly flat crypto market. The main trigger? Renewed geopolitical tension after the U.S. rejected Iran’s ceasefire proposal. That pushed oil prices and Treasury yields higher, which weighed on risk assets like crypto.
Bitcoin has also been moving closely with gold, with the two assets showing a 95% correlation in the supplied data. That points to both markets responding to the same rates and dollar-related pressures.
Bitcoin Longs Are Starting to Get Flushed
The decline has also forced leveraged traders out of their positions. Bitcoin long liquidations reached $89.39 million over 24 hours, an increase of 520%. That liquidation wave added more selling pressure as leveraged positions were closed.
The initial decline also broke Bitcoin below the 38.2% Fibonacci retracement near $82,620, with trading volume increasing by 84%. This matters because the Bitcoin price is no longer dealing with technical selling alone.
Leverage has become part of the move, and the next few sessions could show whether traders continue reducing exposure or start rebuilding positions. For now, the market remains caught between buyers trying to defend support and sellers looking for another move lower.
Read Also: Crypto Price Predictions for Today, September 28: Bitcoin (BTC), XRP and Ethereum (ETH)
The Bitcoin Price Level Bulls Need to Defend
We had a look at the Bitcoin chart, and the $82,000-$82,500 zone stands out as the first area bulls need to protect. The Bitcoin price is around $82,956, keeping it just above that support region.
Source: TradingView
If buyers defend this area, BTC could head back toward $84,000. A break above that would bring $88,000 into view, followed by $92,000. The downside gets more concerning below $80,000. The chart puts the next supports at $76,000, $72,000, $68,000, $64,000, and $60,000.
Momentum readings are mixed. The 4-hour RSI is at 38.79, weak, but it shows both bullish and bearish divergences. The Ultimate Oscillator is at 42.96, below 50, pointing to neutral-to-bearish momentum. So Bitcoin doesn’t have a clear directional signal yet.
Bitcoin Price Outlook for the Next Few Days
The next move likely comes down to two boundaries: $84,000 and $80,000. If Bitcoin reclaims $84,000, the next levels on the chart are $88,000 and $92,000. If it drops below $80,000, the market could head toward $76,000 and $72,000, with $68,000, $64,000, and $60,000 further down.
There’s also a macro catalyst coming. U.S. PCE inflation data drops on September 30, and the result could shape expectations around Fed policy. At the same time, traders are watching the Strait of Hormuz, oil prices, and Treasury yields.
For now, Bitcoin is still inside the $80,000–$88,000 range. The $82,000–$82,500 zone is the immediate area to watch, but a break below $80,000 would open the door to a much deeper test of support.
FAQs
How could the U.S. PCE inflation report affect Bitcoin
The PCE inflation report is closely watched because it can influence Federal Reserve policy expectations. Higher-than-expected inflation could pressure risk assets, including Bitcoin.
Is Bitcoin still in a long-term uptrend
Many traders still view the current decline as a correction within a broader uptrend. However, maintaining support above key levels such as $80,000 remains important for that outlook.
Subscribe to our YouTube channel for daily crypto updates, market insights, and expert analysis.
The post Bitcoin Price Warning: One More Drop Could Change the Entire Setup appeared first on CaptainAltcoin.
111
Narx jadvalidan tashqari kripto savdosi: kuzatishga arziydigan ma’lumot nuqtalariOdamlar yapon shamchalar (candlestick) naqshlarini o‘rganishga, qo‘llab-quvvatlash va qarshilik darajalarini chizishga hamda yillar davomida narx tendensiyasini bashorat qilishga juda ko‘p soat ajratishgan. Diagrammalar savdoda muhim rol o‘ynashda davom etayotgan bo‘lsa-da, ular zamonaviy, o‘zgaruvchan kripto bozorida voqea-hodisalar manzarasining faqat yarmigini ko‘rsatadi.
Yirik markazlashgan birjalarda spot savdo hajmidagi yaqindagi o‘zgarishlar, ishtirok va likvidlik hisobga olinganda narx harakatlari nega boshqacha ko‘rinishi mumkinligini ko‘rsatadi.
Biroq, bozor sharoitlari yaqinda bozorga qarab kayfiyat tezda o‘zgarishi mumkinligini ko‘rsatdi. Masalan, treyderlar qisqa muddatli tendensiyalar tezda o‘zgarishi mumkinligini yodda tutishlari kerak; Ether ham shunga o‘xshash tarzda avval keskin ko‘tarilib, so‘ngra konsolidatsiya davriga o‘tdi. Shuning uchun faqat diagrammadagi impulsga emas, balki butun bozor hamda makroiqtisodiy manzaraga ham e’tibor berish muhim.
Narx jadvalidan tashqari kripto savdosi: kuzatishga arziydigan ma’lumot nuqtalari
Odamlar yapon shamchalar (candlestick) naqshlarini o‘rganishga, qo‘llab-quvvatlash va qarshilik darajalarini chizishga hamda yillar davomida narx tendensiyasini bashorat qilishga juda ko‘p soat ajratishgan. Diagrammalar savdoda muhim rol o‘ynashda davom etayotgan bo‘lsa-da, ular zamonaviy, o‘zgaruvchan kripto bozorida voqea-hodisalar manzarasining faqat yarmigini ko‘rsatadi.
Yirik markazlashgan birjalarda spot savdo hajmidagi yaqindagi o‘zgarishlar, ishtirok va likvidlik hisobga olinganda narx harakatlari nega boshqacha ko‘rinishi mumkinligini ko‘rsatadi.
Biroq, bozor sharoitlari yaqinda bozorga qarab kayfiyat tezda o‘zgarishi mumkinligini ko‘rsatdi. Masalan, treyderlar qisqa muddatli tendensiyalar tezda o‘zgarishi mumkinligini yodda tutishlari kerak; Ether ham shunga o‘xshash tarzda avval keskin ko‘tarilib, so‘ngra konsolidatsiya davriga o‘tdi. Shuning uchun faqat diagrammadagi impulsga emas, balki butun bozor hamda makroiqtisodiy manzaraga ham e’tibor berish muhim.
Yirik markazlashgan birjalarda spot savdo hajmidagi yaqindagi o‘zgarishlar, ishtirok va likvidlik hisobga olinganda narx harakatlari nega boshqacha ko‘rinishi mumkinligini ko‘rsatadi.
Biroq, bozor sharoitlari yaqinda bozorga qarab kayfiyat tezda o‘zgarishi mumkinligini ko‘rsatdi. Masalan, treyderlar qisqa muddatli tendensiyalar tezda o‘zgarishi mumkinligini yodda tutishlari kerak; Ether ham shunga o‘xshash tarzda avval keskin ko‘tarilib, so‘ngra konsolidatsiya davriga o‘tdi. Shuning uchun faqat diagrammadagi impulsga emas, balki butun bozor hamda makroiqtisodiy manzaraga ham e’tibor berish muhim.
172
Hedera (HBAR) narxi tarixidagi eng yirik harakatlardan birini takrorlash arafasida bo‘lishi mumkin!Hedera narxi 24 soat ichida 21,84% ga ko‘tarilib, qariyb 0,115 dollar atrofida bo‘lmoqda. Bu esa yangi institutsional faollik HBAR’ni yana treyderlar e’tiboriga qaytargani fonida, kuchsizroq kripto bozoriga qarshi harakat bo‘ldi. Harakat, shuningdek, so‘nggi bir hafta davomida HBAR’ni taxminan 30% ga ko‘tardi: kundalik ma’lumotlarga ko‘ra, token 19-sentabr kuni 0,0788 dollardan 28-sentabr kuni intraday (kun ichidagi) eng yuqori ko‘rsatkich — 0,1155 dollarga ko‘tarilgan.
Asosiy turtki — BlackRock’ning ICS US Treasury Money Market Fund ulushlari Securitize orqali Hedera’da tokenlashtirilayotgani haqidagi xabarlardir. Bu voqea real-world aktivlarga qiziqishning ortib borayotgani, IBM’ning Hedera asosidagi IDTrust listingi va altkoinlar ko‘rsatkichlarining kuchayishi bilan birga kelmoqda.
Hedera (HBAR) narxi tarixidagi eng yirik harakatlardan birini takrorlash arafasida bo‘lishi mumkin!
Hedera narxi 24 soat ichida 21,84% ga ko‘tarilib, qariyb 0,115 dollar atrofida bo‘lmoqda. Bu esa yangi institutsional faollik HBAR’ni yana treyderlar e’tiboriga qaytargani fonida, kuchsizroq kripto bozoriga qarshi harakat bo‘ldi. Harakat, shuningdek, so‘nggi bir hafta davomida HBAR’ni taxminan 30% ga ko‘tardi: kundalik ma’lumotlarga ko‘ra, token 19-sentabr kuni 0,0788 dollardan 28-sentabr kuni intraday (kun ichidagi) eng yuqori ko‘rsatkich — 0,1155 dollarga ko‘tarilgan.
Asosiy turtki — BlackRock’ning ICS US Treasury Money Market Fund ulushlari Securitize orqali Hedera’da tokenlashtirilayotgani haqidagi xabarlardir. Bu voqea real-world aktivlarga qiziqishning ortib borayotgani, IBM’ning Hedera asosidagi IDTrust listingi va altkoinlar ko‘rsatkichlarining kuchayishi bilan birga kelmoqda.
Asosiy turtki — BlackRock’ning ICS US Treasury Money Market Fund ulushlari Securitize orqali Hedera’da tokenlashtirilayotgani haqidagi xabarlardir. Bu voqea real-world aktivlarga qiziqishning ortib borayotgani, IBM’ning Hedera asosidagi IDTrust listingi va altkoinlar ko‘rsatkichlarining kuchayishi bilan birga kelmoqda.
2
248

Maqola
Bybit va Franklin Templeton tokenlashtirilgan investitsiyalarga kirish imkonini kengaytirish uchun strategik hamkorlikni shakllantiradiKengroq hamkorlik yangi bir birjadan tashqari garov dasturi bilan yo‘lga tushirilib, institutsional mijozlar uchun savdo likvidligini ochadi, shuningdek, tokenlashtirilgan boylik va daromad keltiruvchi strategiyalarni hamyon asosidagi investorlar uchun taqdim etish bo‘yicha tashabbuslarni o‘z ichiga oladi
BIRLASHGAN ARAB EMIRLIKLARI DUBAY, 2026-yil 28-sentabr /PRNewswire/ — Dunyo bo‘ylab 80 milliondan ortiq foydalanuvchi ishonadigan yangi moliyaviy platforma Bybit bugun raqamli aktivlar innovatsiyalarida kashshof bo‘lib, boshqaruvida 1,7 trln. AQSh dollari miqdoridagi aktivlarga ega bo‘lgan global investitsiya yetakchisi Franklin Templeton bilan strategik hamkorlikni e’lon qildi*.
Bybit va Franklin Templeton tokenlashtirilgan investitsiyalarga kirish imkonini kengaytirish uchun strategik hamkorlikni shakllantiradi
Kengroq hamkorlik yangi bir birjadan tashqari garov dasturi bilan yo‘lga tushirilib, institutsional mijozlar uchun savdo likvidligini ochadi, shuningdek, tokenlashtirilgan boylik va daromad keltiruvchi strategiyalarni hamyon asosidagi investorlar uchun taqdim etish bo‘yicha tashabbuslarni o‘z ichiga oladi
BIRLASHGAN ARAB EMIRLIKLARI DUBAY, 2026-yil 28-sentabr /PRNewswire/ — Dunyo bo‘ylab 80 milliondan ortiq foydalanuvchi ishonadigan yangi moliyaviy platforma Bybit bugun raqamli aktivlar innovatsiyalarida kashshof bo‘lib, boshqaruvida 1,7 trln. AQSh dollari miqdoridagi aktivlarga ega bo‘lgan global investitsiya yetakchisi Franklin Templeton bilan strategik hamkorlikni e’lon qildi*.
BIRLASHGAN ARAB EMIRLIKLARI DUBAY, 2026-yil 28-sentabr /PRNewswire/ — Dunyo bo‘ylab 80 milliondan ortiq foydalanuvchi ishonadigan yangi moliyaviy platforma Bybit bugun raqamli aktivlar innovatsiyalarida kashshof bo‘lib, boshqaruvida 1,7 trln. AQSh dollari miqdoridagi aktivlarga ega bo‘lgan global investitsiya yetakchisi Franklin Templeton bilan strategik hamkorlikni e’lon qildi*.
73
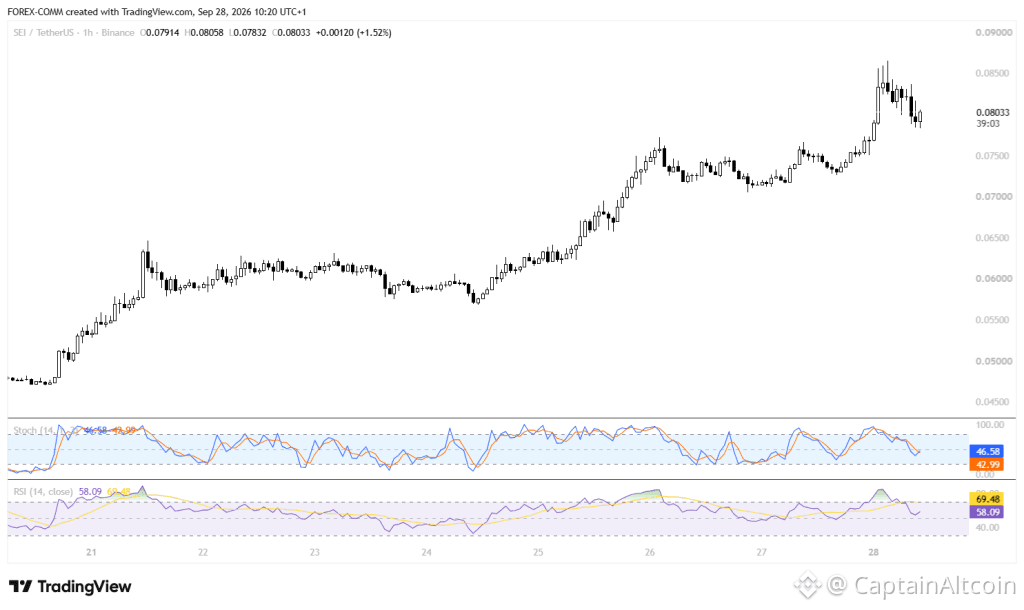
Maqola
Mana Nega Sei (SEI) Narxi 40% Ga OshdiSEI narxi bugun 6% dan ortiq ko‘tarilib, $0.07879 ga yetdi va haftalik o‘sishini qariyb 40% atrofida davom ettirmoqda. Savdo hajmi ham 100% dan ko‘proqqa oshdi, shu sababli kengroq kripto bozorida zaiflik bo‘lishiga qaramay, SEI bozorning eng yaxshi beshta o‘suvchisi (gainers) qatoriga kirdi.
Harakat ikki yirik katalizator atrofida treyderlar baholayotgan paytda yuzaga kelmoqda: Staked SEI ETF’ga oid spekulyatsiya va yaqinlashib kelayotgan Sei Giga yangilanishi. Hosilaviy (derivativ) ma’lumotlar ham harakatni kuchaytiryapti: ochiq foiz (open interest) 21,4% ga oshib $20,6 millionga yetdi va moliyalashtirish (funding) ijobiy bo‘lib qolmoqda.
Shuningdek, kapital Layer-1 tokenlariga ham oqib kiryapti va bu SEI’ga qo‘shimcha xarid bosimini bermoqda. Quyida SEI narxi nima uchun keskin ko‘tarilayotgani va u keyin qayerga borishi mumkinligi keltirilgan.
Mana Nega Sei (SEI) Narxi 40% Ga Oshdi
SEI narxi bugun 6% dan ortiq ko‘tarilib, $0.07879 ga yetdi va haftalik o‘sishini qariyb 40% atrofida davom ettirmoqda. Savdo hajmi ham 100% dan ko‘proqqa oshdi, shu sababli kengroq kripto bozorida zaiflik bo‘lishiga qaramay, SEI bozorning eng yaxshi beshta o‘suvchisi (gainers) qatoriga kirdi.
Harakat ikki yirik katalizator atrofida treyderlar baholayotgan paytda yuzaga kelmoqda: Staked SEI ETF’ga oid spekulyatsiya va yaqinlashib kelayotgan Sei Giga yangilanishi. Hosilaviy (derivativ) ma’lumotlar ham harakatni kuchaytiryapti: ochiq foiz (open interest) 21,4% ga oshib $20,6 millionga yetdi va moliyalashtirish (funding) ijobiy bo‘lib qolmoqda.
Shuningdek, kapital Layer-1 tokenlariga ham oqib kiryapti va bu SEI’ga qo‘shimcha xarid bosimini bermoqda. Quyida SEI narxi nima uchun keskin ko‘tarilayotgani va u keyin qayerga borishi mumkinligi keltirilgan.
Harakat ikki yirik katalizator atrofida treyderlar baholayotgan paytda yuzaga kelmoqda: Staked SEI ETF’ga oid spekulyatsiya va yaqinlashib kelayotgan Sei Giga yangilanishi. Hosilaviy (derivativ) ma’lumotlar ham harakatni kuchaytiryapti: ochiq foiz (open interest) 21,4% ga oshib $20,6 millionga yetdi va moliyalashtirish (funding) ijobiy bo‘lib qolmoqda.
Shuningdek, kapital Layer-1 tokenlariga ham oqib kiryapti va bu SEI’ga qo‘shimcha xarid bosimini bermoqda. Quyida SEI narxi nima uchun keskin ko‘tarilayotgani va u keyin qayerga borishi mumkinligi keltirilgan.
64
Ko‘proq kontentni ko‘rish uchun tizimga kiring
Binance Square'da global kriptovalyuta foydalanuvchilariga qo‘shiling
⚡️ Kriptovalyuta haqida eng so‘nggi va foydali ma’lumotlarni oling.
💬 Dunyoning eng yirik kriptovalyuta birjasi tomonidan ishonchli deb topilgan.
👍 Tasdiqlangan mualliflardan haqiqiy tahlillarni kashf eting.
Email / telefon raqami
Trenddagi mavzular
TrumpRejectsAIRulesForVoluntaryAudits
900 marta koʻrilgan
101 muhokama qilmoqda
#TrumpRejectsAIRulesForVoluntaryAudits
🚨 $TRUMP AI sanoatiga xabar yubordi: AVVAL QURING, KEYIN TARTIBGA SOLING.
Prezident Donald $TRUMP yangi federal AI qoidalariga o‘rniga ixtiyoriy AI xavfsizligi bo‘yicha auditlarni qo‘llab-quvvatlamoqda.
Asosiy AI kompaniyalari ichki nazoratlarni kuchaytirishi va mustaqil auditorlar bilan ishlashi kutilmoqda, jumladan OpenAI, Anthropic, Google, Meta, Nvidia va xAI.
⚡ Nega muhim:
Kamroq tartibga solish AI innovatsiyasini tezlashtirishi mumkin, ammo javobgarlik bo‘yicha savollar saqlanib qoladi.
🔗 Kripto aloqasi: AI agentlari, blokcheyn xavfsizligi va markazlashmagan infratuzilma tobora yaqinlashmoqda.
Yengilroq AI tartibga solish AI va AI-kripto narrativlarini kuchaytirishi mumkin, ammo volatillik yuqori bo‘lib qolishi ehtimol. Sarlavhalardan ko‘ra ijro muhimroq.
$TRUMP
#TRUMP #AI #crypto #Binanace
A_K Crypto
·0 ta layk
·32 marta koʻrilgan
BitgetHotWalletBreachTiedToThirdPartySecurityFlaw
371 marta koʻrilgan
78 muhokama qilmoqda
OpenAIUnveilsAlwaysOnAgentDots
1,532 marta koʻrilgan
126 muhokama qilmoqda