
R3N 1
541 Postlar

R3N 1
Shikoyat qilish
Foydalanuvchini bloklash
Web3 & crypto Analyst || Breaking down market moves || token updates daily ➪NFA!!!
0 Kuzatilmoqda
3 Kuzatuvchilar
3 Yoqdi
Postlar
·
--
Tarjimani ko‘rish
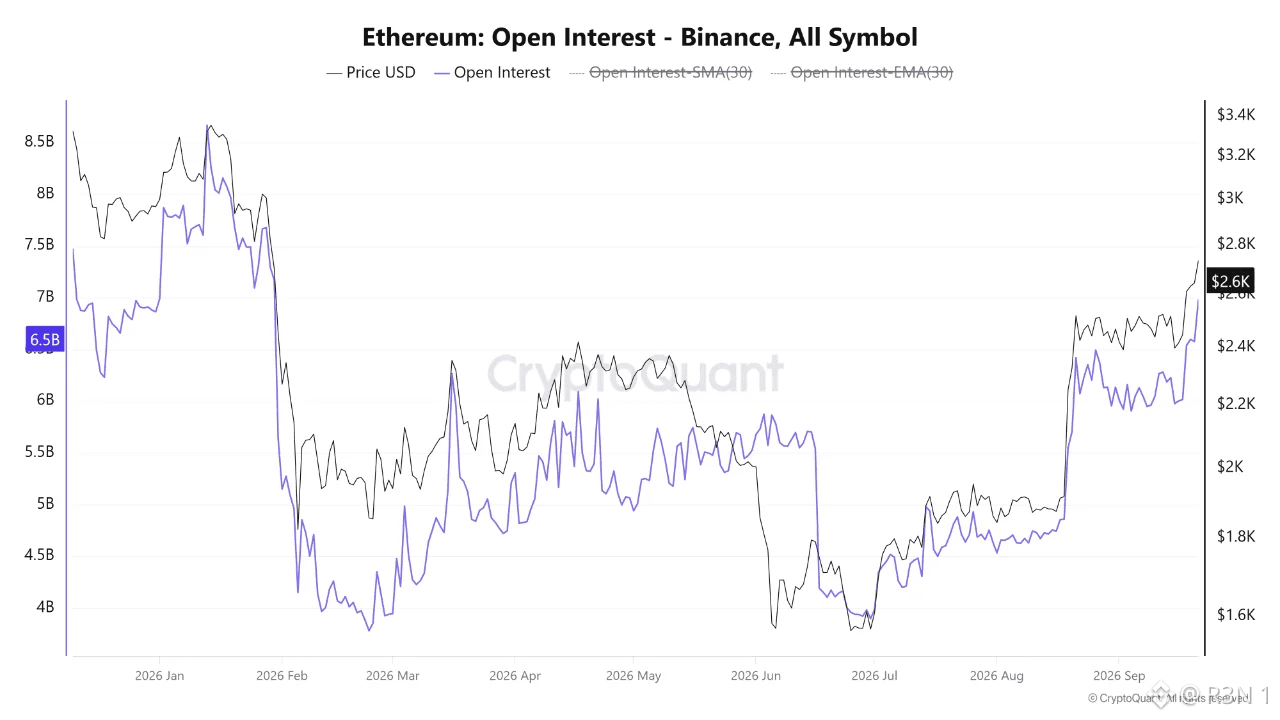
ETH open interest on Binance just hit a nine-month high, and whether that's bullish confirmation or leverage risk depends entirely on a detail this data alone can't answer. Open interest climbed from around $4.8 billion in late August to roughly $6.58 billion now, a genuine acceleration through September, not a slow drift. That coincided with ETH climbing to about $2,644, price and open positions rising together. Here's the part I'd push back on in how this usually gets framed. Rising OI alongside rising price gets read as automatically bullish, more capital, more participation, stronger conviction. That's true as far as it goes, but it's incomplete without knowing the mix. Rising OI can mean fresh longs entering with real conviction, or it can mean shorts getting trapped and adding to losing positions before eventually capitulating, or some combination of both happening at once. The dollar figure alone doesn't distinguish between those scenarios. What would actually settle this is funding rates and the long/short ratio over the same window, neither of which is in this dataset. Elevated positive funding alongside this OI climb would support the "genuine bullish participation" read. Funding staying flat or negative while OI expands this fast would suggest a more contested market, sellers pressing against a rally rather than buyers driving it cleanly. Worth being direct about the risk side too, regardless of which scenario this turns out to be. A nine-month high in open interest means more leveraged capital sitting exposed to price swings than at any point since January. That cuts both ways, it can fuel continuation if the move holds, or accelerate a reversal fast if price turns and forces liquidations on the side that's overextended. The open question isn't whether participation increased, the OI number confirms that plainly. It's which side actually added that exposure, and that's the piece this specific report leaves out. #BTC Price Analysis# $ETH
ETH open interest on Binance just hit a nine-month high, and whether that's bullish confirmation or leverage risk depends entirely on a detail this data alone can't answer. Open interest climbed from around $4.8 billion in late August to roughly $6.58 billion now, a genuine acceleration through September, not a slow drift. That coincided with ETH climbing to about $2,644, price and open positions rising together. Here's the part I'd push back on in how this usually gets framed. Rising OI alongside rising price gets read as automatically bullish, more capital, more participation, stronger conviction. That's true as far as it goes, but it's incomplete without knowing the mix. Rising OI can mean fresh longs entering with real conviction, or it can mean shorts getting trapped and adding to losing positions before eventually capitulating, or some combination of both happening at once. The dollar figure alone doesn't distinguish between those scenarios. What would actually settle this is funding rates and the long/short ratio over the same window, neither of which is in this dataset. Elevated positive funding alongside this OI climb would support the "genuine bullish participation" read. Funding staying flat or negative while OI expands this fast would suggest a more contested market, sellers pressing against a rally rather than buyers driving it cleanly. Worth being direct about the risk side too, regardless of which scenario this turns out to be. A nine-month high in open interest means more leveraged capital sitting exposed to price swings than at any point since January. That cuts both ways, it can fuel continuation if the move holds, or accelerate a reversal fast if price turns and forces liquidations on the side that's overextended. The open question isn't whether participation increased, the OI number confirms that plainly. It's which side actually added that exposure, and that's the piece this specific report leaves out. #BTC Price Analysis# $ETH
·
--
100 million POL katta raqamdek tuyuladi, amalda esa uni aylanmadagi real ta’minot bilan solishtirguncha shunday. Mexanizmning o‘zida esa e’tiborga loyiq bir tafsilot bor.
Yonish (burn) — Polygon’ning base-fee collector’ida turgan 121 million POL’ning 83% ini tashkil etadi. Sandeep Nailwal bu mexanizm ruxsatsiz (permissionless) bo‘lishini aytadi: u mainnetga chiqqanidan keyin uni faqat jamg‘arma (foundation) emas, istagan kishi ishga tushirishi mumkin. Biroq umumiy ta’minotga nisbatan bu Blockscout ma’lumotiga ko‘ra, aylanmada turgan 10.716 milliard POL’ning taxminan 0.93% i. Haqiqiy, lekin katta emas — bunday raqamning o‘zi mexanik ravishda narx harakatini majburlaydigan darajada emas.
Menga eng ko‘p ajralib turadigan narsa — bu da’vo yonida keltirilgan daromad (revenue) haqidagi gap. Nailwal 2026 yilda 24.5 million dollar daromadni tilga oldi: Arbitrum’ning 8.41 million dollari va NEAR’ning 5.6 million dollariga nisbatan. Ammo bu taqqosuvni u “ChatGPT’dagi mening analitikim”ga tayangan holda, dataset hamda metodologiya ko‘rsatilmagan holda amalga oshirilganini aytdi. Shunga ochiq aytilishi kerak: manbasiz da’vo yonish mexanikasi kabi bir xil ishonch bilan qabul qilinmasligi kerak — yonish mexanikasi esa mustaqil tasdiqlangan va testnetda allaqachon bor.
Qaysi biri raqam bo‘lishidan ham muhimroq bo‘lgan tuzilmaviy jihat — bu yonishdan keyin nima sodir bo‘lishi.
Bu bir martalik kesib tashlash emas: bu ruxsatsiz (permissionless) choraklik mexanizmni o‘rnatadi, bunda to‘plangan base fee’lar kelgusida yonib ketadi. Natijada tarmoq faolligi bevosita deflyatsion bosimga aylanadi. Nailwal aytishicha, POL 2026 yil yanvaridan beri joriy sozlama ostida netto deflyatsion bo‘lib kelgan — bu esa ichkarida allaqachon sodir bo‘layotgani aytilgan jarayonni rasmiylashtiradi va ommaga ochadi.
Buni qayerda turganini aniq aytish kerak: yonish hali bo‘lgani yo‘q. Shartnomalar testnetda, mainnetga chiqishidan oldin Security Council’ning yakuniy imzolari kutilmoqda. Bu tasdiqlangan reja, tayyor bo‘lib ketgan ish emas.
Ochiq savol — birinchi yonish o‘tadimi-yo‘qmi emas; bu deyarli aniq ko‘rinadi. Savol shundaki, choraklik mexanizm miqyosda ta’sir qiladigan darajada yetarli miqdorda takroriy (recurring) fee hajmini yaratadimi. Chunki collector’ning sekin to‘lib borishi — bir martalik katta sarlavhadagi raqamdan butunlay boshqa hikoya.
$POL #Macro Insights# #Macro Insights#
100 million POL katta raqamdek tuyuladi, amalda esa uni aylanmadagi real ta’minot bilan solishtirguncha shunday. Mexanizmning o‘zida esa e’tiborga loyiq bir tafsilot bor.
Yonish (burn) — Polygon’ning base-fee collector’ida turgan 121 million POL’ning 83% ini tashkil etadi. Sandeep Nailwal bu mexanizm ruxsatsiz (permissionless) bo‘lishini aytadi: u mainnetga chiqqanidan keyin uni faqat jamg‘arma (foundation) emas, istagan kishi ishga tushirishi mumkin. Biroq umumiy ta’minotga nisbatan bu Blockscout ma’lumotiga ko‘ra, aylanmada turgan 10.716 milliard POL’ning taxminan 0.93% i. Haqiqiy, lekin katta emas — bunday raqamning o‘zi mexanik ravishda narx harakatini majburlaydigan darajada emas.
Menga eng ko‘p ajralib turadigan narsa — bu da’vo yonida keltirilgan daromad (revenue) haqidagi gap. Nailwal 2026 yilda 24.5 million dollar daromadni tilga oldi: Arbitrum’ning 8.41 million dollari va NEAR’ning 5.6 million dollariga nisbatan. Ammo bu taqqosuvni u “ChatGPT’dagi mening analitikim”ga tayangan holda, dataset hamda metodologiya ko‘rsatilmagan holda amalga oshirilganini aytdi. Shunga ochiq aytilishi kerak: manbasiz da’vo yonish mexanikasi kabi bir xil ishonch bilan qabul qilinmasligi kerak — yonish mexanikasi esa mustaqil tasdiqlangan va testnetda allaqachon bor.
Qaysi biri raqam bo‘lishidan ham muhimroq bo‘lgan tuzilmaviy jihat — bu yonishdan keyin nima sodir bo‘lishi.
Bu bir martalik kesib tashlash emas: bu ruxsatsiz (permissionless) choraklik mexanizmni o‘rnatadi, bunda to‘plangan base fee’lar kelgusida yonib ketadi. Natijada tarmoq faolligi bevosita deflyatsion bosimga aylanadi. Nailwal aytishicha, POL 2026 yil yanvaridan beri joriy sozlama ostida netto deflyatsion bo‘lib kelgan — bu esa ichkarida allaqachon sodir bo‘layotgani aytilgan jarayonni rasmiylashtiradi va ommaga ochadi.
Buni qayerda turganini aniq aytish kerak: yonish hali bo‘lgani yo‘q. Shartnomalar testnetda, mainnetga chiqishidan oldin Security Council’ning yakuniy imzolari kutilmoqda. Bu tasdiqlangan reja, tayyor bo‘lib ketgan ish emas.
Ochiq savol — birinchi yonish o‘tadimi-yo‘qmi emas; bu deyarli aniq ko‘rinadi. Savol shundaki, choraklik mexanizm miqyosda ta’sir qiladigan darajada yetarli miqdorda takroriy (recurring) fee hajmini yaratadimi. Chunki collector’ning sekin to‘lib borishi — bir martalik katta sarlavhadagi raqamdan butunlay boshqa hikoya.
$POL #Macro Insights# #Macro Insights#
Yonish (burn) — Polygon’ning base-fee collector’ida turgan 121 million POL’ning 83% ini tashkil etadi. Sandeep Nailwal bu mexanizm ruxsatsiz (permissionless) bo‘lishini aytadi: u mainnetga chiqqanidan keyin uni faqat jamg‘arma (foundation) emas, istagan kishi ishga tushirishi mumkin. Biroq umumiy ta’minotga nisbatan bu Blockscout ma’lumotiga ko‘ra, aylanmada turgan 10.716 milliard POL’ning taxminan 0.93% i. Haqiqiy, lekin katta emas — bunday raqamning o‘zi mexanik ravishda narx harakatini majburlaydigan darajada emas.
Menga eng ko‘p ajralib turadigan narsa — bu da’vo yonida keltirilgan daromad (revenue) haqidagi gap. Nailwal 2026 yilda 24.5 million dollar daromadni tilga oldi: Arbitrum’ning 8.41 million dollari va NEAR’ning 5.6 million dollariga nisbatan. Ammo bu taqqosuvni u “ChatGPT’dagi mening analitikim”ga tayangan holda, dataset hamda metodologiya ko‘rsatilmagan holda amalga oshirilganini aytdi. Shunga ochiq aytilishi kerak: manbasiz da’vo yonish mexanikasi kabi bir xil ishonch bilan qabul qilinmasligi kerak — yonish mexanikasi esa mustaqil tasdiqlangan va testnetda allaqachon bor.
Qaysi biri raqam bo‘lishidan ham muhimroq bo‘lgan tuzilmaviy jihat — bu yonishdan keyin nima sodir bo‘lishi.
Bu bir martalik kesib tashlash emas: bu ruxsatsiz (permissionless) choraklik mexanizmni o‘rnatadi, bunda to‘plangan base fee’lar kelgusida yonib ketadi. Natijada tarmoq faolligi bevosita deflyatsion bosimga aylanadi. Nailwal aytishicha, POL 2026 yil yanvaridan beri joriy sozlama ostida netto deflyatsion bo‘lib kelgan — bu esa ichkarida allaqachon sodir bo‘layotgani aytilgan jarayonni rasmiylashtiradi va ommaga ochadi.
Buni qayerda turganini aniq aytish kerak: yonish hali bo‘lgani yo‘q. Shartnomalar testnetda, mainnetga chiqishidan oldin Security Council’ning yakuniy imzolari kutilmoqda. Bu tasdiqlangan reja, tayyor bo‘lib ketgan ish emas.
Ochiq savol — birinchi yonish o‘tadimi-yo‘qmi emas; bu deyarli aniq ko‘rinadi. Savol shundaki, choraklik mexanizm miqyosda ta’sir qiladigan darajada yetarli miqdorda takroriy (recurring) fee hajmini yaratadimi. Chunki collector’ning sekin to‘lib borishi — bir martalik katta sarlavhadagi raqamdan butunlay boshqa hikoya.
$POL #Macro Insights# #Macro Insights#



1
361
·
--
Tarjimani ko‘rish
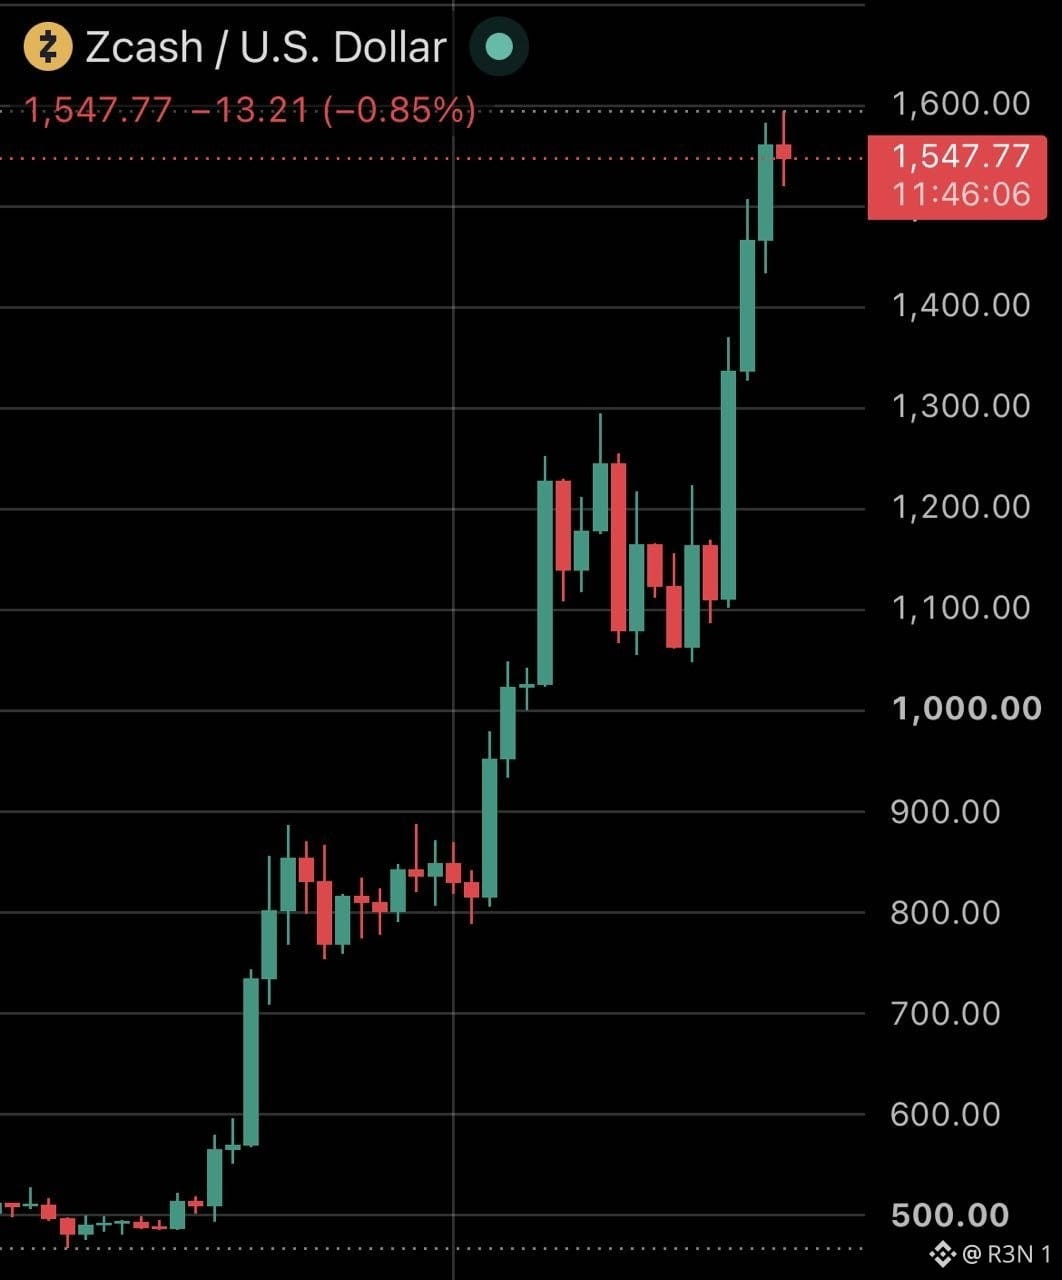
The same trader who made $11.24 million shorting ZEC after June's selloff just gave back more than triple that on the next attempt. That's the actual arc here, not just today's number.
Garrett Jin, former BitForex CEO, rebuilt his ZEC short in June with an initial 11,780 ZEC position worth about $4.92 million, then kept adding as Zcash climbed, eventually growing it to around 40,000 ZEC before closing 38,000 of it today via market orders over roughly 90 minutes. The exit itself briefly pushed ZEC up 2.7%, from $1,490 to $1,530, and spiked Hyperliquid's funding rate above 170% annualized in the process. Reported loss figures vary slightly by source, $35.44 million per Lookonchain and TechFlow, $36.13 million per Phemex, worth noting that spread rather than picking one number as precise to the dollar.
Context matters here. ZEC is up roughly 178% over the past month, and Zcash ETFs pulled in $98.2 million last week alone, the most of any of the 14 products in that category. Jin wasn't the only short holder getting run over either, per BeInCrypto, other tracked wallets were sitting $10 to $12 million underwater on smaller ZEC shorts around the same window. Jin still holds 202,078 ZEC in spot, worth roughly $309 million, with an estimated $221 million unrealized profit on that position, alongside a separate 1,330 BTC long worth about $107.77 million.
My honest read: the realized loss on the short doesn't erase what's still a massive net position in his favor overall, this reads as one specific trade going badly wrong inside a portfolio that's still deeply profitable.
What I'm watching: whether Jin re-enters a ZEC short at a new level, given his track record of doing exactly that after past losses, or steps back from the position entirely.
$ZEC #BTC Price Analysis# #Macro Insights# #BNBChain#
The same trader who made $11.24 million shorting ZEC after June's selloff just gave back more than triple that on the next attempt. That's the actual arc here, not just today's number.
Garrett Jin, former BitForex CEO, rebuilt his ZEC short in June with an initial 11,780 ZEC position worth about $4.92 million, then kept adding as Zcash climbed, eventually growing it to around 40,000 ZEC before closing 38,000 of it today via market orders over roughly 90 minutes. The exit itself briefly pushed ZEC up 2.7%, from $1,490 to $1,530, and spiked Hyperliquid's funding rate above 170% annualized in the process. Reported loss figures vary slightly by source, $35.44 million per Lookonchain and TechFlow, $36.13 million per Phemex, worth noting that spread rather than picking one number as precise to the dollar.
Context matters here. ZEC is up roughly 178% over the past month, and Zcash ETFs pulled in $98.2 million last week alone, the most of any of the 14 products in that category. Jin wasn't the only short holder getting run over either, per BeInCrypto, other tracked wallets were sitting $10 to $12 million underwater on smaller ZEC shorts around the same window. Jin still holds 202,078 ZEC in spot, worth roughly $309 million, with an estimated $221 million unrealized profit on that position, alongside a separate 1,330 BTC long worth about $107.77 million.
My honest read: the realized loss on the short doesn't erase what's still a massive net position in his favor overall, this reads as one specific trade going badly wrong inside a portfolio that's still deeply profitable.
What I'm watching: whether Jin re-enters a ZEC short at a new level, given his track record of doing exactly that after past losses, or steps back from the position entirely.
$ZEC #BTC Price Analysis# #Macro Insights# #BNBChain#
Garrett Jin, former BitForex CEO, rebuilt his ZEC short in June with an initial 11,780 ZEC position worth about $4.92 million, then kept adding as Zcash climbed, eventually growing it to around 40,000 ZEC before closing 38,000 of it today via market orders over roughly 90 minutes. The exit itself briefly pushed ZEC up 2.7%, from $1,490 to $1,530, and spiked Hyperliquid's funding rate above 170% annualized in the process. Reported loss figures vary slightly by source, $35.44 million per Lookonchain and TechFlow, $36.13 million per Phemex, worth noting that spread rather than picking one number as precise to the dollar.
Context matters here. ZEC is up roughly 178% over the past month, and Zcash ETFs pulled in $98.2 million last week alone, the most of any of the 14 products in that category. Jin wasn't the only short holder getting run over either, per BeInCrypto, other tracked wallets were sitting $10 to $12 million underwater on smaller ZEC shorts around the same window. Jin still holds 202,078 ZEC in spot, worth roughly $309 million, with an estimated $221 million unrealized profit on that position, alongside a separate 1,330 BTC long worth about $107.77 million.
My honest read: the realized loss on the short doesn't erase what's still a massive net position in his favor overall, this reads as one specific trade going badly wrong inside a portfolio that's still deeply profitable.
What I'm watching: whether Jin re-enters a ZEC short at a new level, given his track record of doing exactly that after past losses, or steps back from the position entirely.
$ZEC #BTC Price Analysis# #Macro Insights# #BNBChain#

47
·
--
Tarjimani ko‘rish
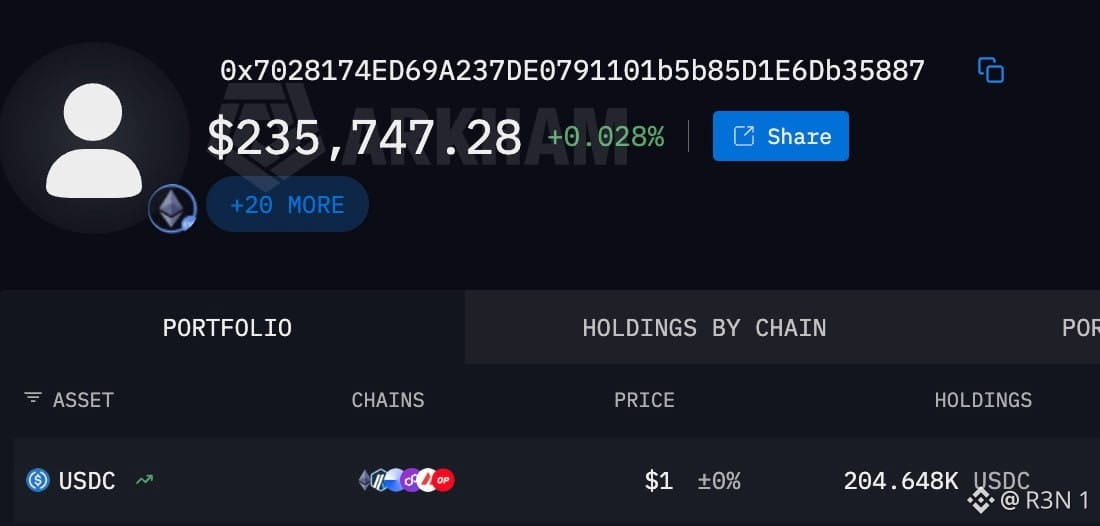
Over $235,000 gone from hundreds of wallets in 48 hours, and nobody's actually named the malware doing it. That gap between the dollar figure and the missing details is the real story here.
The mechanics being described are straightforward enough, a remote access trojan harvesting credentials and hijacking active sessions to bypass authentication entirely, letting attackers piggyback on a victim's already logged in state rather than needing to steal a password and log in separately.
That's a real, well understood attack pattern. What's missing is everything that would normally accompany a claim like this, no named malware family, no malicious domains, no file hashes, no command and control infrastructure, no security researchers attached to the findings.
There's a real on chain trail behind it though. An Ethereum address tied to this activity showed up in a Russian language Telegram post two days before the wider "malware" framing spread, describing it as a new drainer wallet and claiming similar addresses were pulling in at least $200,000 a day. That claim hasn't been independently verified either, but it's the closest thing to hard evidence attached to any of this so far.
My honest take: something real is happening, hundreds of victims and a documented wallet aren't nothing. But right now this is a wallet balance with a headline attached, not a mapped out malware campaign. Calling it a confirmed RAT operation with known mechanics gets ahead of what's actually been shown.
What I'd want before treating this as settled: an actual security report naming the strain and how it's spreading, since that's the one piece every version of this story is still missing.
$BTC #Altcoin Season# $ETH #BTC Price Analysis#
Over $235,000 gone from hundreds of wallets in 48 hours, and nobody's actually named the malware doing it. That gap between the dollar figure and the missing details is the real story here.
The mechanics being described are straightforward enough, a remote access trojan harvesting credentials and hijacking active sessions to bypass authentication entirely, letting attackers piggyback on a victim's already logged in state rather than needing to steal a password and log in separately.
That's a real, well understood attack pattern. What's missing is everything that would normally accompany a claim like this, no named malware family, no malicious domains, no file hashes, no command and control infrastructure, no security researchers attached to the findings.
There's a real on chain trail behind it though. An Ethereum address tied to this activity showed up in a Russian language Telegram post two days before the wider "malware" framing spread, describing it as a new drainer wallet and claiming similar addresses were pulling in at least $200,000 a day. That claim hasn't been independently verified either, but it's the closest thing to hard evidence attached to any of this so far.
My honest take: something real is happening, hundreds of victims and a documented wallet aren't nothing. But right now this is a wallet balance with a headline attached, not a mapped out malware campaign. Calling it a confirmed RAT operation with known mechanics gets ahead of what's actually been shown.
What I'd want before treating this as settled: an actual security report naming the strain and how it's spreading, since that's the one piece every version of this story is still missing.
$BTC #Altcoin Season# $ETH #BTC Price Analysis#
The mechanics being described are straightforward enough, a remote access trojan harvesting credentials and hijacking active sessions to bypass authentication entirely, letting attackers piggyback on a victim's already logged in state rather than needing to steal a password and log in separately.
That's a real, well understood attack pattern. What's missing is everything that would normally accompany a claim like this, no named malware family, no malicious domains, no file hashes, no command and control infrastructure, no security researchers attached to the findings.
There's a real on chain trail behind it though. An Ethereum address tied to this activity showed up in a Russian language Telegram post two days before the wider "malware" framing spread, describing it as a new drainer wallet and claiming similar addresses were pulling in at least $200,000 a day. That claim hasn't been independently verified either, but it's the closest thing to hard evidence attached to any of this so far.
My honest take: something real is happening, hundreds of victims and a documented wallet aren't nothing. But right now this is a wallet balance with a headline attached, not a mapped out malware campaign. Calling it a confirmed RAT operation with known mechanics gets ahead of what's actually been shown.
What I'd want before treating this as settled: an actual security report naming the strain and how it's spreading, since that's the one piece every version of this story is still missing.
$BTC #Altcoin Season# $ETH #BTC Price Analysis#
60
·
--
Tarjimani ko‘rish
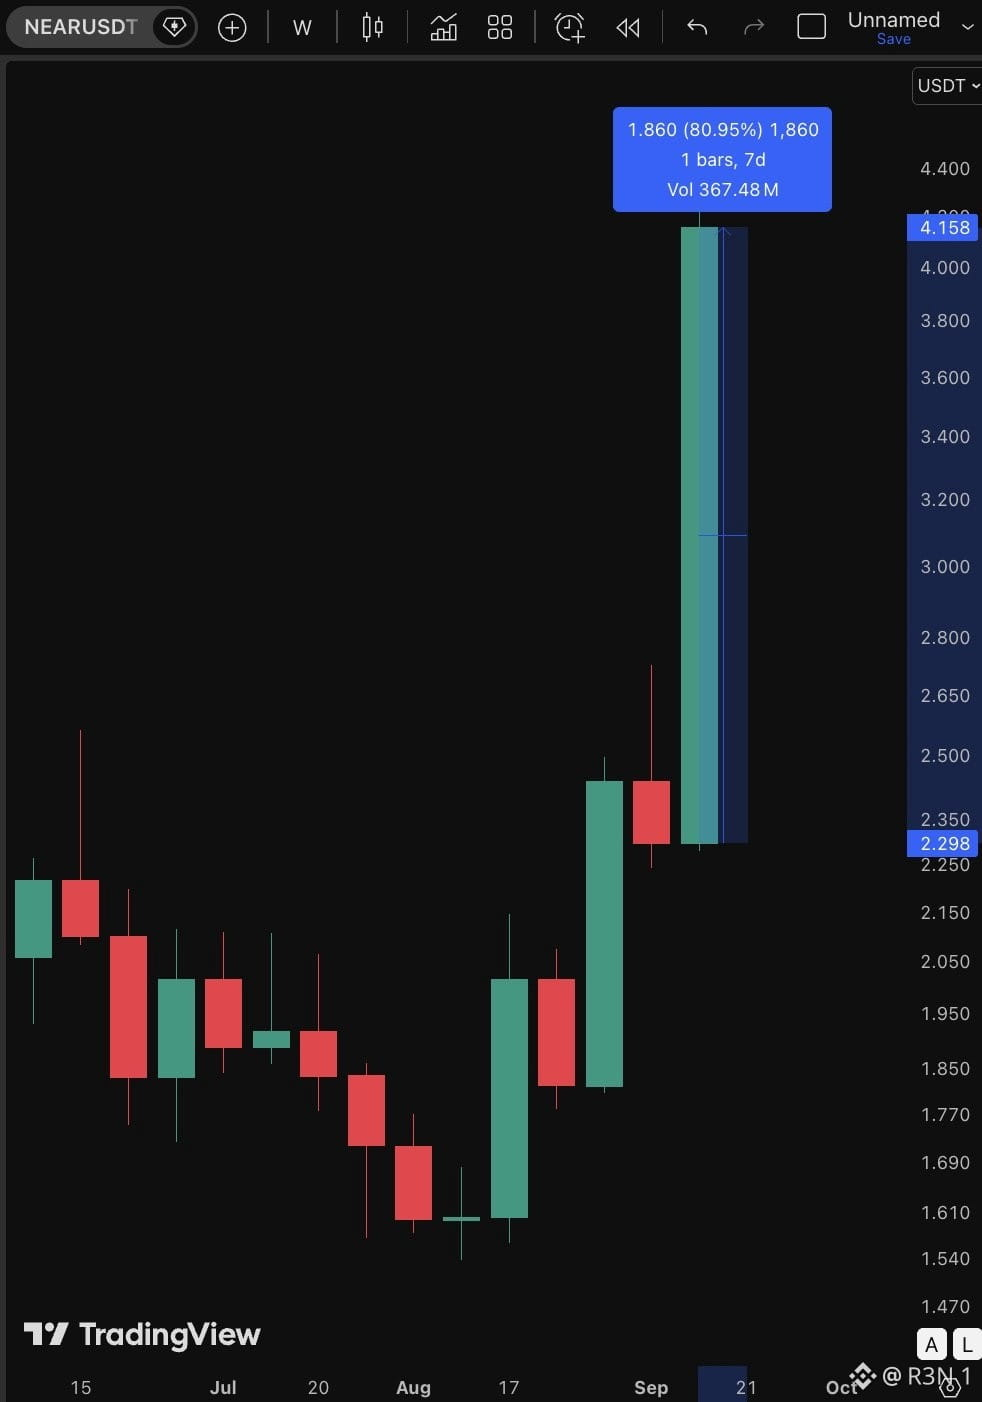
NEAR is up 80.95% over the past seven days, climbing from roughly $2.30 to $4.16, one of the sharper weekly moves in the market right now. Market cap alone jumped from $4.51B to $5.61B in a little over a day recently, on $4.31B in volume.
The catalyst behind it is real and shipped, not just narrative. NEAR launched confidential perpetual futures on September 17, powered by Hyperliquid's execution engine, letting traders open positions without publicly linking them to their accounts.
Funding stays private, settlement stays on a public order book. That's a meaningful design choice, most decentralized perp venues, Hyperliquid's own native interface included, keep account activity fully traceable. TVL in this product hit $70 million, triggering an incentive program unlocking 333,333 tokens once the three day volume weighted average price holds at or above $3.33. 24 hour trading volume reportedly spiked over 120% alongside the move.
What I find genuinely interesting here is the structural choice, NEAR outsourced execution entirely to Hyperliquid rather than building its own order book from scratch, tapping into roughly $240 billion in Hyperliquid's own monthly perp volume instead of bootstrapping liquidity from nothing.
My honest read: this rally has real fundamentals behind it, a shipped product with actual TVL, not just narrative. But weekly RSI is reportedly sitting above 70, overbought territory, and a chunk of this move is tied to that incentive threshold specifically, which creates its own kind of reflexive pressure around $3.33.
What I'm watching: whether NEAR holds above that incentive threshold once the token unlock event passes, or whether this fades once the mechanical demand behind it clears.
#BTC Price Analysis# #Macro Insights# $NEAR
NEAR is up 80.95% over the past seven days, climbing from roughly $2.30 to $4.16, one of the sharper weekly moves in the market right now. Market cap alone jumped from $4.51B to $5.61B in a little over a day recently, on $4.31B in volume.
The catalyst behind it is real and shipped, not just narrative. NEAR launched confidential perpetual futures on September 17, powered by Hyperliquid's execution engine, letting traders open positions without publicly linking them to their accounts.
Funding stays private, settlement stays on a public order book. That's a meaningful design choice, most decentralized perp venues, Hyperliquid's own native interface included, keep account activity fully traceable. TVL in this product hit $70 million, triggering an incentive program unlocking 333,333 tokens once the three day volume weighted average price holds at or above $3.33. 24 hour trading volume reportedly spiked over 120% alongside the move.
What I find genuinely interesting here is the structural choice, NEAR outsourced execution entirely to Hyperliquid rather than building its own order book from scratch, tapping into roughly $240 billion in Hyperliquid's own monthly perp volume instead of bootstrapping liquidity from nothing.
My honest read: this rally has real fundamentals behind it, a shipped product with actual TVL, not just narrative. But weekly RSI is reportedly sitting above 70, overbought territory, and a chunk of this move is tied to that incentive threshold specifically, which creates its own kind of reflexive pressure around $3.33.
What I'm watching: whether NEAR holds above that incentive threshold once the token unlock event passes, or whether this fades once the mechanical demand behind it clears.
#BTC Price Analysis# #Macro Insights# $NEAR
The catalyst behind it is real and shipped, not just narrative. NEAR launched confidential perpetual futures on September 17, powered by Hyperliquid's execution engine, letting traders open positions without publicly linking them to their accounts.
Funding stays private, settlement stays on a public order book. That's a meaningful design choice, most decentralized perp venues, Hyperliquid's own native interface included, keep account activity fully traceable. TVL in this product hit $70 million, triggering an incentive program unlocking 333,333 tokens once the three day volume weighted average price holds at or above $3.33. 24 hour trading volume reportedly spiked over 120% alongside the move.
What I find genuinely interesting here is the structural choice, NEAR outsourced execution entirely to Hyperliquid rather than building its own order book from scratch, tapping into roughly $240 billion in Hyperliquid's own monthly perp volume instead of bootstrapping liquidity from nothing.
My honest read: this rally has real fundamentals behind it, a shipped product with actual TVL, not just narrative. But weekly RSI is reportedly sitting above 70, overbought territory, and a chunk of this move is tied to that incentive threshold specifically, which creates its own kind of reflexive pressure around $3.33.
What I'm watching: whether NEAR holds above that incentive threshold once the token unlock event passes, or whether this fades once the mechanical demand behind it clears.
#BTC Price Analysis# #Macro Insights# $NEAR
26
·
--
Tarjimani ko‘rish
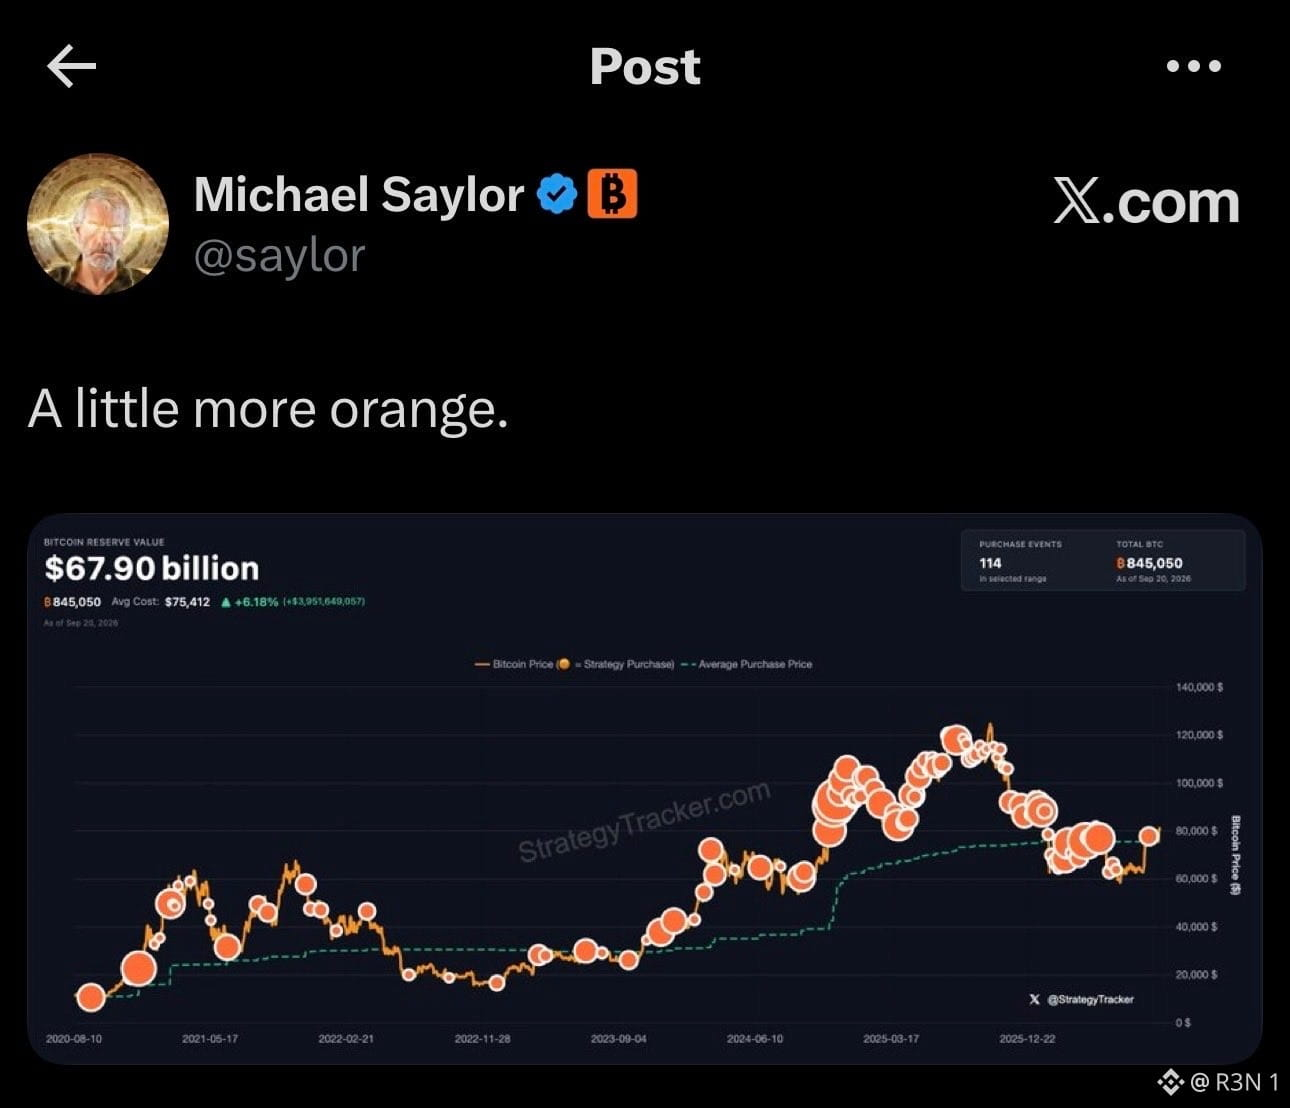
A little more orange." That's the entire post, no dollar figure, no BTC count, just Saylor sharing Strategy's Bitcoin tracker on X today. Markets read it as a buy signal anyway, and historically that read has been right more often than not.
Strategy's last confirmed purchase was August 31, 4,603 BTC at an average price of $80,318, bringing holdings to roughly 846,060 BTC total across 114 purchases, still the largest corporate Bitcoin position by a wide margin. Since then the company's been quiet on accumulation, focusing instead on repurchasing its STRC preferred stock, which has clawed back to $98.51, close to its $100 par value after dropping as low as $75 earlier this year.
Worth being honest about the track record here rather than treating every tease as guaranteed. Saylor's cryptic posts, "We're ₿ack," "Orange or Green," now "A little more orange," have preceded actual purchases plenty of times, but AMBCrypto specifically noted several recent teases preceded BTC selloffs rather than rallies. There's no confirmed transaction yet, this is pattern recognition off a public figure's social media, not an announced buy.
My honest read: the base rate on these posts leading to a real purchase within days is genuinely high given Strategy's history, that's not nothing. But calling this a confirmed signal before the actual 8-K filing or press release lands overstates what a two word post actually tells you.
What I'm watching: whether Strategy files an actual purchase disclosure in the next few days, and if so, what price it lands at given BTC's own volatility around this week's Fed and CLARITY headlines.
$BTC #BTC Price Analysis# #Bitcoin Price Prediction: What is Bitcoins next move?#
A little more orange." That's the entire post, no dollar figure, no BTC count, just Saylor sharing Strategy's Bitcoin tracker on X today. Markets read it as a buy signal anyway, and historically that read has been right more often than not.
Strategy's last confirmed purchase was August 31, 4,603 BTC at an average price of $80,318, bringing holdings to roughly 846,060 BTC total across 114 purchases, still the largest corporate Bitcoin position by a wide margin. Since then the company's been quiet on accumulation, focusing instead on repurchasing its STRC preferred stock, which has clawed back to $98.51, close to its $100 par value after dropping as low as $75 earlier this year.
Worth being honest about the track record here rather than treating every tease as guaranteed. Saylor's cryptic posts, "We're ₿ack," "Orange or Green," now "A little more orange," have preceded actual purchases plenty of times, but AMBCrypto specifically noted several recent teases preceded BTC selloffs rather than rallies. There's no confirmed transaction yet, this is pattern recognition off a public figure's social media, not an announced buy.
My honest read: the base rate on these posts leading to a real purchase within days is genuinely high given Strategy's history, that's not nothing. But calling this a confirmed signal before the actual 8-K filing or press release lands overstates what a two word post actually tells you.
What I'm watching: whether Strategy files an actual purchase disclosure in the next few days, and if so, what price it lands at given BTC's own volatility around this week's Fed and CLARITY headlines.
$BTC #BTC Price Analysis# #Bitcoin Price Prediction: What is Bitcoins next move?#
Strategy's last confirmed purchase was August 31, 4,603 BTC at an average price of $80,318, bringing holdings to roughly 846,060 BTC total across 114 purchases, still the largest corporate Bitcoin position by a wide margin. Since then the company's been quiet on accumulation, focusing instead on repurchasing its STRC preferred stock, which has clawed back to $98.51, close to its $100 par value after dropping as low as $75 earlier this year.
Worth being honest about the track record here rather than treating every tease as guaranteed. Saylor's cryptic posts, "We're ₿ack," "Orange or Green," now "A little more orange," have preceded actual purchases plenty of times, but AMBCrypto specifically noted several recent teases preceded BTC selloffs rather than rallies. There's no confirmed transaction yet, this is pattern recognition off a public figure's social media, not an announced buy.
My honest read: the base rate on these posts leading to a real purchase within days is genuinely high given Strategy's history, that's not nothing. But calling this a confirmed signal before the actual 8-K filing or press release lands overstates what a two word post actually tells you.
What I'm watching: whether Strategy files an actual purchase disclosure in the next few days, and if so, what price it lands at given BTC's own volatility around this week's Fed and CLARITY headlines.
$BTC #BTC Price Analysis# #Bitcoin Price Prediction: What is Bitcoins next move?#
83
·
--
Tarjimani ko‘rish
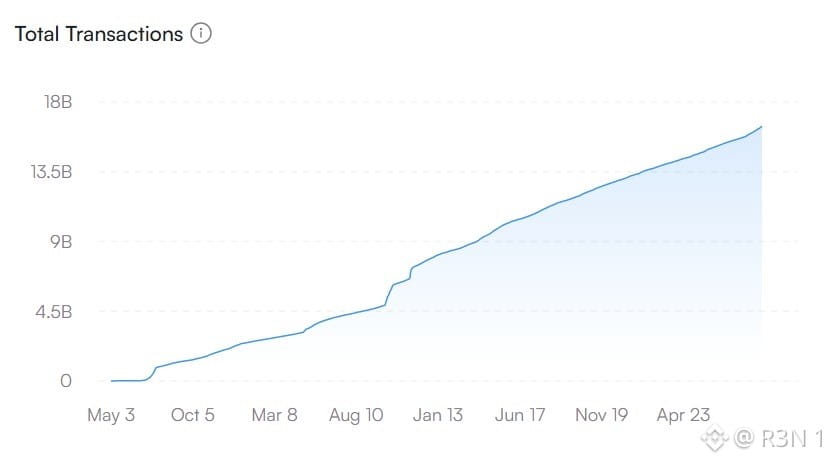
Sui just crossed 16 billion lifetime transactions and is closing in on 18 billion, and the more useful comparison here isn't the raw total, it's the acceleration curve underneath it.
SuiVision data put the count at roughly 16.17 billion about a week ago. If it's now near 16.44 billion and pushing toward 18 billion, that's a real, sustained pace of growth, not a one-off spike from a single event or airdrop farming wave.
What stands out to me is how this compares to Sui's own recent stress tests. The network demonstrated a peak of over 6 million TPS in a controlled July experiment using offchain programmable payment tunnels, a number that's explicitly not comparable to routine daily throughput, since it settled batched activity rather than reflecting sustained on-chain load. The 80.3 TPS figure, whatever its refresh status, is the more honest read on what typical network activity actually looks like day to day.
Context that matters for interpreting the transaction count itself, Sui's architecture processes simple transfers with minimal consensus overhead, which structurally inflates raw transaction counts relative to chains where every action goes through full consensus. That's not a criticism, it's a design choice that makes Sui's transaction totals genuinely hard to compare apples-to-apples against other L1s without adjusting for what counts as a "transaction" in each system.
The open question isn't whether Sui hits 18 billion, the trajectory suggests it will. It's whether that growth reflects durable usage, stablecoin settlement, the Hashi Bitcoin collateral protocol, real application activity, or whether a meaningful share is low-value, high-frequency transfers that inflate the count without reflecting proportional economic activity on the network.
#BTC Price Analysis# #Macro Insights# #Macro Insights# $SUI
Sui just crossed 16 billion lifetime transactions and is closing in on 18 billion, and the more useful comparison here isn't the raw total, it's the acceleration curve underneath it.
SuiVision data put the count at roughly 16.17 billion about a week ago. If it's now near 16.44 billion and pushing toward 18 billion, that's a real, sustained pace of growth, not a one-off spike from a single event or airdrop farming wave.
What stands out to me is how this compares to Sui's own recent stress tests. The network demonstrated a peak of over 6 million TPS in a controlled July experiment using offchain programmable payment tunnels, a number that's explicitly not comparable to routine daily throughput, since it settled batched activity rather than reflecting sustained on-chain load. The 80.3 TPS figure, whatever its refresh status, is the more honest read on what typical network activity actually looks like day to day.
Context that matters for interpreting the transaction count itself, Sui's architecture processes simple transfers with minimal consensus overhead, which structurally inflates raw transaction counts relative to chains where every action goes through full consensus. That's not a criticism, it's a design choice that makes Sui's transaction totals genuinely hard to compare apples-to-apples against other L1s without adjusting for what counts as a "transaction" in each system.
The open question isn't whether Sui hits 18 billion, the trajectory suggests it will. It's whether that growth reflects durable usage, stablecoin settlement, the Hashi Bitcoin collateral protocol, real application activity, or whether a meaningful share is low-value, high-frequency transfers that inflate the count without reflecting proportional economic activity on the network.
#BTC Price Analysis# #Macro Insights# #Macro Insights# $SUI
SuiVision data put the count at roughly 16.17 billion about a week ago. If it's now near 16.44 billion and pushing toward 18 billion, that's a real, sustained pace of growth, not a one-off spike from a single event or airdrop farming wave.
What stands out to me is how this compares to Sui's own recent stress tests. The network demonstrated a peak of over 6 million TPS in a controlled July experiment using offchain programmable payment tunnels, a number that's explicitly not comparable to routine daily throughput, since it settled batched activity rather than reflecting sustained on-chain load. The 80.3 TPS figure, whatever its refresh status, is the more honest read on what typical network activity actually looks like day to day.
Context that matters for interpreting the transaction count itself, Sui's architecture processes simple transfers with minimal consensus overhead, which structurally inflates raw transaction counts relative to chains where every action goes through full consensus. That's not a criticism, it's a design choice that makes Sui's transaction totals genuinely hard to compare apples-to-apples against other L1s without adjusting for what counts as a "transaction" in each system.
The open question isn't whether Sui hits 18 billion, the trajectory suggests it will. It's whether that growth reflects durable usage, stablecoin settlement, the Hashi Bitcoin collateral protocol, real application activity, or whether a meaningful share is low-value, high-frequency transfers that inflate the count without reflecting proportional economic activity on the network.
#BTC Price Analysis# #Macro Insights# #Macro Insights# $SUI
52
·
--
Tarjimani ko‘rish
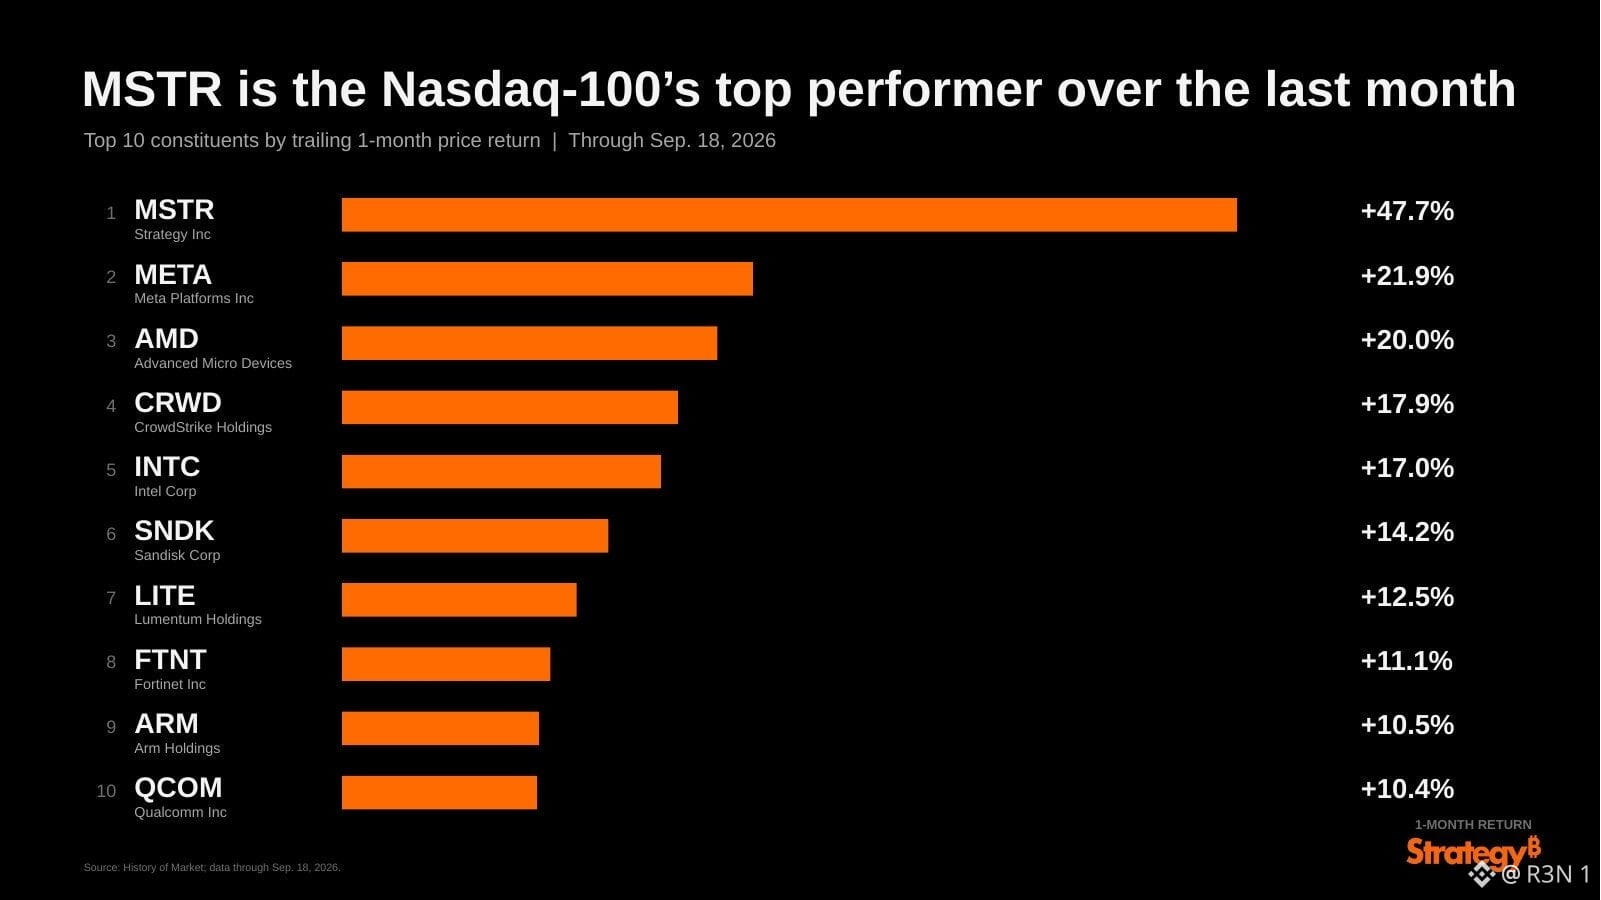
MSTR beat the second place Nasdaq 100 finisher by more than double. Meta gained 21.9% over the same month, Strategy gained 47.7 to 48%, depending on the exact source, making it the single best performer in the entire index.
The stock closed at $153.92 on September 18 after a 16.39% single session surge alone. Two forces are driving this together, per multiple reports. Bitcoin's own push back toward $80,000 is the obvious one, MSTR trades as a high beta proxy for BTC given its balance sheet. The second is regulatory, the House Financial Services Committee advancing a Strategic Bitcoin Reserve bill, and the SEC granting a separate exemption tied to tokenized stock trading, both landing in the same window and adding a policy tailwind on top of the price move.
Worth being direct about what MSTR actually is at this point. It's functionally a one asset company, the software business still exists on paper, but it's a rounding error next to the Bitcoin holdings dominating the balance sheet. That's the entire investment thesis either way, MSTR gives regulated brokerage access to concentrated BTC exposure, no wallets or custody involved, but the stock's fate is tied almost entirely to Bitcoin's own price action, with leverage baked into the balance sheet structure.
My honest read: this is a legitimate, well documented outperformance, not an isolated anomaly, it tracks cleanly with BTC's own move and real regulatory catalysts landing at the same time. But the concentration risk cuts both ways, the same structure that produced 48% in a month when BTC rallied would produce an equally onsized move if BTC reverses.
What I'm watching: whether MSTR's premium to its actual Bitcoin holdings expands or compresses from here, since that spread matters as much as BTC's price itself for how this stock trades next.
$BTC #Altcoin Season# #BTC Price Analysis# $XAUt
MSTR beat the second place Nasdaq 100 finisher by more than double. Meta gained 21.9% over the same month, Strategy gained 47.7 to 48%, depending on the exact source, making it the single best performer in the entire index.
The stock closed at $153.92 on September 18 after a 16.39% single session surge alone. Two forces are driving this together, per multiple reports. Bitcoin's own push back toward $80,000 is the obvious one, MSTR trades as a high beta proxy for BTC given its balance sheet. The second is regulatory, the House Financial Services Committee advancing a Strategic Bitcoin Reserve bill, and the SEC granting a separate exemption tied to tokenized stock trading, both landing in the same window and adding a policy tailwind on top of the price move.
Worth being direct about what MSTR actually is at this point. It's functionally a one asset company, the software business still exists on paper, but it's a rounding error next to the Bitcoin holdings dominating the balance sheet. That's the entire investment thesis either way, MSTR gives regulated brokerage access to concentrated BTC exposure, no wallets or custody involved, but the stock's fate is tied almost entirely to Bitcoin's own price action, with leverage baked into the balance sheet structure.
My honest read: this is a legitimate, well documented outperformance, not an isolated anomaly, it tracks cleanly with BTC's own move and real regulatory catalysts landing at the same time. But the concentration risk cuts both ways, the same structure that produced 48% in a month when BTC rallied would produce an equally onsized move if BTC reverses.
What I'm watching: whether MSTR's premium to its actual Bitcoin holdings expands or compresses from here, since that spread matters as much as BTC's price itself for how this stock trades next.
$BTC #Altcoin Season# #BTC Price Analysis# $XAUt
The stock closed at $153.92 on September 18 after a 16.39% single session surge alone. Two forces are driving this together, per multiple reports. Bitcoin's own push back toward $80,000 is the obvious one, MSTR trades as a high beta proxy for BTC given its balance sheet. The second is regulatory, the House Financial Services Committee advancing a Strategic Bitcoin Reserve bill, and the SEC granting a separate exemption tied to tokenized stock trading, both landing in the same window and adding a policy tailwind on top of the price move.
Worth being direct about what MSTR actually is at this point. It's functionally a one asset company, the software business still exists on paper, but it's a rounding error next to the Bitcoin holdings dominating the balance sheet. That's the entire investment thesis either way, MSTR gives regulated brokerage access to concentrated BTC exposure, no wallets or custody involved, but the stock's fate is tied almost entirely to Bitcoin's own price action, with leverage baked into the balance sheet structure.
My honest read: this is a legitimate, well documented outperformance, not an isolated anomaly, it tracks cleanly with BTC's own move and real regulatory catalysts landing at the same time. But the concentration risk cuts both ways, the same structure that produced 48% in a month when BTC rallied would produce an equally onsized move if BTC reverses.
What I'm watching: whether MSTR's premium to its actual Bitcoin holdings expands or compresses from here, since that spread matters as much as BTC's price itself for how this stock trades next.
$BTC #Altcoin Season# #BTC Price Analysis# $XAUt
58
·
--
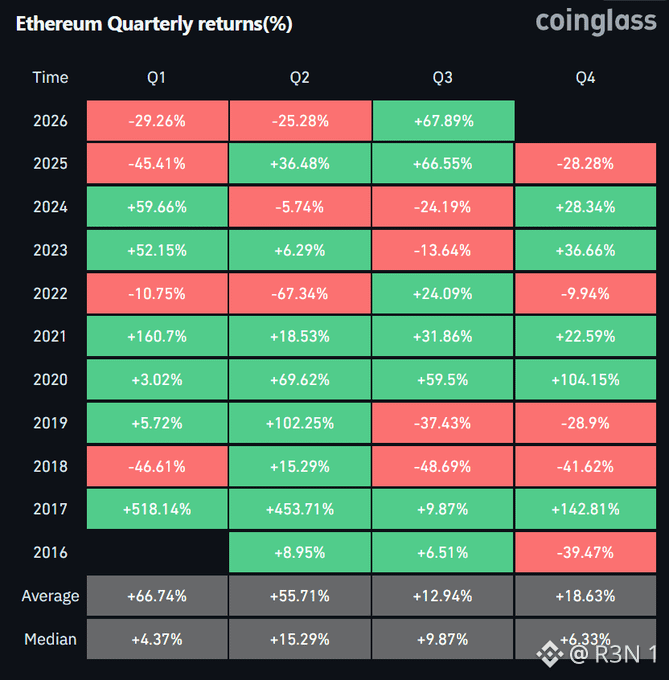
To‘liq tarixga nazar tashlasak, ETHning bu yilgacha bo‘lgan Q3 ko‘rsatkichi 2020-yilning +59.5% i bo‘lgan, 2025-yil esa undan sal orqada — +66.55%. Bu chorak ikkisini ham ortda qoldiradi, ko‘rsatilgan raqamlar bo‘yicha haqiqiy rekord. Ammo sarlavhadan ko‘ra men uchun qiziqroq narsa — Q3 bo‘yicha to‘liq ma’lumotlar to‘plamining o‘rtacha emas, median qaytimi. Q3 median qaytimi +9.87% bo‘lib, +12.94% (o‘rtacha qiymat) va bu yilgi +67.89% dan ancha past. Median va o‘rtacha o‘rtasidagi farq shuni ko‘rsatadiki, Q3 natijalari odatda «o‘rtacha» raqam aytganidan ancha mo‘’tadilroq bo‘ladi; masalan, 2017-yilning +9.87% kabi bir-ikki chetki (outlier) yil Q3 bo‘yicha aslida eng kichik ko‘rsatkichlardan biri bo‘lishi mumkin. Bu yilgi raqam ham o‘sha o‘rtachani yuqoriga tortib yuborishda katta rol o‘ynaydi. Bevosita e’tibor berishga arziydigan naqsh shundaki: kuchli Q3lardan keyin nima bo‘ladi. 2025-yilda +66.55% bo‘lgan kuchli Q3dan keyin Q4da -28.28% zarar qayd etilgan. 2020-yilda +59.5% bilan juda katta Q3 bo‘lgan, aslida undan keyin yanada kattaroq Q4 o‘sish — +104.15% — kelgan, ya’ni u teskari tomonga ishlagan. Faqat ikki ta ma’lumot punkti o‘zi bilan ishonchli naqsh bera olmaydi, lekin u shuni ko‘rsatadiki, tarixda ajralib turadigan Q3 odatda davomiylik ham, keskin teskari harakat ham oldidan bo‘lgan: doim bittasini emas. Bu yerda tanlama hajmi muammosini ham to‘g‘ridan-to‘g‘ri aytish kerak. Choraklik ma’lumotlarning o‘n yilligi statistik xulosa chiqarish uchun juda ham «ingichka»; kriptodagi yuqori volatillik esa alohida chetki choraklar (masalan, 2017-yilning +518% Q1i) o‘rtachalarni shunday buzadiki, jadvalni bashorat vositasidan ko‘ra rekordlar kitobi sifatida qiziqroq qiladi. Muhim savol Q3 realmi-yo‘qmi emas — ma’lumotlar buni tasdiqlaydi. Savol shuki, Q4 2026 2025 yil ssenariysini takrorlaydimi: kuchli Q3dagi yutuqlar qaytariladimi, yoki 2020 ssenariysini — kuch ya’ni tezlik keyingi bosqichga kuchayib, yakunda yanada katta natijaga olib keladimi. Bu bitta jadval qaysi biri ekanini aytib berolmaydi. #BTC Price Analysis# $ETH #Altcoin Season#
To‘liq tarixga nazar tashlasak, ETHning bu yilgacha bo‘lgan Q3 ko‘rsatkichi 2020-yilning +59.5% i bo‘lgan, 2025-yil esa undan sal orqada — +66.55%. Bu chorak ikkisini ham ortda qoldiradi, ko‘rsatilgan raqamlar bo‘yicha haqiqiy rekord. Ammo sarlavhadan ko‘ra men uchun qiziqroq narsa — Q3 bo‘yicha to‘liq ma’lumotlar to‘plamining o‘rtacha emas, median qaytimi. Q3 median qaytimi +9.87% bo‘lib, +12.94% (o‘rtacha qiymat) va bu yilgi +67.89% dan ancha past. Median va o‘rtacha o‘rtasidagi farq shuni ko‘rsatadiki, Q3 natijalari odatda «o‘rtacha» raqam aytganidan ancha mo‘’tadilroq bo‘ladi; masalan, 2017-yilning +9.87% kabi bir-ikki chetki (outlier) yil Q3 bo‘yicha aslida eng kichik ko‘rsatkichlardan biri bo‘lishi mumkin. Bu yilgi raqam ham o‘sha o‘rtachani yuqoriga tortib yuborishda katta rol o‘ynaydi. Bevosita e’tibor berishga arziydigan naqsh shundaki: kuchli Q3lardan keyin nima bo‘ladi. 2025-yilda +66.55% bo‘lgan kuchli Q3dan keyin Q4da -28.28% zarar qayd etilgan. 2020-yilda +59.5% bilan juda katta Q3 bo‘lgan, aslida undan keyin yanada kattaroq Q4 o‘sish — +104.15% — kelgan, ya’ni u teskari tomonga ishlagan. Faqat ikki ta ma’lumot punkti o‘zi bilan ishonchli naqsh bera olmaydi, lekin u shuni ko‘rsatadiki, tarixda ajralib turadigan Q3 odatda davomiylik ham, keskin teskari harakat ham oldidan bo‘lgan: doim bittasini emas. Bu yerda tanlama hajmi muammosini ham to‘g‘ridan-to‘g‘ri aytish kerak. Choraklik ma’lumotlarning o‘n yilligi statistik xulosa chiqarish uchun juda ham «ingichka»; kriptodagi yuqori volatillik esa alohida chetki choraklar (masalan, 2017-yilning +518% Q1i) o‘rtachalarni shunday buzadiki, jadvalni bashorat vositasidan ko‘ra rekordlar kitobi sifatida qiziqroq qiladi. Muhim savol Q3 realmi-yo‘qmi emas — ma’lumotlar buni tasdiqlaydi. Savol shuki, Q4 2026 2025 yil ssenariysini takrorlaydimi: kuchli Q3dagi yutuqlar qaytariladimi, yoki 2020 ssenariysini — kuch ya’ni tezlik keyingi bosqichga kuchayib, yakunda yanada katta natijaga olib keladimi. Bu bitta jadval qaysi biri ekanini aytib berolmaydi. #BTC Price Analysis# $ETH #Altcoin Season#
52
·
--
Tarjimani ko‘rish
Polygon is the latest destination in STONfi's cross-chain travel guide. The thread framing is clever but the underlying point is practical: Polygon is one of the most active EVM environments outside of Ethereum mainnet and it was previously separated from TON users by the friction of manual bridging. The STONfi description of Polygon is accurate. EVM-compatible, cheaper than Ethereum mainnet, and dense with genuine utility, DeFi, payments, stablecoins, RWAs, prediction markets, and consumer apps all running simultaneously. Billions in stablecoins. Hundreds of millions in DeFi TVL. Millions of daily transactions. This is not a chain coasting on historical relevance. It is actively used infrastructure. The cross-chain problem STONfi is solving for this route is the one that applies to every chain pair before Omniston. A TON user who wants to access a Polygon-native opportunity faces a manual process. Find a bridge. Check supported tokens. Use a separate interface. Wait for confirmation. Possibly swap again after arrival. Each step is solvable. Together they represent friction that converts genuine interest into abstention for most users. Omniston collapses that sequence. Choose the asset and the network. Review the quote. Confirm. Receive. The routing, liquidity sourcing, and execution mechanics happen in the backend rather than in the user's workflow. Polygon as a destination expands the practical reach of every TON user and brings every Polygon user one flow away from TON-native DeFi. Join the campaign → https://cross-chain.ston.fi/ #BTC Price Analysis# $POL #Macro Insights# $BTC
Polygon is the latest destination in STONfi's cross-chain travel guide. The thread framing is clever but the underlying point is practical: Polygon is one of the most active EVM environments outside of Ethereum mainnet and it was previously separated from TON users by the friction of manual bridging. The STONfi description of Polygon is accurate. EVM-compatible, cheaper than Ethereum mainnet, and dense with genuine utility, DeFi, payments, stablecoins, RWAs, prediction markets, and consumer apps all running simultaneously. Billions in stablecoins. Hundreds of millions in DeFi TVL. Millions of daily transactions. This is not a chain coasting on historical relevance. It is actively used infrastructure. The cross-chain problem STONfi is solving for this route is the one that applies to every chain pair before Omniston. A TON user who wants to access a Polygon-native opportunity faces a manual process. Find a bridge. Check supported tokens. Use a separate interface. Wait for confirmation. Possibly swap again after arrival. Each step is solvable. Together they represent friction that converts genuine interest into abstention for most users. Omniston collapses that sequence. Choose the asset and the network. Review the quote. Confirm. Receive. The routing, liquidity sourcing, and execution mechanics happen in the backend rather than in the user's workflow. Polygon as a destination expands the practical reach of every TON user and brings every Polygon user one flow away from TON-native DeFi. Join the campaign → https://cross-chain.ston.fi/ #BTC Price Analysis# $POL #Macro Insights# $BTC

3
·
--
Tarjimani ko‘rish
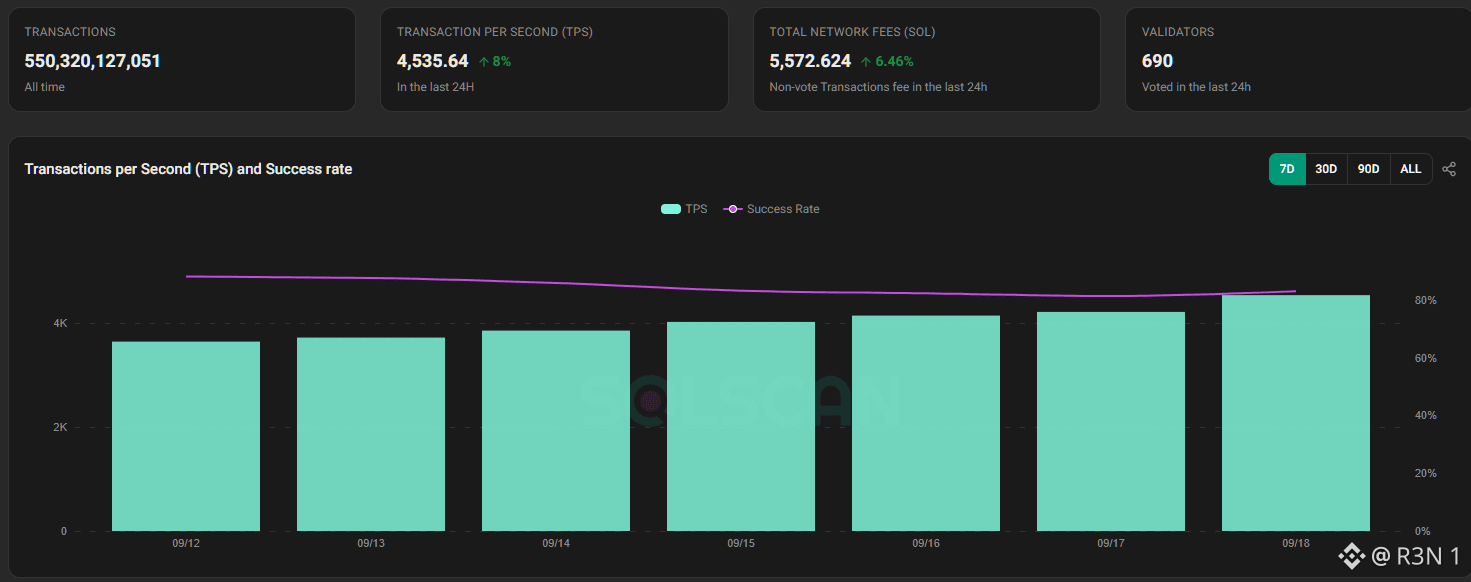
Solana's TPS climbed steadily from roughly 2.3K to over 4.5K across this seven day window, while the success rate line drifted the opposite direction, down from around 80% toward the high 70s. That divergence is actually the more interesting read here than either number alone. The headline figures are real scale. 550.3 billion total transactions processed all time, current TPS at 4,535.64, up 8% in the last 24 hours, non vote network fees at 5,572.624 SOL, up 6.46%, and 690 validators voting within the same window. Throughput and fee revenue both climbing together tracks logically, more transactions generally means more fees paid, that part isn't surprising. What's worth flagging is that rising throughput and a softening success rate moving in opposite directions isn't automatically a red flag, but it's not nothing either. Higher transaction volume can put more pressure on the network, and a slightly lower success rate during a period of rising activity is a pattern worth watching rather than dismissing outright, especially since the decline looks gradual and controlled here, not a sharp cliff. My honest read: this data reads as a network under increasing real load handling it reasonably well, not perfectly. The TPS growth is a genuinely positive signal on its own, actual usage climbing rather than stagnant. The success rate softening slightly alongside that growth is the detail I'd keep an eye on rather than ignore, since it's the kind of early signal that either resolves on its own as infrastructure catches up, or continues degrading if load keeps climbing. What I'm watching: whether that success rate stabilizes or keeps sliding as TPS continues climbing, since the trend in that relationship matters more than either single data point. #SOL #Macro Insights# $SOL #Meme Alpha#
Solana's TPS climbed steadily from roughly 2.3K to over 4.5K across this seven day window, while the success rate line drifted the opposite direction, down from around 80% toward the high 70s. That divergence is actually the more interesting read here than either number alone. The headline figures are real scale. 550.3 billion total transactions processed all time, current TPS at 4,535.64, up 8% in the last 24 hours, non vote network fees at 5,572.624 SOL, up 6.46%, and 690 validators voting within the same window. Throughput and fee revenue both climbing together tracks logically, more transactions generally means more fees paid, that part isn't surprising. What's worth flagging is that rising throughput and a softening success rate moving in opposite directions isn't automatically a red flag, but it's not nothing either. Higher transaction volume can put more pressure on the network, and a slightly lower success rate during a period of rising activity is a pattern worth watching rather than dismissing outright, especially since the decline looks gradual and controlled here, not a sharp cliff. My honest read: this data reads as a network under increasing real load handling it reasonably well, not perfectly. The TPS growth is a genuinely positive signal on its own, actual usage climbing rather than stagnant. The success rate softening slightly alongside that growth is the detail I'd keep an eye on rather than ignore, since it's the kind of early signal that either resolves on its own as infrastructure catches up, or continues degrading if load keeps climbing. What I'm watching: whether that success rate stabilizes or keeps sliding as TPS continues climbing, since the trend in that relationship matters more than either single data point. #SOL #Macro Insights# $SOL #Meme Alpha#
·
--
Tarjimani ko‘rish
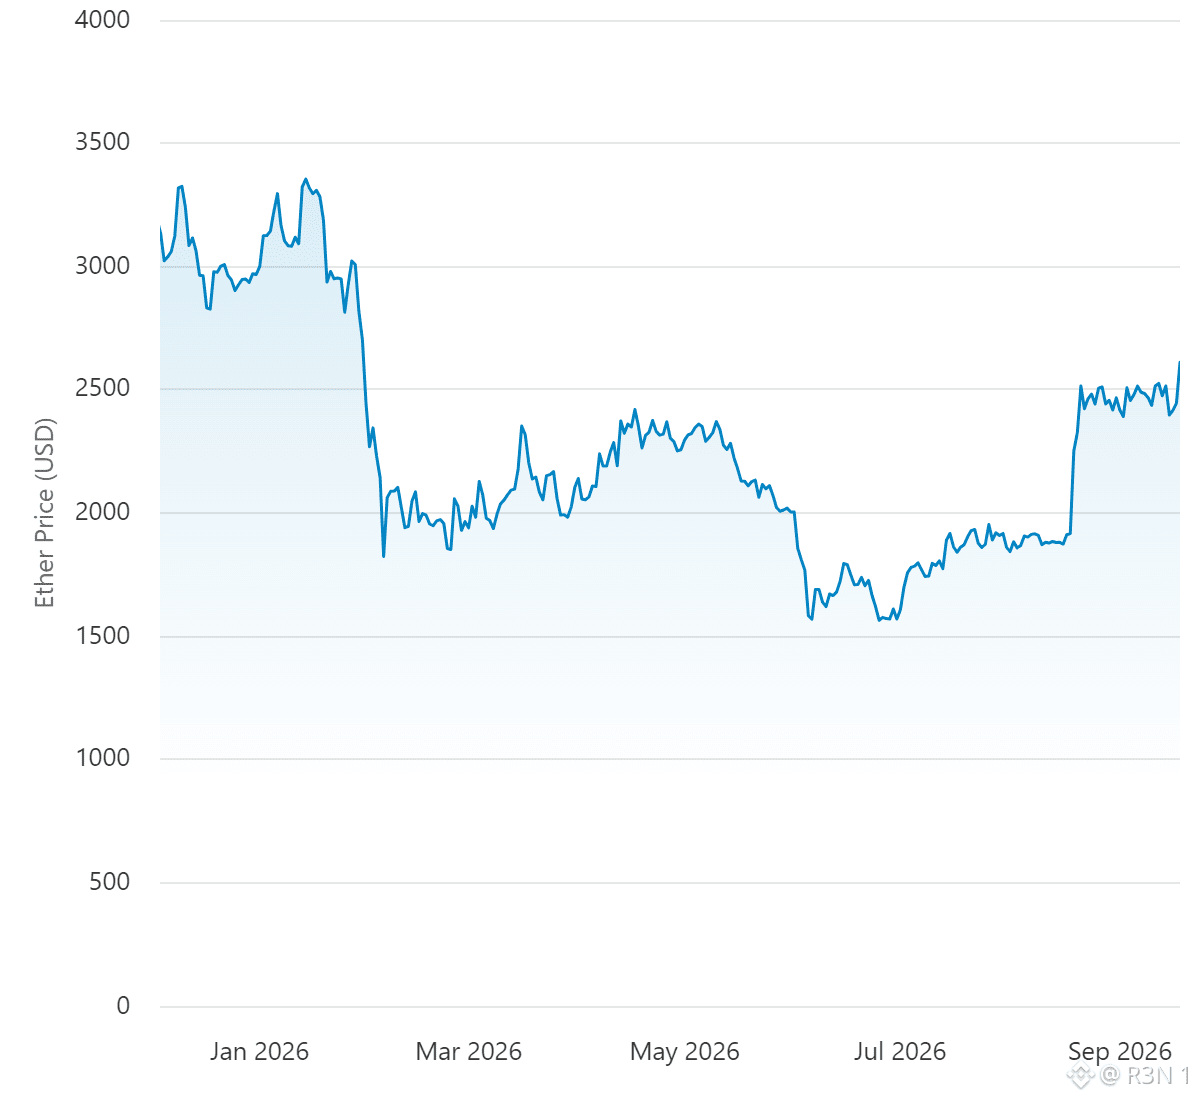
ETH is essentially flat to slightly down for the year looking at this chart, started January near $3,100 to $3,300, and now sits around $2,600. But that framing badly undersells how violent the path between those two points actually was. The year opened with a spike toward $3,350 in mid January, then a sharp break down to around $1,800 to $2,000 by early February, a drop of nearly 45% in weeks. From there, ETH spent February through June chopping in a wide $1,900 to $2,400 range, no clean trend, just repeated failed attempts to break either direction. Then came the real low, a slide to $1,560 to $1,600 around late June into July, the actual bottom of the year so far. Recovery from there was gradual through most of August, climbing back to $1,900 to $2,000, before a sharp, nearly vertical jump to $2,500 in early September, and consolidation in the $2,400 to $2,600 zone since, where it sits now. What stands out to me looking at the full year is the shape of that recovery. The June to August climb was slow and grinding, but the September move was compressed and fast, a genuinely different character of move than the months preceding it. That tends to happen when a level finally gives way after a long consolidation rather than price discovering new information gradually. My honest read: $ETH round tripping most of its January losses by September is a real recovery, not a rounding error, even though the year to date number looks unremarkable on the surface. The real story is the depth of the June low and how sharply price reversed away from it once August's base building resolved. What I'm watching: whether this $2,400 to $2,600 zone holds as the new base, or whether it's still consolidation before the next real directional move, up toward retesting January's highs or back down toward retesting this year's range. $ETH #BTC Price Analysis# #Altcoin Season# #Meme Alpha#
ETH is essentially flat to slightly down for the year looking at this chart, started January near $3,100 to $3,300, and now sits around $2,600. But that framing badly undersells how violent the path between those two points actually was. The year opened with a spike toward $3,350 in mid January, then a sharp break down to around $1,800 to $2,000 by early February, a drop of nearly 45% in weeks. From there, ETH spent February through June chopping in a wide $1,900 to $2,400 range, no clean trend, just repeated failed attempts to break either direction. Then came the real low, a slide to $1,560 to $1,600 around late June into July, the actual bottom of the year so far. Recovery from there was gradual through most of August, climbing back to $1,900 to $2,000, before a sharp, nearly vertical jump to $2,500 in early September, and consolidation in the $2,400 to $2,600 zone since, where it sits now. What stands out to me looking at the full year is the shape of that recovery. The June to August climb was slow and grinding, but the September move was compressed and fast, a genuinely different character of move than the months preceding it. That tends to happen when a level finally gives way after a long consolidation rather than price discovering new information gradually. My honest read: $ETH round tripping most of its January losses by September is a real recovery, not a rounding error, even though the year to date number looks unremarkable on the surface. The real story is the depth of the June low and how sharply price reversed away from it once August's base building resolved. What I'm watching: whether this $2,400 to $2,600 zone holds as the new base, or whether it's still consolidation before the next real directional move, up toward retesting January's highs or back down toward retesting this year's range. $ETH #BTC Price Analysis# #Altcoin Season# #Meme Alpha#
·
--
Tarjimani ko‘rish
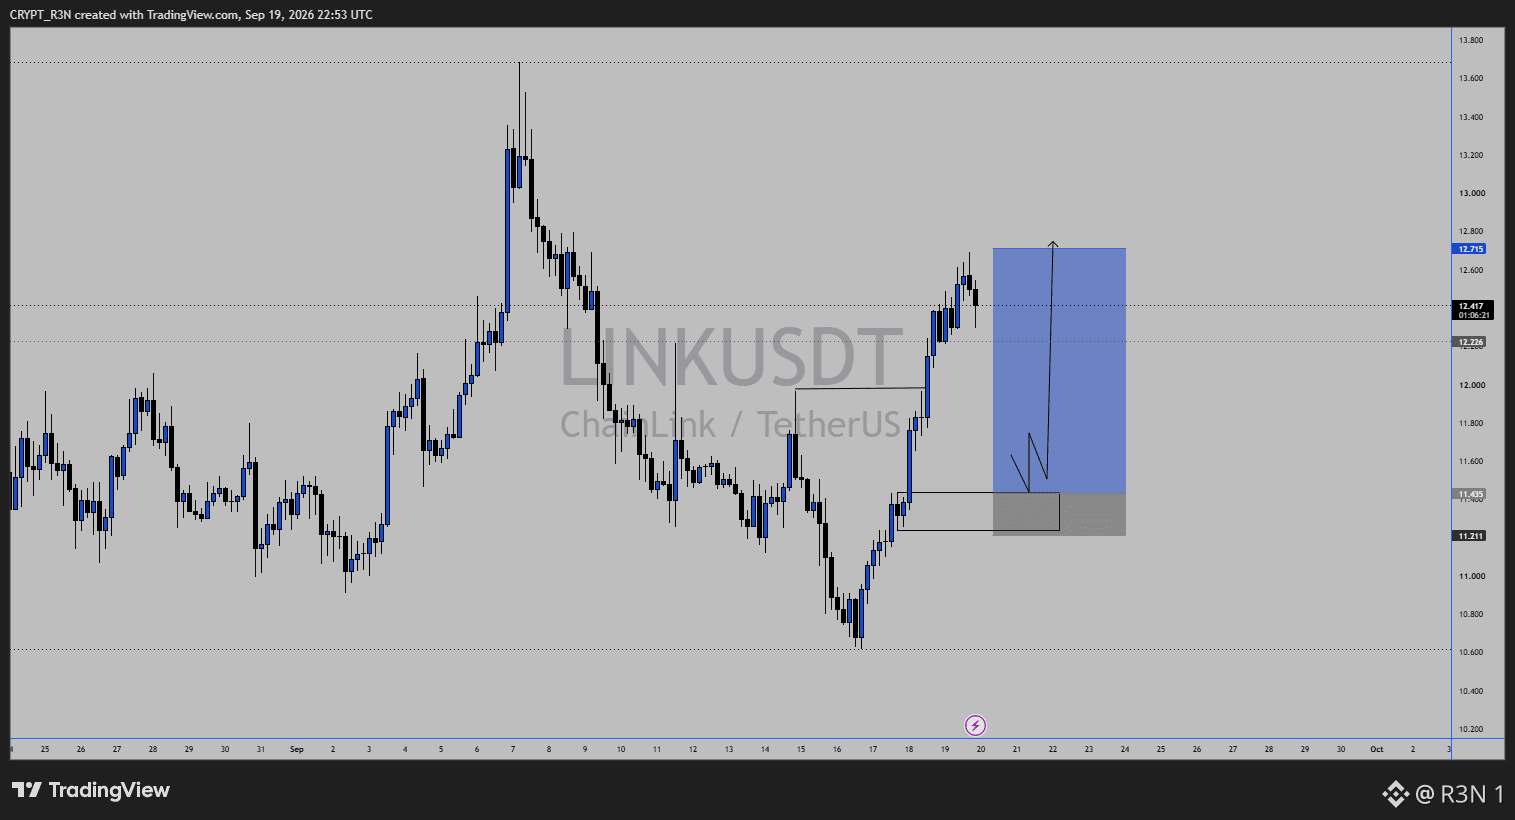
LINK just recovered the entire drop to $10.60 in about three days, and it's now trading above the range that capped it for most of September. That's a genuinely sharp reversal, worth understanding the structure behind it before reading too much into the bounce alone. The broader picture here matters. LINK spiked hard to $13.4 to $13.8 around September 6 to 7, then spent the next week and a half grinding lower, eventually breaking down into a sharp selloff that bottomed near $10.60 to $10.80 around September 16. From there, the recovery has been steep and fast, not a slow grind, price is back at $12.715 as of this chart, clearing the $12.20 to $12.40 zone that had acted as resistance through most of the prior two weeks. The support box I've marked around $11.40 to $11.46 is the level that actually matters if this bounce stalls out. That zone lines up with the base of the recent recovery leg, and holding above it on any pullback would keep this reversal structurally intact rather than turning it into a failed bounce. My honest read: reclaiming the prior resistance zone this fast after such a sharp drop is a constructive sign, it suggests real buying showed up at the $10.60 low rather than just a dead cat bounce that fades immediately. That said, LINK is still well below the September 7 spike high near $13.8, and this whole move has happened over a matter of days, which means it hasn't been tested by much time or a genuine pullback yet. What I'm watching: whether $11.40 to $11.46 holds as support if price pulls back from here, and whether LINK can actually push toward and through that $13.4 to $13.8 zone rather than stalling below it again. #BTC Price Analysis# #Macro Insights# $LINK
LINK just recovered the entire drop to $10.60 in about three days, and it's now trading above the range that capped it for most of September. That's a genuinely sharp reversal, worth understanding the structure behind it before reading too much into the bounce alone. The broader picture here matters. LINK spiked hard to $13.4 to $13.8 around September 6 to 7, then spent the next week and a half grinding lower, eventually breaking down into a sharp selloff that bottomed near $10.60 to $10.80 around September 16. From there, the recovery has been steep and fast, not a slow grind, price is back at $12.715 as of this chart, clearing the $12.20 to $12.40 zone that had acted as resistance through most of the prior two weeks. The support box I've marked around $11.40 to $11.46 is the level that actually matters if this bounce stalls out. That zone lines up with the base of the recent recovery leg, and holding above it on any pullback would keep this reversal structurally intact rather than turning it into a failed bounce. My honest read: reclaiming the prior resistance zone this fast after such a sharp drop is a constructive sign, it suggests real buying showed up at the $10.60 low rather than just a dead cat bounce that fades immediately. That said, LINK is still well below the September 7 spike high near $13.8, and this whole move has happened over a matter of days, which means it hasn't been tested by much time or a genuine pullback yet. What I'm watching: whether $11.40 to $11.46 holds as support if price pulls back from here, and whether LINK can actually push toward and through that $13.4 to $13.8 zone rather than stalling below it again. #BTC Price Analysis# #Macro Insights# $LINK
·
--
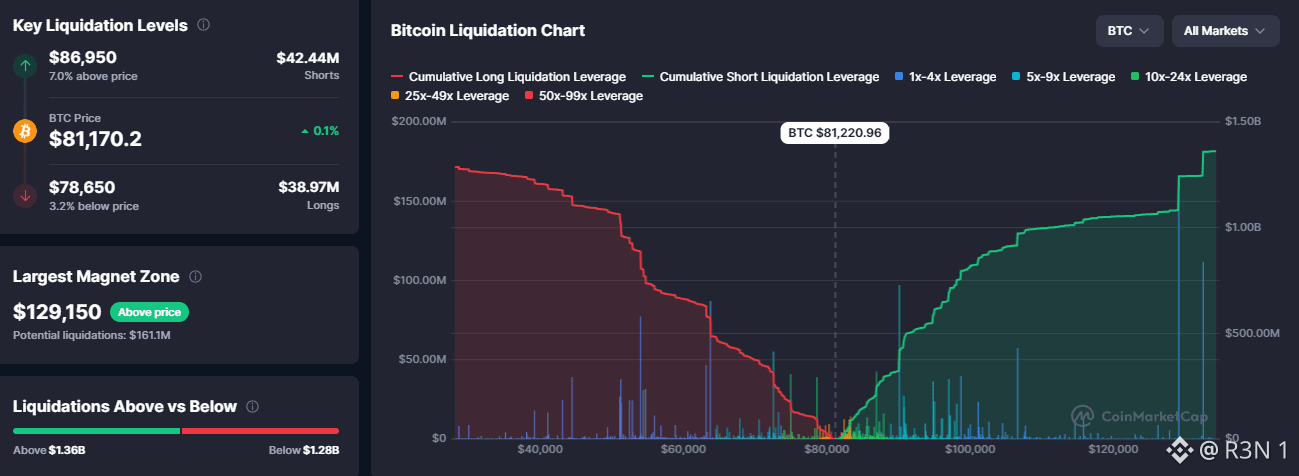
Hozirgi narx ustida $1.36 milliard potentsial likvidatsiya, pastida esa $1.28 milliard. Bu haqiqatan ham muvozanatli likvidatsiya xaritasi: odatda bir tomonga og‘ishgan setup yaqqol siqib chiqarishni (squeeze) anglatadigan tur emas. $BTC $81,170.20 atrofida, deyarli harakat qilmayapti, kun bo‘yi atigi 0.1% ga oshgan. Ikkala tomondagi eng yaqin real darajalar foiz bo‘yicha yaqin, hajmi ham o‘xshash: $86,950 narxdan 7% yuqori bo‘lib, u yerda $42.44M miqdorida short likvidatsiyalar to‘plangan; $78,650 esa 3.2% pastda, u yerda esa $38.97M miqdorida longs ochiq (exposed). Masofa nosimmetrik bo‘lishiga qaramay, bu ikki raqamning yaqinligi e’tiborga loyiq: hozirgi narx atrofida leverage ikkala tomonda ham deyarli bir xil taqsimlanganga o‘xshaydi, bir tomonda haddan tashqari to‘planib, “ishlatilib ketish”ni kutayotgani yo‘q. Bu chartdagi eng qiziqarli daraja esa ancha uzoqroqda. $129,150 eng katta “magnit zona” sifatida belgilangan: u yerda $161.1M potentsial likvidatsiya to‘plangan—bu hozirgi narxdan ham yuqori va yaqinroq darajalarning ikkisidan ham ancha ortiq. Bu juda balandda, overhead bo‘lib turgan leveraged longsning haqiqiy konsentratsiyasi: kuchli trend harakatlarida magnitdek tortadigan zona. Biroq $81,000 dan u yerga yetib borish sezilarli qadam, yaqin muddatli nishon emas. Menimcha, haqqoniy xulosam: hozirgi narxda likvidatsiyalar yuqorida ham, pastda ham taxminan muvozanatli bo‘lsa, bu xarita hozirning o‘zida qaysidir yo‘nalishda keskin squeeze uchun kuchli dalil bermaydi. Tasvir faqat narx shunchalik qat’iy trendga kirib, $86,950 yoki $78,650 klasterlaridan biriga real yaqinlashsagina chinakam qiziqarli bo‘la boshlaydi yoki oxir-oqibat uzoqdagi o‘sha ancha katta $129,150 zonaga yetadi. Kuzatayotganim: narx $86,950 tomon itarilib, o‘sha short klasterni sinaydimi, yoki aksincha $78,650 tomon tushib, longs klasterini buzadimi—chunki har ikkala harakat ham, aynan shu muvozanatli xaritaning qaysi tomoni birinchi bo‘lib “ishlatilishini” oydinlashtira boshlaydi. #BTC Price Analysis# #Macro Insights# #Meme Alpha#
Hozirgi narx ustida $1.36 milliard potentsial likvidatsiya, pastida esa $1.28 milliard. Bu haqiqatan ham muvozanatli likvidatsiya xaritasi: odatda bir tomonga og‘ishgan setup yaqqol siqib chiqarishni (squeeze) anglatadigan tur emas. $BTC $81,170.20 atrofida, deyarli harakat qilmayapti, kun bo‘yi atigi 0.1% ga oshgan. Ikkala tomondagi eng yaqin real darajalar foiz bo‘yicha yaqin, hajmi ham o‘xshash: $86,950 narxdan 7% yuqori bo‘lib, u yerda $42.44M miqdorida short likvidatsiyalar to‘plangan; $78,650 esa 3.2% pastda, u yerda esa $38.97M miqdorida longs ochiq (exposed). Masofa nosimmetrik bo‘lishiga qaramay, bu ikki raqamning yaqinligi e’tiborga loyiq: hozirgi narx atrofida leverage ikkala tomonda ham deyarli bir xil taqsimlanganga o‘xshaydi, bir tomonda haddan tashqari to‘planib, “ishlatilib ketish”ni kutayotgani yo‘q. Bu chartdagi eng qiziqarli daraja esa ancha uzoqroqda. $129,150 eng katta “magnit zona” sifatida belgilangan: u yerda $161.1M potentsial likvidatsiya to‘plangan—bu hozirgi narxdan ham yuqori va yaqinroq darajalarning ikkisidan ham ancha ortiq. Bu juda balandda, overhead bo‘lib turgan leveraged longsning haqiqiy konsentratsiyasi: kuchli trend harakatlarida magnitdek tortadigan zona. Biroq $81,000 dan u yerga yetib borish sezilarli qadam, yaqin muddatli nishon emas. Menimcha, haqqoniy xulosam: hozirgi narxda likvidatsiyalar yuqorida ham, pastda ham taxminan muvozanatli bo‘lsa, bu xarita hozirning o‘zida qaysidir yo‘nalishda keskin squeeze uchun kuchli dalil bermaydi. Tasvir faqat narx shunchalik qat’iy trendga kirib, $86,950 yoki $78,650 klasterlaridan biriga real yaqinlashsagina chinakam qiziqarli bo‘la boshlaydi yoki oxir-oqibat uzoqdagi o‘sha ancha katta $129,150 zonaga yetadi. Kuzatayotganim: narx $86,950 tomon itarilib, o‘sha short klasterni sinaydimi, yoki aksincha $78,650 tomon tushib, longs klasterini buzadimi—chunki har ikkala harakat ham, aynan shu muvozanatli xaritaning qaysi tomoni birinchi bo‘lib “ishlatilishini” oydinlashtira boshlaydi. #BTC Price Analysis# #Macro Insights# #Meme Alpha#
·
--
XRP ning to‘lov hajmi 30 kunlik o‘rtacha ko‘rsatkichdan ikki martadan ko‘proqqa oshdi va shu ko‘tarilish ichida yashiringan tafsilot sarlavhadagi raqamdan ham qiziqroq.
XRPL 24 soatda 2,34 milliondan ortiq tranzaksiyani qayta ishladi — o‘rtachadan 8,9% yuqori. Kunlik to‘lov hajmi taxminan 1,16 milliard XRP ga sakradi, o‘rtacha 494,6 million XRP ga nisbatan — ikki martadan ham ko‘p.
Lekin faol foydalanuvchilar esa aynan shu davrda qariyb 17% ga kamaydi.
Bu kombinatsiya muhim. Hajm oshib, faol foydalanuvchilar kamaygan bo‘lsa, bu yangi ishtirokchilar kirib kelgani emas, balki mavjud yirik egalarning kattaroq miqdorlarni ko‘proq harakatga keltirayotgani degani. Bu yerda aniqlik kiritish kerak: “qabul/adopatsiya” deb aytilayotgan sarlavhalar ma’lumotlar ko‘rsatganidan ko‘ra ortiqroq da’vo qilmoqda.
Binance likvidligi ham institutsional talqinni tasdiqlaydi. O‘ttiz kunlik aylanma taxminan 4,6 milliard dollarga qaytgan, likvidlik indeksi olti oylik eng yuqori darajaga chiqqan, chuqurroq order book’lar va faolroq savdo kuzatilmoqda. Kitlar faolligi ham mos keladi: bitta ma’lumotlar to‘plamida taxminan 96 soat ichida 1,54 milliard XRP to‘plangani ko‘rsatilgan, yana boshqasida esa 30 kun davomida Binance’ga taxminan 1,6 milliard XRP oqib kirgani qayd etilgan — ikkalasi ham $1,27 atrofidan 1,40–1,4-larning o‘rtalariga qaytish bilan bir vaqtda bo‘lgan.
Menga bu yerda eng foydali tomoni — ETF oqimlari konteksti: bu hafta 18,98 million dollar sof oqim kirimi, ya’ni zanjirdagi faollik bilan birga real institutsional talab ishlayotganini ko‘rsatadi.
Shunga qaramay, qarshi argumentni ham ochiq aytish kerak. Bu hajmli sakrashning bir qismi stress-testlar va yuqori chastotali mikrotölovlar bo‘lishi ehtimol; organik chakana foydalanish bo‘lmasligi mumkin. Narx $1,43 da, qo‘llab-quvvatlash $1,28–1,30 atrofida, qarshilik esa $1,34–1,36 va yana $1,40–1,45 oralig‘ida to‘planib turibdi.
Asosiy savol shuki, bu qayta yuksalish real faollik bilan qo‘llab-quvvatlanadimi — u aniq shunday. Savol faollik o‘sha qarshilik zonalaridagi ta’minotni (supply) yutib yuboradigan darajada barqarormi yoki bu haqiqiy yangi talab emas, balki mavjud egalarning pozitsiyalarini qayta taqsimlayotgani emasmi.
$XRP #BTC Price Analysis# #BTC Price Analysis#
XRP ning to‘lov hajmi 30 kunlik o‘rtacha ko‘rsatkichdan ikki martadan ko‘proqqa oshdi va shu ko‘tarilish ichida yashiringan tafsilot sarlavhadagi raqamdan ham qiziqroq.
XRPL 24 soatda 2,34 milliondan ortiq tranzaksiyani qayta ishladi — o‘rtachadan 8,9% yuqori. Kunlik to‘lov hajmi taxminan 1,16 milliard XRP ga sakradi, o‘rtacha 494,6 million XRP ga nisbatan — ikki martadan ham ko‘p.
Lekin faol foydalanuvchilar esa aynan shu davrda qariyb 17% ga kamaydi.
Bu kombinatsiya muhim. Hajm oshib, faol foydalanuvchilar kamaygan bo‘lsa, bu yangi ishtirokchilar kirib kelgani emas, balki mavjud yirik egalarning kattaroq miqdorlarni ko‘proq harakatga keltirayotgani degani. Bu yerda aniqlik kiritish kerak: “qabul/adopatsiya” deb aytilayotgan sarlavhalar ma’lumotlar ko‘rsatganidan ko‘ra ortiqroq da’vo qilmoqda.
Binance likvidligi ham institutsional talqinni tasdiqlaydi. O‘ttiz kunlik aylanma taxminan 4,6 milliard dollarga qaytgan, likvidlik indeksi olti oylik eng yuqori darajaga chiqqan, chuqurroq order book’lar va faolroq savdo kuzatilmoqda. Kitlar faolligi ham mos keladi: bitta ma’lumotlar to‘plamida taxminan 96 soat ichida 1,54 milliard XRP to‘plangani ko‘rsatilgan, yana boshqasida esa 30 kun davomida Binance’ga taxminan 1,6 milliard XRP oqib kirgani qayd etilgan — ikkalasi ham $1,27 atrofidan 1,40–1,4-larning o‘rtalariga qaytish bilan bir vaqtda bo‘lgan.
Menga bu yerda eng foydali tomoni — ETF oqimlari konteksti: bu hafta 18,98 million dollar sof oqim kirimi, ya’ni zanjirdagi faollik bilan birga real institutsional talab ishlayotganini ko‘rsatadi.
Shunga qaramay, qarshi argumentni ham ochiq aytish kerak. Bu hajmli sakrashning bir qismi stress-testlar va yuqori chastotali mikrotölovlar bo‘lishi ehtimol; organik chakana foydalanish bo‘lmasligi mumkin. Narx $1,43 da, qo‘llab-quvvatlash $1,28–1,30 atrofida, qarshilik esa $1,34–1,36 va yana $1,40–1,45 oralig‘ida to‘planib turibdi.
Asosiy savol shuki, bu qayta yuksalish real faollik bilan qo‘llab-quvvatlanadimi — u aniq shunday. Savol faollik o‘sha qarshilik zonalaridagi ta’minotni (supply) yutib yuboradigan darajada barqarormi yoki bu haqiqiy yangi talab emas, balki mavjud egalarning pozitsiyalarini qayta taqsimlayotgani emasmi.
$XRP #BTC Price Analysis# #BTC Price Analysis#
XRPL 24 soatda 2,34 milliondan ortiq tranzaksiyani qayta ishladi — o‘rtachadan 8,9% yuqori. Kunlik to‘lov hajmi taxminan 1,16 milliard XRP ga sakradi, o‘rtacha 494,6 million XRP ga nisbatan — ikki martadan ham ko‘p.
Lekin faol foydalanuvchilar esa aynan shu davrda qariyb 17% ga kamaydi.
Bu kombinatsiya muhim. Hajm oshib, faol foydalanuvchilar kamaygan bo‘lsa, bu yangi ishtirokchilar kirib kelgani emas, balki mavjud yirik egalarning kattaroq miqdorlarni ko‘proq harakatga keltirayotgani degani. Bu yerda aniqlik kiritish kerak: “qabul/adopatsiya” deb aytilayotgan sarlavhalar ma’lumotlar ko‘rsatganidan ko‘ra ortiqroq da’vo qilmoqda.
Binance likvidligi ham institutsional talqinni tasdiqlaydi. O‘ttiz kunlik aylanma taxminan 4,6 milliard dollarga qaytgan, likvidlik indeksi olti oylik eng yuqori darajaga chiqqan, chuqurroq order book’lar va faolroq savdo kuzatilmoqda. Kitlar faolligi ham mos keladi: bitta ma’lumotlar to‘plamida taxminan 96 soat ichida 1,54 milliard XRP to‘plangani ko‘rsatilgan, yana boshqasida esa 30 kun davomida Binance’ga taxminan 1,6 milliard XRP oqib kirgani qayd etilgan — ikkalasi ham $1,27 atrofidan 1,40–1,4-larning o‘rtalariga qaytish bilan bir vaqtda bo‘lgan.
Menga bu yerda eng foydali tomoni — ETF oqimlari konteksti: bu hafta 18,98 million dollar sof oqim kirimi, ya’ni zanjirdagi faollik bilan birga real institutsional talab ishlayotganini ko‘rsatadi.
Shunga qaramay, qarshi argumentni ham ochiq aytish kerak. Bu hajmli sakrashning bir qismi stress-testlar va yuqori chastotali mikrotölovlar bo‘lishi ehtimol; organik chakana foydalanish bo‘lmasligi mumkin. Narx $1,43 da, qo‘llab-quvvatlash $1,28–1,30 atrofida, qarshilik esa $1,34–1,36 va yana $1,40–1,45 oralig‘ida to‘planib turibdi.
Asosiy savol shuki, bu qayta yuksalish real faollik bilan qo‘llab-quvvatlanadimi — u aniq shunday. Savol faollik o‘sha qarshilik zonalaridagi ta’minotni (supply) yutib yuboradigan darajada barqarormi yoki bu haqiqiy yangi talab emas, balki mavjud egalarning pozitsiyalarini qayta taqsimlayotgani emasmi.
$XRP #BTC Price Analysis# #BTC Price Analysis#
2
·
--
Savdo kredit liniyalari ustidan vakolatga ega bo‘lmagan chakana bank xodimi soxta akkreditivlar bo‘yicha 1,6 milliard dollarga ruxsat olgani (ya’ni autentifikatsiya qilgani) bilan ajralib turdi. Uning haqiqiy vazifasi bilan uddalagan ishining orasidagi masofa aynan o‘ylab ko‘riladigan nuqtadir.
Lam Chun-yin, 32 yosh, China Construction Bank (Asia)da mijozlar bilan ishlash bo‘yicha menejer bo‘lgan; u individual mijozlar uchun chakana bank xizmatlarida ishlagan, tijorat kreditiga aloqador emas. 2022-yil aprelidan iyunigacha u bir necha standby (zaxira) akkreditivlarni soxta tarzda autentifikatsiya qilish uchun AQShdagi 470 000 AQSh dollariga teng USDTni olib kirgan. Bunga 1,6 milliard dollardan oshiq qiymatga bog‘langan, o‘lik insurtech Vesttoo bilan bog‘liq tranzaksiyalar bo‘yicha soxtalashtirilgan garov xatlari ham kirgan. U Gonkongning District Court sudida aybini tan oldi va to‘rt yilga hukm qilindi, shuningdek, qilgan ishining to‘liq qiymati bo‘lgan taxminan 3,7 million HK$ miqdorida tovon (restitutsiya) belgilandi.
Menga eng ko‘zni tortadigani — bu yerda leverage (ta’sirchanlik) nisbati. 500 000 dollardan kam bo‘lgan kripto poralar yirik bankning ishonchliligiga kirish imkonini ochib berdi va undan foydalanib, o‘sha bankning o‘lchamidan uch ming martadan ham ko‘proq bo‘lgan miqyosda firibgarlikni qo‘llab-quvvatladi. Pul uchun “rogue” (qoidaga bo‘ysunmaydigan) bankir haqidagi hikoyadan ko‘ra ko‘proq, shuncha katta hujjatlar ortida tekshiruv qatlamining qanchalik yupqa bo‘lgani haqida.
Kripto tomoni bo‘yicha bevosita aytib o‘tishga arziydi, chunki u sarlavhani boshqarayotgani. USDT tasodifiy emas edi — bu to‘lov usuli bo‘lib, ICAC korruptsiyalashgan tarmoqlar bunday operatsiyalar uchun stablecoin’lardan tobora ko‘proq foydalanayotganini qayd etgan. Ular bank o‘tkazmasiga qaraganda tezroq va ko‘proq ko‘zdan yashirin, hamkor bank (correspondent bank) so‘roq bermaydi.
Ish yopilgan emas. ICAC hali ham boshqalar bo‘yicha ochiq orderlar (qidiruv varaqalari) borligini aytgan, Lam esa sud faylda qoldirilgan, prokuratura tomonidan qo‘zg‘atilmagan soxta instrumentlardan foydalanish bilan bog‘liq alohida ayblovga duch kelgan.
Ochiq savol — qolgan orderlar nimani ochib beradi: bu faqat bitta bankir bo‘shliqdan foydalanganmidi, yoki an’anaviy savdo moliyalashtiruvi uchun qurilgan compliance tekshiruvlaridan tezroq harakat qilgani uchun kriptoni aynan ishlatgan, kengroq tarmoqmi?
$BTC #BTC Price Analysis# $ETH #Meme Alpha#
Savdo kredit liniyalari ustidan vakolatga ega bo‘lmagan chakana bank xodimi soxta akkreditivlar bo‘yicha 1,6 milliard dollarga ruxsat olgani (ya’ni autentifikatsiya qilgani) bilan ajralib turdi. Uning haqiqiy vazifasi bilan uddalagan ishining orasidagi masofa aynan o‘ylab ko‘riladigan nuqtadir.
Lam Chun-yin, 32 yosh, China Construction Bank (Asia)da mijozlar bilan ishlash bo‘yicha menejer bo‘lgan; u individual mijozlar uchun chakana bank xizmatlarida ishlagan, tijorat kreditiga aloqador emas. 2022-yil aprelidan iyunigacha u bir necha standby (zaxira) akkreditivlarni soxta tarzda autentifikatsiya qilish uchun AQShdagi 470 000 AQSh dollariga teng USDTni olib kirgan. Bunga 1,6 milliard dollardan oshiq qiymatga bog‘langan, o‘lik insurtech Vesttoo bilan bog‘liq tranzaksiyalar bo‘yicha soxtalashtirilgan garov xatlari ham kirgan. U Gonkongning District Court sudida aybini tan oldi va to‘rt yilga hukm qilindi, shuningdek, qilgan ishining to‘liq qiymati bo‘lgan taxminan 3,7 million HK$ miqdorida tovon (restitutsiya) belgilandi.
Menga eng ko‘zni tortadigani — bu yerda leverage (ta’sirchanlik) nisbati. 500 000 dollardan kam bo‘lgan kripto poralar yirik bankning ishonchliligiga kirish imkonini ochib berdi va undan foydalanib, o‘sha bankning o‘lchamidan uch ming martadan ham ko‘proq bo‘lgan miqyosda firibgarlikni qo‘llab-quvvatladi. Pul uchun “rogue” (qoidaga bo‘ysunmaydigan) bankir haqidagi hikoyadan ko‘ra ko‘proq, shuncha katta hujjatlar ortida tekshiruv qatlamining qanchalik yupqa bo‘lgani haqida.
Kripto tomoni bo‘yicha bevosita aytib o‘tishga arziydi, chunki u sarlavhani boshqarayotgani. USDT tasodifiy emas edi — bu to‘lov usuli bo‘lib, ICAC korruptsiyalashgan tarmoqlar bunday operatsiyalar uchun stablecoin’lardan tobora ko‘proq foydalanayotganini qayd etgan. Ular bank o‘tkazmasiga qaraganda tezroq va ko‘proq ko‘zdan yashirin, hamkor bank (correspondent bank) so‘roq bermaydi.
Ish yopilgan emas. ICAC hali ham boshqalar bo‘yicha ochiq orderlar (qidiruv varaqalari) borligini aytgan, Lam esa sud faylda qoldirilgan, prokuratura tomonidan qo‘zg‘atilmagan soxta instrumentlardan foydalanish bilan bog‘liq alohida ayblovga duch kelgan.
Ochiq savol — qolgan orderlar nimani ochib beradi: bu faqat bitta bankir bo‘shliqdan foydalanganmidi, yoki an’anaviy savdo moliyalashtiruvi uchun qurilgan compliance tekshiruvlaridan tezroq harakat qilgani uchun kriptoni aynan ishlatgan, kengroq tarmoqmi?
$BTC #BTC Price Analysis# $ETH #Meme Alpha#
Lam Chun-yin, 32 yosh, China Construction Bank (Asia)da mijozlar bilan ishlash bo‘yicha menejer bo‘lgan; u individual mijozlar uchun chakana bank xizmatlarida ishlagan, tijorat kreditiga aloqador emas. 2022-yil aprelidan iyunigacha u bir necha standby (zaxira) akkreditivlarni soxta tarzda autentifikatsiya qilish uchun AQShdagi 470 000 AQSh dollariga teng USDTni olib kirgan. Bunga 1,6 milliard dollardan oshiq qiymatga bog‘langan, o‘lik insurtech Vesttoo bilan bog‘liq tranzaksiyalar bo‘yicha soxtalashtirilgan garov xatlari ham kirgan. U Gonkongning District Court sudida aybini tan oldi va to‘rt yilga hukm qilindi, shuningdek, qilgan ishining to‘liq qiymati bo‘lgan taxminan 3,7 million HK$ miqdorida tovon (restitutsiya) belgilandi.
Menga eng ko‘zni tortadigani — bu yerda leverage (ta’sirchanlik) nisbati. 500 000 dollardan kam bo‘lgan kripto poralar yirik bankning ishonchliligiga kirish imkonini ochib berdi va undan foydalanib, o‘sha bankning o‘lchamidan uch ming martadan ham ko‘proq bo‘lgan miqyosda firibgarlikni qo‘llab-quvvatladi. Pul uchun “rogue” (qoidaga bo‘ysunmaydigan) bankir haqidagi hikoyadan ko‘ra ko‘proq, shuncha katta hujjatlar ortida tekshiruv qatlamining qanchalik yupqa bo‘lgani haqida.
Kripto tomoni bo‘yicha bevosita aytib o‘tishga arziydi, chunki u sarlavhani boshqarayotgani. USDT tasodifiy emas edi — bu to‘lov usuli bo‘lib, ICAC korruptsiyalashgan tarmoqlar bunday operatsiyalar uchun stablecoin’lardan tobora ko‘proq foydalanayotganini qayd etgan. Ular bank o‘tkazmasiga qaraganda tezroq va ko‘proq ko‘zdan yashirin, hamkor bank (correspondent bank) so‘roq bermaydi.
Ish yopilgan emas. ICAC hali ham boshqalar bo‘yicha ochiq orderlar (qidiruv varaqalari) borligini aytgan, Lam esa sud faylda qoldirilgan, prokuratura tomonidan qo‘zg‘atilmagan soxta instrumentlardan foydalanish bilan bog‘liq alohida ayblovga duch kelgan.
Ochiq savol — qolgan orderlar nimani ochib beradi: bu faqat bitta bankir bo‘shliqdan foydalanganmidi, yoki an’anaviy savdo moliyalashtiruvi uchun qurilgan compliance tekshiruvlaridan tezroq harakat qilgani uchun kriptoni aynan ishlatgan, kengroq tarmoqmi?
$BTC #BTC Price Analysis# $ETH #Meme Alpha#

24
·
--
Ushbu yopilishga borish yo‘lida ETH bo‘yicha $85 millionlik shortlar majburan yopildi. Qo‘ng‘iroq qilishdan oldin buni bilish kerak — bu sof organik talab degan fikr bilan.
ETH 18-sentabr kuni $2,611.34 da yopildi, 24 soatda 6.4 dan 6.8% gacha ko‘tarildi va yanvardan beri (aniq taqqoslash nuqtasiga qarab) taxminan yetti-sakkiz oy davomida ushlab turilmagan darajani tozaladi. “33 kunda 40%” degan iboraga ham aniqroq qarash muhim: men topgan eng yaqin raqamlar ETH’ning so‘nggi yurishi shunga o‘xshash oynada taxminan 25–33% atrofida bo‘lganini ko‘rsatdi — bu baribir katta ralli, shunchaki aynan o‘sha aniq raqamga to‘g‘ri kelmaydi. Bu ETH’ning $2,600 ga birinchi urinish emas: oldingi ikki haftada u ikki marta rad etilgan, ya’ni bu breakout oddiy toza o‘sish emas, balki haqiqiy qarshilik ortidan chiqqan.
Harakat mexanikasi muhim. Bu aynan ushbu surilishning sezilarli qismi short-siqilish (short squeeze) hisobiga bo‘ldi: yangi organik talab kirishidan ko‘ra, tugatilgan shortlar majburan xaridga undadi. Bu harakatni “soxta” demaydi, ammo barqarorlik surilish boshida bo‘lgan majburiy xarid tugaganidan keyin haqiqiy xarid paydo bo‘lishiga bog‘liqligini anglatadi; squeeze takrorlanishiga emas.
On-chain fon faqat narx harakatidan ham ko‘proq konstruktiv. Birja rezervlari taxminan 14.92 million ETH ga tushib, 2026-yilning eng past darajasiga yetdi; 42 milliondan ortiq ETH esa staked, ya’ni muomaladagi ta’minotning taxminan 35% likvid emas, bloklangan. ETH’ning o‘z ETF oqimlari ham yil davomida net-musbat, BTC’niki esa net-manfiy: institutsional joylashuvda real farq.
Mening halol bahom: tarkibiy sharoit (reserverlarning tushishi), staking ishtirokinig yuqoriligi, ETF oqimlarining musbatligi — breakout shamining o‘zidan ko‘ra ishonchliroq ko‘rinadi, chunki yurishning katta qismi majburiy short’larni yopishga tayangan.
Nimalarni kuzatyapman: $2,600 har qanday pullbackda support bo‘lib qoladimi-yo‘qmi, chunki bu bu haqiqiy daraja almashinuvi ekanini yoki asta-sekin so‘nadigan squeeze ekanini tekshiradigan asosiy sinov.
$ETH #ETH #Altcoin Season#
Ushbu yopilishga borish yo‘lida ETH bo‘yicha $85 millionlik shortlar majburan yopildi. Qo‘ng‘iroq qilishdan oldin buni bilish kerak — bu sof organik talab degan fikr bilan.
ETH 18-sentabr kuni $2,611.34 da yopildi, 24 soatda 6.4 dan 6.8% gacha ko‘tarildi va yanvardan beri (aniq taqqoslash nuqtasiga qarab) taxminan yetti-sakkiz oy davomida ushlab turilmagan darajani tozaladi. “33 kunda 40%” degan iboraga ham aniqroq qarash muhim: men topgan eng yaqin raqamlar ETH’ning so‘nggi yurishi shunga o‘xshash oynada taxminan 25–33% atrofida bo‘lganini ko‘rsatdi — bu baribir katta ralli, shunchaki aynan o‘sha aniq raqamga to‘g‘ri kelmaydi. Bu ETH’ning $2,600 ga birinchi urinish emas: oldingi ikki haftada u ikki marta rad etilgan, ya’ni bu breakout oddiy toza o‘sish emas, balki haqiqiy qarshilik ortidan chiqqan.
Harakat mexanikasi muhim. Bu aynan ushbu surilishning sezilarli qismi short-siqilish (short squeeze) hisobiga bo‘ldi: yangi organik talab kirishidan ko‘ra, tugatilgan shortlar majburan xaridga undadi. Bu harakatni “soxta” demaydi, ammo barqarorlik surilish boshida bo‘lgan majburiy xarid tugaganidan keyin haqiqiy xarid paydo bo‘lishiga bog‘liqligini anglatadi; squeeze takrorlanishiga emas.
On-chain fon faqat narx harakatidan ham ko‘proq konstruktiv. Birja rezervlari taxminan 14.92 million ETH ga tushib, 2026-yilning eng past darajasiga yetdi; 42 milliondan ortiq ETH esa staked, ya’ni muomaladagi ta’minotning taxminan 35% likvid emas, bloklangan. ETH’ning o‘z ETF oqimlari ham yil davomida net-musbat, BTC’niki esa net-manfiy: institutsional joylashuvda real farq.
Mening halol bahom: tarkibiy sharoit (reserverlarning tushishi), staking ishtirokinig yuqoriligi, ETF oqimlarining musbatligi — breakout shamining o‘zidan ko‘ra ishonchliroq ko‘rinadi, chunki yurishning katta qismi majburiy short’larni yopishga tayangan.
Nimalarni kuzatyapman: $2,600 har qanday pullbackda support bo‘lib qoladimi-yo‘qmi, chunki bu bu haqiqiy daraja almashinuvi ekanini yoki asta-sekin so‘nadigan squeeze ekanini tekshiradigan asosiy sinov.
$ETH #ETH #Altcoin Season#
ETH 18-sentabr kuni $2,611.34 da yopildi, 24 soatda 6.4 dan 6.8% gacha ko‘tarildi va yanvardan beri (aniq taqqoslash nuqtasiga qarab) taxminan yetti-sakkiz oy davomida ushlab turilmagan darajani tozaladi. “33 kunda 40%” degan iboraga ham aniqroq qarash muhim: men topgan eng yaqin raqamlar ETH’ning so‘nggi yurishi shunga o‘xshash oynada taxminan 25–33% atrofida bo‘lganini ko‘rsatdi — bu baribir katta ralli, shunchaki aynan o‘sha aniq raqamga to‘g‘ri kelmaydi. Bu ETH’ning $2,600 ga birinchi urinish emas: oldingi ikki haftada u ikki marta rad etilgan, ya’ni bu breakout oddiy toza o‘sish emas, balki haqiqiy qarshilik ortidan chiqqan.
Harakat mexanikasi muhim. Bu aynan ushbu surilishning sezilarli qismi short-siqilish (short squeeze) hisobiga bo‘ldi: yangi organik talab kirishidan ko‘ra, tugatilgan shortlar majburan xaridga undadi. Bu harakatni “soxta” demaydi, ammo barqarorlik surilish boshida bo‘lgan majburiy xarid tugaganidan keyin haqiqiy xarid paydo bo‘lishiga bog‘liqligini anglatadi; squeeze takrorlanishiga emas.
On-chain fon faqat narx harakatidan ham ko‘proq konstruktiv. Birja rezervlari taxminan 14.92 million ETH ga tushib, 2026-yilning eng past darajasiga yetdi; 42 milliondan ortiq ETH esa staked, ya’ni muomaladagi ta’minotning taxminan 35% likvid emas, bloklangan. ETH’ning o‘z ETF oqimlari ham yil davomida net-musbat, BTC’niki esa net-manfiy: institutsional joylashuvda real farq.
Mening halol bahom: tarkibiy sharoit (reserverlarning tushishi), staking ishtirokinig yuqoriligi, ETF oqimlarining musbatligi — breakout shamining o‘zidan ko‘ra ishonchliroq ko‘rinadi, chunki yurishning katta qismi majburiy short’larni yopishga tayangan.
Nimalarni kuzatyapman: $2,600 har qanday pullbackda support bo‘lib qoladimi-yo‘qmi, chunki bu bu haqiqiy daraja almashinuvi ekanini yoki asta-sekin so‘nadigan squeeze ekanini tekshiradigan asosiy sinov.
$ETH #ETH #Altcoin Season#
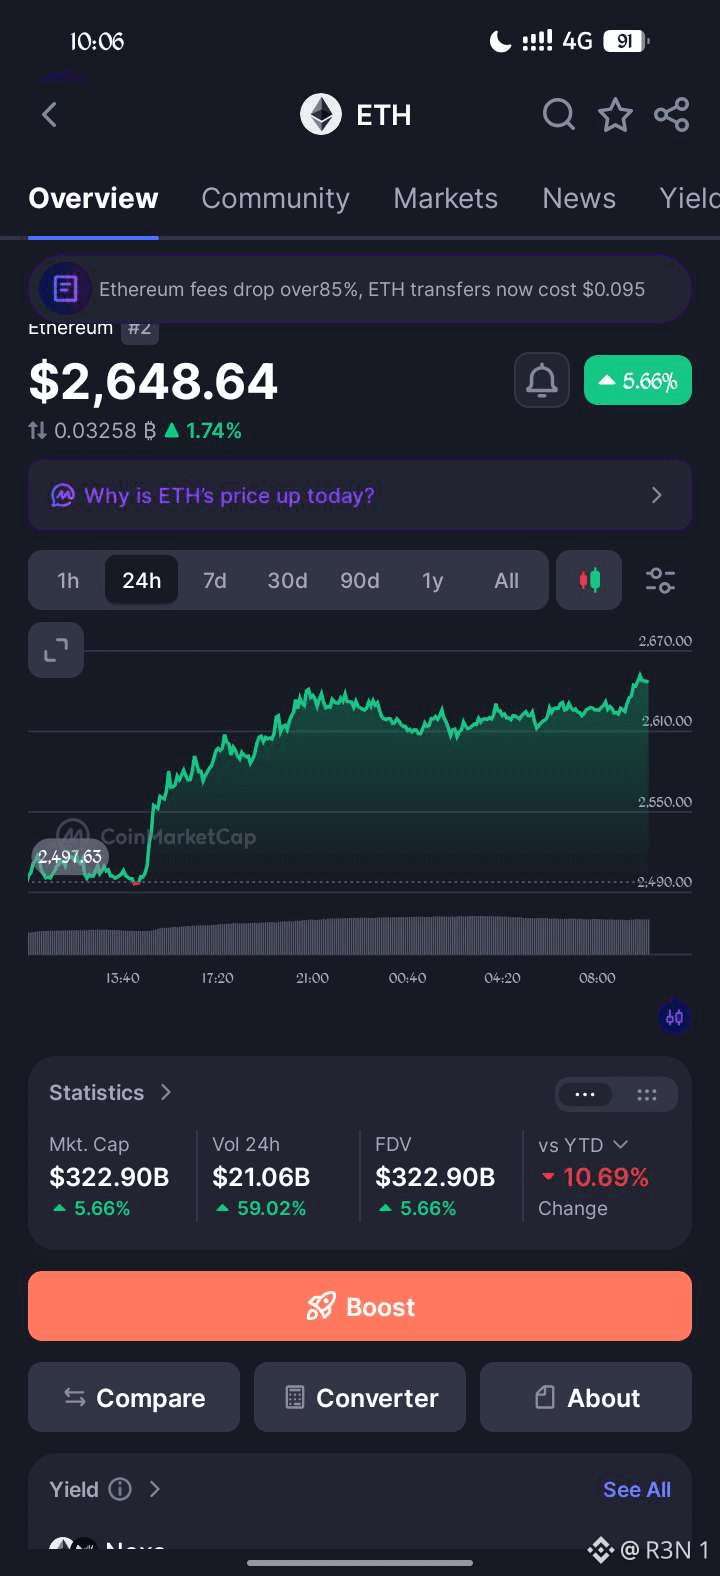
25
·
--
BTC $81,000 dan yana yuqoriga qaytdi va Binance zaxiralari 2026-yil bo‘yicha ko‘rsatilgan eng yuqori darajaga — taxminan 702,900 BTC ga yetdi. Bu ikki omil aynan relift (sakrash) paytida ko‘pincha e’tibordan chetda qoladigan narsalarning kombinatsiyasi.
Binance ayniqsa shu yerda kuzatishga arziydi, chunki uning ko‘lami katta: CoinGecko ma’lumotlariga ko‘ra, u 2025-yil dekabr oyida eng yirik 10 ta markazlashtirilgan birja orasida spot hajmining 38.3% ini egallagan, ya’ni har qanday alohida raqobatchidan sezilarli darajada kattaroq. 2026-yil avgust oyining oxiridan beri bir necha ming BTC sof kirimi yig‘ilib borgan: eng so‘nggi ko‘rsatkich esa sof asosda taxminan 439 BTC kirib kelayotganini ko‘rsatadi. Buni aniqroq aytishga arziydi: bu aslida nimani isbotlaydi? Depozitlar sotuv tomoni bo‘yicha potensial ta’minotni oshiradi, lekin u hech kim haqiqatan ham sotayotganini tasdiqlamaydi. Ko‘pincha tangalar birjada custody (saqlash), garov (collateral) yoki boshqa ko‘plab sabablar uchun “turib qolishi” mumkin — buyurtmalar kitobiga (order book) umuman chiqmasligi ham mumkin.
Kit (whale) ma’lumotlari esa aniq bearish (ayiqona) talqinni darhol tasdiqlamaydi, balki foydali kontekst beradi. Birja Whale Ratio ko‘rsatkich 0.43 atrofida bo‘lib, avvalgi cho‘qqilardan past — bu hozir davom etayotgan “istisno darajadagi, kit boshchiligida bo‘layotgan sotuv” g‘oyasini qo‘llab-quvvatlamaydi. Agar yirik egalari ushbu qaytish (rebound) paytida agressiv tarzda sotayotgan bo‘lsa, u holda bu nisbat oldingi eng yuqori darajalariga yaqinlashishini kutardingiz, lekin u ulardan pastda turibdi.
Mening halol bahom: narx tiklanishi davrida zaxiralarning o‘sishi — kuzatishga arziydigan haqiqiy “sariq” ogohlantiruvchi belgi; bu hali tasdiqlangan ayiqona signal emas. Kit nisbatining past darajada qolishi jamlangan dump (keskin sotuv)ga zid. Biroq, to‘planayotgan ta’minotning bu qaytish barqaror turishi uchun real talab tomonidan yutilishi kerak va hozircha, qaysi tomondan bo‘lishidan qat’i nazar, bu yutilish hali tasdiqlanmagan.
Nimani kuzatyapman: Binance zaxiralari narx $81,000 atrofida ushlanib turgan paytda ham ko‘tarilishini davom ettiradimi-yo‘qmi, va shu bilan birga whale ratio yuqoriga chiqa boshlaydimi-yo‘qmi. Chunki bu kombinatsiya — taqsimlanish (distribution) bo‘yicha haqiqiy tasdiq bo‘ladigan omil — faqat bittagina signalning o‘zi emas.
$BTC #BTC Price Analysis# #Altcoin Season#
BTC $81,000 dan yana yuqoriga qaytdi va Binance zaxiralari 2026-yil bo‘yicha ko‘rsatilgan eng yuqori darajaga — taxminan 702,900 BTC ga yetdi. Bu ikki omil aynan relift (sakrash) paytida ko‘pincha e’tibordan chetda qoladigan narsalarning kombinatsiyasi.
Binance ayniqsa shu yerda kuzatishga arziydi, chunki uning ko‘lami katta: CoinGecko ma’lumotlariga ko‘ra, u 2025-yil dekabr oyida eng yirik 10 ta markazlashtirilgan birja orasida spot hajmining 38.3% ini egallagan, ya’ni har qanday alohida raqobatchidan sezilarli darajada kattaroq. 2026-yil avgust oyining oxiridan beri bir necha ming BTC sof kirimi yig‘ilib borgan: eng so‘nggi ko‘rsatkich esa sof asosda taxminan 439 BTC kirib kelayotganini ko‘rsatadi. Buni aniqroq aytishga arziydi: bu aslida nimani isbotlaydi? Depozitlar sotuv tomoni bo‘yicha potensial ta’minotni oshiradi, lekin u hech kim haqiqatan ham sotayotganini tasdiqlamaydi. Ko‘pincha tangalar birjada custody (saqlash), garov (collateral) yoki boshqa ko‘plab sabablar uchun “turib qolishi” mumkin — buyurtmalar kitobiga (order book) umuman chiqmasligi ham mumkin.
Kit (whale) ma’lumotlari esa aniq bearish (ayiqona) talqinni darhol tasdiqlamaydi, balki foydali kontekst beradi. Birja Whale Ratio ko‘rsatkich 0.43 atrofida bo‘lib, avvalgi cho‘qqilardan past — bu hozir davom etayotgan “istisno darajadagi, kit boshchiligida bo‘layotgan sotuv” g‘oyasini qo‘llab-quvvatlamaydi. Agar yirik egalari ushbu qaytish (rebound) paytida agressiv tarzda sotayotgan bo‘lsa, u holda bu nisbat oldingi eng yuqori darajalariga yaqinlashishini kutardingiz, lekin u ulardan pastda turibdi.
Mening halol bahom: narx tiklanishi davrida zaxiralarning o‘sishi — kuzatishga arziydigan haqiqiy “sariq” ogohlantiruvchi belgi; bu hali tasdiqlangan ayiqona signal emas. Kit nisbatining past darajada qolishi jamlangan dump (keskin sotuv)ga zid. Biroq, to‘planayotgan ta’minotning bu qaytish barqaror turishi uchun real talab tomonidan yutilishi kerak va hozircha, qaysi tomondan bo‘lishidan qat’i nazar, bu yutilish hali tasdiqlanmagan.
Nimani kuzatyapman: Binance zaxiralari narx $81,000 atrofida ushlanib turgan paytda ham ko‘tarilishini davom ettiradimi-yo‘qmi, va shu bilan birga whale ratio yuqoriga chiqa boshlaydimi-yo‘qmi. Chunki bu kombinatsiya — taqsimlanish (distribution) bo‘yicha haqiqiy tasdiq bo‘ladigan omil — faqat bittagina signalning o‘zi emas.
$BTC #BTC Price Analysis# #Altcoin Season#
Binance ayniqsa shu yerda kuzatishga arziydi, chunki uning ko‘lami katta: CoinGecko ma’lumotlariga ko‘ra, u 2025-yil dekabr oyida eng yirik 10 ta markazlashtirilgan birja orasida spot hajmining 38.3% ini egallagan, ya’ni har qanday alohida raqobatchidan sezilarli darajada kattaroq. 2026-yil avgust oyining oxiridan beri bir necha ming BTC sof kirimi yig‘ilib borgan: eng so‘nggi ko‘rsatkich esa sof asosda taxminan 439 BTC kirib kelayotganini ko‘rsatadi. Buni aniqroq aytishga arziydi: bu aslida nimani isbotlaydi? Depozitlar sotuv tomoni bo‘yicha potensial ta’minotni oshiradi, lekin u hech kim haqiqatan ham sotayotganini tasdiqlamaydi. Ko‘pincha tangalar birjada custody (saqlash), garov (collateral) yoki boshqa ko‘plab sabablar uchun “turib qolishi” mumkin — buyurtmalar kitobiga (order book) umuman chiqmasligi ham mumkin.
Kit (whale) ma’lumotlari esa aniq bearish (ayiqona) talqinni darhol tasdiqlamaydi, balki foydali kontekst beradi. Birja Whale Ratio ko‘rsatkich 0.43 atrofida bo‘lib, avvalgi cho‘qqilardan past — bu hozir davom etayotgan “istisno darajadagi, kit boshchiligida bo‘layotgan sotuv” g‘oyasini qo‘llab-quvvatlamaydi. Agar yirik egalari ushbu qaytish (rebound) paytida agressiv tarzda sotayotgan bo‘lsa, u holda bu nisbat oldingi eng yuqori darajalariga yaqinlashishini kutardingiz, lekin u ulardan pastda turibdi.
Mening halol bahom: narx tiklanishi davrida zaxiralarning o‘sishi — kuzatishga arziydigan haqiqiy “sariq” ogohlantiruvchi belgi; bu hali tasdiqlangan ayiqona signal emas. Kit nisbatining past darajada qolishi jamlangan dump (keskin sotuv)ga zid. Biroq, to‘planayotgan ta’minotning bu qaytish barqaror turishi uchun real talab tomonidan yutilishi kerak va hozircha, qaysi tomondan bo‘lishidan qat’i nazar, bu yutilish hali tasdiqlanmagan.
Nimani kuzatyapman: Binance zaxiralari narx $81,000 atrofida ushlanib turgan paytda ham ko‘tarilishini davom ettiradimi-yo‘qmi, va shu bilan birga whale ratio yuqoriga chiqa boshlaydimi-yo‘qmi. Chunki bu kombinatsiya — taqsimlanish (distribution) bo‘yicha haqiqiy tasdiq bo‘ladigan omil — faqat bittagina signalning o‘zi emas.
$BTC #BTC Price Analysis# #Altcoin Season#
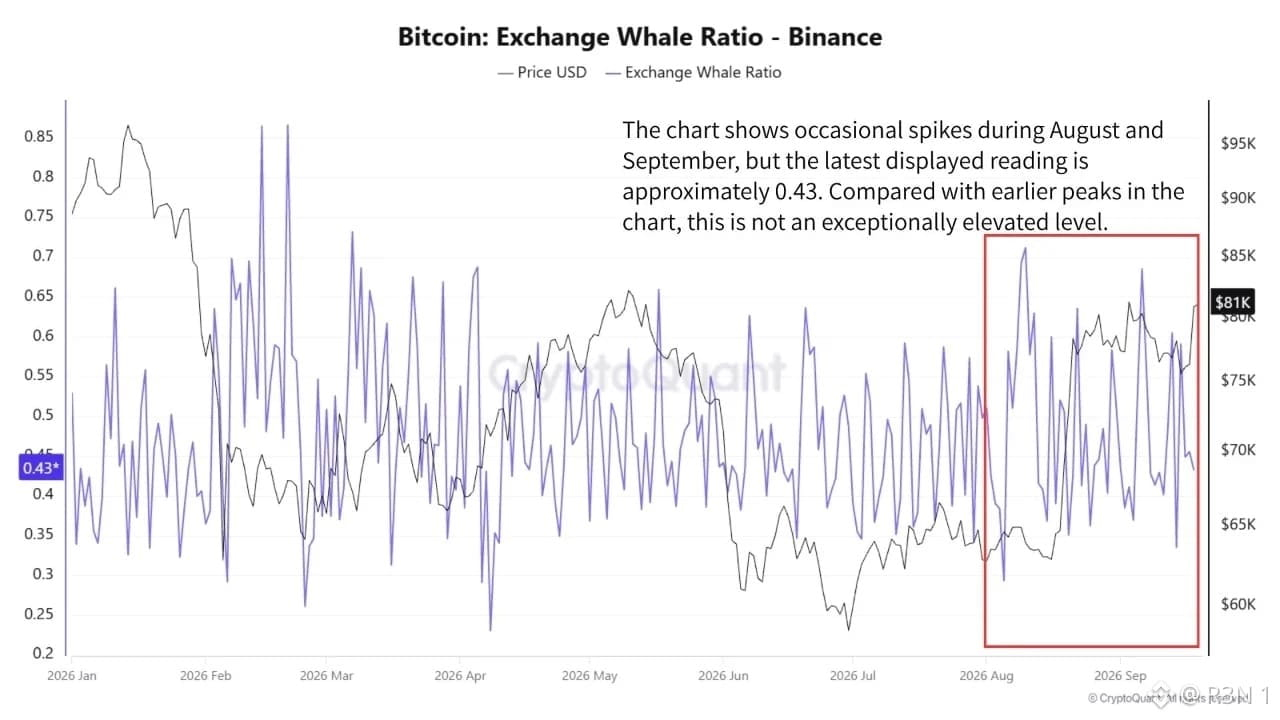
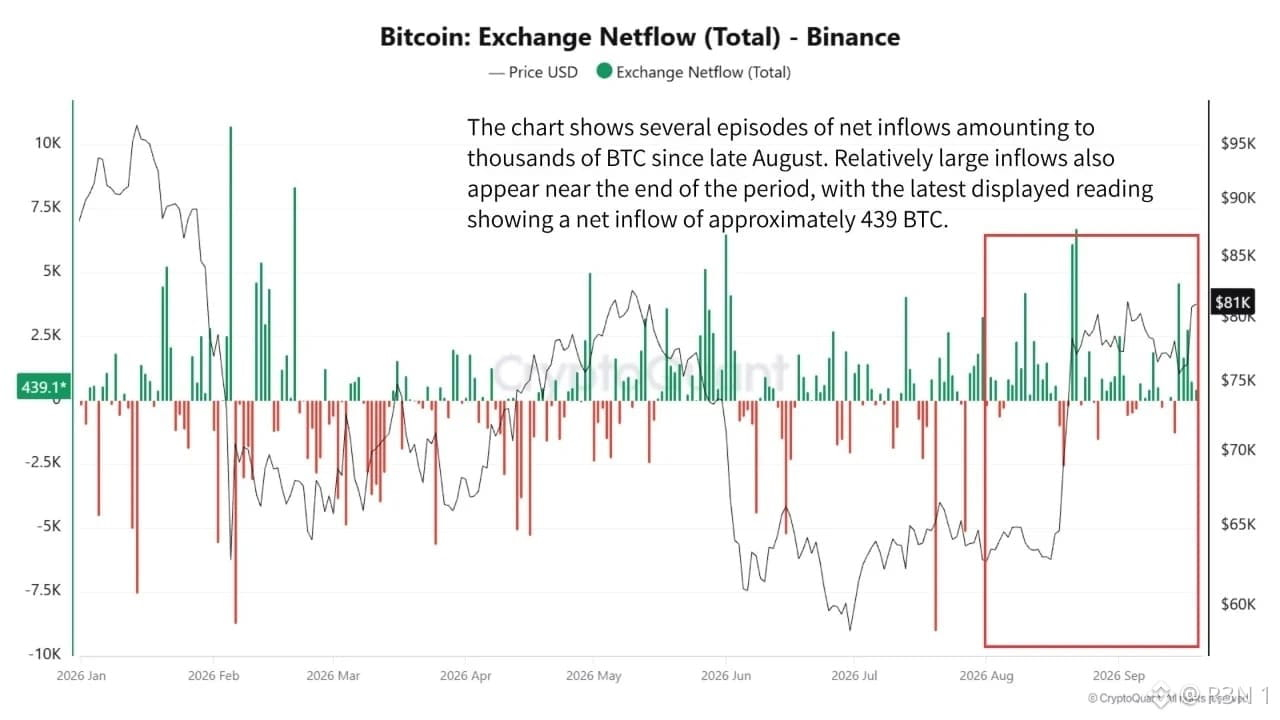
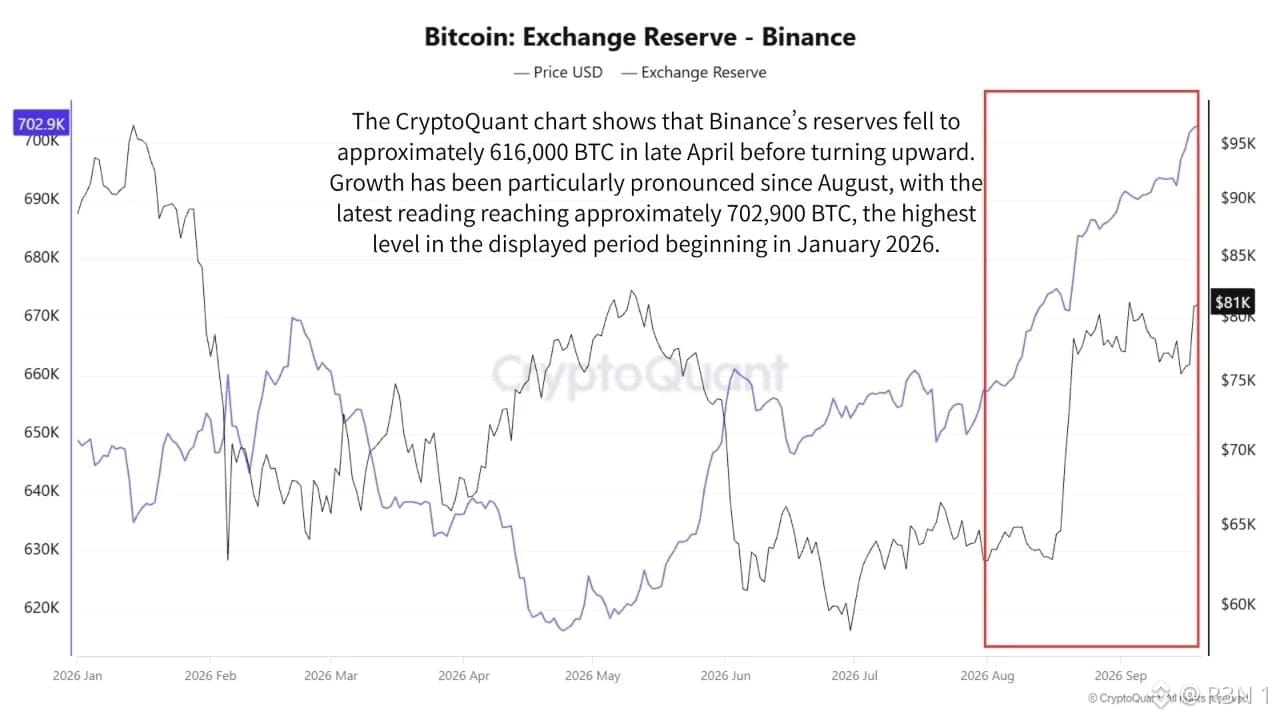
44
·
--
Bugun yana bitta Bitcoin sotib olindi va bu Salvadorning jami miqdorini 7 779 BTC ga yetkazdi. Hozirgi narxlarda bu taxminan 600 million dollarni tashkil etadi va buning ortidagi naqsh har qanday alohida kunlik xariddan ham muhimroq.
Bu “kuniga bitta Bitcoin” strategiyasi hali ham ishlamoqda: u 2021-yil sentyabrdan beri dollarning o‘rtacha qiymati (dollar cost averaging) orqali to‘plab borilgan va hukumatning o‘z da’volariga ko‘ra, bitta ham coin sotilmagan.
Hozirgi kunda zaxira Salvadorning umumiy xalqaro zaxiralarining taxminan 12–14% atrofini tashkil etadi — yagona, juda o‘zgaruvchan aktivdagi haqiqatan ham jamlangan suveren pozitsiya. Qaysi tomonni olishingizdan qat’i nazar, bu strategiya nimaga olib kelishini ko‘rsatadi.
Shuningdek, bu yerda qonuniy to‘lov vositasi kontekstiga ham aniq bo‘lish muhim, chunki u o‘zgardi. Bitcoin’ning asl majburiy savdogarlar tomonidan qabul qilinishi talabi 2025-yilda 1,4 milliard dollarlik IMF kelishuvi doirasida bekor qilingan: bu kreditlashning bir qismi mamlakatning Bitcoin’ga bo‘lgan ta’sirini mo‘tadil saqlashiga bog‘liq bo‘lgan.
Endi dollar soliqlar va davlat oldidagi majburiyatlar uchun amaliy hisob-kitob valyutasi hisoblanadi. Biroq to‘plab borish jarayoni hech qachon real ravishda to‘xtamagan: xaridlar 2025-yil bo‘ylab, bugungacha davom etgan, holbuki o‘sha IMF tili xoldinglar barqaror qolishi, o‘sishi emas, deb aniq aytadi.
Mening halol bahom: IMF kelishuvi go‘yo nimani talab qilayotgandek tuyulishi bilan Salvadorning aslida hozirgacha bajarayotgani o‘rtasidagi bu bo‘shliq — bosh sarlavhadagi raqamdan ko‘ra ko‘proq ahamiyatli bo‘lgan haqiqiy voqea. Kichik bir davlat ko‘p tomonlama aniq bosim fonida ham kamyob aktivni to‘plashda davom etayotgan bo‘lsa, bu yo chinakam qat’iy ishonch, yoki esa real diplomatik xarajat qoplanayotgan bo‘lishi mumkin — ehtimol ikkalasi ham.
Men kuzatayotgan narsa: shu kundalik xaridlar davom etayotganda IMF bilan aloqalar saqlanib qoladimi va bu sur’at joriy IMF dasturining shartlari amalda yangilanishi (muddati tugashi va qayta ko‘rib chiqilishi) kerak bo‘ladigan paytda umuman o‘zgaradimi.
$BTC #BTC Price Analysis# #Bitcoin Price Prediction: What is Bitcoins next move?#
Bugun yana bitta Bitcoin sotib olindi va bu Salvadorning jami miqdorini 7 779 BTC ga yetkazdi. Hozirgi narxlarda bu taxminan 600 million dollarni tashkil etadi va buning ortidagi naqsh har qanday alohida kunlik xariddan ham muhimroq.
Bu “kuniga bitta Bitcoin” strategiyasi hali ham ishlamoqda: u 2021-yil sentyabrdan beri dollarning o‘rtacha qiymati (dollar cost averaging) orqali to‘plab borilgan va hukumatning o‘z da’volariga ko‘ra, bitta ham coin sotilmagan.
Hozirgi kunda zaxira Salvadorning umumiy xalqaro zaxiralarining taxminan 12–14% atrofini tashkil etadi — yagona, juda o‘zgaruvchan aktivdagi haqiqatan ham jamlangan suveren pozitsiya. Qaysi tomonni olishingizdan qat’i nazar, bu strategiya nimaga olib kelishini ko‘rsatadi.
Shuningdek, bu yerda qonuniy to‘lov vositasi kontekstiga ham aniq bo‘lish muhim, chunki u o‘zgardi. Bitcoin’ning asl majburiy savdogarlar tomonidan qabul qilinishi talabi 2025-yilda 1,4 milliard dollarlik IMF kelishuvi doirasida bekor qilingan: bu kreditlashning bir qismi mamlakatning Bitcoin’ga bo‘lgan ta’sirini mo‘tadil saqlashiga bog‘liq bo‘lgan.
Endi dollar soliqlar va davlat oldidagi majburiyatlar uchun amaliy hisob-kitob valyutasi hisoblanadi. Biroq to‘plab borish jarayoni hech qachon real ravishda to‘xtamagan: xaridlar 2025-yil bo‘ylab, bugungacha davom etgan, holbuki o‘sha IMF tili xoldinglar barqaror qolishi, o‘sishi emas, deb aniq aytadi.
Mening halol bahom: IMF kelishuvi go‘yo nimani talab qilayotgandek tuyulishi bilan Salvadorning aslida hozirgacha bajarayotgani o‘rtasidagi bu bo‘shliq — bosh sarlavhadagi raqamdan ko‘ra ko‘proq ahamiyatli bo‘lgan haqiqiy voqea. Kichik bir davlat ko‘p tomonlama aniq bosim fonida ham kamyob aktivni to‘plashda davom etayotgan bo‘lsa, bu yo chinakam qat’iy ishonch, yoki esa real diplomatik xarajat qoplanayotgan bo‘lishi mumkin — ehtimol ikkalasi ham.
Men kuzatayotgan narsa: shu kundalik xaridlar davom etayotganda IMF bilan aloqalar saqlanib qoladimi va bu sur’at joriy IMF dasturining shartlari amalda yangilanishi (muddati tugashi va qayta ko‘rib chiqilishi) kerak bo‘ladigan paytda umuman o‘zgaradimi.
$BTC #BTC Price Analysis# #Bitcoin Price Prediction: What is Bitcoins next move?#
Bu “kuniga bitta Bitcoin” strategiyasi hali ham ishlamoqda: u 2021-yil sentyabrdan beri dollarning o‘rtacha qiymati (dollar cost averaging) orqali to‘plab borilgan va hukumatning o‘z da’volariga ko‘ra, bitta ham coin sotilmagan.
Hozirgi kunda zaxira Salvadorning umumiy xalqaro zaxiralarining taxminan 12–14% atrofini tashkil etadi — yagona, juda o‘zgaruvchan aktivdagi haqiqatan ham jamlangan suveren pozitsiya. Qaysi tomonni olishingizdan qat’i nazar, bu strategiya nimaga olib kelishini ko‘rsatadi.
Shuningdek, bu yerda qonuniy to‘lov vositasi kontekstiga ham aniq bo‘lish muhim, chunki u o‘zgardi. Bitcoin’ning asl majburiy savdogarlar tomonidan qabul qilinishi talabi 2025-yilda 1,4 milliard dollarlik IMF kelishuvi doirasida bekor qilingan: bu kreditlashning bir qismi mamlakatning Bitcoin’ga bo‘lgan ta’sirini mo‘tadil saqlashiga bog‘liq bo‘lgan.
Endi dollar soliqlar va davlat oldidagi majburiyatlar uchun amaliy hisob-kitob valyutasi hisoblanadi. Biroq to‘plab borish jarayoni hech qachon real ravishda to‘xtamagan: xaridlar 2025-yil bo‘ylab, bugungacha davom etgan, holbuki o‘sha IMF tili xoldinglar barqaror qolishi, o‘sishi emas, deb aniq aytadi.
Mening halol bahom: IMF kelishuvi go‘yo nimani talab qilayotgandek tuyulishi bilan Salvadorning aslida hozirgacha bajarayotgani o‘rtasidagi bu bo‘shliq — bosh sarlavhadagi raqamdan ko‘ra ko‘proq ahamiyatli bo‘lgan haqiqiy voqea. Kichik bir davlat ko‘p tomonlama aniq bosim fonida ham kamyob aktivni to‘plashda davom etayotgan bo‘lsa, bu yo chinakam qat’iy ishonch, yoki esa real diplomatik xarajat qoplanayotgan bo‘lishi mumkin — ehtimol ikkalasi ham.
Men kuzatayotgan narsa: shu kundalik xaridlar davom etayotganda IMF bilan aloqalar saqlanib qoladimi va bu sur’at joriy IMF dasturining shartlari amalda yangilanishi (muddati tugashi va qayta ko‘rib chiqilishi) kerak bo‘ladigan paytda umuman o‘zgaradimi.
$BTC #BTC Price Analysis# #Bitcoin Price Prediction: What is Bitcoins next move?#
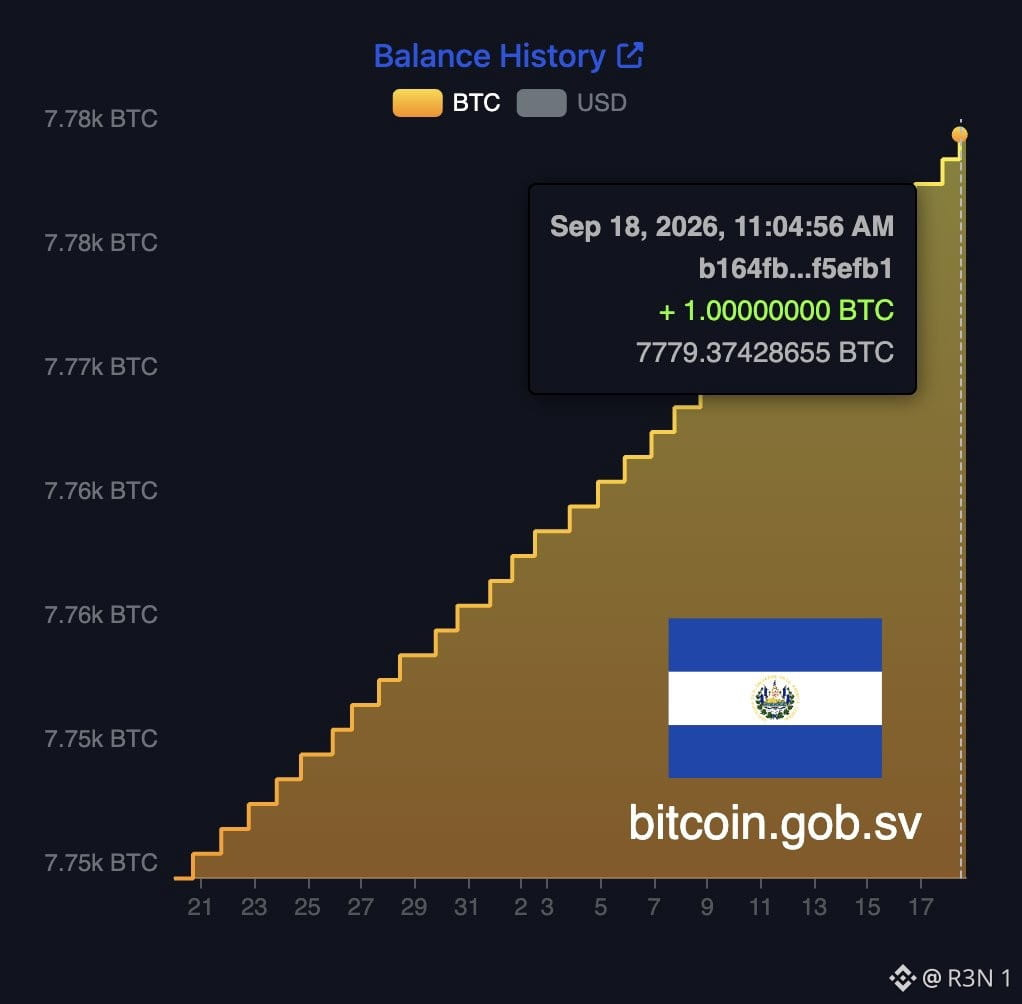
47
·
--
TONCO — TON tarmog‘ida jamlangan likvidlikka asoslangan markazlashmagan birja (DEX). U likvidlik provayderlariga kapitalni yanada samaraliroq joylashtirish imkonini beradi, foydalanuvchilarga esa standart AMM pul hovuzlari hosil qiladiganidan ko‘ra pastroq slippage bilan chuqurroq likvidlik taqdim etadi. Hozir u Omniston’ning cross-chain svoplarini o‘z interfeysiga bevosita integratsiya qildi.
Tushunishga arziydigan muhim jihat — bu e’lon qilinishidan oldin ikki protokol o‘rtasida allaqachon nima mavjud bo‘lgani. TONCO’ning barcha pul hovuzlari STONfi’da mavjud.
Bu hamkorlik allaqachon ishlayotgan edi. TONCO tomondagi Omniston cross-chain funksiyasi — yangi qo‘shimcha. STONfi foydalanuvchilari allaqachon kirishayotgan o‘sha cross-chain execution endi TONCO foydalanuvchilari uchun ham TONCO interfeysidan chiqmasdan mavjud.
Buning natijasida likvidlikning muayyan turi yuzaga keladi. TONCO’ning jamlangan likvidlik pul hovuzlari va STONfi’ning kengroq likvidlik qatlami allaqachon pul hovuzi darajasida bir-biriga ulangan. Endi Omniston hammasini to‘qqiz zanjirli cross-chain tarmog‘iga ulaydi.
TONCO’da Ethereum yoki BNB Chain’dan aktivlarni TONCO’ning jamlangan likvidlik pozitsiyasiga ko‘chirmoqchi bo‘lgan foydalanuvchi, buni STONfi’da cross-chain svoplarni quvvatlaydigan aynan o‘sha atomic HTLC execution orqali amalga oshira oladi.
E’lon buni to‘g‘ri ifodalagan. Omniston aynan shu use case’ga mo‘ljallangan — TON’da DeFi mahsulotlariga to‘liq execution qatlamini boshidan qurmasdan cross-chain execution qo‘shishga yordam berish.
TONCO’ning jamlangan likvidlik dvigateli haqiqatan ham o‘ziga xos. Qurish shart bo‘lmagan cross-chain access layer endi mavjud — chunki Omniston bor va uni integratsiya qilish oson.
Bir-biridan farq qiladigan likvidlik arxitekturasiga ega ikkita DEX bir xil cross-chain execution qatlamini baham ko‘rishi — TON’da rivojlanayotgan DeFi ekotizimi aynan qanday ko‘rinishini anglatadi.
TONCO’da cross-chain’ni o‘rganing →https://app.tonco.io/#/swap
Defi va kripto haqida o‘qing → https://blog.ston.fi/
$SOL #BTC Price Analysis# #BTC Price Analysis# $BTC
TONCO — TON tarmog‘ida jamlangan likvidlikka asoslangan markazlashmagan birja (DEX). U likvidlik provayderlariga kapitalni yanada samaraliroq joylashtirish imkonini beradi, foydalanuvchilarga esa standart AMM pul hovuzlari hosil qiladiganidan ko‘ra pastroq slippage bilan chuqurroq likvidlik taqdim etadi. Hozir u Omniston’ning cross-chain svoplarini o‘z interfeysiga bevosita integratsiya qildi.
Tushunishga arziydigan muhim jihat — bu e’lon qilinishidan oldin ikki protokol o‘rtasida allaqachon nima mavjud bo‘lgani. TONCO’ning barcha pul hovuzlari STONfi’da mavjud.
Bu hamkorlik allaqachon ishlayotgan edi. TONCO tomondagi Omniston cross-chain funksiyasi — yangi qo‘shimcha. STONfi foydalanuvchilari allaqachon kirishayotgan o‘sha cross-chain execution endi TONCO foydalanuvchilari uchun ham TONCO interfeysidan chiqmasdan mavjud.
Buning natijasida likvidlikning muayyan turi yuzaga keladi. TONCO’ning jamlangan likvidlik pul hovuzlari va STONfi’ning kengroq likvidlik qatlami allaqachon pul hovuzi darajasida bir-biriga ulangan. Endi Omniston hammasini to‘qqiz zanjirli cross-chain tarmog‘iga ulaydi.
TONCO’da Ethereum yoki BNB Chain’dan aktivlarni TONCO’ning jamlangan likvidlik pozitsiyasiga ko‘chirmoqchi bo‘lgan foydalanuvchi, buni STONfi’da cross-chain svoplarni quvvatlaydigan aynan o‘sha atomic HTLC execution orqali amalga oshira oladi.
E’lon buni to‘g‘ri ifodalagan. Omniston aynan shu use case’ga mo‘ljallangan — TON’da DeFi mahsulotlariga to‘liq execution qatlamini boshidan qurmasdan cross-chain execution qo‘shishga yordam berish.
TONCO’ning jamlangan likvidlik dvigateli haqiqatan ham o‘ziga xos. Qurish shart bo‘lmagan cross-chain access layer endi mavjud — chunki Omniston bor va uni integratsiya qilish oson.
Bir-biridan farq qiladigan likvidlik arxitekturasiga ega ikkita DEX bir xil cross-chain execution qatlamini baham ko‘rishi — TON’da rivojlanayotgan DeFi ekotizimi aynan qanday ko‘rinishini anglatadi.
TONCO’da cross-chain’ni o‘rganing →https://app.tonco.io/#/swap
Defi va kripto haqida o‘qing → https://blog.ston.fi/
$SOL #BTC Price Analysis# #BTC Price Analysis# $BTC
Tushunishga arziydigan muhim jihat — bu e’lon qilinishidan oldin ikki protokol o‘rtasida allaqachon nima mavjud bo‘lgani. TONCO’ning barcha pul hovuzlari STONfi’da mavjud.
Bu hamkorlik allaqachon ishlayotgan edi. TONCO tomondagi Omniston cross-chain funksiyasi — yangi qo‘shimcha. STONfi foydalanuvchilari allaqachon kirishayotgan o‘sha cross-chain execution endi TONCO foydalanuvchilari uchun ham TONCO interfeysidan chiqmasdan mavjud.
Buning natijasida likvidlikning muayyan turi yuzaga keladi. TONCO’ning jamlangan likvidlik pul hovuzlari va STONfi’ning kengroq likvidlik qatlami allaqachon pul hovuzi darajasida bir-biriga ulangan. Endi Omniston hammasini to‘qqiz zanjirli cross-chain tarmog‘iga ulaydi.
TONCO’da Ethereum yoki BNB Chain’dan aktivlarni TONCO’ning jamlangan likvidlik pozitsiyasiga ko‘chirmoqchi bo‘lgan foydalanuvchi, buni STONfi’da cross-chain svoplarni quvvatlaydigan aynan o‘sha atomic HTLC execution orqali amalga oshira oladi.
E’lon buni to‘g‘ri ifodalagan. Omniston aynan shu use case’ga mo‘ljallangan — TON’da DeFi mahsulotlariga to‘liq execution qatlamini boshidan qurmasdan cross-chain execution qo‘shishga yordam berish.
TONCO’ning jamlangan likvidlik dvigateli haqiqatan ham o‘ziga xos. Qurish shart bo‘lmagan cross-chain access layer endi mavjud — chunki Omniston bor va uni integratsiya qilish oson.
Bir-biridan farq qiladigan likvidlik arxitekturasiga ega ikkita DEX bir xil cross-chain execution qatlamini baham ko‘rishi — TON’da rivojlanayotgan DeFi ekotizimi aynan qanday ko‘rinishini anglatadi.
TONCO’da cross-chain’ni o‘rganing →https://app.tonco.io/#/swap
Defi va kripto haqida o‘qing → https://blog.ston.fi/
$SOL #BTC Price Analysis# #BTC Price Analysis# $BTC
53
Ko‘proq kontentni ko‘rish uchun tizimga kiring
Binance Square'da global kriptovalyuta foydalanuvchilariga qo‘shiling
⚡️ Kriptovalyuta haqida eng so‘nggi va foydali ma’lumotlarni oling.
💬 Dunyoning eng yirik kriptovalyuta birjasi tomonidan ishonchli deb topilgan.
👍 Tasdiqlangan mualliflardan haqiqiy tahlillarni kashf eting.
Email / telefon raqami
Trenddagi mavzular
NEARRisesNearly80%InAWeek
1 marta koʻrilgan
22 muhokama qilmoqda
#nearrisesnearly80%inaweek
NEAR Protocol bu haftada butunlay “otga-minib” ketdi — mana nima sabab bo‘layotgani 🔥
NEAR uchun zo‘r hafta bo‘ldi! 🚀 Cbor kun ichida qariyb 80% ga ko‘tarilish — bu faqat omad emas; NEAR’ning zanjir abstraksiyasi (chain abstraction) va AI integratsiyasi haqidagi qarashlari atrofida kuchli momentum to‘planayotganini ko‘rsatadi. Texnologik samaradorlik retaildagi shov-shuv bilan uchrashganda, aynan shunday narx harakati kuzatiladi.
Siz NEAR’ni uzoq muddatga ushlab turasizmi yoki hozirgi darajalarda foyda olib qolasizmi? Strategiyangizni pastga yozing! 👇
$NEAR
#BitcoinHits$85K #Near #crypto
Lily星星
·0 ta layk
·59 marta koʻrilgan
MultiversXPlansHardForkRecovery
499 marta koʻrilgan
94 muhokama qilmoqda
CircleLaunchesInstitutionalBTCBackedBorrowing
2,275 marta koʻrilgan
251 muhokama qilmoqda