
AlphaTradesAyan
317 Postlar

AlphaTradesAyan
Shikoyat qilish
Foydalanuvchini bloklash
Spot for Wealth | Futures & Options Trading for Cash Flow | Follow to Grow your Portfolio! 🚀 | NFA | DYOR l
1.3 yil
74 Kuzatilmoqda
40 Kuzatuvchilar
210 Yoqdi
Postlar
Tarjimani ko‘rish
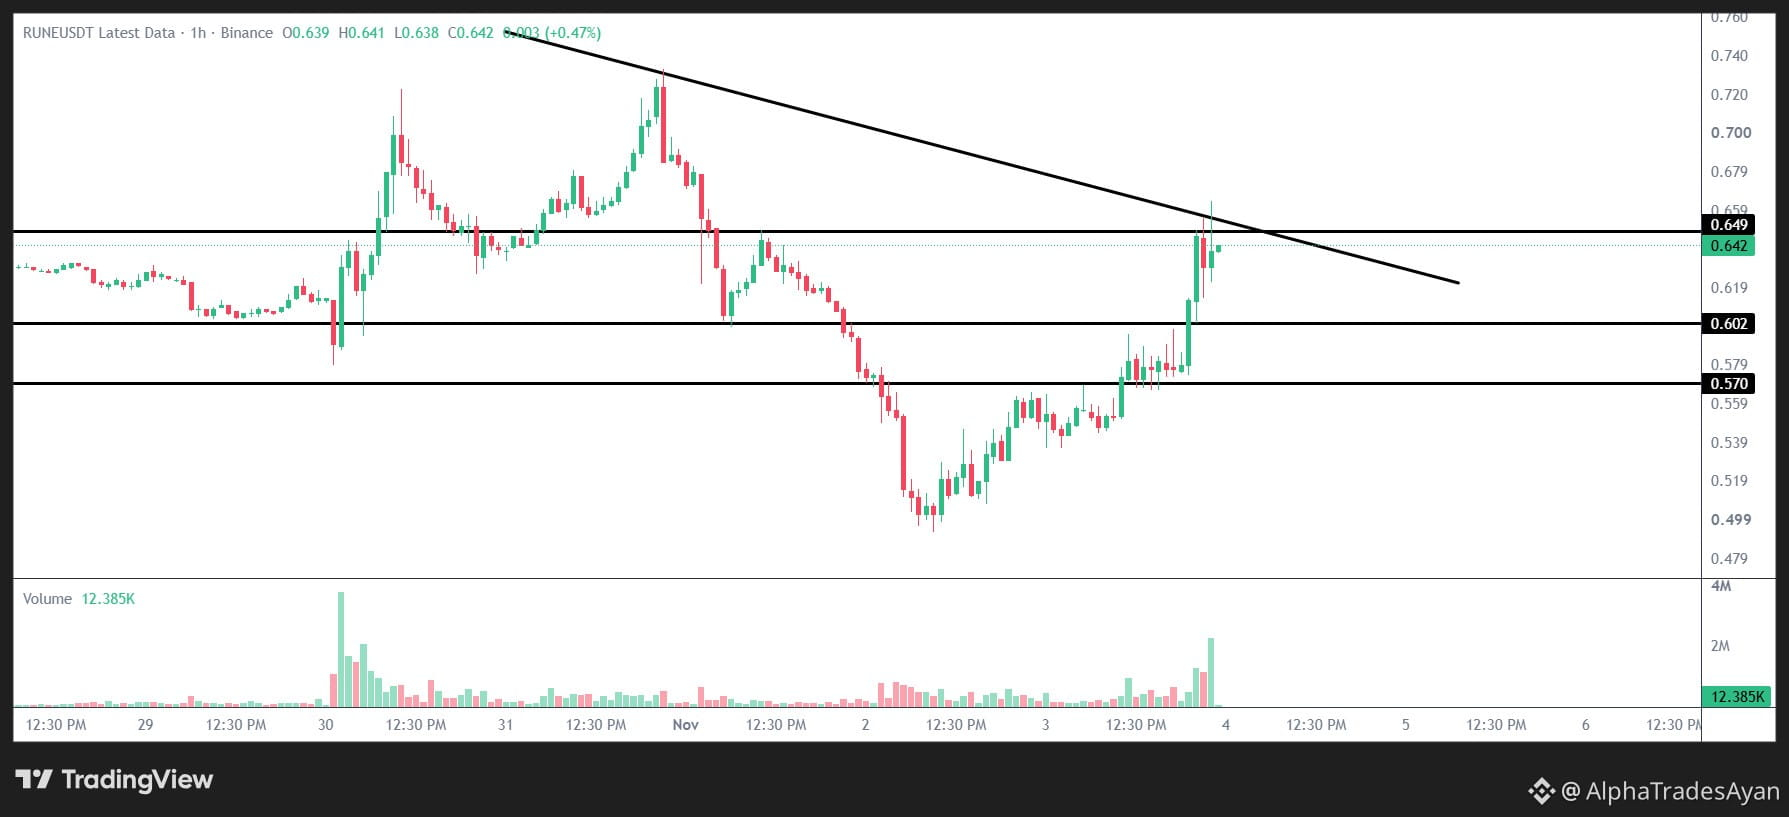
👀 Quick look at the $RUNE structure right now:
After a very solid and steady recovery from the recent lows, RUNE has officially arrived at a major technical crossroads on the 1-hour time frame.
The price action is currently pressing directly against a long-standing overhead descending trendline, causing a massive squeeze between the support bases and the resistance ceiling.
📊 The critical levels on my watch list:
Overhead Resistance: 0.649 (The ultimate breakout line)
Immediate Support: 0.602 (The first safety floor)
Deep Support: 0.570 (The secondary bounce zone)
$RUNE
{future}(RUNEUSDT)
Technical Outlook:
A clean and confirmed 1H candle close above the 0.649 resistance—backed by strong trading volume—could spark a quick momentum expansion to the upside. However, if this trendline continues to act as a heavy supply zone, we should anticipate a healthy rotation back down to test the horizontal support levels.
💬 How are you scanning this chart pattern?
👇 Do you expect a successful trendline breakout or a sharp rejection? Let's discuss in the comments!
NFA | DYOR
👀 Quick look at the $RUNE structure right now:
After a very solid and steady recovery from the recent lows, RUNE has officially arrived at a major technical crossroads on the 1-hour time frame.
The price action is currently pressing directly against a long-standing overhead descending trendline, causing a massive squeeze between the support bases and the resistance ceiling.
📊 The critical levels on my watch list:
Overhead Resistance: 0.649 (The ultimate breakout line)
Immediate Support: 0.602 (The first safety floor)
Deep Support: 0.570 (The secondary bounce zone)
$RUNE
Technical Outlook:
A clean and confirmed 1H candle close above the 0.649 resistance—backed by strong trading volume—could spark a quick momentum expansion to the upside. However, if this trendline continues to act as a heavy supply zone, we should anticipate a healthy rotation back down to test the horizontal support levels.
💬 How are you scanning this chart pattern?
👇 Do you expect a successful trendline breakout or a sharp rejection? Let's discuss in the comments!
NFA | DYOR
After a very solid and steady recovery from the recent lows, RUNE has officially arrived at a major technical crossroads on the 1-hour time frame.
The price action is currently pressing directly against a long-standing overhead descending trendline, causing a massive squeeze between the support bases and the resistance ceiling.
📊 The critical levels on my watch list:
Overhead Resistance: 0.649 (The ultimate breakout line)
Immediate Support: 0.602 (The first safety floor)
Deep Support: 0.570 (The secondary bounce zone)
$RUNE
Technical Outlook:
A clean and confirmed 1H candle close above the 0.649 resistance—backed by strong trading volume—could spark a quick momentum expansion to the upside. However, if this trendline continues to act as a heavy supply zone, we should anticipate a healthy rotation back down to test the horizontal support levels.
💬 How are you scanning this chart pattern?
👇 Do you expect a successful trendline breakout or a sharp rejection? Let's discuss in the comments!
NFA | DYOR
1
1
227
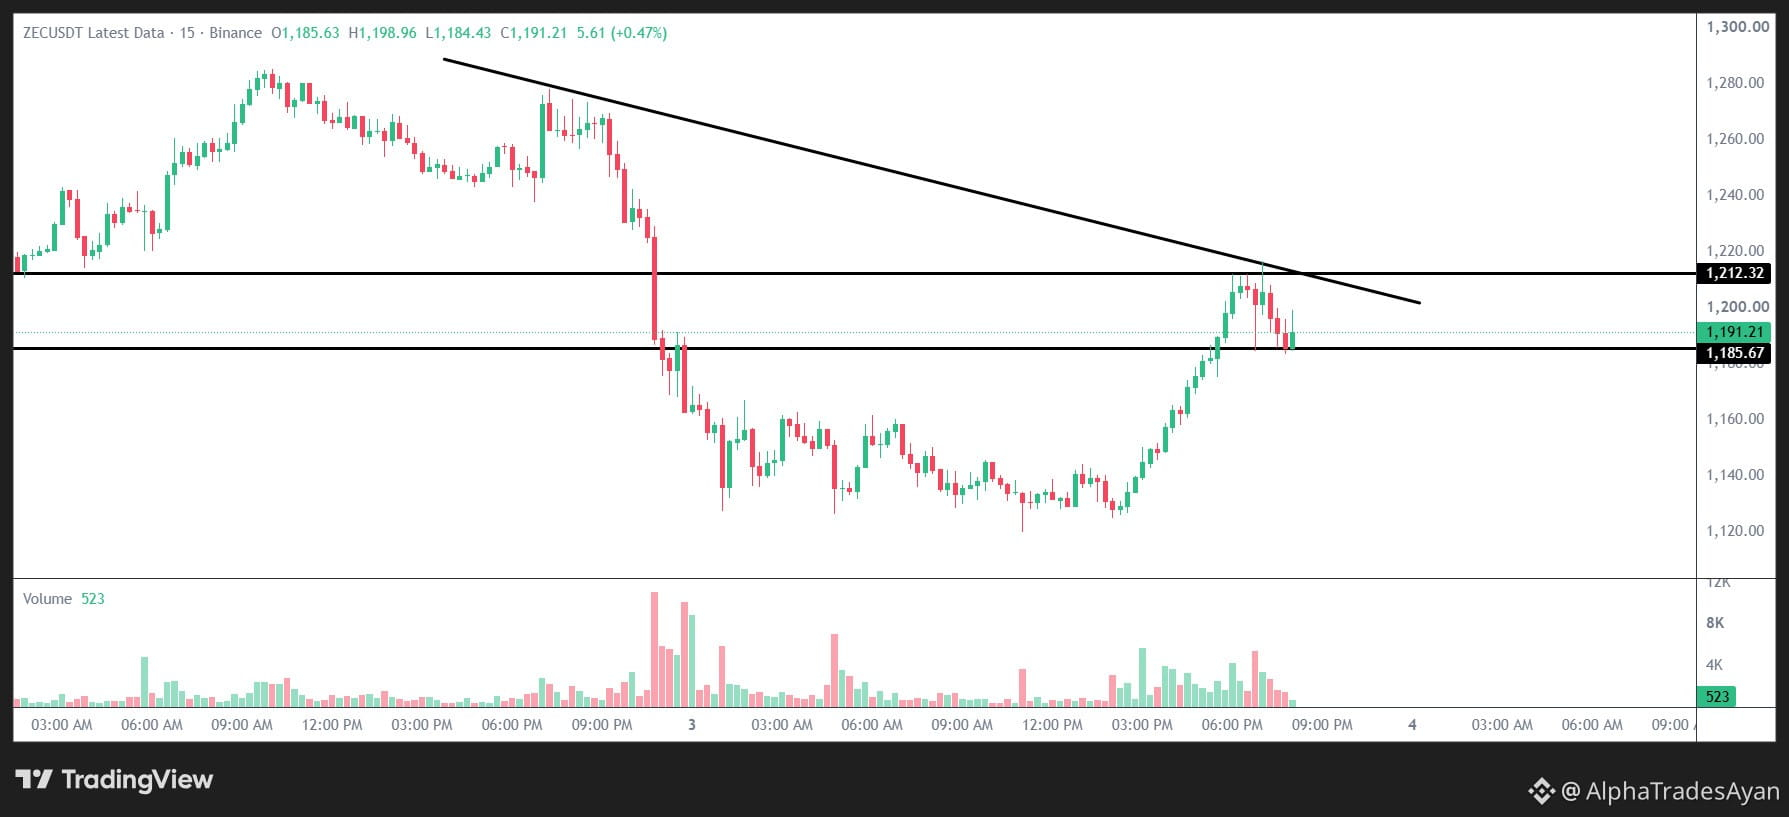
🚨$ZEC 15m Grafik tahlili — asosiy trend chizig‘i tuzilmasini sinash 👀
15 daqiqalik grafikni ko‘rib chiqsak, ZEC hozir juda aniq texnik siqilish holatini namoyish etmoqda. Narx 1,120 zonasigacha keskin tuzatishdan so‘ng, hajmning barqaror tiklanishi kuzatildi va narx yuqori chegaralarni qayta sinash uchun ko‘tarildi.
Hozirda narx harakati muhim pasayuvchi trend chizig‘i va tekis gorizontal qarshilik darajasining tagida tor diapazonda jamlanmoqda. Bozor tuzilmasi muhim qaror nuqtasiga kelib qoldi.
📊 Kuzatuvimdagi asosiy texnik darajalar:
🎯 Gorizontal qarshilik darajasi: 1,212.32
🛡️ Yaqin qo‘llab-quvvatlash darajasi: 1,185.67
$ZEC
{future}(ZECUSDT)
Kuchli hajm bilan tasdiqlangan 15 daqiqalik shamning 1,212 darajasidan yuqorida yopilishi joriy diapazonni yuqoriga kengaytirishi mumkin. Boshqa tomondan, agar yuqoridagi trend chizig‘i narxni qaytarishda davom etsa, narx yana pastga burilib, yaqin gorizontal qo‘llab-quvvatlash darajasini sinashi mumkin.
💬 Joriy grafik shaklini qanday talqin qilyapsiz?
👇 Sizningcha, narx qarshilik darajasidan yuqoriga yorib o‘tadimi yoki qo‘llab-quvvatlashdan qaytadimi? Fikringizni quyida ulashing!
Moliyaviy maslahat emas | O‘zingiz tadqiq qiling
🚨$ZEC 15m Grafik tahlili — asosiy trend chizig‘i tuzilmasini sinash 👀
15 daqiqalik grafikni ko‘rib chiqsak, ZEC hozir juda aniq texnik siqilish holatini namoyish etmoqda. Narx 1,120 zonasigacha keskin tuzatishdan so‘ng, hajmning barqaror tiklanishi kuzatildi va narx yuqori chegaralarni qayta sinash uchun ko‘tarildi.
Hozirda narx harakati muhim pasayuvchi trend chizig‘i va tekis gorizontal qarshilik darajasining tagida tor diapazonda jamlanmoqda. Bozor tuzilmasi muhim qaror nuqtasiga kelib qoldi.
📊 Kuzatuvimdagi asosiy texnik darajalar:
🎯 Gorizontal qarshilik darajasi: 1,212.32
🛡️ Yaqin qo‘llab-quvvatlash darajasi: 1,185.67
$ZEC
Kuchli hajm bilan tasdiqlangan 15 daqiqalik shamning 1,212 darajasidan yuqorida yopilishi joriy diapazonni yuqoriga kengaytirishi mumkin. Boshqa tomondan, agar yuqoridagi trend chizig‘i narxni qaytarishda davom etsa, narx yana pastga burilib, yaqin gorizontal qo‘llab-quvvatlash darajasini sinashi mumkin.
💬 Joriy grafik shaklini qanday talqin qilyapsiz?
👇 Sizningcha, narx qarshilik darajasidan yuqoriga yorib o‘tadimi yoki qo‘llab-quvvatlashdan qaytadimi? Fikringizni quyida ulashing!
Moliyaviy maslahat emas | O‘zingiz tadqiq qiling
15 daqiqalik grafikni ko‘rib chiqsak, ZEC hozir juda aniq texnik siqilish holatini namoyish etmoqda. Narx 1,120 zonasigacha keskin tuzatishdan so‘ng, hajmning barqaror tiklanishi kuzatildi va narx yuqori chegaralarni qayta sinash uchun ko‘tarildi.
Hozirda narx harakati muhim pasayuvchi trend chizig‘i va tekis gorizontal qarshilik darajasining tagida tor diapazonda jamlanmoqda. Bozor tuzilmasi muhim qaror nuqtasiga kelib qoldi.
📊 Kuzatuvimdagi asosiy texnik darajalar:
🎯 Gorizontal qarshilik darajasi: 1,212.32
🛡️ Yaqin qo‘llab-quvvatlash darajasi: 1,185.67
$ZEC
Kuchli hajm bilan tasdiqlangan 15 daqiqalik shamning 1,212 darajasidan yuqorida yopilishi joriy diapazonni yuqoriga kengaytirishi mumkin. Boshqa tomondan, agar yuqoridagi trend chizig‘i narxni qaytarishda davom etsa, narx yana pastga burilib, yaqin gorizontal qo‘llab-quvvatlash darajasini sinashi mumkin.
💬 Joriy grafik shaklini qanday talqin qilyapsiz?
👇 Sizningcha, narx qarshilik darajasidan yuqoriga yorib o‘tadimi yoki qo‘llab-quvvatlashdan qaytadimi? Fikringizni quyida ulashing!
Moliyaviy maslahat emas | O‘zingiz tadqiq qiling
1
1
391
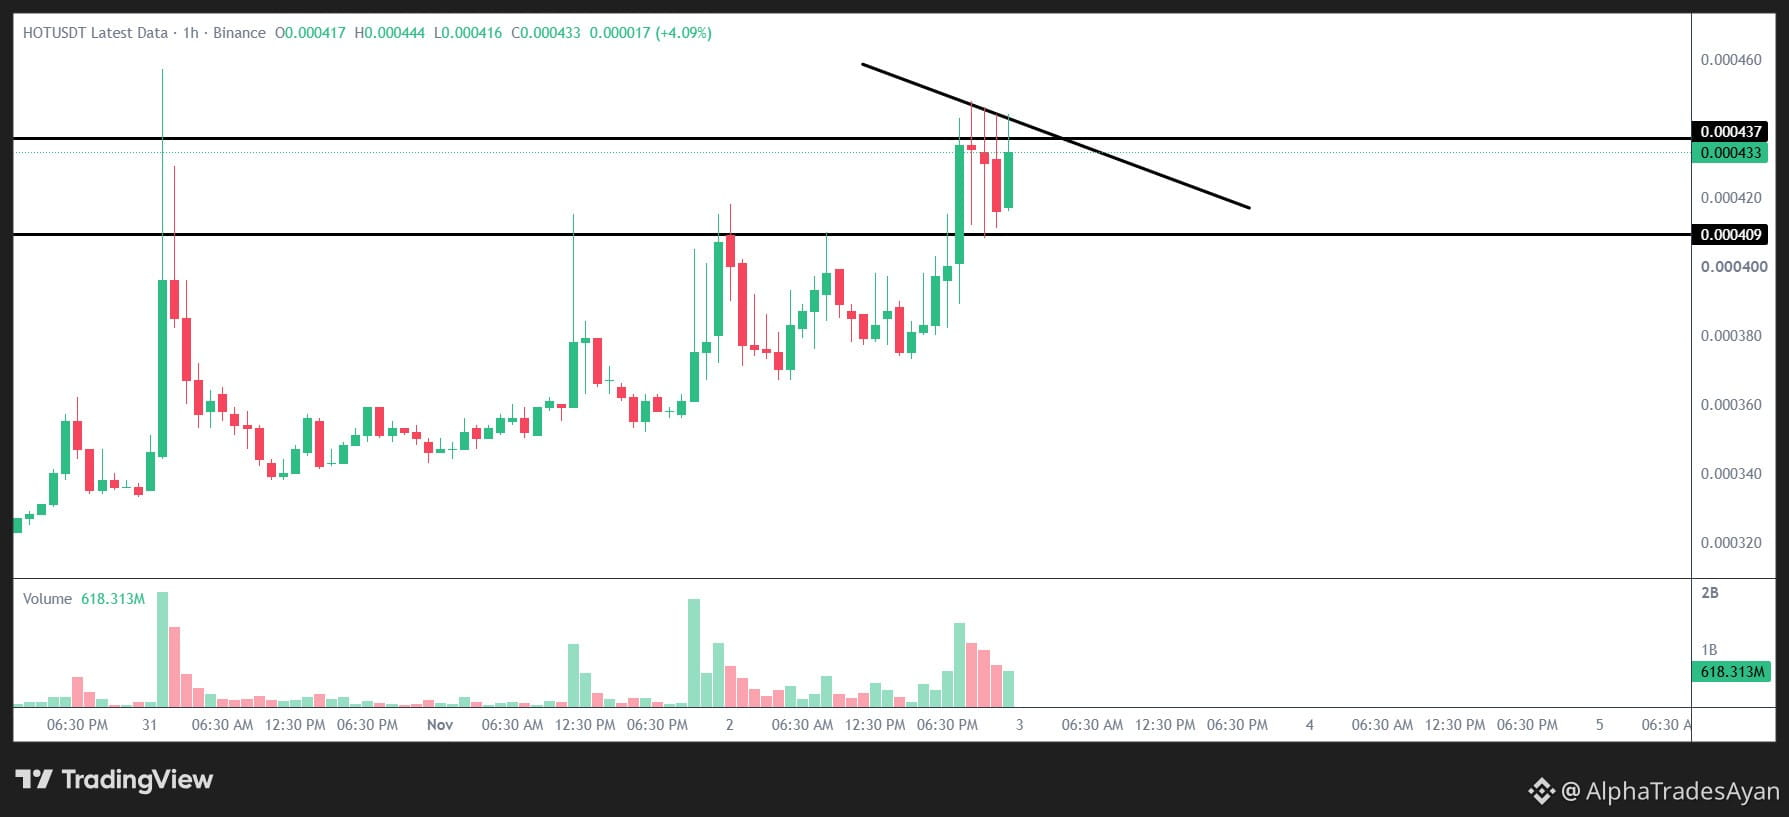
🚨 $HOT 1H vaqt oralig‘idagi aniq narx harakatini kuzatyapman.
Narx harakati hozir aniq pasayuvchi trend chizig‘i ostida keskin siqilmoqda. Ayni paytda kuzatayotgan aniq strukturaviy zonalar:
Dinamik to‘siq: Pasayuvchi trend chizig‘i
Joriy pivot: 0.000433
Mahalliy tayanch: 0.000409
$HOT
{future}(HOTUSDT)
Bu yerda yo‘nalish bo‘yicha hech qanday taxminim yo‘q. Shunchaki narx shu tor oraliqda siqilayotganda hajm qanday o‘zgarishini kuzatyapman. Strukturani aniqroq tushunish uchun shu zonadan tashqarida 1H shamning aniq yopilishini kutyapman. 👇
NFA | DYOR
🚨 $HOT 1H vaqt oralig‘idagi aniq narx harakatini kuzatyapman.
Narx harakati hozir aniq pasayuvchi trend chizig‘i ostida keskin siqilmoqda. Ayni paytda kuzatayotgan aniq strukturaviy zonalar:
Dinamik to‘siq: Pasayuvchi trend chizig‘i
Joriy pivot: 0.000433
Mahalliy tayanch: 0.000409
$HOT
Bu yerda yo‘nalish bo‘yicha hech qanday taxminim yo‘q. Shunchaki narx shu tor oraliqda siqilayotganda hajm qanday o‘zgarishini kuzatyapman. Strukturani aniqroq tushunish uchun shu zonadan tashqarida 1H shamning aniq yopilishini kutyapman. 👇
NFA | DYOR
Narx harakati hozir aniq pasayuvchi trend chizig‘i ostida keskin siqilmoqda. Ayni paytda kuzatayotgan aniq strukturaviy zonalar:
Dinamik to‘siq: Pasayuvchi trend chizig‘i
Joriy pivot: 0.000433
Mahalliy tayanch: 0.000409
$HOT
Bu yerda yo‘nalish bo‘yicha hech qanday taxminim yo‘q. Shunchaki narx shu tor oraliqda siqilayotganda hajm qanday o‘zgarishini kuzatyapman. Strukturani aniqroq tushunish uchun shu zonadan tashqarida 1H shamning aniq yopilishini kutyapman. 👇
NFA | DYOR
1
1
405
Tarjimani ko‘rish
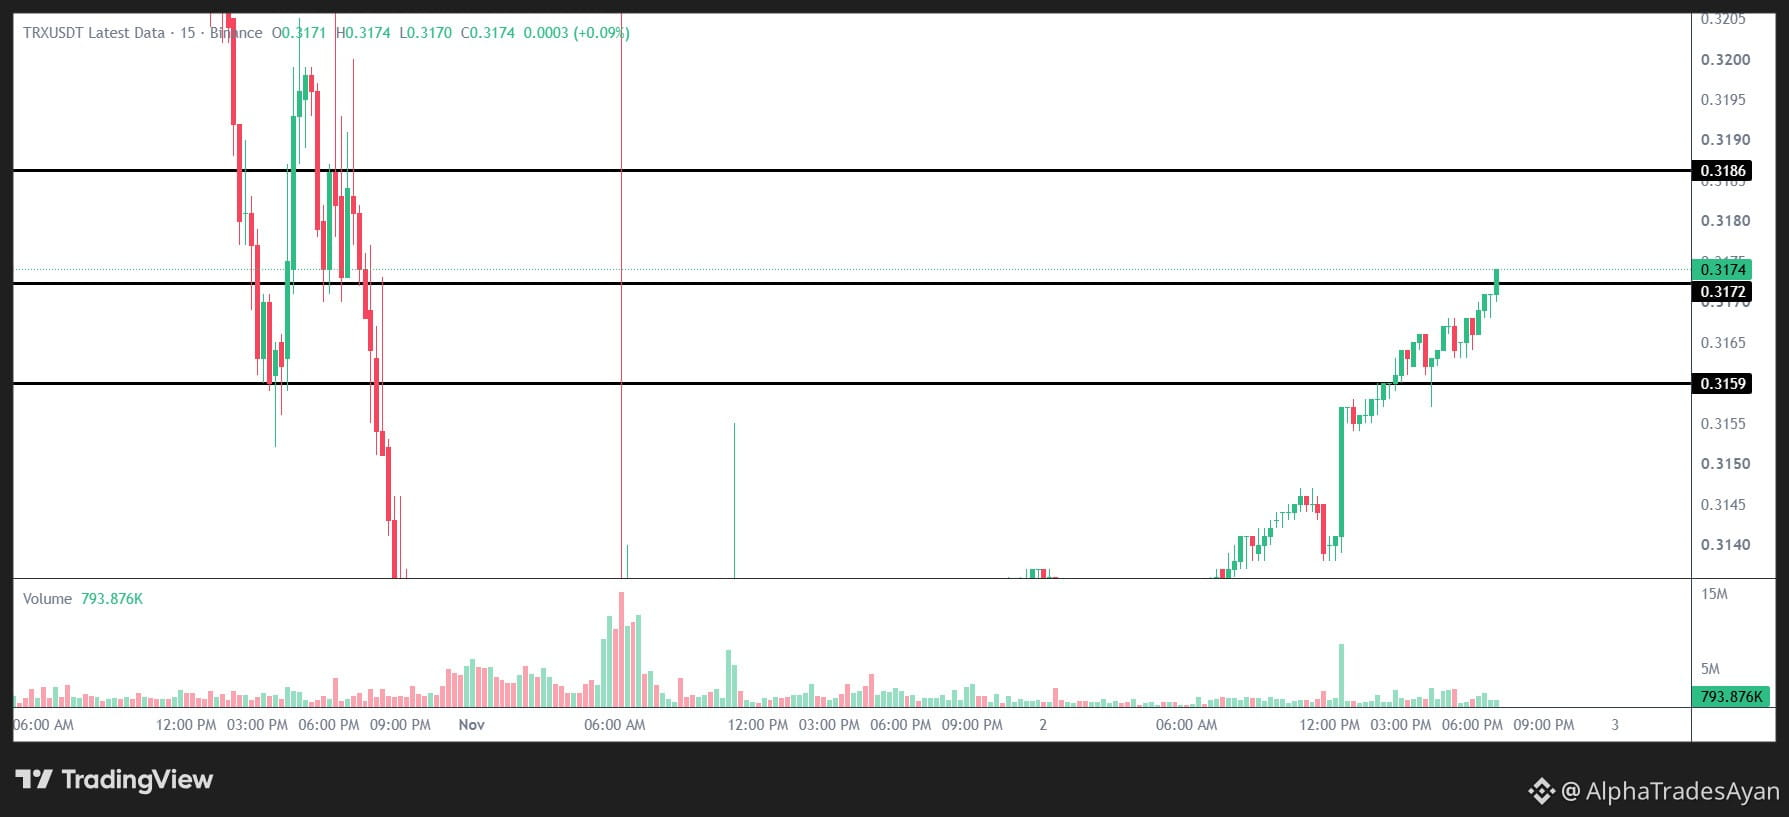
🚨 Monitoring the momentum shift on the $TRX 15m timeframe.
The structure here is showing some very clean price action. After a solid buildup, price has pushed through the mid-range pivot at 0.3172 and is currently trying to establish it as new local support.
I am keeping a very close eye on these specific structural boundaries right now:
🚧 Immediate Resistance: 0.3186
⚖️ Current Pivot / Support: 0.3172
📉 Lower Base: 0.3159
$TRX
{future}(TRXUSDT)
I'm not front-running any positions here. The key observation is whether the buyers can successfully defend this 0.3172 level on the upcoming candle closes. If volume sustains above this line, the structure remains intact for a test of the upper boundary.
Just watching how the market handles this exact zone. 👇
NFA | DYOR
🚨 Monitoring the momentum shift on the $TRX 15m timeframe.
The structure here is showing some very clean price action. After a solid buildup, price has pushed through the mid-range pivot at 0.3172 and is currently trying to establish it as new local support.
I am keeping a very close eye on these specific structural boundaries right now:
🚧 Immediate Resistance: 0.3186
⚖️ Current Pivot / Support: 0.3172
📉 Lower Base: 0.3159
$TRX
I'm not front-running any positions here. The key observation is whether the buyers can successfully defend this 0.3172 level on the upcoming candle closes. If volume sustains above this line, the structure remains intact for a test of the upper boundary.
Just watching how the market handles this exact zone. 👇
NFA | DYOR
The structure here is showing some very clean price action. After a solid buildup, price has pushed through the mid-range pivot at 0.3172 and is currently trying to establish it as new local support.
I am keeping a very close eye on these specific structural boundaries right now:
🚧 Immediate Resistance: 0.3186
⚖️ Current Pivot / Support: 0.3172
📉 Lower Base: 0.3159
$TRX
I'm not front-running any positions here. The key observation is whether the buyers can successfully defend this 0.3172 level on the upcoming candle closes. If volume sustains above this line, the structure remains intact for a test of the upper boundary.
Just watching how the market handles this exact zone. 👇
NFA | DYOR
1
1
131
Tarjimani ko‘rish
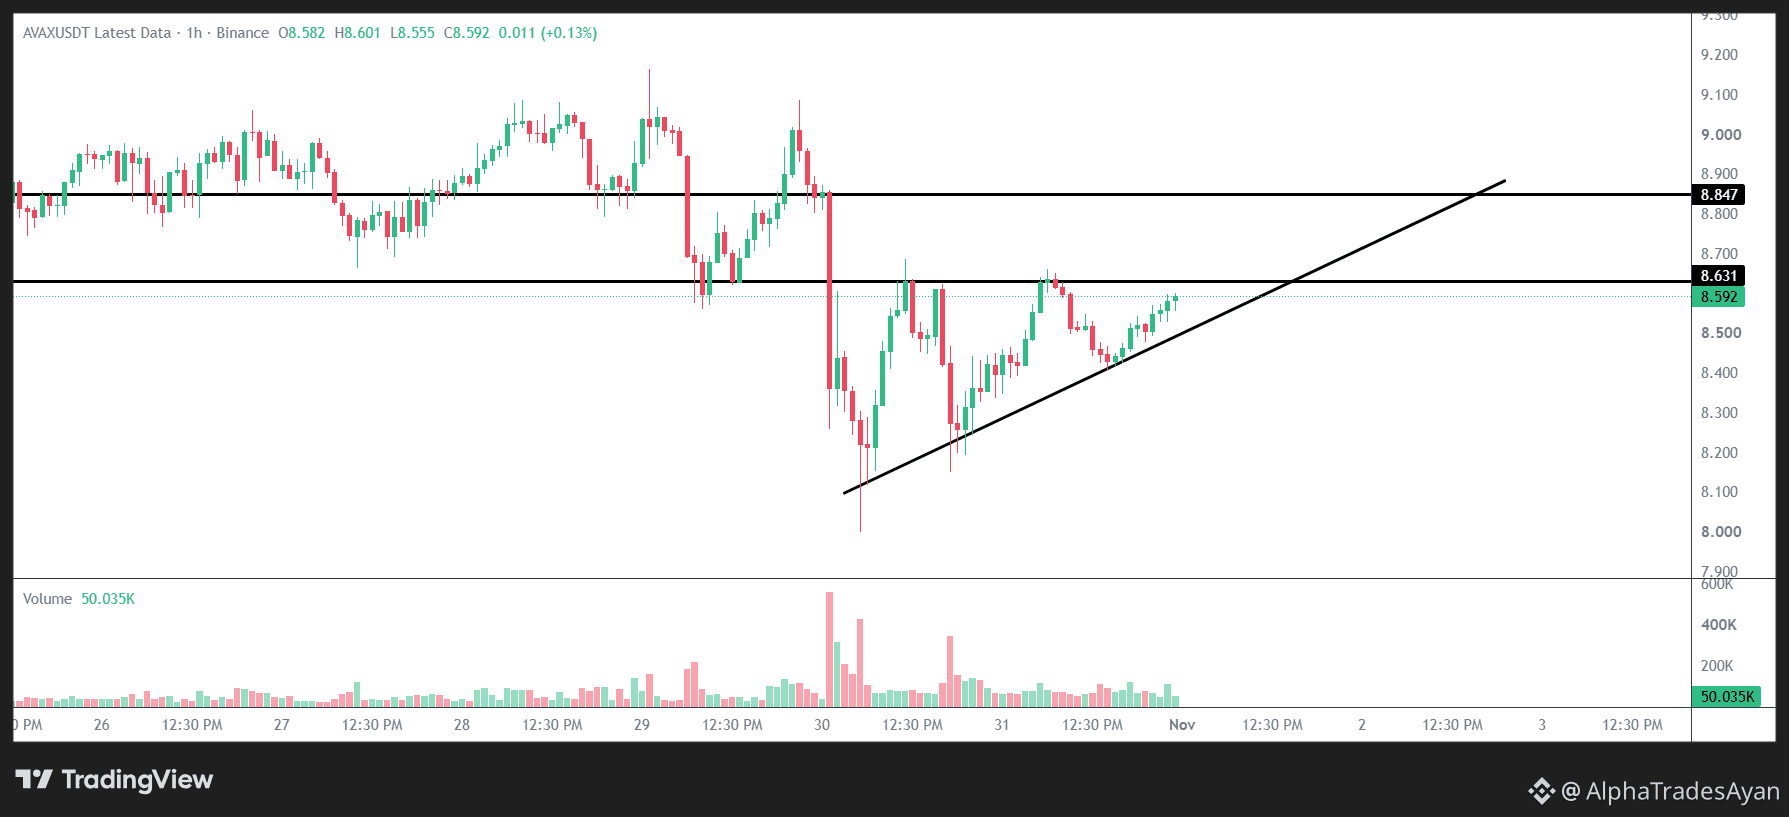
🚨 Tracking the exact price action structure on the $AVAX 1H chart.
Price is currently compressing within a very tight structural zone. We can see a clear ascending trendline providing dynamic support from below, while the price is repeatedly testing the horizontal boundary at 8.631.
Here are the exact price action levels I am observing on this timeframe:
🚧 Immediate Resistance (Pivot): 8.631
🛑 Major Ceiling: 8.847
📈 Dynamic Support: Ascending Trendline
$AVAX
{future}(AVAXUSDT)
I am not front-running any moves here. Just keeping a close watch on how the price reacts as it gets squeezed between this trendline and the 8.631 resistance. A clean 1H candle close outside this compression zone will provide more clarity on the next structural shift.
Let's observe how the market respects these critical boundaries. 👇
NFA | DYOR
🚨 Tracking the exact price action structure on the $AVAX 1H chart.
Price is currently compressing within a very tight structural zone. We can see a clear ascending trendline providing dynamic support from below, while the price is repeatedly testing the horizontal boundary at 8.631.
Here are the exact price action levels I am observing on this timeframe:
🚧 Immediate Resistance (Pivot): 8.631
🛑 Major Ceiling: 8.847
📈 Dynamic Support: Ascending Trendline
$AVAX
I am not front-running any moves here. Just keeping a close watch on how the price reacts as it gets squeezed between this trendline and the 8.631 resistance. A clean 1H candle close outside this compression zone will provide more clarity on the next structural shift.
Let's observe how the market respects these critical boundaries. 👇
NFA | DYOR
Price is currently compressing within a very tight structural zone. We can see a clear ascending trendline providing dynamic support from below, while the price is repeatedly testing the horizontal boundary at 8.631.
Here are the exact price action levels I am observing on this timeframe:
🚧 Immediate Resistance (Pivot): 8.631
🛑 Major Ceiling: 8.847
📈 Dynamic Support: Ascending Trendline
$AVAX
I am not front-running any moves here. Just keeping a close watch on how the price reacts as it gets squeezed between this trendline and the 8.631 resistance. A clean 1H candle close outside this compression zone will provide more clarity on the next structural shift.
Let's observe how the market respects these critical boundaries. 👇
NFA | DYOR
1
1
190
Tarjimani ko‘rish
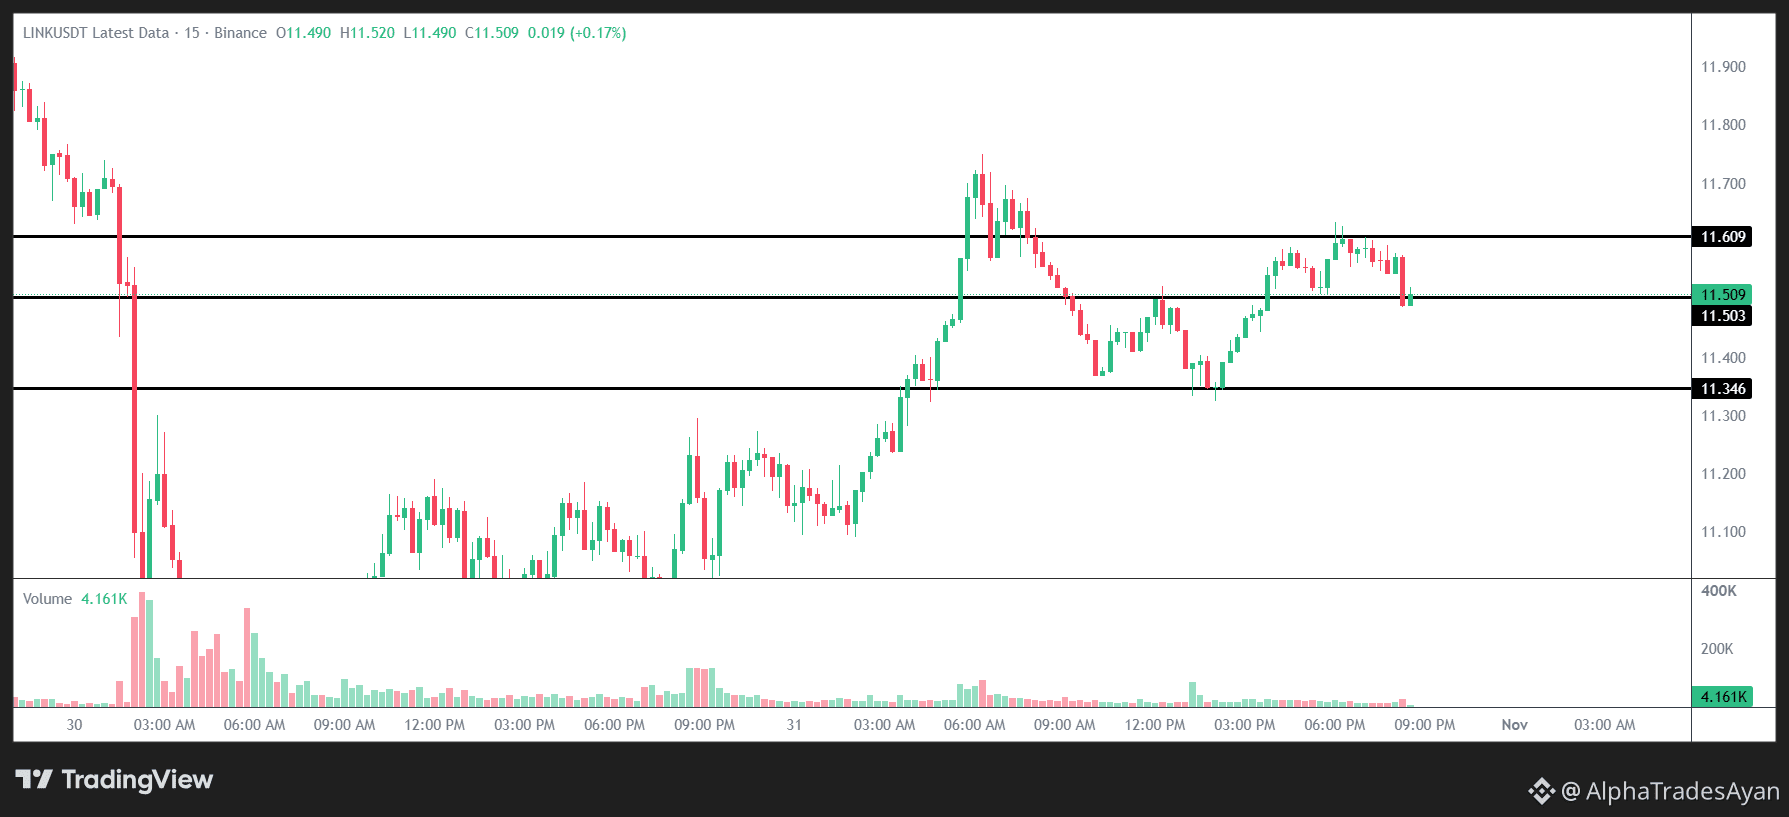
🚨 Tracking the current structure on the $LINK 15m chart.
Price action is currently consolidating within a very defined box. Here are the exact structural boundaries I am observing:
🚧 Resistance (Ceiling): 11.609
📉 Current Support (Floor): 11.503
⚠️ Lower Zone: 11.346
$LINK
{future}(LINKUSDT)
I am keeping a close watch on how the price reacts around the 11.503 pivot. I'm not rushing any decisions, just carefully observing the volume at these key levels to see how the market develops.
What are your thoughts on this setup? Let me know below! 👇
NFA | DYOR
🚨 Tracking the current structure on the $LINK 15m chart.
Price action is currently consolidating within a very defined box. Here are the exact structural boundaries I am observing:
🚧 Resistance (Ceiling): 11.609
📉 Current Support (Floor): 11.503
⚠️ Lower Zone: 11.346
$LINK
I am keeping a close watch on how the price reacts around the 11.503 pivot. I'm not rushing any decisions, just carefully observing the volume at these key levels to see how the market develops.
What are your thoughts on this setup? Let me know below! 👇
NFA | DYOR
Price action is currently consolidating within a very defined box. Here are the exact structural boundaries I am observing:
🚧 Resistance (Ceiling): 11.609
📉 Current Support (Floor): 11.503
⚠️ Lower Zone: 11.346
$LINK
I am keeping a close watch on how the price reacts around the 11.503 pivot. I'm not rushing any decisions, just carefully observing the volume at these key levels to see how the market develops.
What are your thoughts on this setup? Let me know below! 👇
NFA | DYOR
1
1
164
Tarjimani ko‘rish
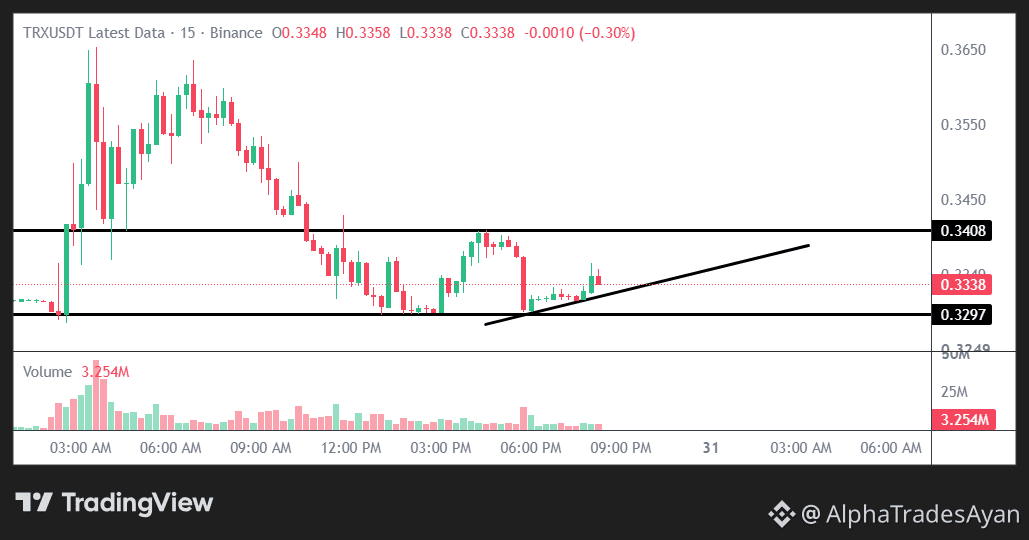
The compression on this $TRX 15m chart is reaching an absolute breaking point right now.
We are wedged right between a heavy ceiling at 0.3408 and a solid floor at 0.3297. The volume profile is completely fading out, which usually indicates that a sharp volatility spike is loading up very soon.
$TRX
{future}(TRXUSDT)
Patience is the real edge here. I am keeping my alerts on and strictly waiting for the market to choose a definitive side before reacting. If the 0.3297 baseline breaks, it completely shifts the local structure.
Let's watch how this next candle plays out and who steps up with the real volume. 👇
NFA | DYOR
The compression on this $TRX 15m chart is reaching an absolute breaking point right now.
We are wedged right between a heavy ceiling at 0.3408 and a solid floor at 0.3297. The volume profile is completely fading out, which usually indicates that a sharp volatility spike is loading up very soon.
$TRX
Patience is the real edge here. I am keeping my alerts on and strictly waiting for the market to choose a definitive side before reacting. If the 0.3297 baseline breaks, it completely shifts the local structure.
Let's watch how this next candle plays out and who steps up with the real volume. 👇
NFA | DYOR
We are wedged right between a heavy ceiling at 0.3408 and a solid floor at 0.3297. The volume profile is completely fading out, which usually indicates that a sharp volatility spike is loading up very soon.
$TRX
Patience is the real edge here. I am keeping my alerts on and strictly waiting for the market to choose a definitive side before reacting. If the 0.3297 baseline breaks, it completely shifts the local structure.
Let's watch how this next candle plays out and who steps up with the real volume. 👇
NFA | DYOR
1
1
104
·
--
Pasayuvchi
Tarjimani ko‘rish
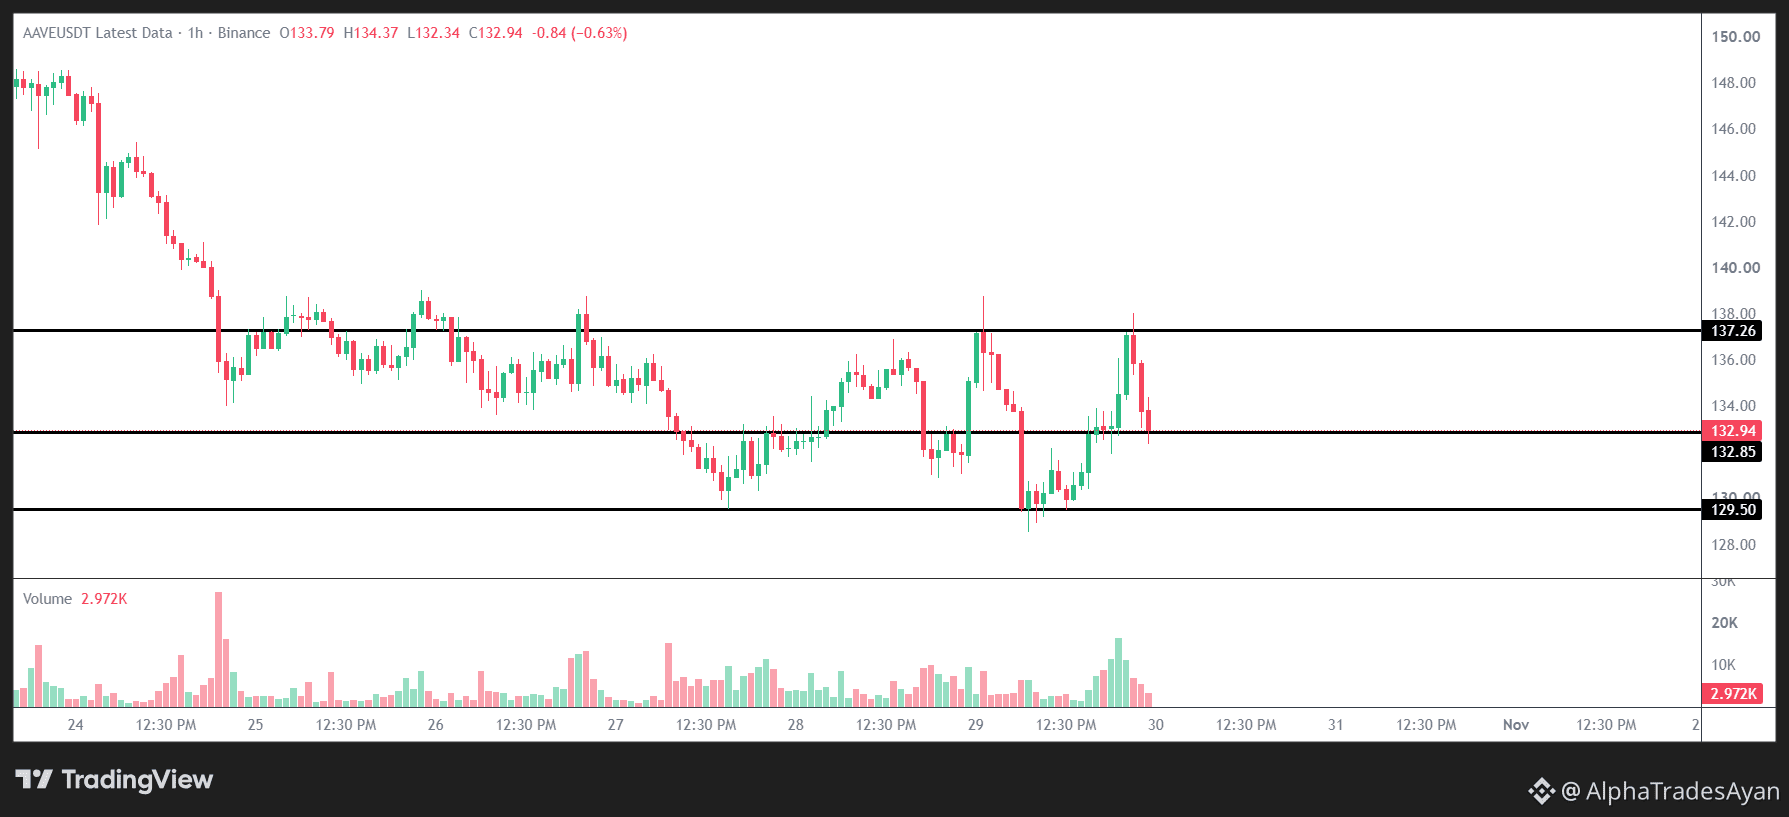
🚨 The $AAVE 1H chart is testing one of the most critical structural boundaries right now.
We are tracking a massive consolidation range here. Price faced a heavy rejection at the 137.26 ceiling and has aggressively pulled back to rest directly on the mid-range pivot at 132.85. The way volume shifts around this exact floor will dictate the next major swing.
$AAVE
{future}(AAVEUSDT)
If this pivot holds strong, the upper resistance zone is fully back on the table. However, a clean breakdown below this line opens up the trapdoor straight toward the 129.50 deep support.
Just mapping out the battlefield and waiting for the 1H candle to make the final decision. Let's see who takes control of this momentum. 👇
NFA | DYOR
🚨 The $AAVE 1H chart is testing one of the most critical structural boundaries right now.
We are tracking a massive consolidation range here. Price faced a heavy rejection at the 137.26 ceiling and has aggressively pulled back to rest directly on the mid-range pivot at 132.85. The way volume shifts around this exact floor will dictate the next major swing.
$AAVE
If this pivot holds strong, the upper resistance zone is fully back on the table. However, a clean breakdown below this line opens up the trapdoor straight toward the 129.50 deep support.
Just mapping out the battlefield and waiting for the 1H candle to make the final decision. Let's see who takes control of this momentum. 👇
NFA | DYOR
We are tracking a massive consolidation range here. Price faced a heavy rejection at the 137.26 ceiling and has aggressively pulled back to rest directly on the mid-range pivot at 132.85. The way volume shifts around this exact floor will dictate the next major swing.
$AAVE
If this pivot holds strong, the upper resistance zone is fully back on the table. However, a clean breakdown below this line opens up the trapdoor straight toward the 129.50 deep support.
Just mapping out the battlefield and waiting for the 1H candle to make the final decision. Let's see who takes control of this momentum. 👇
NFA | DYOR
1
1
97
Tarjimani ko‘rish
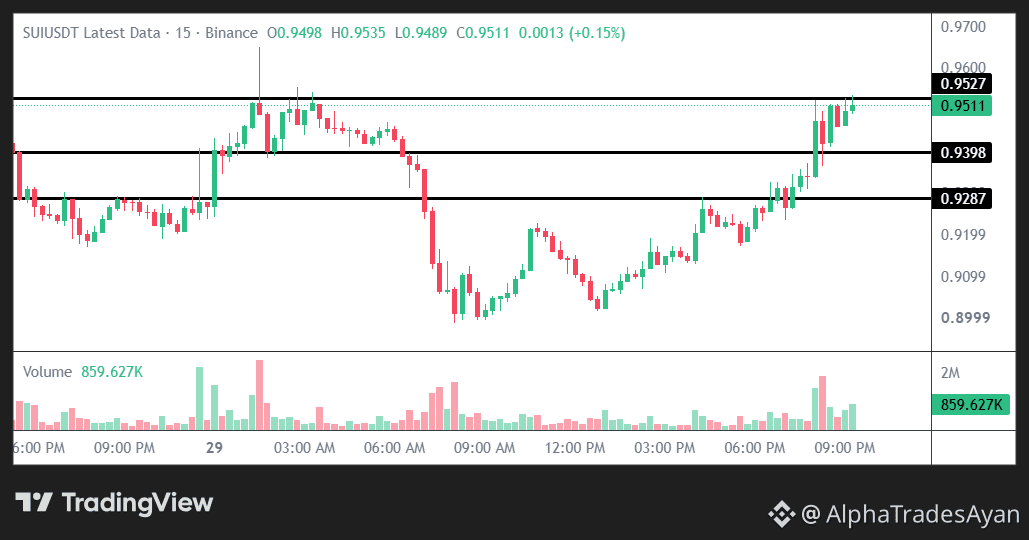
🚨 The tension on this $SUI 15m chart is getting impossible to ignore. 👀
Price is currently sitting at 0.9511, right below a critical resistance zone.
Ceiling: 0.9527
Support: 0.9398, then 0.9287
Momentum is building, but the real test is happening right at this boundary.
$SUI
{future}(SUIUSDT)
If the volume holds up and it clears 0.9527, things could get very interesting. If it gets rejected, I'm watching 0.9398 as the first floor. Not rushing into any positions, just letting the market show its hand first.
Let's see which side takes full control of this setup. 👇
NFA | DYOR
🚨 The tension on this $SUI 15m chart is getting impossible to ignore. 👀
Price is currently sitting at 0.9511, right below a critical resistance zone.
Ceiling: 0.9527
Support: 0.9398, then 0.9287
Momentum is building, but the real test is happening right at this boundary.
$SUI
If the volume holds up and it clears 0.9527, things could get very interesting. If it gets rejected, I'm watching 0.9398 as the first floor. Not rushing into any positions, just letting the market show its hand first.
Let's see which side takes full control of this setup. 👇
NFA | DYOR
Price is currently sitting at 0.9511, right below a critical resistance zone.
Ceiling: 0.9527
Support: 0.9398, then 0.9287
Momentum is building, but the real test is happening right at this boundary.
$SUI
If the volume holds up and it clears 0.9527, things could get very interesting. If it gets rejected, I'm watching 0.9398 as the first floor. Not rushing into any positions, just letting the market show its hand first.
Let's see which side takes full control of this setup. 👇
NFA | DYOR
1
1
193
Tarjimani ko‘rish
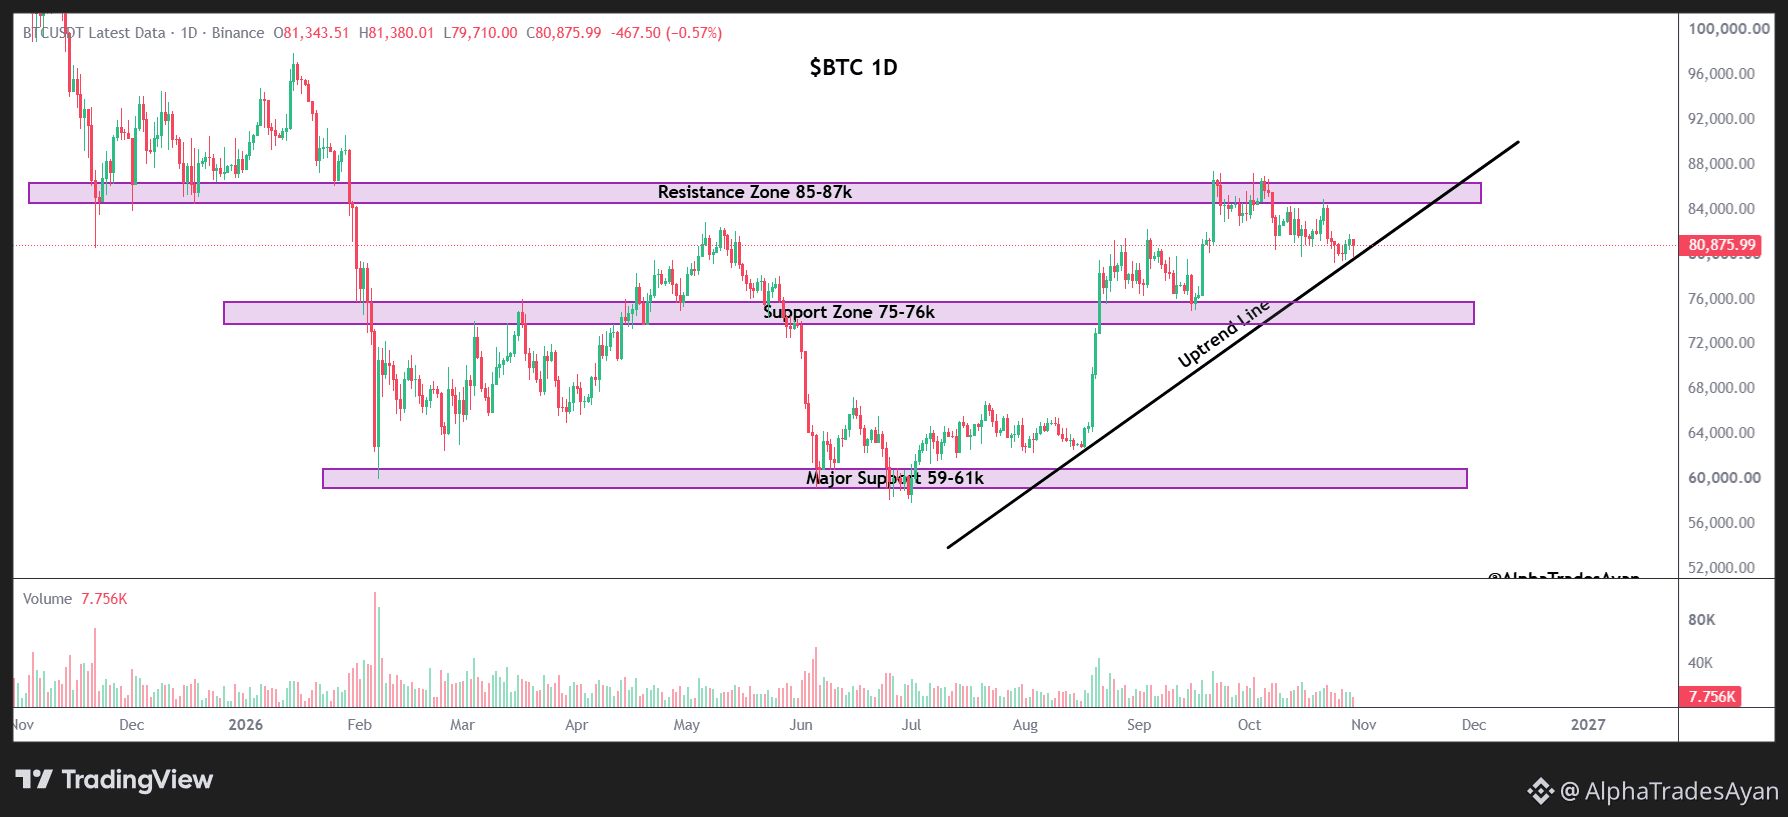
$BTC 1D: sitting right on the trendline
BTC at 80.4k, and the daily is on a decision line.
Ceiling: 85-87k
Support: 75-76k, then 59-61k
Uptrend line is holding for now, volume is fading
$BTC
{future}(BTCUSDT)
If the line holds, 85k comes back into play. If we get a daily close below it, I’m watching 75-76k. Not calling a direction, just waiting for the close.
Where’s your invalidation on BTC? NFA, just my notes.
$BTC 1D: sitting right on the trendline
BTC at 80.4k, and the daily is on a decision line.
Ceiling: 85-87k
Support: 75-76k, then 59-61k
Uptrend line is holding for now, volume is fading
$BTC
If the line holds, 85k comes back into play. If we get a daily close below it, I’m watching 75-76k. Not calling a direction, just waiting for the close.
Where’s your invalidation on BTC? NFA, just my notes.
BTC at 80.4k, and the daily is on a decision line.
Ceiling: 85-87k
Support: 75-76k, then 59-61k
Uptrend line is holding for now, volume is fading
$BTC
If the line holds, 85k comes back into play. If we get a daily close below it, I’m watching 75-76k. Not calling a direction, just waiting for the close.
Where’s your invalidation on BTC? NFA, just my notes.
1
1
197
Tarjimani ko‘rish
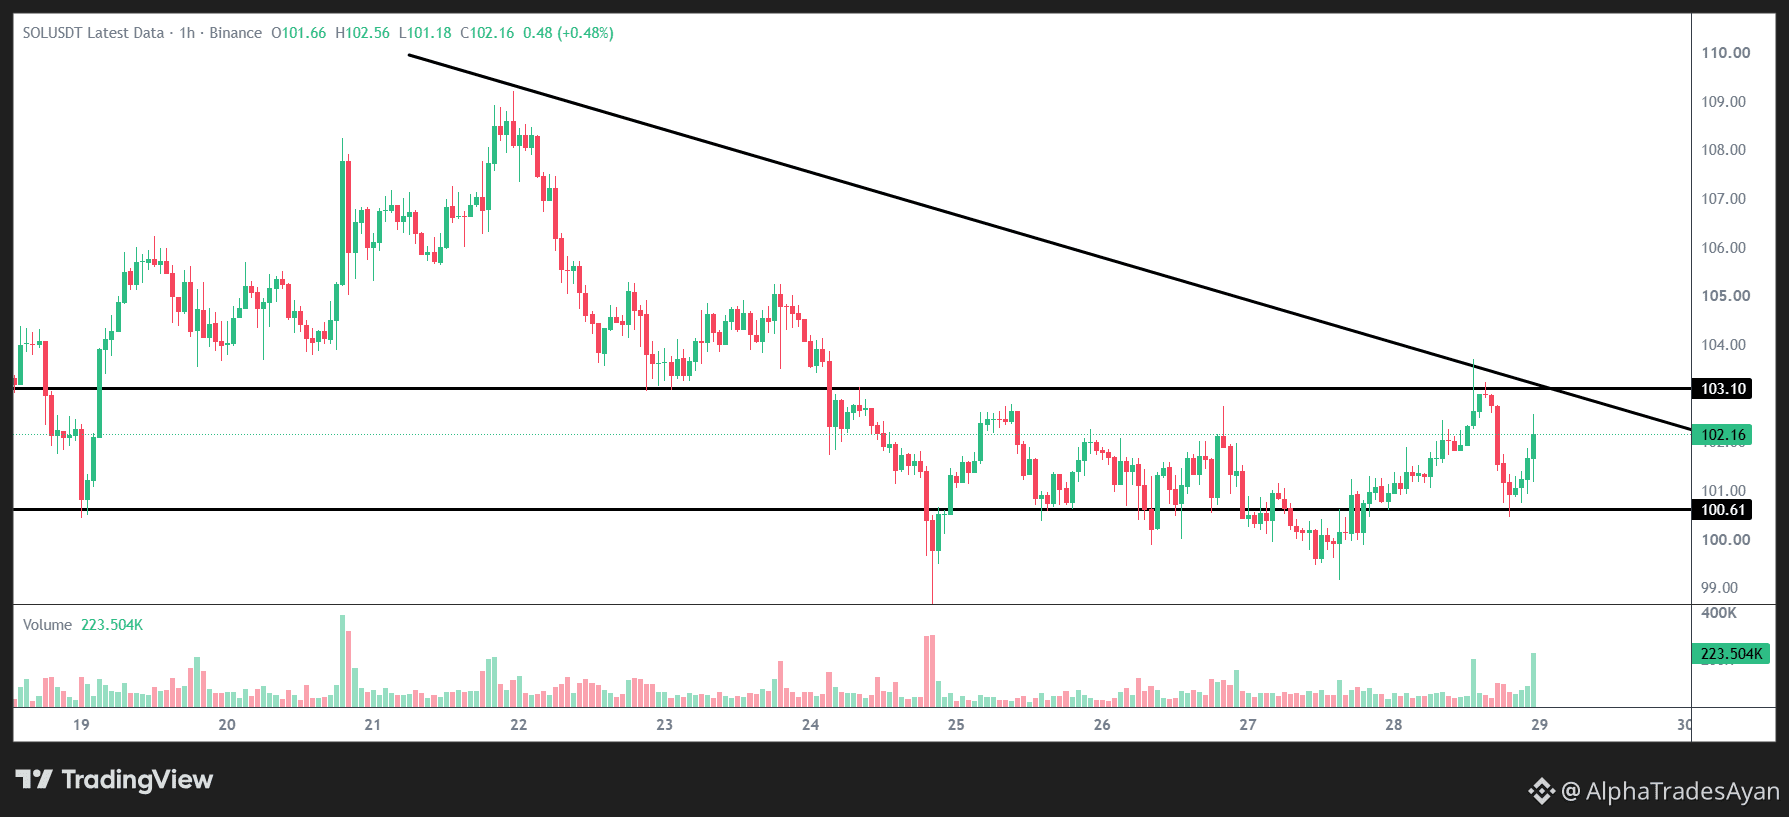
SOL 1H – pressing against the trendline again
SOL is at 102.16 and honestly the chart looks a lot like where we were a few days ago: a range with a falling trendline sitting on top.
What I’m watching:
103.10 is the level that matters. It lines up with the descending trendline from the 22nd high, so there’s double resistance right there. Price poked above it yesterday and got pushed back.
$SOL
{future}(SOLUSDT)
100.61 is the floor for now. It held again last night and the bounce was quick. It also caught the dips on the 19th and the 27th.
The last candle came with a decent volume bump, which is nice to see. But one candle doesn’t confirm anything for me.
My plan is simple: I’d want a proper hourly close above 103.10 and the trendline before considering any move. If 100.61 gives way, I’d be careful, because the next area is the 99 wick from the 27th.
Could be a breakout, could be another fake-out. Waiting for the candle to close.
How are you reading SOL here?
NFA, just my notes.
SOL 1H – pressing against the trendline again
SOL is at 102.16 and honestly the chart looks a lot like where we were a few days ago: a range with a falling trendline sitting on top.
What I’m watching:
103.10 is the level that matters. It lines up with the descending trendline from the 22nd high, so there’s double resistance right there. Price poked above it yesterday and got pushed back.
$SOL
100.61 is the floor for now. It held again last night and the bounce was quick. It also caught the dips on the 19th and the 27th.
The last candle came with a decent volume bump, which is nice to see. But one candle doesn’t confirm anything for me.
My plan is simple: I’d want a proper hourly close above 103.10 and the trendline before considering any move. If 100.61 gives way, I’d be careful, because the next area is the 99 wick from the 27th.
Could be a breakout, could be another fake-out. Waiting for the candle to close.
How are you reading SOL here?
NFA, just my notes.
SOL is at 102.16 and honestly the chart looks a lot like where we were a few days ago: a range with a falling trendline sitting on top.
What I’m watching:
103.10 is the level that matters. It lines up with the descending trendline from the 22nd high, so there’s double resistance right there. Price poked above it yesterday and got pushed back.
$SOL
100.61 is the floor for now. It held again last night and the bounce was quick. It also caught the dips on the 19th and the 27th.
The last candle came with a decent volume bump, which is nice to see. But one candle doesn’t confirm anything for me.
My plan is simple: I’d want a proper hourly close above 103.10 and the trendline before considering any move. If 100.61 gives way, I’d be careful, because the next area is the 99 wick from the 27th.
Could be a breakout, could be another fake-out. Waiting for the candle to close.
How are you reading SOL here?
NFA, just my notes.
1
1
249
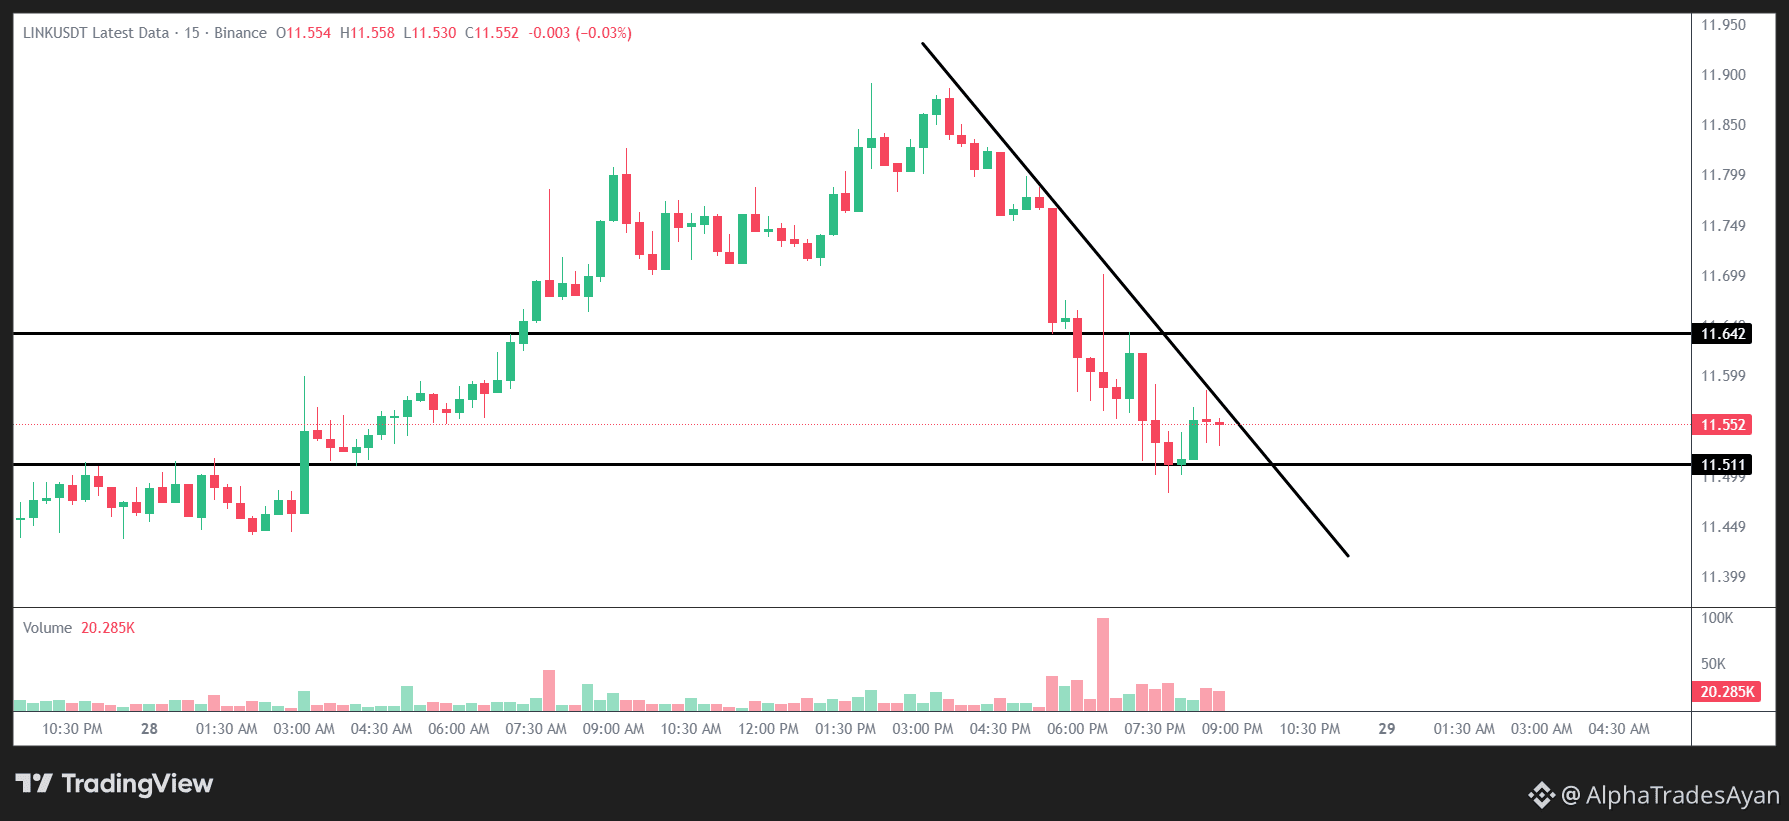
Aktiv: LINK
⏱️ Vaqt oralig‘i: 15m
📉 Joriy holat: Kuchli siqilish shakllanmoqda.
Qisqacha fikrlar:
Narx muhim qo‘llab-quvvatlash zonasining tepasida qotib qolgan va keskin pasayuvchi trend chizig‘i bosimi ostida. Narx harakati shu qadar tor diapazonga siqilganda, odatda hajm tezda oshadi.
Aynan shu diapazon uchun ogohlantirishlarni sozlab qo‘ydim:
Yuqori chegara ➔ 11.642
Quyi chegara ➔ 11.511
$LINK
{future}(LINKUSDT)
Hozircha shoshilib savdoga kirmayman, avval bozor nima qilishini kuzataman.
Bugun bu vaziyatni kuzatyapsizmi? 👇
NFA | DYOR
Aktiv: LINK
⏱️ Vaqt oralig‘i: 15m
📉 Joriy holat: Kuchli siqilish shakllanmoqda.
Qisqacha fikrlar:
Narx muhim qo‘llab-quvvatlash zonasining tepasida qotib qolgan va keskin pasayuvchi trend chizig‘i bosimi ostida. Narx harakati shu qadar tor diapazonga siqilganda, odatda hajm tezda oshadi.
Aynan shu diapazon uchun ogohlantirishlarni sozlab qo‘ydim:
Yuqori chegara ➔ 11.642
Quyi chegara ➔ 11.511
$LINK
Hozircha shoshilib savdoga kirmayman, avval bozor nima qilishini kuzataman.
Bugun bu vaziyatni kuzatyapsizmi? 👇
NFA | DYOR
⏱️ Vaqt oralig‘i: 15m
📉 Joriy holat: Kuchli siqilish shakllanmoqda.
Qisqacha fikrlar:
Narx muhim qo‘llab-quvvatlash zonasining tepasida qotib qolgan va keskin pasayuvchi trend chizig‘i bosimi ostida. Narx harakati shu qadar tor diapazonga siqilganda, odatda hajm tezda oshadi.
Aynan shu diapazon uchun ogohlantirishlarni sozlab qo‘ydim:
Yuqori chegara ➔ 11.642
Quyi chegara ➔ 11.511
$LINK
Hozircha shoshilib savdoga kirmayman, avval bozor nima qilishini kuzataman.
Bugun bu vaziyatni kuzatyapsizmi? 👇
NFA | DYOR
1
1
179
Tarjimani ko‘rish
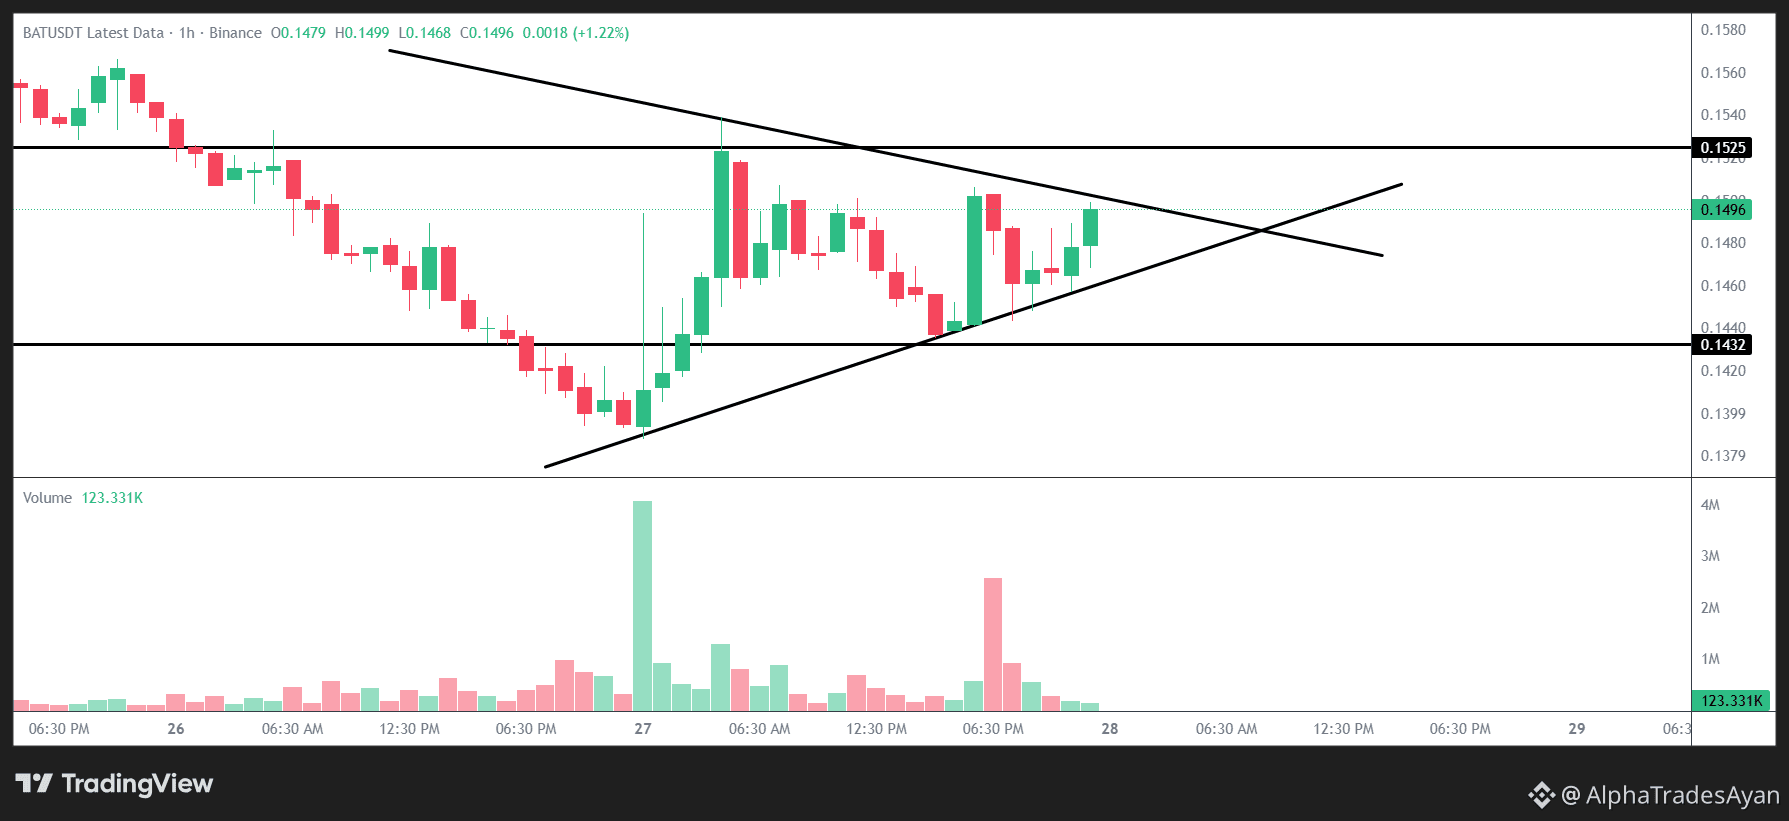
🚨 A massive squeeze is building up on the $BAT chart right now! 👀
We are looking at a classic symmetrical triangle setup. Price is getting tightly compressed between a descending resistance line and an ascending support base.
Rather than anticipating the move, I am strictly observing the volume as we get closer to the apex of this structure.
Key levels on my radar:
🎯 Major Resistance ➔ 0.1525
🛡️ Solid Support ➔ 0.1432
$BAT
{future}(BATUSDT)
A sharp move is loading up here. Let's see which side takes full control of this momentum. 👇
NFA | DYOR
🚨 A massive squeeze is building up on the $BAT chart right now! 👀
We are looking at a classic symmetrical triangle setup. Price is getting tightly compressed between a descending resistance line and an ascending support base.
Rather than anticipating the move, I am strictly observing the volume as we get closer to the apex of this structure.
Key levels on my radar:
🎯 Major Resistance ➔ 0.1525
🛡️ Solid Support ➔ 0.1432
$BAT
A sharp move is loading up here. Let's see which side takes full control of this momentum. 👇
NFA | DYOR
We are looking at a classic symmetrical triangle setup. Price is getting tightly compressed between a descending resistance line and an ascending support base.
Rather than anticipating the move, I am strictly observing the volume as we get closer to the apex of this structure.
Key levels on my radar:
🎯 Major Resistance ➔ 0.1525
🛡️ Solid Support ➔ 0.1432
$BAT
A sharp move is loading up here. Let's see which side takes full control of this momentum. 👇
NFA | DYOR
1
1
308
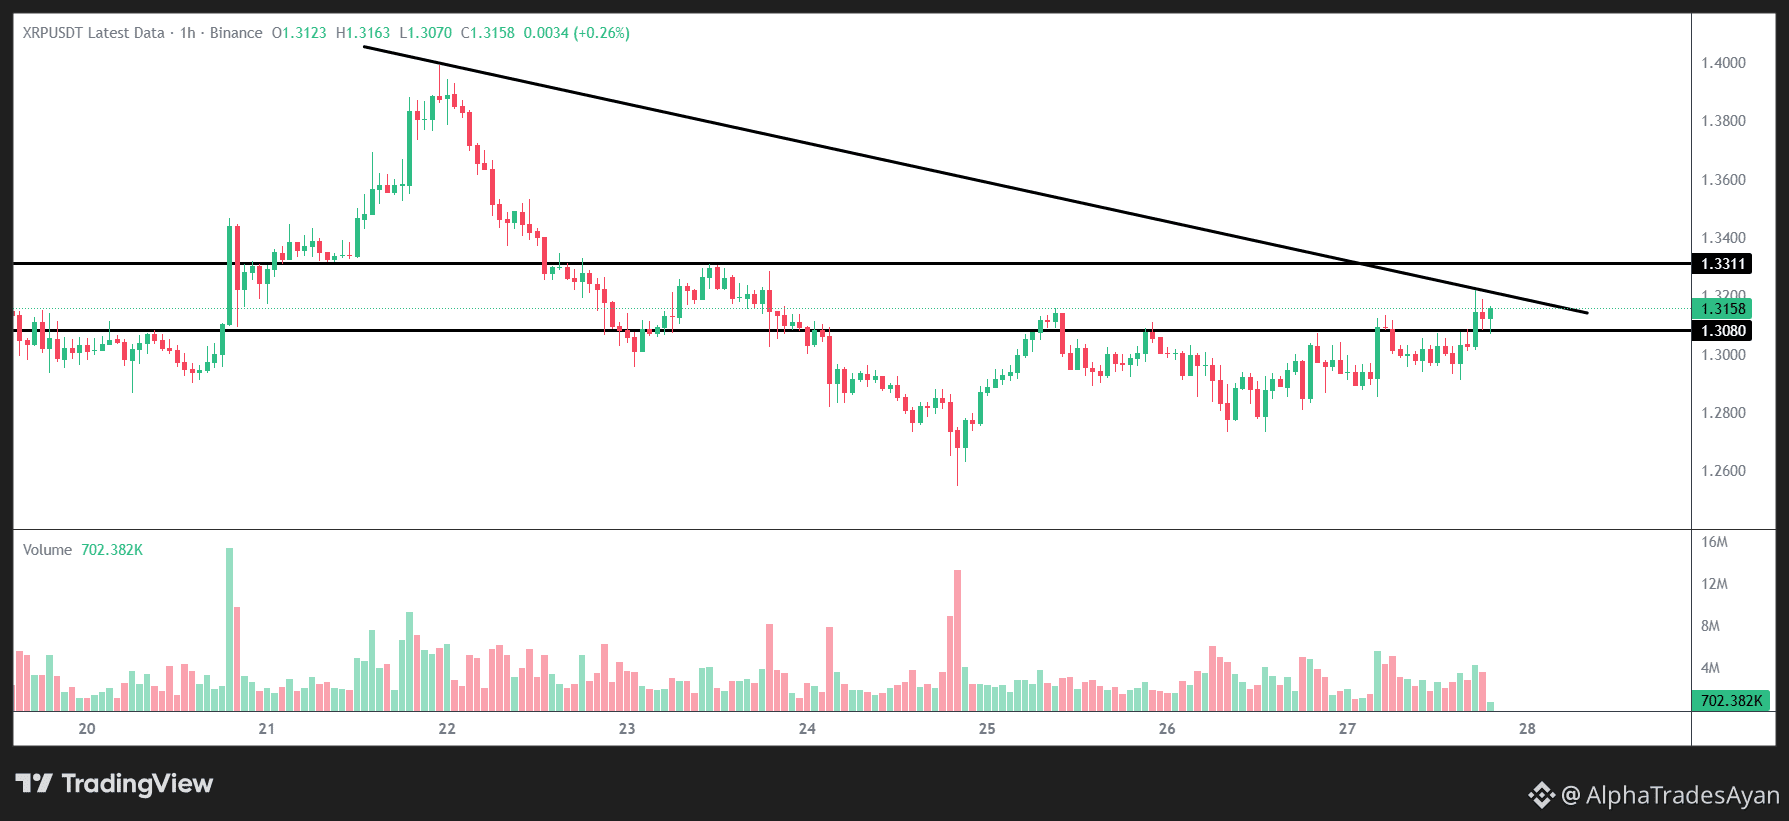
Bugun $XRP 1H grafik tuzilishini tahlil qilamiz. 📊
Klassik pasayuvchi uchburchak shakllanishini ko‘rib turibmiz. Narx yuqoridan pastga yo‘nalgan trend chizig‘i va tekis gorizontal tayanch oralig‘ida tobora siqilmoqda.
Hozircha savdo hajmi nisbatan sokin, shuning uchun bozor ushbu chegaralarda qanday munosabat bildirishini sabr bilan kuzatyapman.
Kuzatuvimdagi muhim darajalar:
🎯 Asosiy qarshilik ➔ 1.3311
🛡️ Mustahkam tayanch ➔ 1.3080
$XRP
{future}(XRPUSDT)
Sizlar hozirgi vaziyatni qanday baholayapsiz? Fikrlaringizni quyida yozib qoldiring! 👇
NFA | DYOR
Bugun $XRP 1H grafik tuzilishini tahlil qilamiz. 📊
Klassik pasayuvchi uchburchak shakllanishini ko‘rib turibmiz. Narx yuqoridan pastga yo‘nalgan trend chizig‘i va tekis gorizontal tayanch oralig‘ida tobora siqilmoqda.
Hozircha savdo hajmi nisbatan sokin, shuning uchun bozor ushbu chegaralarda qanday munosabat bildirishini sabr bilan kuzatyapman.
Kuzatuvimdagi muhim darajalar:
🎯 Asosiy qarshilik ➔ 1.3311
🛡️ Mustahkam tayanch ➔ 1.3080
$XRP
Sizlar hozirgi vaziyatni qanday baholayapsiz? Fikrlaringizni quyida yozib qoldiring! 👇
NFA | DYOR
Klassik pasayuvchi uchburchak shakllanishini ko‘rib turibmiz. Narx yuqoridan pastga yo‘nalgan trend chizig‘i va tekis gorizontal tayanch oralig‘ida tobora siqilmoqda.
Hozircha savdo hajmi nisbatan sokin, shuning uchun bozor ushbu chegaralarda qanday munosabat bildirishini sabr bilan kuzatyapman.
Kuzatuvimdagi muhim darajalar:
🎯 Asosiy qarshilik ➔ 1.3311
🛡️ Mustahkam tayanch ➔ 1.3080
$XRP
Sizlar hozirgi vaziyatni qanday baholayapsiz? Fikrlaringizni quyida yozib qoldiring! 👇
NFA | DYOR
8
3
1.4k
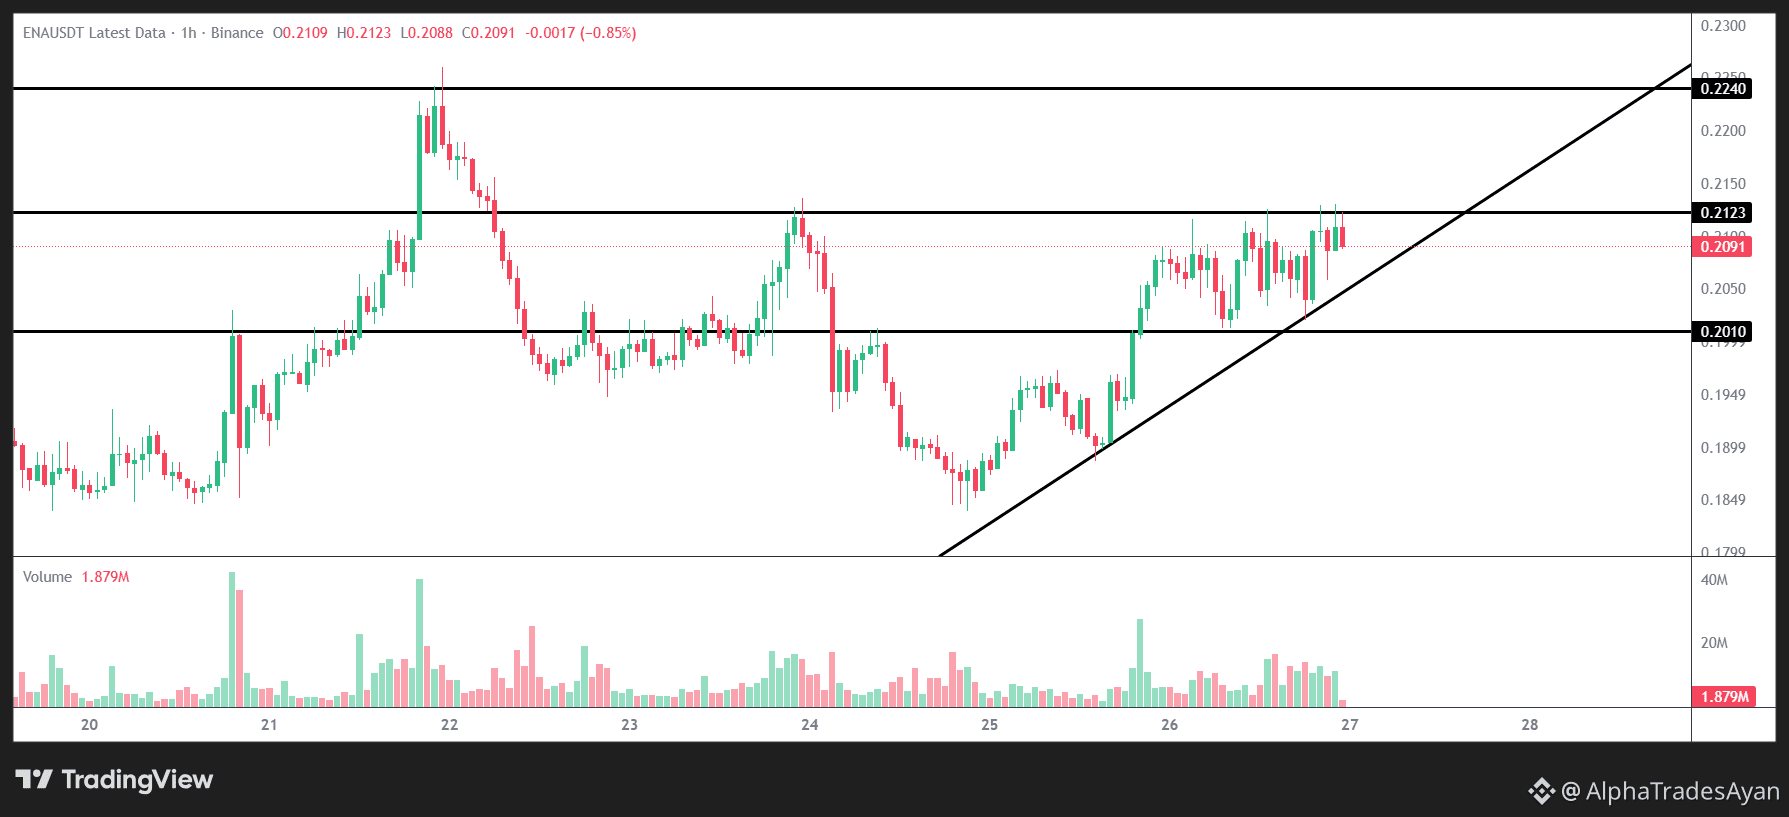
$ENA bugun kuzatishimiz uchun juda aniq grafik taqdim etmoqda. 👀
Narx ko‘tariluvchi trend chizig‘i bo‘ylab asta-sekin yuqorilab bormoqda va yana 0.2123 qarshilik darajasini sinab ko‘rishga tayyorlanayotganga o‘xshaydi. Bu hududdagi savdo hajmi qanday o‘zgarishini diqqat bilan kuzatyapman. Agar impuls susayib, trend chizig‘i buzilsa, pastroqda 0.2010 mustahkam tayanch darajasi kutib turibdi.
$ENA
{future}(ENAUSDT)
Hech narsaga shoshilmayapman — shamlar nima deyishini kuzatyapman va bozor o‘z yo‘nalishini ko‘rsatishini kutyapman.
Hozir ENA tuzilmasini faol kuzatyapsizmi yoki bugun kechqurun e’tiboringiz boshqa altkoinlardami? Quyida izohlarda yozib qoldiring! 👇
Moliyaviy maslahat emas | O‘zingiz izlaning
$ENA bugun kuzatishimiz uchun juda aniq grafik taqdim etmoqda. 👀
Narx ko‘tariluvchi trend chizig‘i bo‘ylab asta-sekin yuqorilab bormoqda va yana 0.2123 qarshilik darajasini sinab ko‘rishga tayyorlanayotganga o‘xshaydi. Bu hududdagi savdo hajmi qanday o‘zgarishini diqqat bilan kuzatyapman. Agar impuls susayib, trend chizig‘i buzilsa, pastroqda 0.2010 mustahkam tayanch darajasi kutib turibdi.
$ENA
Hech narsaga shoshilmayapman — shamlar nima deyishini kuzatyapman va bozor o‘z yo‘nalishini ko‘rsatishini kutyapman.
Hozir ENA tuzilmasini faol kuzatyapsizmi yoki bugun kechqurun e’tiboringiz boshqa altkoinlardami? Quyida izohlarda yozib qoldiring! 👇
Moliyaviy maslahat emas | O‘zingiz izlaning
Narx ko‘tariluvchi trend chizig‘i bo‘ylab asta-sekin yuqorilab bormoqda va yana 0.2123 qarshilik darajasini sinab ko‘rishga tayyorlanayotganga o‘xshaydi. Bu hududdagi savdo hajmi qanday o‘zgarishini diqqat bilan kuzatyapman. Agar impuls susayib, trend chizig‘i buzilsa, pastroqda 0.2010 mustahkam tayanch darajasi kutib turibdi.
$ENA
Hech narsaga shoshilmayapman — shamlar nima deyishini kuzatyapman va bozor o‘z yo‘nalishini ko‘rsatishini kutyapman.
Hozir ENA tuzilmasini faol kuzatyapsizmi yoki bugun kechqurun e’tiboringiz boshqa altkoinlardami? Quyida izohlarda yozib qoldiring! 👇
Moliyaviy maslahat emas | O‘zingiz izlaning
1
1
482
Tarjimani ko‘rish
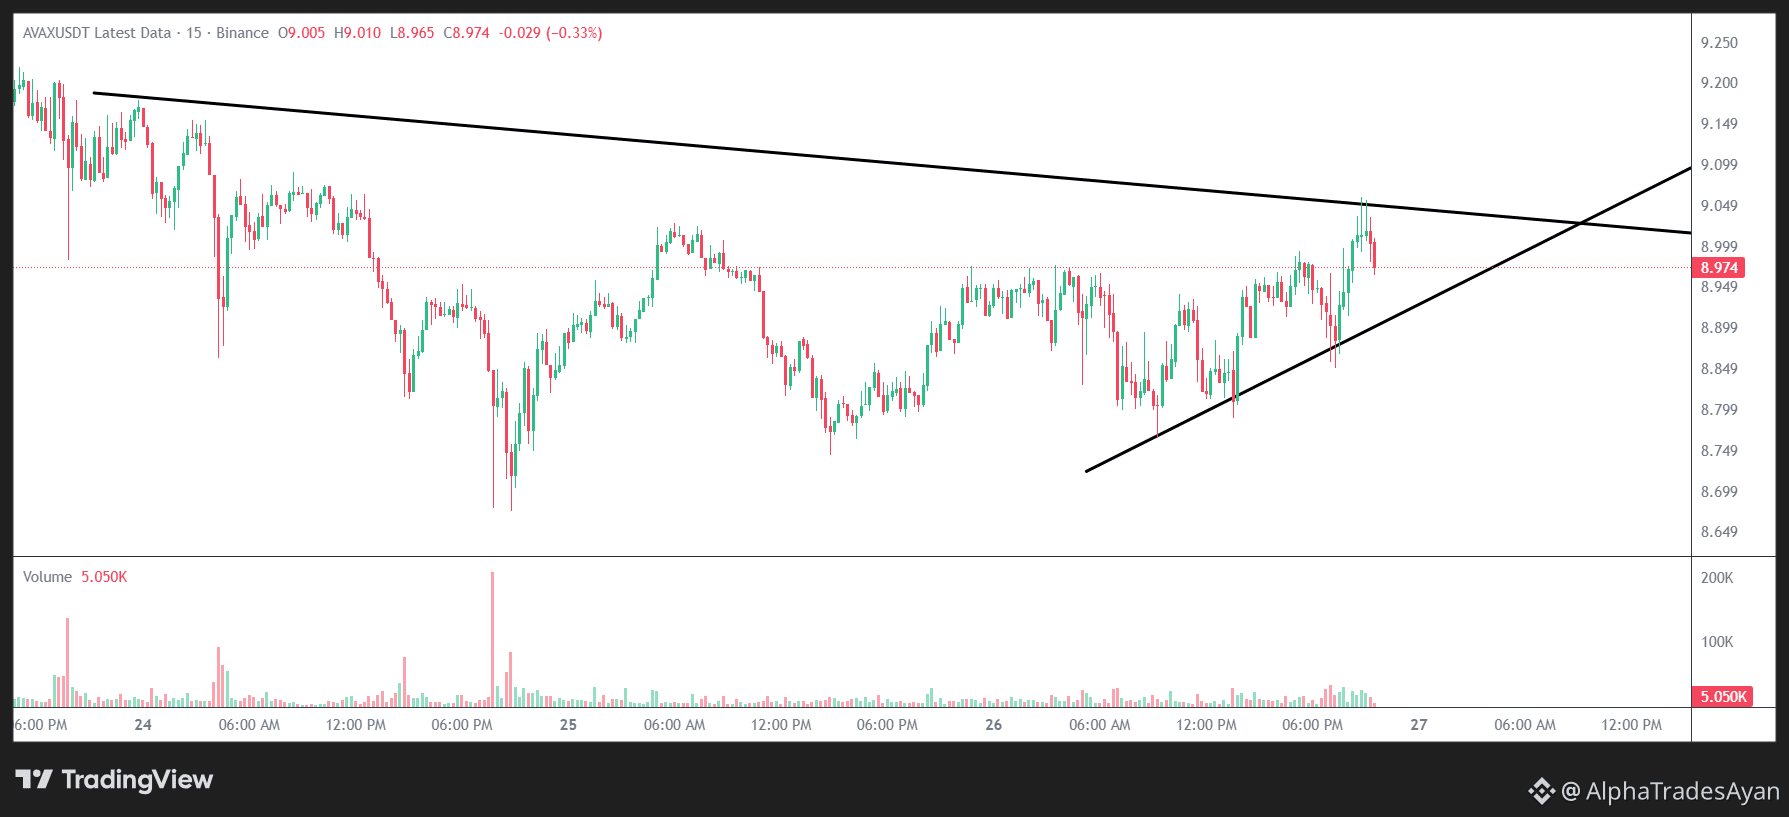
🚨 Love the technical structure forming on $AVAX right now. 📊
We are looking at a classic compression between a heavy descending trendline and a solid support base. Rather than guessing the next move early, I am just observing how the volume reacts as we get closer to the apex.
Key levels on my radar:
🎯 Major Resistance ➔ 9.049
🛡️ Solid Support ➔ 8.900
$AVAX
{future}(AVAXUSDT)
BULLISH 🟢 or BEARISH 🔴?
Drop your emoji in the comments below! 👇
NFA | DYOR
🚨 Love the technical structure forming on $AVAX right now. 📊
We are looking at a classic compression between a heavy descending trendline and a solid support base. Rather than guessing the next move early, I am just observing how the volume reacts as we get closer to the apex.
Key levels on my radar:
🎯 Major Resistance ➔ 9.049
🛡️ Solid Support ➔ 8.900
$AVAX
BULLISH 🟢 or BEARISH 🔴?
Drop your emoji in the comments below! 👇
NFA | DYOR
We are looking at a classic compression between a heavy descending trendline and a solid support base. Rather than guessing the next move early, I am just observing how the volume reacts as we get closer to the apex.
Key levels on my radar:
🎯 Major Resistance ➔ 9.049
🛡️ Solid Support ➔ 8.900
$AVAX
BULLISH 🟢 or BEARISH 🔴?
Drop your emoji in the comments below! 👇
NFA | DYOR
1
1
135
Tarjimani ko‘rish
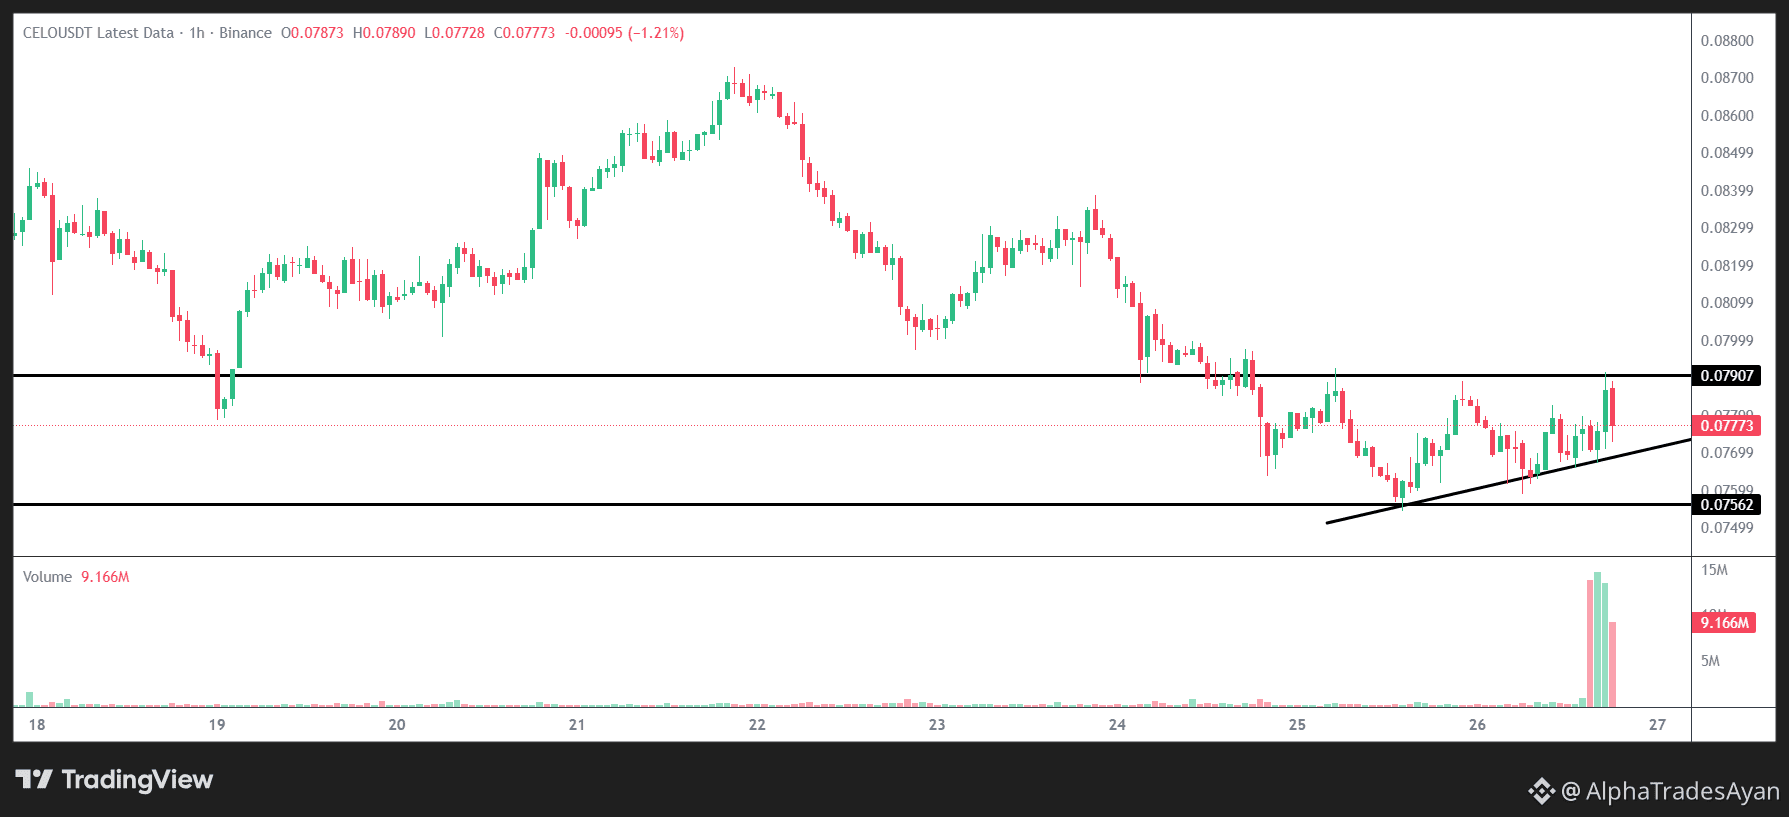
$CELO is printing a beautifully tight structure on the 1H chart right now. 👀
Look at that massive volume spike coming in as the price rides this ascending trendline. We are seeing a perfect squeeze between the lower support base and the overhead ceiling. I am just sitting back and observing how the market handles this heavy volume compression.
Key levels on my radar:
🎯 Major Resistance ➔ 0.07907
🛡️ Solid Support ➔ 0.07562
$CELO
{future}(CELOUSDT)
A sharp move is loading up here. Let's see which side takes full control of this momentum. 👇
NFA | DYOR
$CELO is printing a beautifully tight structure on the 1H chart right now. 👀
Look at that massive volume spike coming in as the price rides this ascending trendline. We are seeing a perfect squeeze between the lower support base and the overhead ceiling. I am just sitting back and observing how the market handles this heavy volume compression.
Key levels on my radar:
🎯 Major Resistance ➔ 0.07907
🛡️ Solid Support ➔ 0.07562
$CELO
A sharp move is loading up here. Let's see which side takes full control of this momentum. 👇
NFA | DYOR
Look at that massive volume spike coming in as the price rides this ascending trendline. We are seeing a perfect squeeze between the lower support base and the overhead ceiling. I am just sitting back and observing how the market handles this heavy volume compression.
Key levels on my radar:
🎯 Major Resistance ➔ 0.07907
🛡️ Solid Support ➔ 0.07562
$CELO
A sharp move is loading up here. Let's see which side takes full control of this momentum. 👇
NFA | DYOR
1
1
215
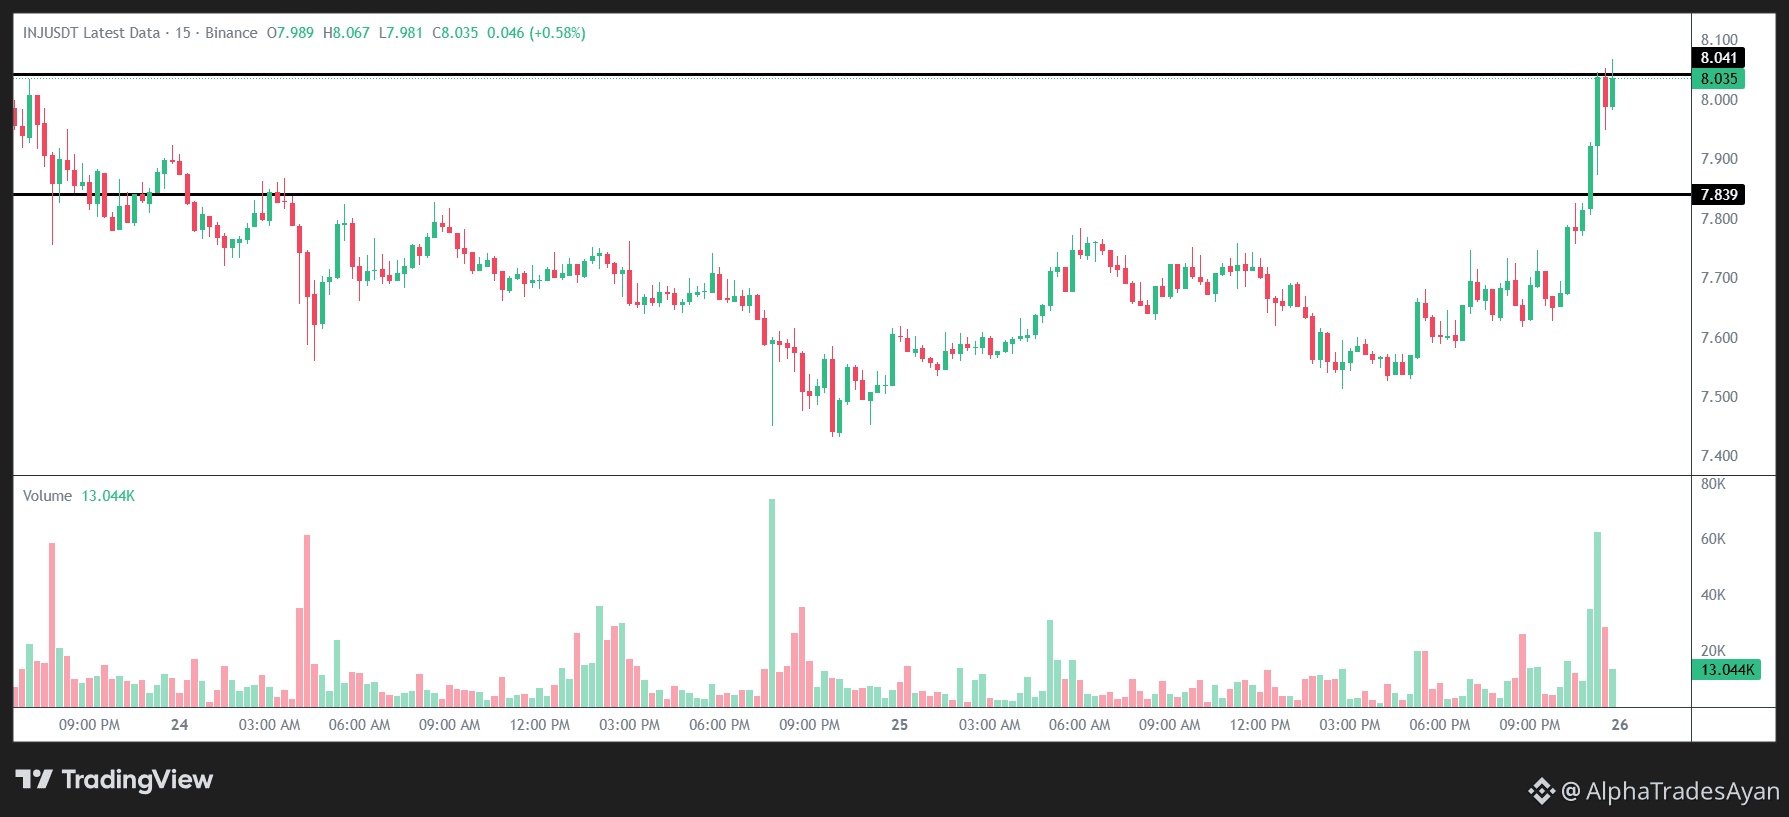
$INJ hozir kuzatish uchun darslikdagidek grafikni taqdim etmoqda. 👀
Narx hozirgina keskin yuqoriga ko‘tarildi va ayni paytda muhim 8.041 chegarasini sinab ko‘rmoqda. Bozor bu qarshilik darajasiga qanday munosabat bildirishini ko‘rish uchun hajmni diqqat bilan kuzatyapman. Agar impuls susaysa va narx ortga qaytsa, pastdagi 7.839 mustahkam tayanch daraja bo‘lib, kuzatishga arziydi.
Shoshilmayapman — avval shamlar nima deyishini kuzataman.
Diqqatimdagi muhim darajalar:
🎯 Muhim qarshilik ➔ 8.041
🛡️ Mustahkam tayanch ➔ 7.839
$INJ
{future}(INJUSDT)
Bugun INJ grafigidagi shu tuzilmani faol kuzatyapsizmi yoki boshqa altkoinlarga e’tibor qaratganmisiz? Fikringizni yozing! 👇
NFA | DYOR
$INJ hozir kuzatish uchun darslikdagidek grafikni taqdim etmoqda. 👀
Narx hozirgina keskin yuqoriga ko‘tarildi va ayni paytda muhim 8.041 chegarasini sinab ko‘rmoqda. Bozor bu qarshilik darajasiga qanday munosabat bildirishini ko‘rish uchun hajmni diqqat bilan kuzatyapman. Agar impuls susaysa va narx ortga qaytsa, pastdagi 7.839 mustahkam tayanch daraja bo‘lib, kuzatishga arziydi.
Shoshilmayapman — avval shamlar nima deyishini kuzataman.
Diqqatimdagi muhim darajalar:
🎯 Muhim qarshilik ➔ 8.041
🛡️ Mustahkam tayanch ➔ 7.839
$INJ
Bugun INJ grafigidagi shu tuzilmani faol kuzatyapsizmi yoki boshqa altkoinlarga e’tibor qaratganmisiz? Fikringizni yozing! 👇
NFA | DYOR
Narx hozirgina keskin yuqoriga ko‘tarildi va ayni paytda muhim 8.041 chegarasini sinab ko‘rmoqda. Bozor bu qarshilik darajasiga qanday munosabat bildirishini ko‘rish uchun hajmni diqqat bilan kuzatyapman. Agar impuls susaysa va narx ortga qaytsa, pastdagi 7.839 mustahkam tayanch daraja bo‘lib, kuzatishga arziydi.
Shoshilmayapman — avval shamlar nima deyishini kuzataman.
Diqqatimdagi muhim darajalar:
🎯 Muhim qarshilik ➔ 8.041
🛡️ Mustahkam tayanch ➔ 7.839
$INJ
Bugun INJ grafigidagi shu tuzilmani faol kuzatyapsizmi yoki boshqa altkoinlarga e’tibor qaratganmisiz? Fikringizni yozing! 👇
NFA | DYOR
1
1
484
Tarjimani ko‘rish
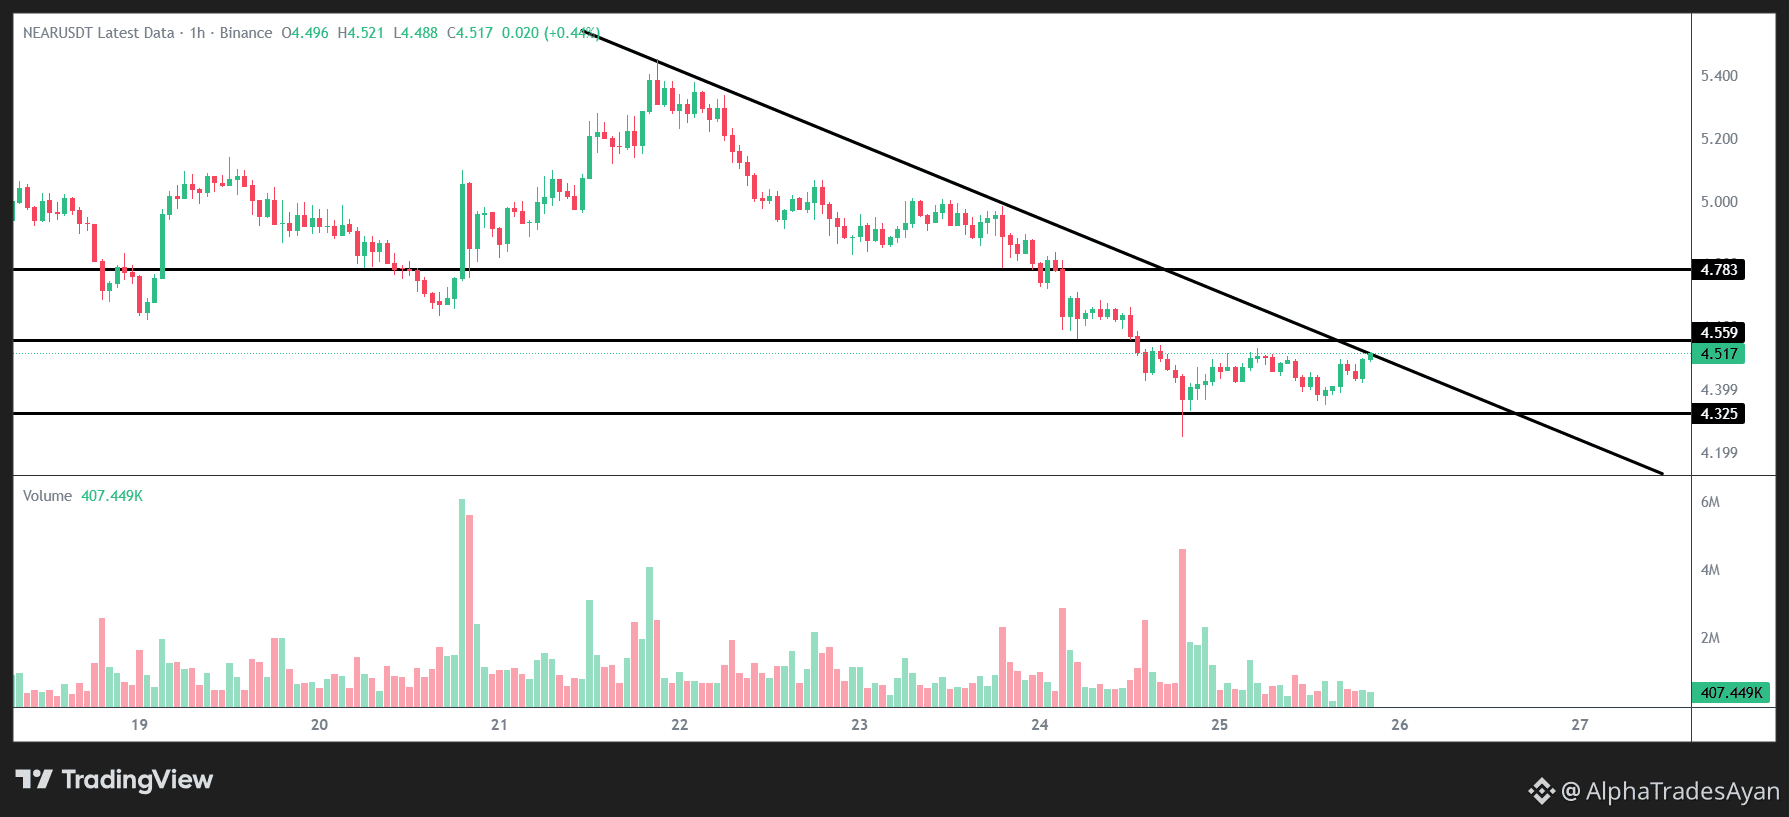
$NEAR is still trading under the descending trendline on the 1H.
Current price is around 4.52.
Key levels I’m watching:
Resistance → 4.56 Major
Resistance → 4.78
Support → 4.33
$NEAR
{future}(NEARUSDT)
Price has been stuck in this range for a while. Volume is quiet today. Just observing how it behaves near these levels.
What are you seeing on $NEAR?
NFA | DYOR
$NEAR is still trading under the descending trendline on the 1H.
Current price is around 4.52.
Key levels I’m watching:
Resistance → 4.56 Major
Resistance → 4.78
Support → 4.33
$NEAR
Price has been stuck in this range for a while. Volume is quiet today. Just observing how it behaves near these levels.
What are you seeing on $NEAR ?
NFA | DYOR
Current price is around 4.52.
Key levels I’m watching:
Resistance → 4.56 Major
Resistance → 4.78
Support → 4.33
$NEAR
Price has been stuck in this range for a while. Volume is quiet today. Just observing how it behaves near these levels.
What are you seeing on $NEAR ?
NFA | DYOR
1
1
219
Tarjimani ko‘rish
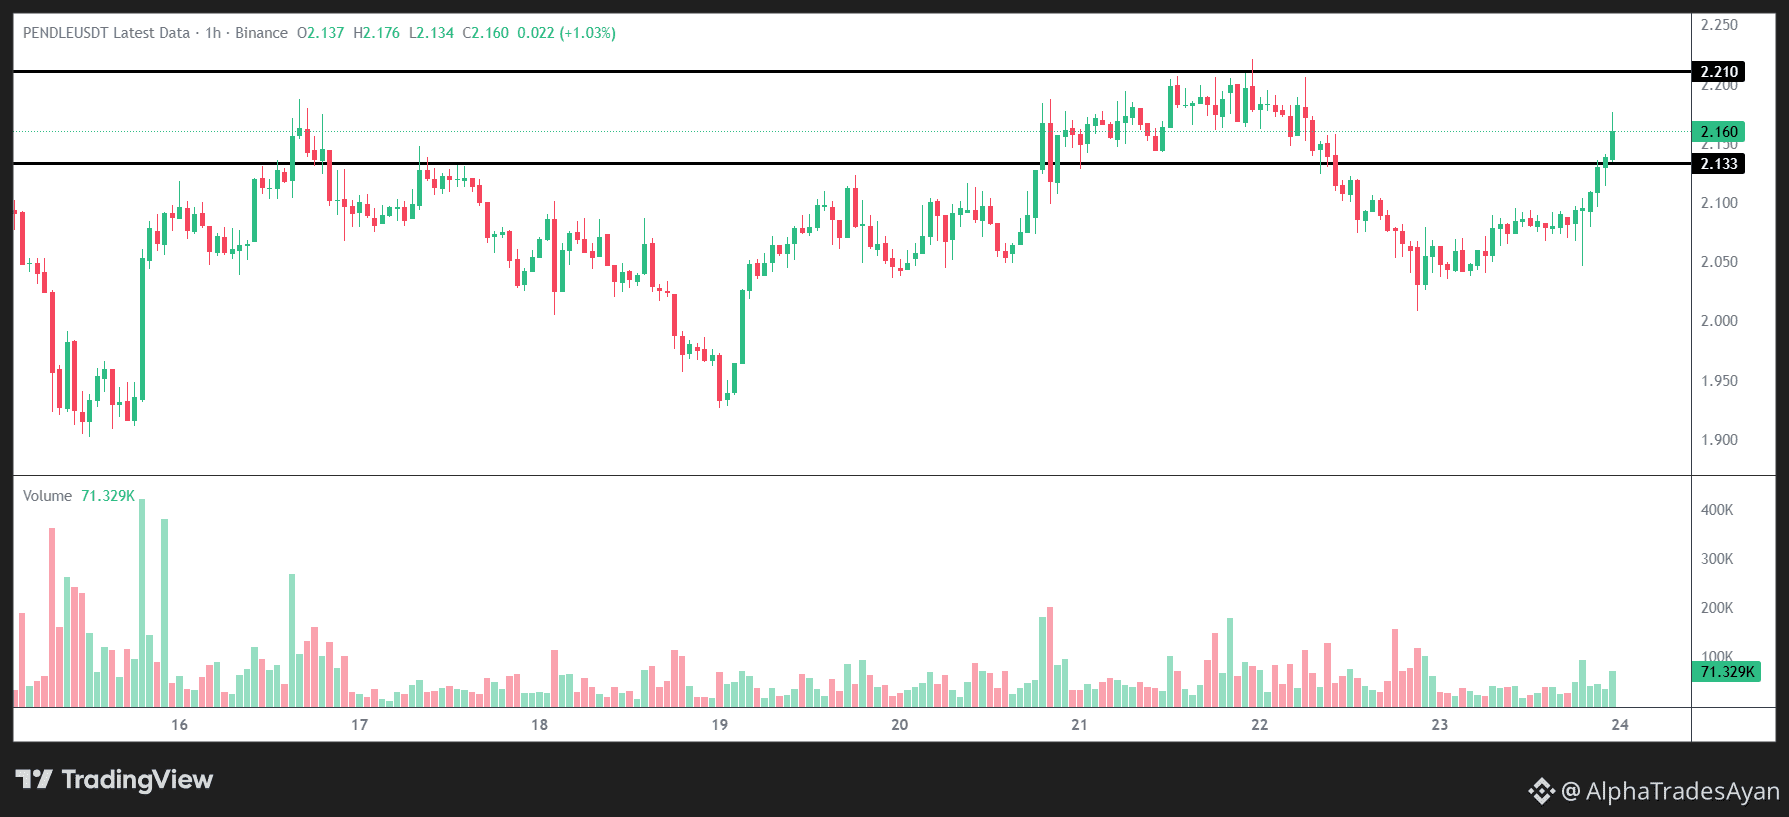
The 1H chart on $PENDLE is looking incredibly clean right now. 👀
Price is currently boxed in, and I am just observing how the volume develops inside this channel. No rushing, just waiting for the market to show its hand.
Key levels on my radar:
🎯 Major Resistance ➔ 2.210
🛡️ Solid Support ➔ 2.133
$PENDLE
{future}(PENDLEUSDT)
Are you guys tracking this $PENDLE range today, or are your eyes on other alt coins? Let me know below! 👇
NFA | DYOR
The 1H chart on $PENDLE is looking incredibly clean right now. 👀
Price is currently boxed in, and I am just observing how the volume develops inside this channel. No rushing, just waiting for the market to show its hand.
Key levels on my radar:
🎯 Major Resistance ➔ 2.210
🛡️ Solid Support ➔ 2.133
$PENDLE
Are you guys tracking this $PENDLE range today, or are your eyes on other alt coins? Let me know below! 👇
NFA | DYOR
Price is currently boxed in, and I am just observing how the volume develops inside this channel. No rushing, just waiting for the market to show its hand.
Key levels on my radar:
🎯 Major Resistance ➔ 2.210
🛡️ Solid Support ➔ 2.133
$PENDLE
Are you guys tracking this $PENDLE range today, or are your eyes on other alt coins? Let me know below! 👇
NFA | DYOR
1
1
173
Ko‘proq kontentni ko‘rish uchun tizimga kiring
Binance Square'da global kriptovalyuta foydalanuvchilariga qo‘shiling
⚡️ Kriptovalyuta haqida eng so‘nggi va foydali ma’lumotlarni oling.
💬 Dunyoning eng yirik kriptovalyuta birjasi tomonidan ishonchli deb topilgan.
👍 Tasdiqlangan mualliflardan haqiqiy tahlillarni kashf eting.
Email / telefon raqami
Trenddagi mavzular
BTCRebounds80K
51,284 marta koʻrilgan
655 muhokama qilmoqda
BITKOIN YANGILANISHI: MEN HALI HAM NARX PASAYISHI TARAFDORIMAN VA SABABI MANA! 🚨⚠️
Barchangiz guvoh bo‘lganingizdek, BTC $75,700 atrofidan qaytib, $81K ga yetdi. Avval bozor long pozitsiyadagi treyderlarni, keyin esa short pozitsiyadagi treyderlarni tuzoqqa tushirdi.
Men hali ham narx pasayishini kutyapman. Avvalo, hammaga ma’lumki, bugun AQShda bo‘lib o‘tgan oraliq saylovlarda demokratlar g‘alaba qozondi va mening fikrimcha, bu natija bozor uchun salbiy.
Qisqa muddatda bozor o‘zgaruvchan bo‘lib qolishi va istaganicha ko‘p treyderni tuzoqqa tushirishi mumkin, ammo bu bozorning umumiy istiqbolini o‘zgartirmaydi.
Oldinda bir qancha muhim voqealar bor: AQShda qishloq xo‘jaligidan tashqari bandlik ko‘rsatkichi (6-noyabr), AQSh CPI inflyatsiyasi (10-noyabr), AQSh PPI (13-noyabr), AQSh chakana savdolari (17-noyabr), FOMC yig‘ilishi bayonnomasi (18-noyabr), AQSh PCE inflyatsiyasi (25-noyabr), Federal rezerv foiz stavkalari bo‘yicha kutilmalar, AQSh dollari indeksi (DXY), G‘aznachilik obligatsiyalari daromadliligi, Nasdaq ko‘rsatkichlari, Bitcoin ETFlariga mablag‘ oqimi hamda Eron–Isroil o‘rtasidagi davom etayotgan geosiyosiy vaziyat. Bularning barchasi Bitcoin va umuman kripto bozoriga sezilarli ta’sir ko‘rsatishi mumkin.
Ammo Bitcoinning so‘nggi harakatlariga ortiqcha berilib ketmang. Texnik nuqtayi nazardan hali hech qanday yirik o‘sish harakati kuzatilmadi. Kecha BTC $80K–$82K oralig‘ida savdo qilindi, bugun ham shu diapazonda turibdi.
Agar narx oshishiga ishonsangiz, bu to‘liq o‘zingizning tanlovingiz.
Oldingi postimda BTC $75K / $76K zonasida texnik qo‘llab-quvvatlashga ega ekanini aniq tushuntirgandim. Narx shu qo‘llab-quvvatlash darajasidan qaytib, yana $80K tomonga ko‘tarildi. Lekin bu haqda avval aytmagan emasman. Aksincha, postlarimda BTC $80K, $81K yoki hatto $82K tomon harakatlanishi mumkinligini qayta-qayta ta’kidlaganman.
Shunga qaramay, men hali ham narx pasayishini kutyapman.
Pasayish haqidagi qarashimni tasdiqlaydigan yagona sababim yo‘q. Bir nechta sabablar bor va ularni oldingi postlarimda allaqachon tushuntirganman.
Hozircha BTC $74K dan pastga tushishini kutishda davom etaman. Menimcha, bu juda yaqin orada yuz berishi mumkin. Mening nazarimda, bunday tuzatish bozor uchun ham zarur.
Kripto bo‘yicha maslahat kerak bo‘lsa, menga yozing.
#BTCRebounds80K
Strategic Adviser
·26 ta layk
·26.1k marta koʻrilgan
Binance98PercentReplenished
35,869 marta koʻrilgan
525 muhokama qilmoqda
USMidterms-WhatAreMarketsExpecting?
329,853 marta koʻrilgan
2,027 muhokama qilmoqda