
RDXUBAID
13 Postlar

RDXUBAID
Shikoyat qilish
Foydalanuvchini bloklash
Crypto enthusiast Binance P2P Futures Charts, gains & coffee Let’s trade smarter, not harder
Ochiq savdo
Vaqti-vaqti bilan savdo qiluvchi
4.1 yil
0 Kuzatilmoqda
7 Kuzatuvchilar
14 Yoqdi
Postlar
Portfel
Barchasi
Iqtiboslar
·
--
Tarjimani ko‘rish
$SPCXB
some small scalpings, totaling +3500 so far
$SPCXB
some small scalpings, totaling +3500 so far
some small scalpings, totaling +3500 so far
58
·
--
Tarjimani ko‘rish
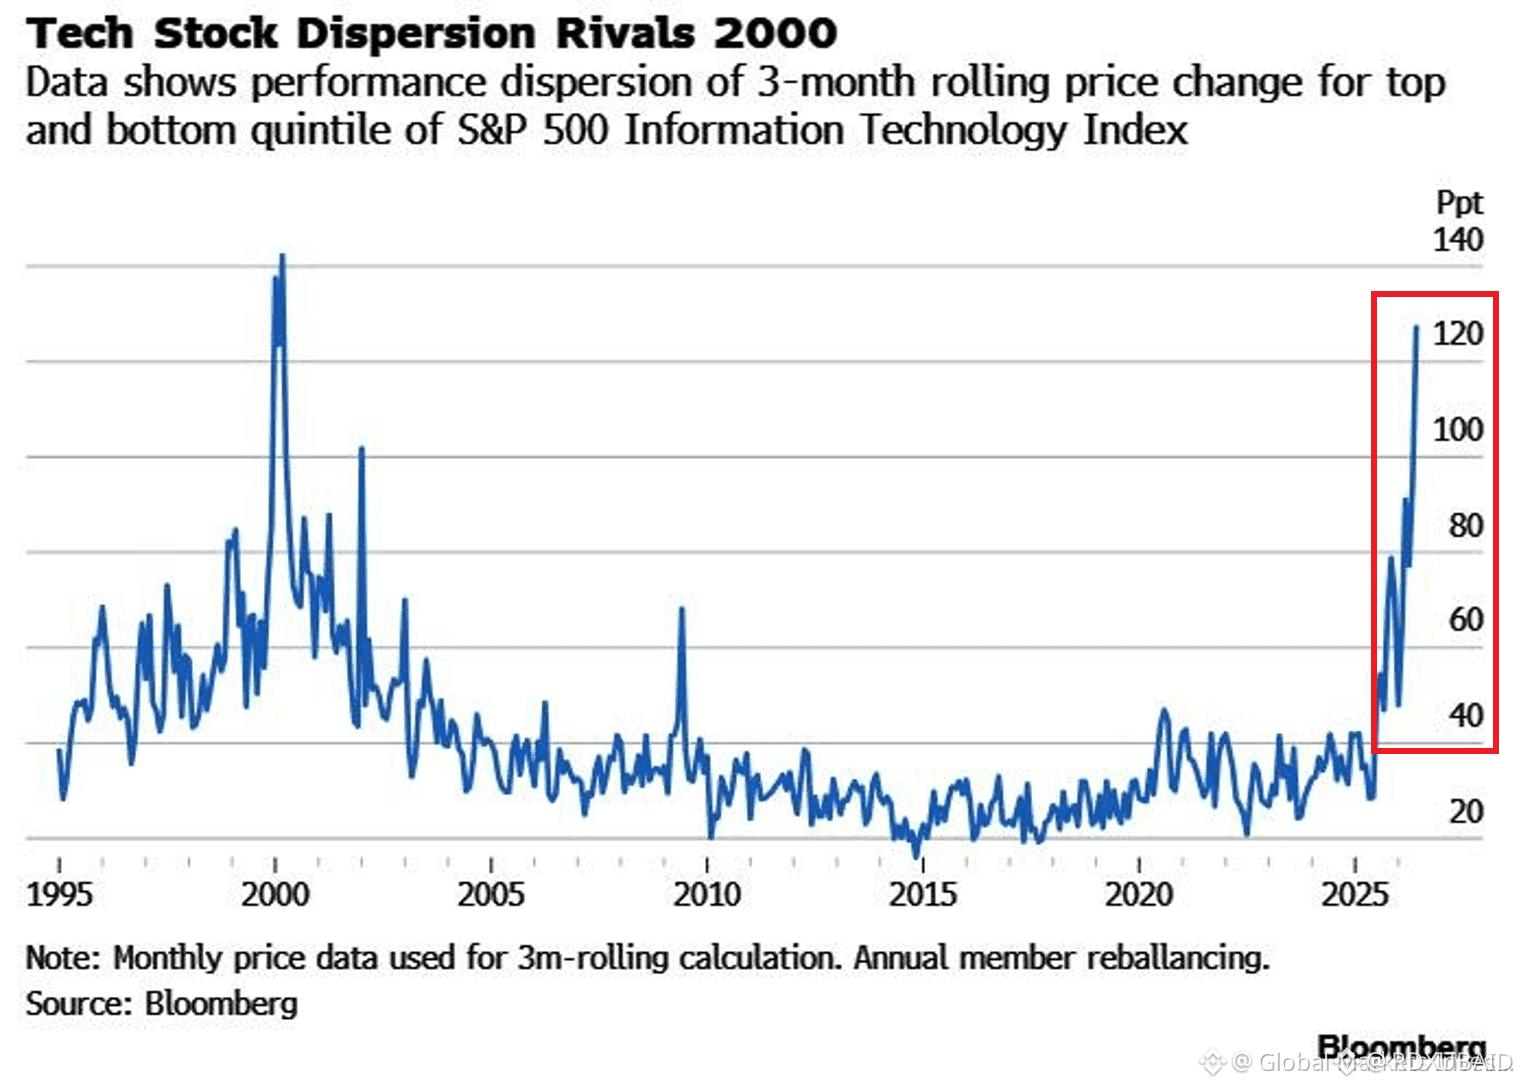
⚠️The performance gap within US tech stocks is approaching Dot-Com Bubble territory:
The top 20% of S&P 500 tech stocks have outpaced the bottom 20% by ~120 percentage points over the last 3 months, the 2nd-largest reading on record, according to Bloomberg data.
During the peak of the 2000 Dot-Com Bubble, this gap reached ~135 percentage points before the entire sector collapsed.
This gap has QUADRUPLED over the last year alone, rising faster than it did during the speculative frenzy of 1999 and 2000.
This comes as the top 20% of tech stocks have gained +110% over the last 3 months, nearly matching the levels seen at the height of the Dot-Com Bubble in February 2000.
At the same time, the bottom 20% has declined -10% over the same period.
Are we approaching the AI bubble peak?
⚠️The performance gap within US tech stocks is approaching Dot-Com Bubble territory:
The top 20% of S&P 500 tech stocks have outpaced the bottom 20% by ~120 percentage points over the last 3 months, the 2nd-largest reading on record, according to Bloomberg data.
During the peak of the 2000 Dot-Com Bubble, this gap reached ~135 percentage points before the entire sector collapsed.
This gap has QUADRUPLED over the last year alone, rising faster than it did during the speculative frenzy of 1999 and 2000.
This comes as the top 20% of tech stocks have gained +110% over the last 3 months, nearly matching the levels seen at the height of the Dot-Com Bubble in February 2000.
At the same time, the bottom 20% has declined -10% over the same period.
Are we approaching the AI bubble peak?
The top 20% of S&P 500 tech stocks have outpaced the bottom 20% by ~120 percentage points over the last 3 months, the 2nd-largest reading on record, according to Bloomberg data.
During the peak of the 2000 Dot-Com Bubble, this gap reached ~135 percentage points before the entire sector collapsed.
This gap has QUADRUPLED over the last year alone, rising faster than it did during the speculative frenzy of 1999 and 2000.
This comes as the top 20% of tech stocks have gained +110% over the last 3 months, nearly matching the levels seen at the height of the Dot-Com Bubble in February 2000.
At the same time, the bottom 20% has declined -10% over the same period.
Are we approaching the AI bubble peak?
71
·
--
Tarjimani ko‘rish
#bedrock $BR this is the best coin ever have been seen
#bedrock $BR this is the best coin ever have been seen
3
·
--
Tarjimani ko‘rish
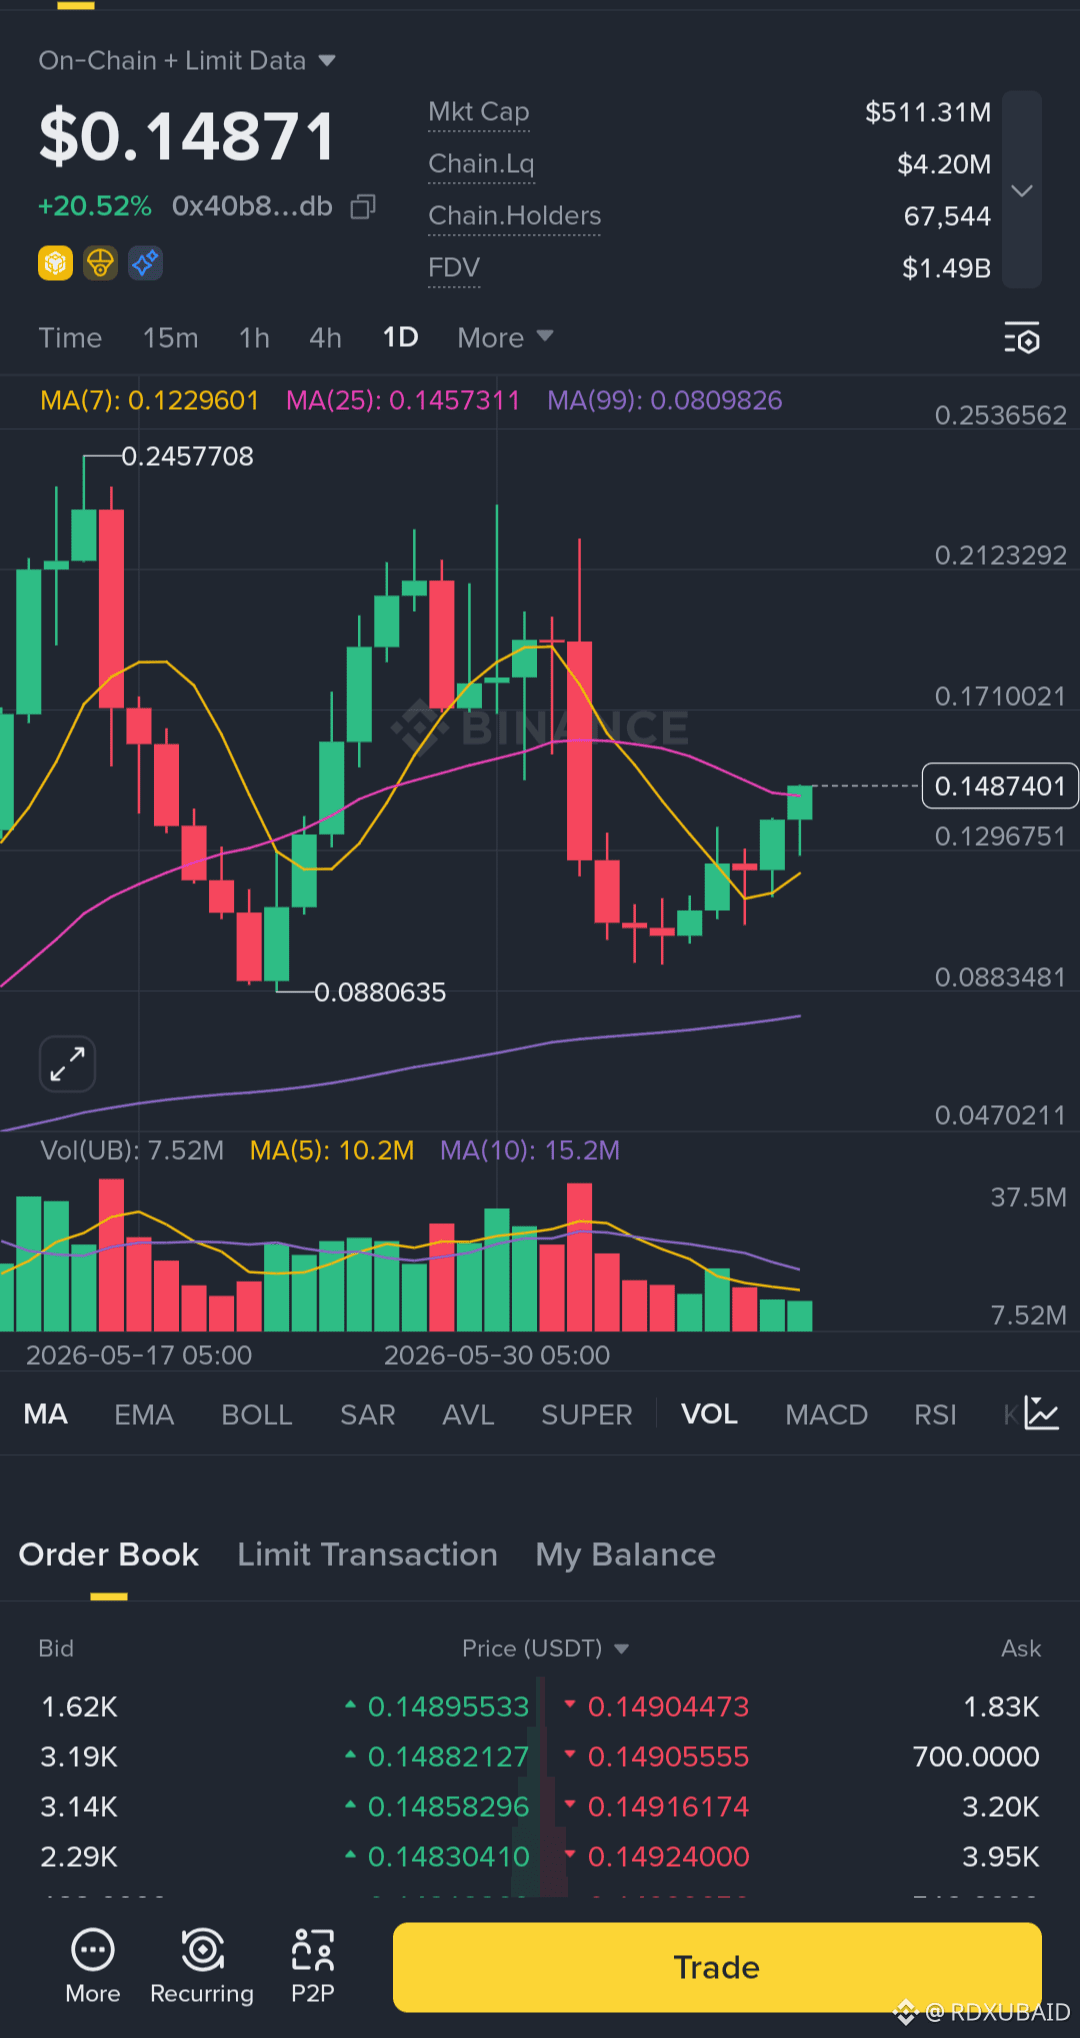
$UB *Unibase UB - Quick Analysis Today, June 9, 2026* 🤖
*1. Price & Stats*
- *Price*: $0.1237 - $0.1388
- *24h*: +1.93% to +11.88% vs BTC drop
- *7d*: -37% to -42%
- *Market Cap*: ∼$305M - $309M | Circ supply: 2.5B UB
- *FDV*: $1.24B | Max supply: 10B UB
- *24h Volume*: $14.9M - $15.5M 64bb2ad95933
*2. What is UB?*
Unibase = “high-performance decentralized AI memory layer”. Gives AI agents long-term memory + cross-platform interoperability for the “Open Agent Internet”. Tags: ai-agents, ai-big-data, binance-alpha 5933
*3. Technical/Price Action*
- *Today*: UB decoupled from BTC. BTC down 3.35% but UB up 1.93% = relative strength
- *Key levels*:
- *Support*: $0.125. Hold above = test $0.135 resistance
- *Break below*: $0.115 retest, especially with market in “Extreme Fear”
- *ATH*: $0.2425. Current price 55% below ATH
- *Volume*: Dropped 40%+ on the bounce = no strong catalyst, more technical/flow-driven 2ad95933560a
*4. Outlook*
UB showed “alpha” today by rising while crypto market sold off. No specific news/partnership found.
- *Bull case*: Hold $0.125 → push to $0.135. AI narrative still hot if BTC stabilizes
- *Bear case*: Lose $0.125 + BTC drops → retest $0.115 lows. 7d down 37% shows high volatility 2ad964bb
*Risk*: Self-reported market cap based on unverified 2.5B circulating supply. Low dominance 0.01% = high risk/reward altcoin. 64bb5933
Not financial advice. DYOR on tokenomics + team.
Want me to pull the live chart + entry zones for UB/USDT? #UB #Ubisoft #ETH #crypto #market
$UB *Unibase UB - Quick Analysis Today, June 9, 2026* 🤖
*1. Price & Stats*
- *Price*: $0.1237 - $0.1388
- *24h*: +1.93% to +11.88% vs BTC drop
- *7d*: -37% to -42%
- *Market Cap*: ∼$305M - $309M | Circ supply: 2.5B UB
- *FDV*: $1.24B | Max supply: 10B UB
- *24h Volume*: $14.9M - $15.5M 64bb2ad95933
*2. What is UB?*
Unibase = “high-performance decentralized AI memory layer”. Gives AI agents long-term memory + cross-platform interoperability for the “Open Agent Internet”. Tags: ai-agents, ai-big-data, binance-alpha 5933
*3. Technical/Price Action*
- *Today*: UB decoupled from BTC. BTC down 3.35% but UB up 1.93% = relative strength
- *Key levels*:
- *Support*: $0.125. Hold above = test $0.135 resistance
- *Break below*: $0.115 retest, especially with market in “Extreme Fear”
- *ATH*: $0.2425. Current price 55% below ATH
- *Volume*: Dropped 40%+ on the bounce = no strong catalyst, more technical/flow-driven 2ad95933560a
*4. Outlook*
UB showed “alpha” today by rising while crypto market sold off. No specific news/partnership found.
- *Bull case*: Hold $0.125 → push to $0.135. AI narrative still hot if BTC stabilizes
- *Bear case*: Lose $0.125 + BTC drops → retest $0.115 lows. 7d down 37% shows high volatility 2ad964bb
*Risk*: Self-reported market cap based on unverified 2.5B circulating supply. Low dominance 0.01% = high risk/reward altcoin. 64bb5933
Not financial advice. DYOR on tokenomics + team.
Want me to pull the live chart + entry zones for UB/USDT? #UB #Ubisoft #ETH #crypto #market
*1. Price & Stats*
- *Price*: $0.1237 - $0.1388
- *24h*: +1.93% to +11.88% vs BTC drop
- *7d*: -37% to -42%
- *Market Cap*: ∼$305M - $309M | Circ supply: 2.5B UB
- *FDV*: $1.24B | Max supply: 10B UB
- *24h Volume*: $14.9M - $15.5M 64bb2ad95933
*2. What is UB?*
Unibase = “high-performance decentralized AI memory layer”. Gives AI agents long-term memory + cross-platform interoperability for the “Open Agent Internet”. Tags: ai-agents, ai-big-data, binance-alpha 5933
*3. Technical/Price Action*
- *Today*: UB decoupled from BTC. BTC down 3.35% but UB up 1.93% = relative strength
- *Key levels*:
- *Support*: $0.125. Hold above = test $0.135 resistance
- *Break below*: $0.115 retest, especially with market in “Extreme Fear”
- *ATH*: $0.2425. Current price 55% below ATH
- *Volume*: Dropped 40%+ on the bounce = no strong catalyst, more technical/flow-driven 2ad95933560a
*4. Outlook*
UB showed “alpha” today by rising while crypto market sold off. No specific news/partnership found.
- *Bull case*: Hold $0.125 → push to $0.135. AI narrative still hot if BTC stabilizes
- *Bear case*: Lose $0.125 + BTC drops → retest $0.115 lows. 7d down 37% shows high volatility 2ad964bb
*Risk*: Self-reported market cap based on unverified 2.5B circulating supply. Low dominance 0.01% = high risk/reward altcoin. 64bb5933
Not financial advice. DYOR on tokenomics + team.
Want me to pull the live chart + entry zones for UB/USDT? #UB #Ubisoft #ETH #crypto #market
115
·
--
Tarjimani ko‘rish
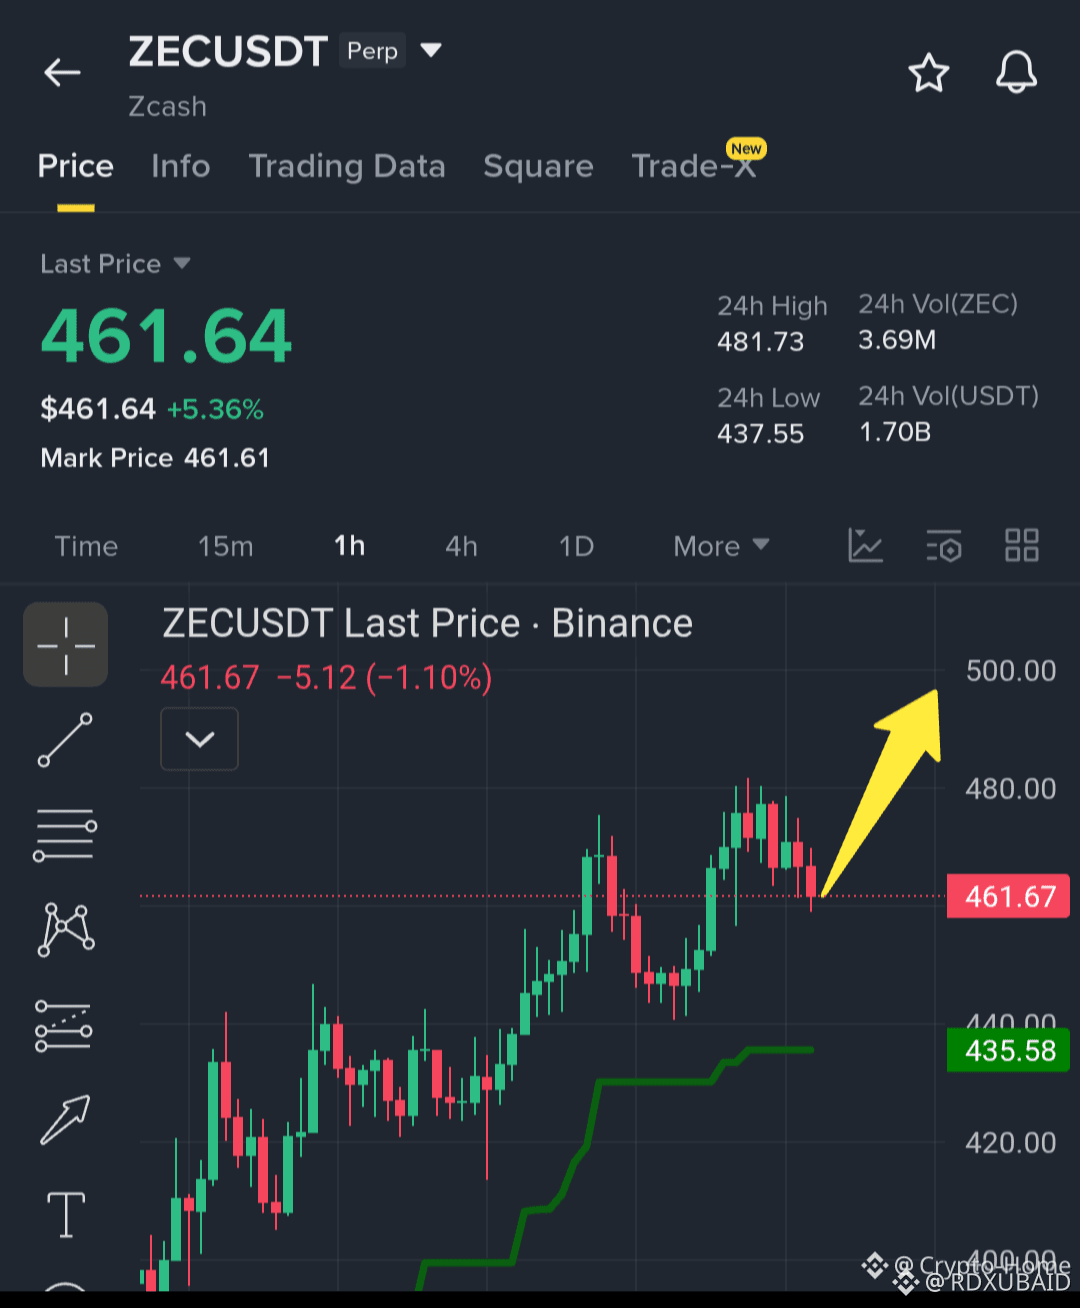
$ZEC next stop: 500? 🎯
Sitting at 461.64 and looking ready for the next leg up. Keep a close eye on this one! ⏳👀
#zec #ZECUSDT #ZeusInCrypto #BTC #ETH
$ZEC next stop: 500? 🎯
Sitting at 461.64 and looking ready for the next leg up. Keep a close eye on this one! ⏳👀
#zec #ZECUSDT #ZeusInCrypto #BTC #ETH
Sitting at 461.64 and looking ready for the next leg up. Keep a close eye on this one! ⏳👀
#zec #ZECUSDT #ZeusInCrypto #BTC #ETH
70
·
--
$BEAT I*Bitcoin BTC — 2026-yil 9-iyun tezkor tahlili*
*1. Joriy narx va statistikalar*
- *Narx*: $61,200 - $62,900
- *24 soat*: -3.7%
- *7 kun*: -11.8%
- *Bozor kapitallashuvi*: ∼$1.26T | Reyting #1
*2. Texnik tahlil*
- *Trend*: 50 kunlik va 200 kunlik SMA’dan pastda. O‘tgan hafta ko‘tariluvchi kanaldan chiqib ketdi → pasayish strukturasi
- *Qo‘llab-quvvatlash*: $59,000 - $60,000. 200 haftalik MA shu yerda. Tarixan bu BTC uchun “ayiq bozori tubi” bo‘lib kelgan
- *Qarshilik*: $65,000 → $70,000 - $72,000. Pasayish trendini tugatish uchun kunlik yopilish $65K’dan yuqori bo‘lishi kerak
- *RSI*: Kunlik va 2 haftalik grafiklarda haddan tashqari sotilgan. Tarixdagi eng past ko‘rsatkich = kapitulyatsiya signali. Ko‘pincha qaytishlardan oldin kuzatiladi
- *Savdo hajmi*: $59K’gacha tushishda keskin oshdi, endi pasaymoqda = noaniqlik zonasi
*3. Asosiy omillar*
1. *CPI + Fed*: May oyidagi CPI 10-iyunda e’lon qilinadi. Fed 17-iyunda yig‘iladi. CPI yuqori chiqsa = DXY ko‘tariladi, BTC $59K’ni sinaydi. CPI past chiqsa = BTC $70K+’gacha yengillik rallisi
2. *ETF oqimlari*: 13 kunlik mablag‘ chiqimi davom etmoqda, $4.33B chiqib ketdi. Yangi xaridorlar yo‘q = narx harakati sust
3. *Zanjir ichidagi ma’lumotlar*: Chakana investorlar (0-0.1 BTC) va o‘rta hajmdagi hamyonlar (10-100 BTC) to‘plamoqda. Kitlar (10K+ BTC) sotmoqda
4. *Kayfiyat*: “O‘ta qo‘rquv” + RSI’ning past ko‘rsatkichlari = tubga yaqinlashish sharoitlari, ammo trend faqat $65K’dan yuqorida o‘zgaradi
*4. Ssenariylar*
- *Ko‘tarilish ssenariysi*: $60K saqlanib qoladi → $65K’gacha qaytish, CPI past bo‘lsa, keyin $70K. Buning uchun savdo hajmi oshishi va 50 SMA qayta egallanishi kerak
- *Pasayish ssenariysi*: $59K’dan pastga tushsa → yaxlit $55K darajasi, keyin 2024-yildagi eng past ko‘rsatkich — $52K. Kapitulyatsion yuvilish zonasi
*Xulosa*: BTC makroiqtisodiy qaror qabul qilinadigan nuqtada. $60K = muhim chegara. Haddan tashqari sotilgan holat + qo‘llab-quvvatlash = qaytish ehtimoli, ammo bu hafta makroiqtisodiy ma’lumotlar yengillik rallisi bo‘ladimi yoki pasayishning yangi bosqichi boshlanadimi, shuni hal qiladi.
Bu moliyaviy maslahat emas. O‘zingiz tadqiq qiling.
Spot va fyucherslar uchun kirish/chiqish zonalarini ham qo‘shaymi?
#beat #bitcoin #crypto #trades #bnb
$BEAT I*Bitcoin BTC — 2026-yil 9-iyun tezkor tahlili*
*1. Joriy narx va statistikalar*
- *Narx*: $61,200 - $62,900
- *24 soat*: -3.7%
- *7 kun*: -11.8%
- *Bozor kapitallashuvi*: ∼$1.26T | Reyting #1
*2. Texnik tahlil*
- *Trend*: 50 kunlik va 200 kunlik SMA’dan pastda. O‘tgan hafta ko‘tariluvchi kanaldan chiqib ketdi → pasayish strukturasi
- *Qo‘llab-quvvatlash*: $59,000 - $60,000. 200 haftalik MA shu yerda. Tarixan bu BTC uchun “ayiq bozori tubi” bo‘lib kelgan
- *Qarshilik*: $65,000 → $70,000 - $72,000. Pasayish trendini tugatish uchun kunlik yopilish $65K’dan yuqori bo‘lishi kerak
- *RSI*: Kunlik va 2 haftalik grafiklarda haddan tashqari sotilgan. Tarixdagi eng past ko‘rsatkich = kapitulyatsiya signali. Ko‘pincha qaytishlardan oldin kuzatiladi
- *Savdo hajmi*: $59K’gacha tushishda keskin oshdi, endi pasaymoqda = noaniqlik zonasi
*3. Asosiy omillar*
1. *CPI + Fed*: May oyidagi CPI 10-iyunda e’lon qilinadi. Fed 17-iyunda yig‘iladi. CPI yuqori chiqsa = DXY ko‘tariladi, BTC $59K’ni sinaydi. CPI past chiqsa = BTC $70K+’gacha yengillik rallisi
2. *ETF oqimlari*: 13 kunlik mablag‘ chiqimi davom etmoqda, $4.33B chiqib ketdi. Yangi xaridorlar yo‘q = narx harakati sust
3. *Zanjir ichidagi ma’lumotlar*: Chakana investorlar (0-0.1 BTC) va o‘rta hajmdagi hamyonlar (10-100 BTC) to‘plamoqda. Kitlar (10K+ BTC) sotmoqda
4. *Kayfiyat*: “O‘ta qo‘rquv” + RSI’ning past ko‘rsatkichlari = tubga yaqinlashish sharoitlari, ammo trend faqat $65K’dan yuqorida o‘zgaradi
*4. Ssenariylar*
- *Ko‘tarilish ssenariysi*: $60K saqlanib qoladi → $65K’gacha qaytish, CPI past bo‘lsa, keyin $70K. Buning uchun savdo hajmi oshishi va 50 SMA qayta egallanishi kerak
- *Pasayish ssenariysi*: $59K’dan pastga tushsa → yaxlit $55K darajasi, keyin 2024-yildagi eng past ko‘rsatkich — $52K. Kapitulyatsion yuvilish zonasi
*Xulosa*: BTC makroiqtisodiy qaror qabul qilinadigan nuqtada. $60K = muhim chegara. Haddan tashqari sotilgan holat + qo‘llab-quvvatlash = qaytish ehtimoli, ammo bu hafta makroiqtisodiy ma’lumotlar yengillik rallisi bo‘ladimi yoki pasayishning yangi bosqichi boshlanadimi, shuni hal qiladi.
Bu moliyaviy maslahat emas. O‘zingiz tadqiq qiling.
Spot va fyucherslar uchun kirish/chiqish zonalarini ham qo‘shaymi?
#beat #bitcoin #crypto #trades #bnb
*1. Joriy narx va statistikalar*
- *Narx*: $61,200 - $62,900
- *24 soat*: -3.7%
- *7 kun*: -11.8%
- *Bozor kapitallashuvi*: ∼$1.26T | Reyting #1
*2. Texnik tahlil*
- *Trend*: 50 kunlik va 200 kunlik SMA’dan pastda. O‘tgan hafta ko‘tariluvchi kanaldan chiqib ketdi → pasayish strukturasi
- *Qo‘llab-quvvatlash*: $59,000 - $60,000. 200 haftalik MA shu yerda. Tarixan bu BTC uchun “ayiq bozori tubi” bo‘lib kelgan
- *Qarshilik*: $65,000 → $70,000 - $72,000. Pasayish trendini tugatish uchun kunlik yopilish $65K’dan yuqori bo‘lishi kerak
- *RSI*: Kunlik va 2 haftalik grafiklarda haddan tashqari sotilgan. Tarixdagi eng past ko‘rsatkich = kapitulyatsiya signali. Ko‘pincha qaytishlardan oldin kuzatiladi
- *Savdo hajmi*: $59K’gacha tushishda keskin oshdi, endi pasaymoqda = noaniqlik zonasi
*3. Asosiy omillar*
1. *CPI + Fed*: May oyidagi CPI 10-iyunda e’lon qilinadi. Fed 17-iyunda yig‘iladi. CPI yuqori chiqsa = DXY ko‘tariladi, BTC $59K’ni sinaydi. CPI past chiqsa = BTC $70K+’gacha yengillik rallisi
2. *ETF oqimlari*: 13 kunlik mablag‘ chiqimi davom etmoqda, $4.33B chiqib ketdi. Yangi xaridorlar yo‘q = narx harakati sust
3. *Zanjir ichidagi ma’lumotlar*: Chakana investorlar (0-0.1 BTC) va o‘rta hajmdagi hamyonlar (10-100 BTC) to‘plamoqda. Kitlar (10K+ BTC) sotmoqda
4. *Kayfiyat*: “O‘ta qo‘rquv” + RSI’ning past ko‘rsatkichlari = tubga yaqinlashish sharoitlari, ammo trend faqat $65K’dan yuqorida o‘zgaradi
*4. Ssenariylar*
- *Ko‘tarilish ssenariysi*: $60K saqlanib qoladi → $65K’gacha qaytish, CPI past bo‘lsa, keyin $70K. Buning uchun savdo hajmi oshishi va 50 SMA qayta egallanishi kerak
- *Pasayish ssenariysi*: $59K’dan pastga tushsa → yaxlit $55K darajasi, keyin 2024-yildagi eng past ko‘rsatkich — $52K. Kapitulyatsion yuvilish zonasi
*Xulosa*: BTC makroiqtisodiy qaror qabul qilinadigan nuqtada. $60K = muhim chegara. Haddan tashqari sotilgan holat + qo‘llab-quvvatlash = qaytish ehtimoli, ammo bu hafta makroiqtisodiy ma’lumotlar yengillik rallisi bo‘ladimi yoki pasayishning yangi bosqichi boshlanadimi, shuni hal qiladi.
Bu moliyaviy maslahat emas. O‘zingiz tadqiq qiling.
Spot va fyucherslar uchun kirish/chiqish zonalarini ham qo‘shaymi?
#beat #bitcoin #crypto #trades #bnb
235
·
--
Tarjimani ko‘rish
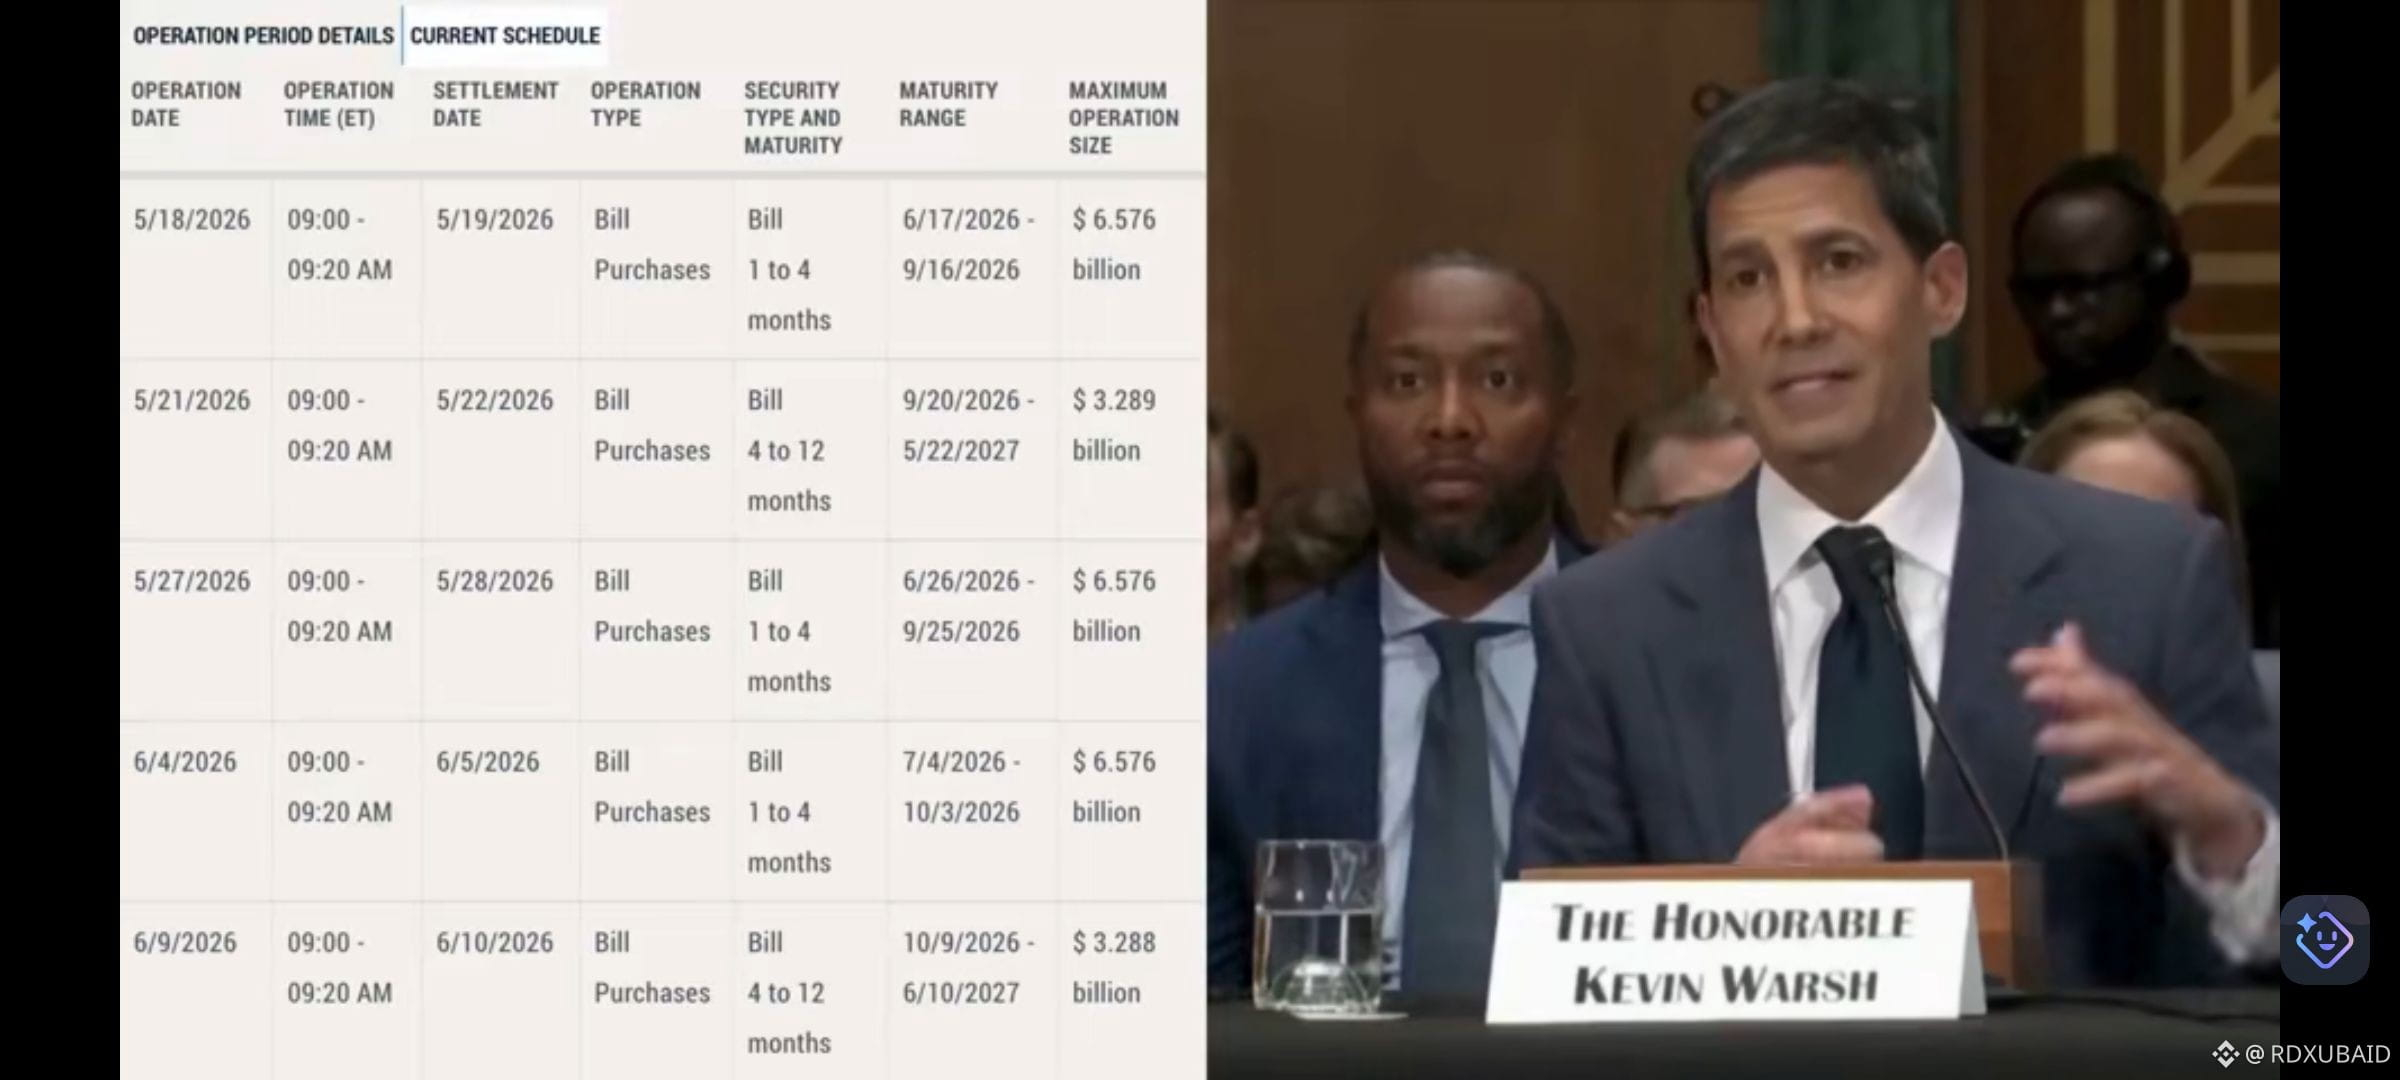
$BTC 🚨HUGE: The Fed is injecting billions into the markets
Liquidity is increasing across the financial system.
Once Bitcoin establishes a bottom, the next phase of the market cycle could turn extremely strong.
The upcoming bull market has the potential to be highly volatile and explosive.
#BTC #cryptouniverseofficial #TRUMP #CPIWatch #CryptocurrencyWealth
$BTC 🚨HUGE: The Fed is injecting billions into the markets
Liquidity is increasing across the financial system.
Once Bitcoin establishes a bottom, the next phase of the market cycle could turn extremely strong.
The upcoming bull market has the potential to be highly volatile and explosive.
#BTC #cryptouniverseofficial #TRUMP #CPIWatch #CryptocurrencyWealth
Liquidity is increasing across the financial system.
Once Bitcoin establishes a bottom, the next phase of the market cycle could turn extremely strong.
The upcoming bull market has the potential to be highly volatile and explosive.
#BTC #cryptouniverseofficial #TRUMP #CPIWatch #CryptocurrencyWealth
52
·
--
Tarjimani ko‘rish
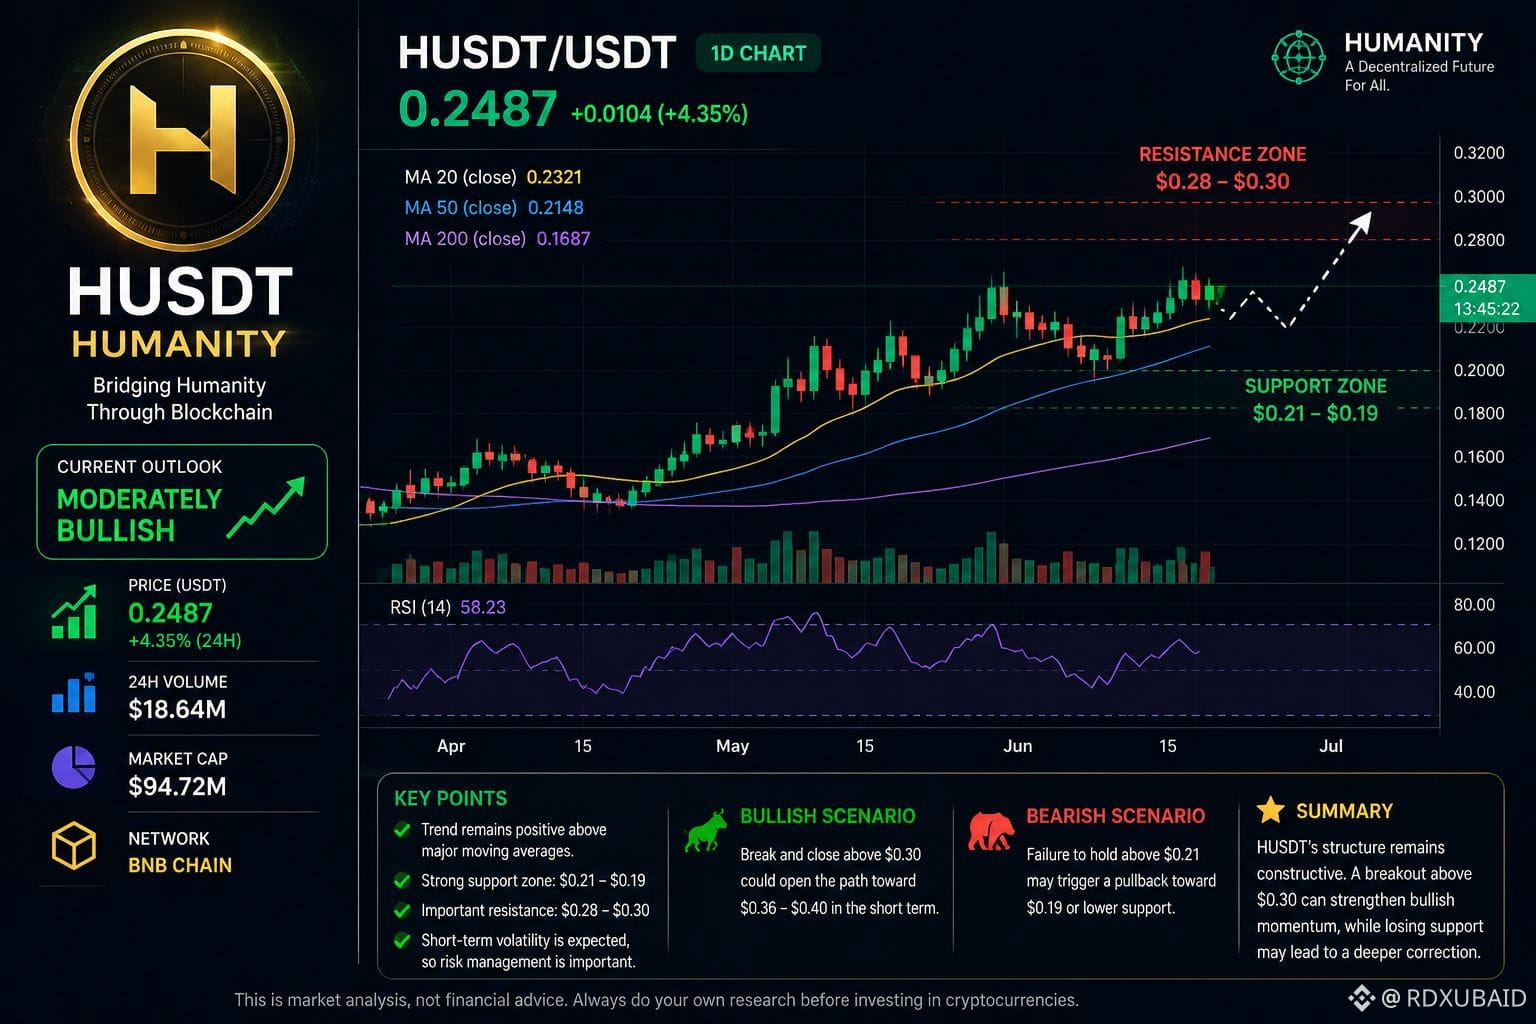
$H (Humanity) has been showing strength by trading above key support zones and maintaining an overall upward trend. Recent technical analysis suggests buyers are still active, with resistance around the $0.28–$0.30 area acting as the next major hurdle. A breakout above this zone could open the door for further gains, while support remains near $0.21–$0.19. �
36Crypto
Key Points
Trend remains positive above major moving averages. �
36Crypto
Strong support zone: $0.21–$0.19. �
36Crypto
Important resistance: $0.28–$0.30. �
36Crypto
Short-term volatility is expected, so risk management is important.
Summary:
HUSDT's technical structure remains constructive, but traders should watch the $0.30 resistance level closely. A confirmed breakout could strengthen bullish momentum, while failure to hold support may trigger a pullback. �
36Crypto
#husdt #Binance #crypto #bitcoin #bnb
{future}(HUMAUSDT)
$H (Humanity) has been showing strength by trading above key support zones and maintaining an overall upward trend. Recent technical analysis suggests buyers are still active, with resistance around the $0.28–$0.30 area acting as the next major hurdle. A breakout above this zone could open the door for further gains, while support remains near $0.21–$0.19. �
36Crypto
Key Points
Trend remains positive above major moving averages. �
36Crypto
Strong support zone: $0.21–$0.19. �
36Crypto
Important resistance: $0.28–$0.30. �
36Crypto
Short-term volatility is expected, so risk management is important.
Summary:
HUSDT's technical structure remains constructive, but traders should watch the $0.30 resistance level closely. A confirmed breakout could strengthen bullish momentum, while failure to hold support may trigger a pullback. �
36Crypto
#husdt #Binance #crypto #bitcoin #bnb
36Crypto
Key Points
Trend remains positive above major moving averages. �
36Crypto
Strong support zone: $0.21–$0.19. �
36Crypto
Important resistance: $0.28–$0.30. �
36Crypto
Short-term volatility is expected, so risk management is important.
Summary:
HUSDT's technical structure remains constructive, but traders should watch the $0.30 resistance level closely. A confirmed breakout could strengthen bullish momentum, while failure to hold support may trigger a pullback. �
36Crypto
#husdt #Binance #crypto #bitcoin #bnb
1
409
·
--
Tarjimani ko‘rish
$LTC *Litecoin LTC - Short Analysis for June 9, 2026* 📉
*1. Latest Price & Stats*
- *Price*: $42.48 - $42.58 now
- *24h change*: -1.4% to -1.57%
- *7d change*: -14.56% to -15.56%
- *Market Cap*: ∼$3.28B, Rank #28-#30
- *Volume 24h*: $254M - $312M 0f1d64848e447900 7900 7900
*2. Technical Picture*
LTC dropped below key support earlier this week and is "finding its footing around mid-range" while searching for a new base. 7900
Key levels right now:
- *Support*: $40.52 - $41.30. A break below $40.77 risks $36.50
- *Resistance*: $42.50 - $42.71, then $44.20. Needs close above $52.76 to flip bullish 8dba6484e8c479005986384b
TA signals: RSI 23.64 = oversold. Price below 50/200 EMA = strong downtrend. Overall rating: SELL, Bearish. Volume spiked 2x+ on June 6-7 confirming bearish momentum. 64848dba
*3. News/Drivers*
1. *Security update*: Litecoin Core 0.21.5.5 released May 7, 2026 patching MWEB vulnerabilities + adding LitecoinVM smart contract testnet in April. Bullish for network security.
2. *Whale move*: 1.25M LTC ∼$68M withdrawn from OKX to unknown wallet recently, tightening exchange supply. Can help if not redeposited.
3. *Market sentiment*: High-beta altcoin lagging as capital stays defensive. No clear catalyst besides BTC correlation. 3e076484e8c4
*Outlook*: Still in downtrend channel since late May with lower highs/lows. Short-term bounce possible if $40.52 holds, but needs break above $44.20 + volume for real reversal. Oversold RSI may bring relief bounce to $44-$45. 7900 e8c4
*About "latest pics"*: I can’t pull live exchange charts directly, but you can check Binance LTC/USDT 1h/1d chart to see the $40.52 support + $42.71 resistance zone. 7900
Want me to break down a specific timeframe like 1h vs 4h chart for entry/exit zones?
_Not financial advice. Crypto is volatile._
#Litecoin #Binance #bitcoin #BinanceSquareTalks #ETH
{future}(LITEUSDT)
$LTC *Litecoin LTC - Short Analysis for June 9, 2026* 📉
*1. Latest Price & Stats*
- *Price*: $42.48 - $42.58 now
- *24h change*: -1.4% to -1.57%
- *7d change*: -14.56% to -15.56%
- *Market Cap*: ∼$3.28B, Rank #28-#30
- *Volume 24h*: $254M - $312M 0f1d64848e447900 7900 7900
*2. Technical Picture*
LTC dropped below key support earlier this week and is "finding its footing around mid-range" while searching for a new base. 7900
Key levels right now:
- *Support*: $40.52 - $41.30. A break below $40.77 risks $36.50
- *Resistance*: $42.50 - $42.71, then $44.20. Needs close above $52.76 to flip bullish 8dba6484e8c479005986384b
TA signals: RSI 23.64 = oversold. Price below 50/200 EMA = strong downtrend. Overall rating: SELL, Bearish. Volume spiked 2x+ on June 6-7 confirming bearish momentum. 64848dba
*3. News/Drivers*
1. *Security update*: Litecoin Core 0.21.5.5 released May 7, 2026 patching MWEB vulnerabilities + adding LitecoinVM smart contract testnet in April. Bullish for network security.
2. *Whale move*: 1.25M LTC ∼$68M withdrawn from OKX to unknown wallet recently, tightening exchange supply. Can help if not redeposited.
3. *Market sentiment*: High-beta altcoin lagging as capital stays defensive. No clear catalyst besides BTC correlation. 3e076484e8c4
*Outlook*: Still in downtrend channel since late May with lower highs/lows. Short-term bounce possible if $40.52 holds, but needs break above $44.20 + volume for real reversal. Oversold RSI may bring relief bounce to $44-$45. 7900 e8c4
*About "latest pics"*: I can’t pull live exchange charts directly, but you can check Binance LTC/USDT 1h/1d chart to see the $40.52 support + $42.71 resistance zone. 7900
Want me to break down a specific timeframe like 1h vs 4h chart for entry/exit zones?
_Not financial advice. Crypto is volatile._
#Litecoin #Binance #bitcoin #BinanceSquareTalks #ETH
*1. Latest Price & Stats*
- *Price*: $42.48 - $42.58 now
- *24h change*: -1.4% to -1.57%
- *7d change*: -14.56% to -15.56%
- *Market Cap*: ∼$3.28B, Rank #28-#30
- *Volume 24h*: $254M - $312M 0f1d64848e447900 7900 7900
*2. Technical Picture*
LTC dropped below key support earlier this week and is "finding its footing around mid-range" while searching for a new base. 7900
Key levels right now:
- *Support*: $40.52 - $41.30. A break below $40.77 risks $36.50
- *Resistance*: $42.50 - $42.71, then $44.20. Needs close above $52.76 to flip bullish 8dba6484e8c479005986384b
TA signals: RSI 23.64 = oversold. Price below 50/200 EMA = strong downtrend. Overall rating: SELL, Bearish. Volume spiked 2x+ on June 6-7 confirming bearish momentum. 64848dba
*3. News/Drivers*
1. *Security update*: Litecoin Core 0.21.5.5 released May 7, 2026 patching MWEB vulnerabilities + adding LitecoinVM smart contract testnet in April. Bullish for network security.
2. *Whale move*: 1.25M LTC ∼$68M withdrawn from OKX to unknown wallet recently, tightening exchange supply. Can help if not redeposited.
3. *Market sentiment*: High-beta altcoin lagging as capital stays defensive. No clear catalyst besides BTC correlation. 3e076484e8c4
*Outlook*: Still in downtrend channel since late May with lower highs/lows. Short-term bounce possible if $40.52 holds, but needs break above $44.20 + volume for real reversal. Oversold RSI may bring relief bounce to $44-$45. 7900 e8c4
*About "latest pics"*: I can’t pull live exchange charts directly, but you can check Binance LTC/USDT 1h/1d chart to see the $40.52 support + $42.71 resistance zone. 7900
Want me to break down a specific timeframe like 1h vs 4h chart for entry/exit zones?
_Not financial advice. Crypto is volatile._
#Litecoin #Binance #bitcoin #BinanceSquareTalks #ETH
1
201
·
--
Tarjimani ko‘rish
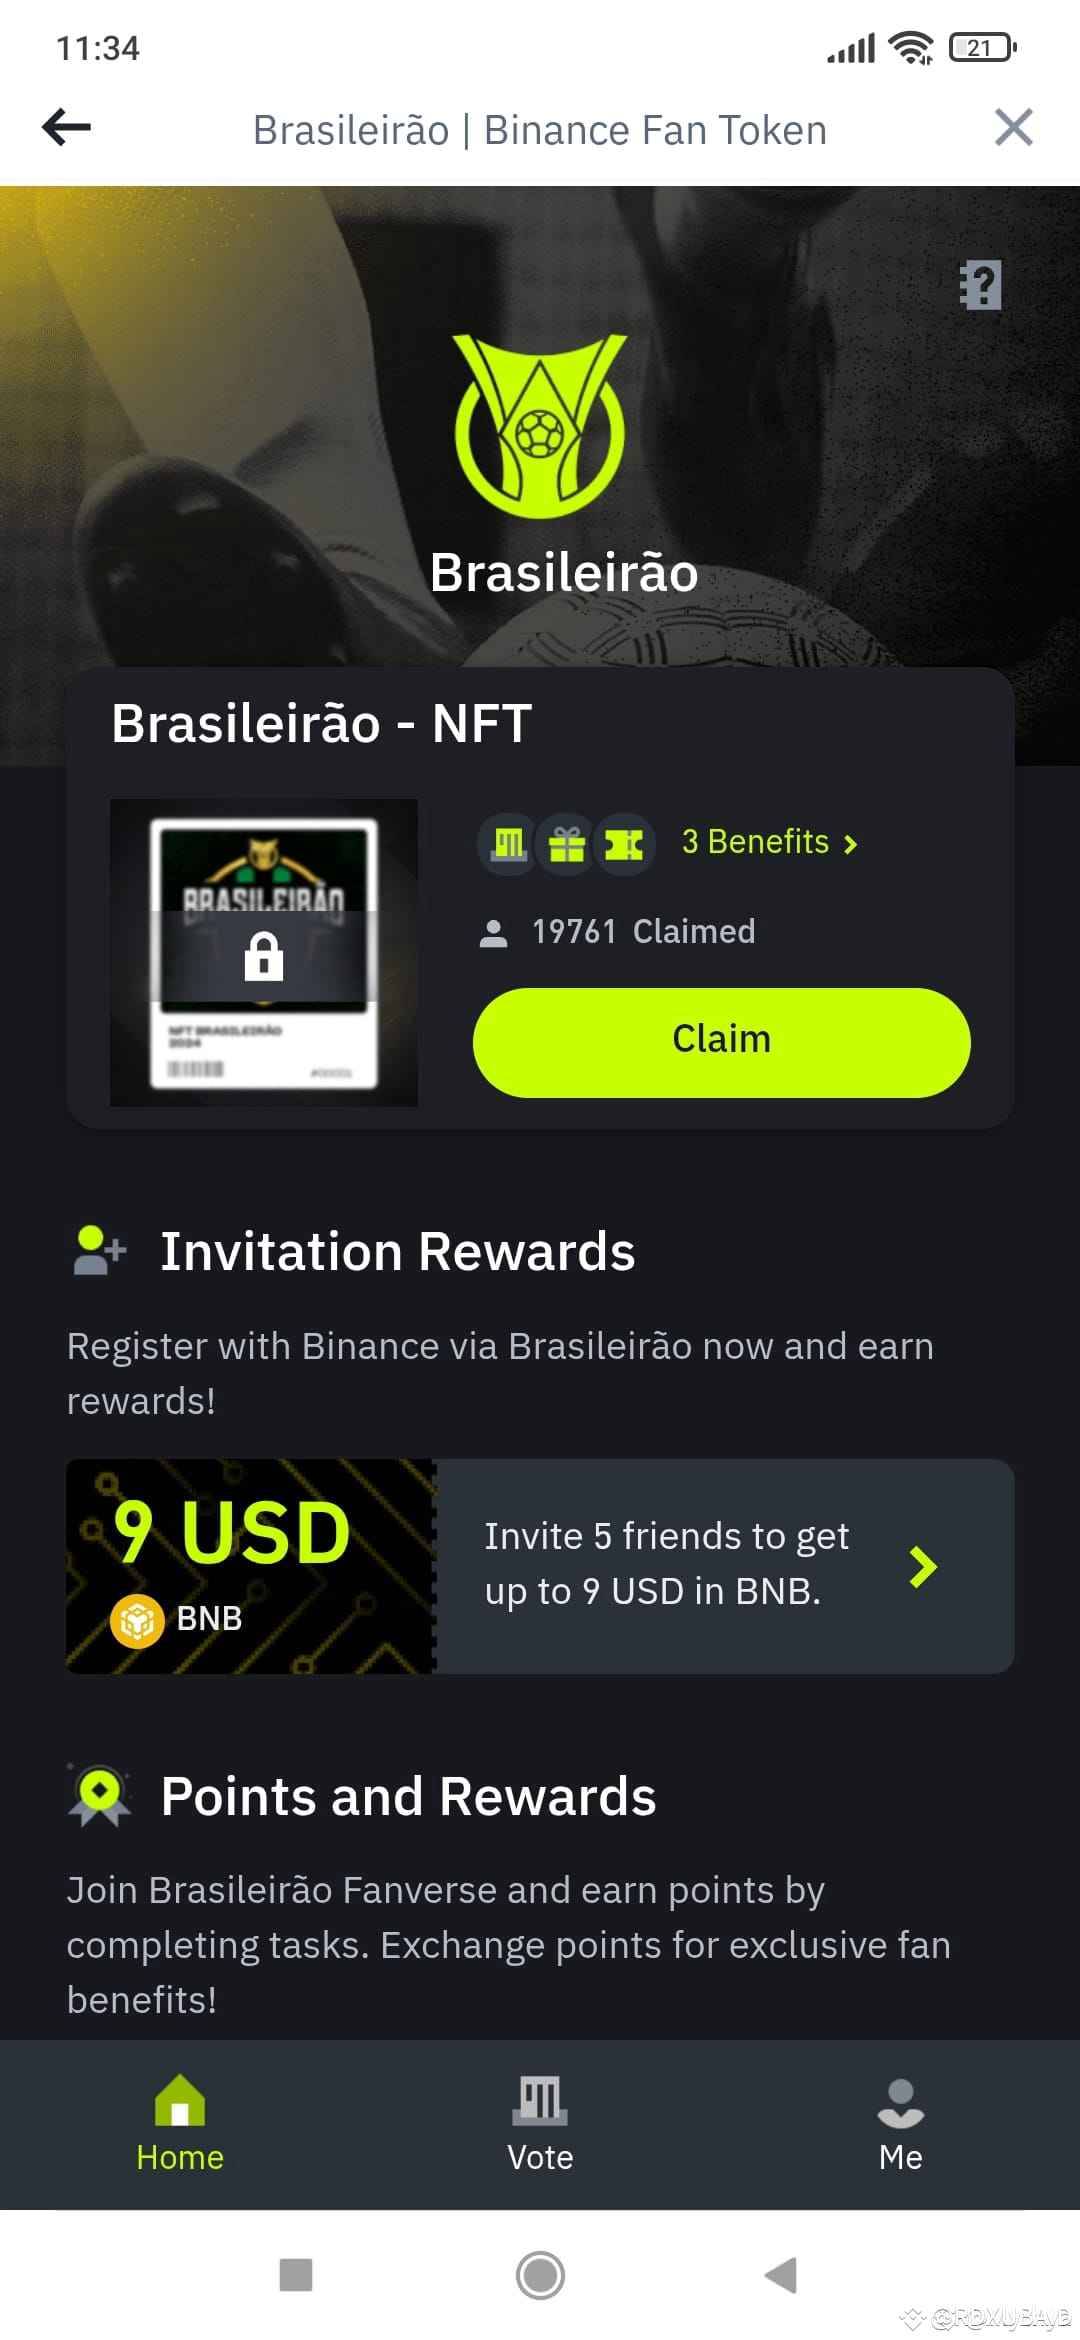
https://www.binance.com/fan-token/BWS/CBF?utm_source=fan-token&ref=511276305®isterChannel=cbf&utm_campaign=cbf-fanverse-invite | join fasy only three days left to get 10$ per day
https://www.binance.com/fan-token/BWS/CBF?utm_source=fan-token&ref=511276305®isterChannel=cbf&utm_campaign=cbf-fanverse-invite | join fasy only three days left to get 10$ per day
12
117
·
--
Tarjimani ko‘rish
how to get gift Christmas
how to get gift Christmas

Megas Crypto
·
--
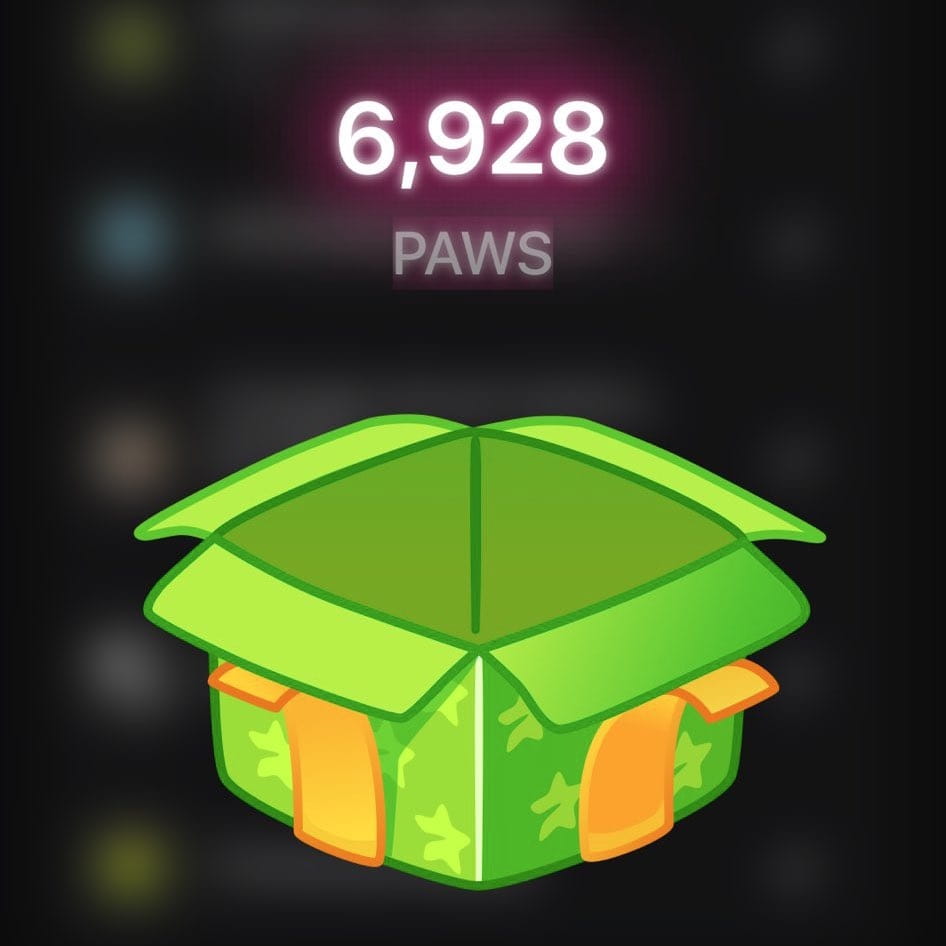
How much PAWS have you got for a special Christmas quest?! 🤔🐾
178
Ko‘proq kontentni ko‘rish uchun tizimga kiring
Binance Square'da global kriptovalyuta foydalanuvchilariga qo‘shiling
⚡️ Kriptovalyuta haqida eng so‘nggi va foydali ma’lumotlarni oling.
💬 Dunyoning eng yirik kriptovalyuta birjasi tomonidan ishonchli deb topilgan.
👍 Tasdiqlangan mualliflardan haqiqiy tahlillarni kashf eting.
Email / telefon raqami
Trenddagi mavzular
BinanceReopensWithdrawalsForMoreAssets
623,357 marta koʻrilgan
3,023 muhokama qilmoqda
Xavfsizlik hodisasi | Tiklanish bo‘yicha yangilanish #8: Yana ko‘proq aktivlar uchun pul yechish qayta ochiladi (2026-11-05)
Binance Announcement
·158 ta layk
·501.4k marta koʻrilgan
BTCRebounds80K
136,520 marta koʻrilgan
1,322 muhokama qilmoqda
Binance98PercentReplenished
70,889 marta koʻrilgan
916 muhokama qilmoqda