
#soxl
soxl
864,941 marta koʻrilgan
6,005 muhokama qilmoqda
Ommabop
Eng so‘nggi

·
--
Tasdiqlangan
#SOXL
SOXL 30% ga qulab tushdi
AI pufagi yorildimi?
Qayta-qayta aytganman: leverajli ETF sotib olmang,
leverajli ETF bo‘yicha kontraktlar ochish esa undan ham yomon.
Butun bozordagi son-sanoqsiz odamlar yana katta zarar ko‘rdi.
Moliya bozorida uzoq yashab qolish har doim eng muhimi.
#SOXL
SOXL 30% ga qulab tushdi
AI pufagi yorildimi?
Qayta-qayta aytganman: leverajli ETF sotib olmang,
leverajli ETF bo‘yicha kontraktlar ochish esa undan ham yomon.
Butun bozordagi son-sanoqsiz odamlar yana katta zarar ko‘rdi.
Moliya bozorida uzoq yashab qolish har doim eng muhimi.
SOXL 30% ga qulab tushdi
AI pufagi yorildimi?
Qayta-qayta aytganman: leverajli ETF sotib olmang,
leverajli ETF bo‘yicha kontraktlar ochish esa undan ham yomon.
Butun bozordagi son-sanoqsiz odamlar yana katta zarar ko‘rdi.
Moliya bozorida uzoq yashab qolish har doim eng muhimi.
国王与乞丐:
很多人甚至不知道etf原理 一直喊着抄底抄底
16
35
29.4k

·
--
Tasdiqlangan
SOXL 107 dollardan 40 dollargacha tushdi, men esa 43 dollardan sotib oldim! Ammo yarimo‘tkazgichlar bozoriga uzoq muddatli qarashim hamon pessimistikSo‘nggi paytlarda SOXL’ni tinimsiz kuzatyapman: narxi 100 dollardan oshiq darajadan 40 dollar atrofilarigacha tushdi — bor-yo‘g‘i bir necha savdo kunida 60 foizdan ko‘proq pasaydi.
Rostini aytsam, narxning bunday tushishi kutganimdan ham oshib ketdi.
Avvaldan yarimo‘tkazgichlar bozoriga pessimistik qarab kelardim: sun’iy intellektga kapital xarajatlar haddan tashqari katta, chiplar bahosi juda qimmat, qolaversa, yarimo‘tkazgichlar sohasidagi joriy o‘sish davrining ikkinchi yarmi boshlanib bo‘lgan bo‘lishi mumkin, deb hisoblayman.
Bu fikrlarimdan hozirgacha ham qaytganim yo‘q.
Ammo SOXL’ni 43 dollardan 8 baravar yelka bilan sotib oldim.
Nega?
Chunki mening fikrimcha, bu galgi pasayish endi faqat fundamental omillar bilan bog‘liq emas. Siyosiy kurash, mablag‘larning bozordan vahimali chiqib ketishi va bozor sarosimasi bir-biriga qo‘shilib ketdi, shu bois qisqa muddatda pasayish haddan oshgandek ko‘rinadi.
SOXL 107 dollardan 40 dollargacha tushdi, men esa 43 dollardan sotib oldim! Ammo yarimo‘tkazgichlar bozoriga uzoq muddatli qarashim hamon pessimistik
So‘nggi paytlarda SOXL’ni tinimsiz kuzatyapman: narxi 100 dollardan oshiq darajadan 40 dollar atrofilarigacha tushdi — bor-yo‘g‘i bir necha savdo kunida 60 foizdan ko‘proq pasaydi.
Rostini aytsam, narxning bunday tushishi kutganimdan ham oshib ketdi.
Avvaldan yarimo‘tkazgichlar bozoriga pessimistik qarab kelardim: sun’iy intellektga kapital xarajatlar haddan tashqari katta, chiplar bahosi juda qimmat, qolaversa, yarimo‘tkazgichlar sohasidagi joriy o‘sish davrining ikkinchi yarmi boshlanib bo‘lgan bo‘lishi mumkin, deb hisoblayman.
Bu fikrlarimdan hozirgacha ham qaytganim yo‘q.
Ammo SOXL’ni 43 dollardan 8 baravar yelka bilan sotib oldim.
Nega?
Chunki mening fikrimcha, bu galgi pasayish endi faqat fundamental omillar bilan bog‘liq emas. Siyosiy kurash, mablag‘larning bozordan vahimali chiqib ketishi va bozor sarosimasi bir-biriga qo‘shilib ketdi, shu bois qisqa muddatda pasayish haddan oshgandek ko‘rinadi.
Rostini aytsam, narxning bunday tushishi kutganimdan ham oshib ketdi.
Avvaldan yarimo‘tkazgichlar bozoriga pessimistik qarab kelardim: sun’iy intellektga kapital xarajatlar haddan tashqari katta, chiplar bahosi juda qimmat, qolaversa, yarimo‘tkazgichlar sohasidagi joriy o‘sish davrining ikkinchi yarmi boshlanib bo‘lgan bo‘lishi mumkin, deb hisoblayman.
Bu fikrlarimdan hozirgacha ham qaytganim yo‘q.
Ammo SOXL’ni 43 dollardan 8 baravar yelka bilan sotib oldim.
Nega?
Chunki mening fikrimcha, bu galgi pasayish endi faqat fundamental omillar bilan bog‘liq emas. Siyosiy kurash, mablag‘larning bozordan vahimali chiqib ketishi va bozor sarosimasi bir-biriga qo‘shilib ketdi, shu bois qisqa muddatda pasayish haddan oshgandek ko‘rinadi.
1.4k

·
--
Qisman to‘g‘ri
Tarjimani ko‘rish
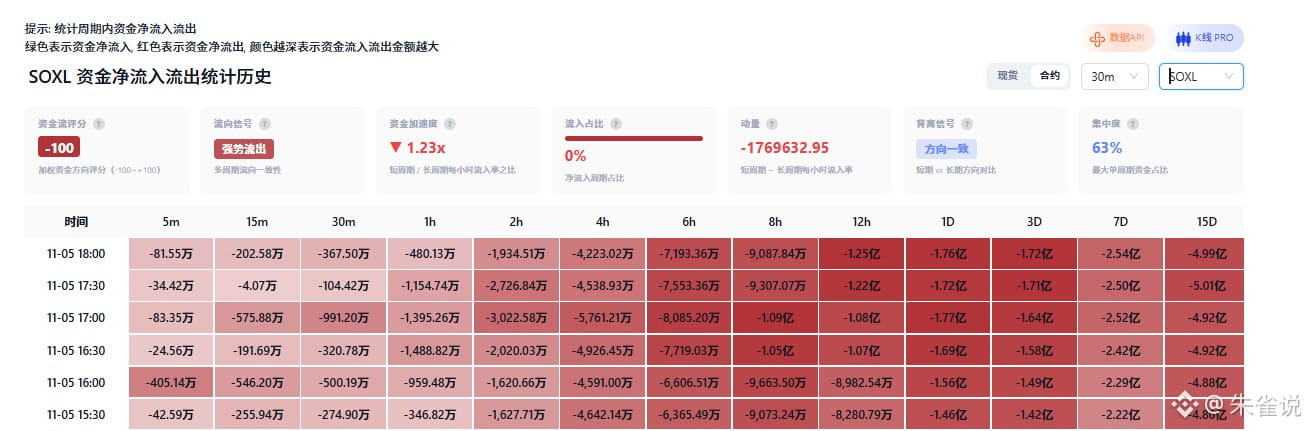
$SOXL 从78砸到59,单边趋势已经打开,空单要继续发大财!
宝子们,这就是板块恐慌下的结构性崩塌!
消息面:三把刀刀刀见血:
第一,选举落地,AI数据中心审批眼看要收紧,半导体板块最惨的就是soxl了
第二,英伟达财报再好也带不动大盘,说明动能耗尽,AI基建增速见顶
第三,最狠的杠杆损耗!3倍ETF每天重置,震荡下跌里拿着就是被钝刀子割肉,时间绝对是空头的朋友!
技术面:
65.52的关键支撑一破,直接成了头顶的铁顶。下方59.73就是最后一道闸门!一旦放量跌破,下面的止损盘和爆仓盘会被一起扫掉,进入毫无接盘的“滑行真空区”。
还在观望的,不用再犹豫了,今天反弹就是进场机会!
朱雀建议:
品种:SOXL
方向:空
现价直接进入,补仓65.5
目标:55.0——50.0
盈亏比超级划算#SOXL #美国10年期国债收益率跌至4.845%
$SOXL 从78砸到59,单边趋势已经打开,空单要继续发大财!
宝子们,这就是板块恐慌下的结构性崩塌!
消息面:三把刀刀刀见血:
第一,选举落地,AI数据中心审批眼看要收紧,半导体板块最惨的就是soxl了
第二,英伟达财报再好也带不动大盘,说明动能耗尽,AI基建增速见顶
第三,最狠的杠杆损耗!3倍ETF每天重置,震荡下跌里拿着就是被钝刀子割肉,时间绝对是空头的朋友!
技术面:
65.52的关键支撑一破,直接成了头顶的铁顶。下方59.73就是最后一道闸门!一旦放量跌破,下面的止损盘和爆仓盘会被一起扫掉,进入毫无接盘的“滑行真空区”。
还在观望的,不用再犹豫了,今天反弹就是进场机会!
朱雀建议:
品种:SOXL
方向:空
现价直接进入,补仓65.5
目标:55.0——50.0
盈亏比超级划算#SOXL #美国10年期国债收益率跌至4.845%
宝子们,这就是板块恐慌下的结构性崩塌!
消息面:三把刀刀刀见血:
第一,选举落地,AI数据中心审批眼看要收紧,半导体板块最惨的就是soxl了
第二,英伟达财报再好也带不动大盘,说明动能耗尽,AI基建增速见顶
第三,最狠的杠杆损耗!3倍ETF每天重置,震荡下跌里拿着就是被钝刀子割肉,时间绝对是空头的朋友!
技术面:
65.52的关键支撑一破,直接成了头顶的铁顶。下方59.73就是最后一道闸门!一旦放量跌破,下面的止损盘和爆仓盘会被一起扫掉,进入毫无接盘的“滑行真空区”。
还在观望的,不用再犹豫了,今天反弹就是进场机会!
朱雀建议:
品种:SOXL
方向:空
现价直接进入,补仓65.5
目标:55.0——50.0
盈亏比超级划算#SOXL #美国10年期国债收益率跌至4.845%
倔强小马:
预计不会跌破55,差不多本轮最低点了
4
2
1
3.8k
·
--
Tasdiqlangan
Maqola
Tarjimani ko‘rish
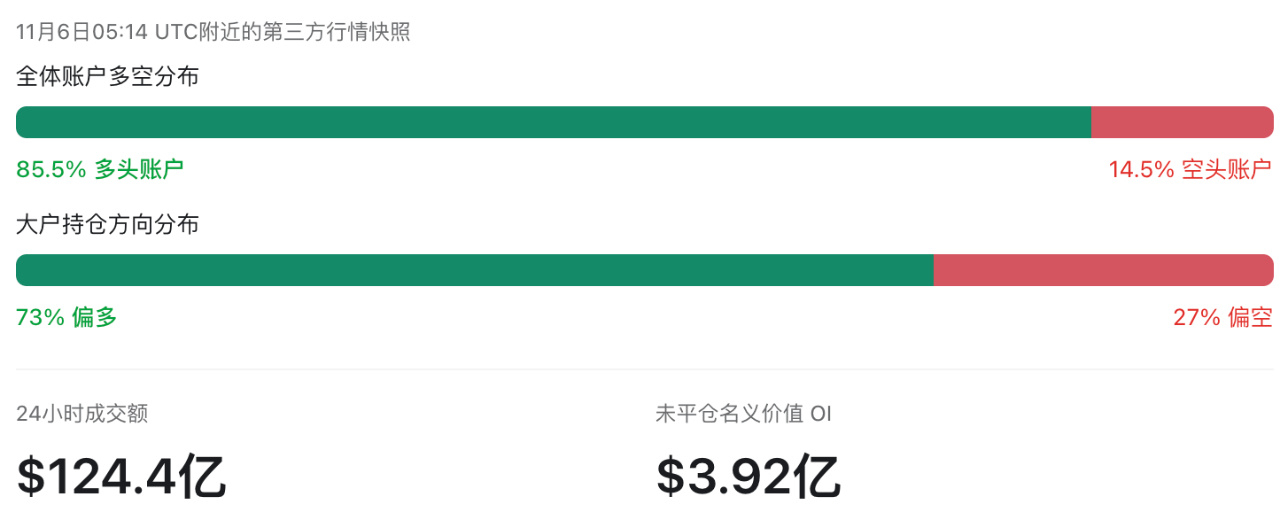
SOXL在币安24小时成交120多亿美元,仅次于BTC和ETH!大跌之后,一个非常夸张的现象:
SOXLUSDT在币安24小时成交额超过120亿美元,仅次于比特币和ETH。 连闪迪SNDK的合约成交量也非常高。
现在SOXL上面,可能挤满了抄底的人、被套牢的人,以及随时准备兑现利润的短线资金。
这些钱到底是在抄底,还是在互相收割?
目前SOXL最麻烦的,是上面一层又一层的卖盘
我觉得目前市场至少有三批人。
第一批,70—100美元附近买入的人。
这里面肯定有不少已经止损或被强平,但仍然持有的人,可能只想等反弹少亏一点就走。
第二批,60美元附近抄底的人。
这批人我觉得特别值得关注,
因为SOXL跌到60美元时,已经跌了很多,当时肯定有人觉得差不多到底了。
结果直接跌到了40美元附近。
等后面反弹到50—55美元,一部分人可能就会想:算了,先少亏一点,赶紧跑吧。
第三批,40美元附近进场的人。
这批人成本低,反弹到50美元就已经有不错的收益。
尤其叠加合约杠杆以后,很多短线资金可能根本不打算长期拿着。
所以问题来了:
SOXL越往上涨,可能越有人想卖。
有人止盈,有人减亏,有人等回本。
这也是为什么我认为后面即使出现反弹,也未必能一路顺畅地涨回60、70美元。
当然,这些潜在卖盘有多大,还需要看实际成交,不能仅凭成本价判断。
现在的SOXL,多头情绪很拥挤,真正的上涨趋势却还没有形成。
而且一旦抛压减弱,空头集中回补,也可能带来猛烈反弹。
所以我认为接下来很可能还有剧烈震荡,而不是简单的单边上涨。
我43美元做多了,但我只吃一波涨幅
前面我在43美元附近开了SOXL多单,8倍杠杆。
逻辑很简单:我认为半导体中长期仍有估值和周期风险,但这次政治消息叠加恐慌抛售,短期跌得有些过度,值得小仓位博一轮反弹;
这个判断目前没变。
55美元是我主要考虑兑现利润的位置,65美元只是强反弹情况下的延伸目标。
如果涨到55美元,买盘明显跟不上,我会考虑先落袋一部分。
如果整个半导体板块持续回升,主动买盘增强,再考虑继续拿。
我仍然长期偏空半导体,但短期看好超跌反弹。
只不过,现在SOXL合约的交易已经太拥挤了。
高位有套牢盘,中间有抄底失败的人,低位又进来了大量想赚快钱的杠杆资金。
我认为后续反弹会有机会,但也会不断遇到兑现压力。没有持续的新买盘,想顺畅地回到60、70美元并不容易。
我做多只是想吃一段反弹,不是赌它重新进入牛市。
还有,成交量大不代表都在看多;是大量交易者在反复抄底、止损、平仓,互相博弈。
SOXL现在就是这种状态。
市场上所有人都觉得这里有钱赚,但最终谁能把利润真正拿走,才是最有意思的。
#SOXL #半导体 #英伟达 #闪迪 #美股超话
仅记录个人思考,不构成投资建议。
SOXL在币安24小时成交120多亿美元,仅次于BTC和ETH!
大跌之后,一个非常夸张的现象:
SOXLUSDT在币安24小时成交额超过120亿美元,仅次于比特币和ETH。 连闪迪SNDK的合约成交量也非常高。
现在SOXL上面,可能挤满了抄底的人、被套牢的人,以及随时准备兑现利润的短线资金。
这些钱到底是在抄底,还是在互相收割?
目前SOXL最麻烦的,是上面一层又一层的卖盘
我觉得目前市场至少有三批人。
第一批,70—100美元附近买入的人。
这里面肯定有不少已经止损或被强平,但仍然持有的人,可能只想等反弹少亏一点就走。
第二批,60美元附近抄底的人。
这批人我觉得特别值得关注,
因为SOXL跌到60美元时,已经跌了很多,当时肯定有人觉得差不多到底了。
结果直接跌到了40美元附近。
等后面反弹到50—55美元,一部分人可能就会想:算了,先少亏一点,赶紧跑吧。
第三批,40美元附近进场的人。
这批人成本低,反弹到50美元就已经有不错的收益。
尤其叠加合约杠杆以后,很多短线资金可能根本不打算长期拿着。
所以问题来了:
SOXL越往上涨,可能越有人想卖。
有人止盈,有人减亏,有人等回本。
这也是为什么我认为后面即使出现反弹,也未必能一路顺畅地涨回60、70美元。
当然,这些潜在卖盘有多大,还需要看实际成交,不能仅凭成本价判断。
现在的SOXL,多头情绪很拥挤,真正的上涨趋势却还没有形成。
而且一旦抛压减弱,空头集中回补,也可能带来猛烈反弹。
所以我认为接下来很可能还有剧烈震荡,而不是简单的单边上涨。
我43美元做多了,但我只吃一波涨幅
前面我在43美元附近开了SOXL多单,8倍杠杆。
逻辑很简单:我认为半导体中长期仍有估值和周期风险,但这次政治消息叠加恐慌抛售,短期跌得有些过度,值得小仓位博一轮反弹;
这个判断目前没变。
55美元是我主要考虑兑现利润的位置,65美元只是强反弹情况下的延伸目标。
如果涨到55美元,买盘明显跟不上,我会考虑先落袋一部分。
如果整个半导体板块持续回升,主动买盘增强,再考虑继续拿。
我仍然长期偏空半导体,但短期看好超跌反弹。
只不过,现在SOXL合约的交易已经太拥挤了。
高位有套牢盘,中间有抄底失败的人,低位又进来了大量想赚快钱的杠杆资金。
我认为后续反弹会有机会,但也会不断遇到兑现压力。没有持续的新买盘,想顺畅地回到60、70美元并不容易。
我做多只是想吃一段反弹,不是赌它重新进入牛市。
还有,成交量大不代表都在看多;是大量交易者在反复抄底、止损、平仓,互相博弈。
SOXL现在就是这种状态。
市场上所有人都觉得这里有钱赚,但最终谁能把利润真正拿走,才是最有意思的。
#SOXL #半导体 #英伟达 #闪迪 #美股超话
仅记录个人思考,不构成投资建议。
SOXLUSDT在币安24小时成交额超过120亿美元,仅次于比特币和ETH。 连闪迪SNDK的合约成交量也非常高。
现在SOXL上面,可能挤满了抄底的人、被套牢的人,以及随时准备兑现利润的短线资金。
这些钱到底是在抄底,还是在互相收割?
目前SOXL最麻烦的,是上面一层又一层的卖盘
我觉得目前市场至少有三批人。
第一批,70—100美元附近买入的人。
这里面肯定有不少已经止损或被强平,但仍然持有的人,可能只想等反弹少亏一点就走。
第二批,60美元附近抄底的人。
这批人我觉得特别值得关注,
因为SOXL跌到60美元时,已经跌了很多,当时肯定有人觉得差不多到底了。
结果直接跌到了40美元附近。
等后面反弹到50—55美元,一部分人可能就会想:算了,先少亏一点,赶紧跑吧。
第三批,40美元附近进场的人。
这批人成本低,反弹到50美元就已经有不错的收益。
尤其叠加合约杠杆以后,很多短线资金可能根本不打算长期拿着。
所以问题来了:
SOXL越往上涨,可能越有人想卖。
有人止盈,有人减亏,有人等回本。
这也是为什么我认为后面即使出现反弹,也未必能一路顺畅地涨回60、70美元。
当然,这些潜在卖盘有多大,还需要看实际成交,不能仅凭成本价判断。
现在的SOXL,多头情绪很拥挤,真正的上涨趋势却还没有形成。
而且一旦抛压减弱,空头集中回补,也可能带来猛烈反弹。
所以我认为接下来很可能还有剧烈震荡,而不是简单的单边上涨。
我43美元做多了,但我只吃一波涨幅
前面我在43美元附近开了SOXL多单,8倍杠杆。
逻辑很简单:我认为半导体中长期仍有估值和周期风险,但这次政治消息叠加恐慌抛售,短期跌得有些过度,值得小仓位博一轮反弹;
这个判断目前没变。
55美元是我主要考虑兑现利润的位置,65美元只是强反弹情况下的延伸目标。
如果涨到55美元,买盘明显跟不上,我会考虑先落袋一部分。
如果整个半导体板块持续回升,主动买盘增强,再考虑继续拿。
我仍然长期偏空半导体,但短期看好超跌反弹。
只不过,现在SOXL合约的交易已经太拥挤了。
高位有套牢盘,中间有抄底失败的人,低位又进来了大量想赚快钱的杠杆资金。
我认为后续反弹会有机会,但也会不断遇到兑现压力。没有持续的新买盘,想顺畅地回到60、70美元并不容易。
我做多只是想吃一段反弹,不是赌它重新进入牛市。
还有,成交量大不代表都在看多;是大量交易者在反复抄底、止损、平仓,互相博弈。
SOXL现在就是这种状态。
市场上所有人都觉得这里有钱赚,但最终谁能把利润真正拿走,才是最有意思的。
#SOXL #半导体 #英伟达 #闪迪 #美股超话
仅记录个人思考,不构成投资建议。
Ula Frances:
SOXL不是三倍半导体ETF吗,啥时候跑币安来了?这是成交量起飞了,还是代码串台了😂
1
2
919

·
--
O‘suvchi
#SOXL bo‘yicha ilk bor 169 yuandan yuqori narxda long pozitsiya ochdim, keyin esa narx silliqqina tushishda davom etdi. 105 gacha chidadim, o‘shanda zararim 1w+U ga yetgan edi. O‘sha paytda likvidatsiya narxi 69 edi — anchagina uzoqdek ko‘ringan, yetib bormaydi deb o‘ylagan narx. Natijada, o‘sha gapning ma’nosini rostdan ham tushundim: AQSh aksiyalari haqida hech qachon haddan tashqari optimistik bo‘lmang. Ular bundan ortiq tushmaydi, deb o‘ylamang.
Yaxshiyamki, narx qayta ko‘tarilayotganida, 105 da zarar bilan pozitsiyadan chiqdim. Umid qilamanki, narx pastlaganda yana kiraman. Ammo past nuqta qachon keladi? Ilgari 105 ni juda past narx deb hisoblaganman. Lekin endi yana 105 ga qaytishi uchun qariyb 40% ko‘tarilishi kerak. Uch karra kredit yelkasi bilan savdo qilinadigan aktivlarga baribir ehtiyotkorlik bilan yondashish kerak.
Xo‘sh, deb atalgan tub nuqta qachon paydo bo‘ladi o‘zi?
#SOXL bo‘yicha ilk bor 169 yuandan yuqori narxda long pozitsiya ochdim, keyin esa narx silliqqina tushishda davom etdi. 105 gacha chidadim, o‘shanda zararim 1w+U ga yetgan edi. O‘sha paytda likvidatsiya narxi 69 edi — anchagina uzoqdek ko‘ringan, yetib bormaydi deb o‘ylagan narx. Natijada, o‘sha gapning ma’nosini rostdan ham tushundim: AQSh aksiyalari haqida hech qachon haddan tashqari optimistik bo‘lmang. Ular bundan ortiq tushmaydi, deb o‘ylamang.
Yaxshiyamki, narx qayta ko‘tarilayotganida, 105 da zarar bilan pozitsiyadan chiqdim. Umid qilamanki, narx pastlaganda yana kiraman. Ammo past nuqta qachon keladi? Ilgari 105 ni juda past narx deb hisoblaganman. Lekin endi yana 105 ga qaytishi uchun qariyb 40% ko‘tarilishi kerak. Uch karra kredit yelkasi bilan savdo qilinadigan aktivlarga baribir ehtiyotkorlik bilan yondashish kerak.
Xo‘sh, deb atalgan tub nuqta qachon paydo bo‘ladi o‘zi?
Yaxshiyamki, narx qayta ko‘tarilayotganida, 105 da zarar bilan pozitsiyadan chiqdim. Umid qilamanki, narx pastlaganda yana kiraman. Ammo past nuqta qachon keladi? Ilgari 105 ni juda past narx deb hisoblaganman. Lekin endi yana 105 ga qaytishi uchun qariyb 40% ko‘tarilishi kerak. Uch karra kredit yelkasi bilan savdo qilinadigan aktivlarga baribir ehtiyotkorlik bilan yondashish kerak.
Xo‘sh, deb atalgan tub nuqta qachon paydo bo‘ladi o‘zi?
币胜客88:
我吃反弹亏了,但你看我说的对不对吧
7
6
12.1k
·
--
Pasayuvchi
Tarjimani ko‘rish
这次大暴跌真的长见识了。还是要敬畏市场,展开想象力。别觉得某个价格不可能到。soxl我之前爆仓价69,我从169扛下来。虽然最后割肉了,但内心深处从没想过这货会跌到四十几。
大暴跌趋势刚开始的时候,还会有两三次像样的反弹。只是那时候自己太菜没有抓住机会解套。结果现在趋势加速期,一两天甚至十五分k连一个像样的反弹都没了。
在这次亏损里,我每天都在复盘自己做了哪些错事。无论是心态、技术上都有很多。总结了几点,怕自己忘了,记录下来常看常新提醒自己
1、趋势已成的时候,摸顶摸底都要小心。永远说顺势而为,又忍不住去做左侧。最后在这种行情摸在半山腰。知行不合一。
2、反弹的行情,就是吃一口就跑,憋想着格局。我前几天10.7的koru吃到一波反弹到14,当时已经盈利6500u。但我就觉得10.7位置很低了,想格局。结果利润全部回吐,最后保本出局。真正格局,是应该等企稳,右侧买入。
2、千万不能扛单,一定要设置好止损。哪怕打损后又回去了,也别觉得做错。这个交易纪律很反人性,极度放大自己的损失厌恶心理。所以一定要刻意练习,练习到麻木,练习到不设止损就像裸奔一样,浑身不得劲。这个关键时刻真的能救命。咱们在这个市场能赚钱的前提是活着。
3、周围的声音很杂,很容易被影响上头乱操作。作为新手,不能说绝对能改掉。但希望自己这种错误能少犯。一点一点,越来越少。
4、亏损后,一定要管住手不要为了赚回来乱开单。从心态、技术还有玄学的角度,都很容易频繁亏损,从小亏变大亏。
先写这几点。最近行情太不好,乘着这时候还是要多学习。准备先看《高胜算操盘》。
今天的大暴跌下,我关注的很多大佬都亏的很严重。庆幸自己胆子小谨慎没做。或许,这一点点得逃过一劫,是一个好的开始。#soxl
这次大暴跌真的长见识了。还是要敬畏市场,展开想象力。别觉得某个价格不可能到。soxl我之前爆仓价69,我从169扛下来。虽然最后割肉了,但内心深处从没想过这货会跌到四十几。
大暴跌趋势刚开始的时候,还会有两三次像样的反弹。只是那时候自己太菜没有抓住机会解套。结果现在趋势加速期,一两天甚至十五分k连一个像样的反弹都没了。
在这次亏损里,我每天都在复盘自己做了哪些错事。无论是心态、技术上都有很多。总结了几点,怕自己忘了,记录下来常看常新提醒自己
1、趋势已成的时候,摸顶摸底都要小心。永远说顺势而为,又忍不住去做左侧。最后在这种行情摸在半山腰。知行不合一。
2、反弹的行情,就是吃一口就跑,憋想着格局。我前几天10.7的koru吃到一波反弹到14,当时已经盈利6500u。但我就觉得10.7位置很低了,想格局。结果利润全部回吐,最后保本出局。真正格局,是应该等企稳,右侧买入。
2、千万不能扛单,一定要设置好止损。哪怕打损后又回去了,也别觉得做错。这个交易纪律很反人性,极度放大自己的损失厌恶心理。所以一定要刻意练习,练习到麻木,练习到不设止损就像裸奔一样,浑身不得劲。这个关键时刻真的能救命。咱们在这个市场能赚钱的前提是活着。
3、周围的声音很杂,很容易被影响上头乱操作。作为新手,不能说绝对能改掉。但希望自己这种错误能少犯。一点一点,越来越少。
4、亏损后,一定要管住手不要为了赚回来乱开单。从心态、技术还有玄学的角度,都很容易频繁亏损,从小亏变大亏。
先写这几点。最近行情太不好,乘着这时候还是要多学习。准备先看《高胜算操盘》。
今天的大暴跌下,我关注的很多大佬都亏的很严重。庆幸自己胆子小谨慎没做。或许,这一点点得逃过一劫,是一个好的开始。#soxl
大暴跌趋势刚开始的时候,还会有两三次像样的反弹。只是那时候自己太菜没有抓住机会解套。结果现在趋势加速期,一两天甚至十五分k连一个像样的反弹都没了。
在这次亏损里,我每天都在复盘自己做了哪些错事。无论是心态、技术上都有很多。总结了几点,怕自己忘了,记录下来常看常新提醒自己
1、趋势已成的时候,摸顶摸底都要小心。永远说顺势而为,又忍不住去做左侧。最后在这种行情摸在半山腰。知行不合一。
2、反弹的行情,就是吃一口就跑,憋想着格局。我前几天10.7的koru吃到一波反弹到14,当时已经盈利6500u。但我就觉得10.7位置很低了,想格局。结果利润全部回吐,最后保本出局。真正格局,是应该等企稳,右侧买入。
2、千万不能扛单,一定要设置好止损。哪怕打损后又回去了,也别觉得做错。这个交易纪律很反人性,极度放大自己的损失厌恶心理。所以一定要刻意练习,练习到麻木,练习到不设止损就像裸奔一样,浑身不得劲。这个关键时刻真的能救命。咱们在这个市场能赚钱的前提是活着。
3、周围的声音很杂,很容易被影响上头乱操作。作为新手,不能说绝对能改掉。但希望自己这种错误能少犯。一点一点,越来越少。
4、亏损后,一定要管住手不要为了赚回来乱开单。从心态、技术还有玄学的角度,都很容易频繁亏损,从小亏变大亏。
先写这几点。最近行情太不好,乘着这时候还是要多学习。准备先看《高胜算操盘》。
今天的大暴跌下,我关注的很多大佬都亏的很严重。庆幸自己胆子小谨慎没做。或许,这一点点得逃过一劫,是一个好的开始。#soxl
2
2.1k
·
--
Tarjimani ko‘rish
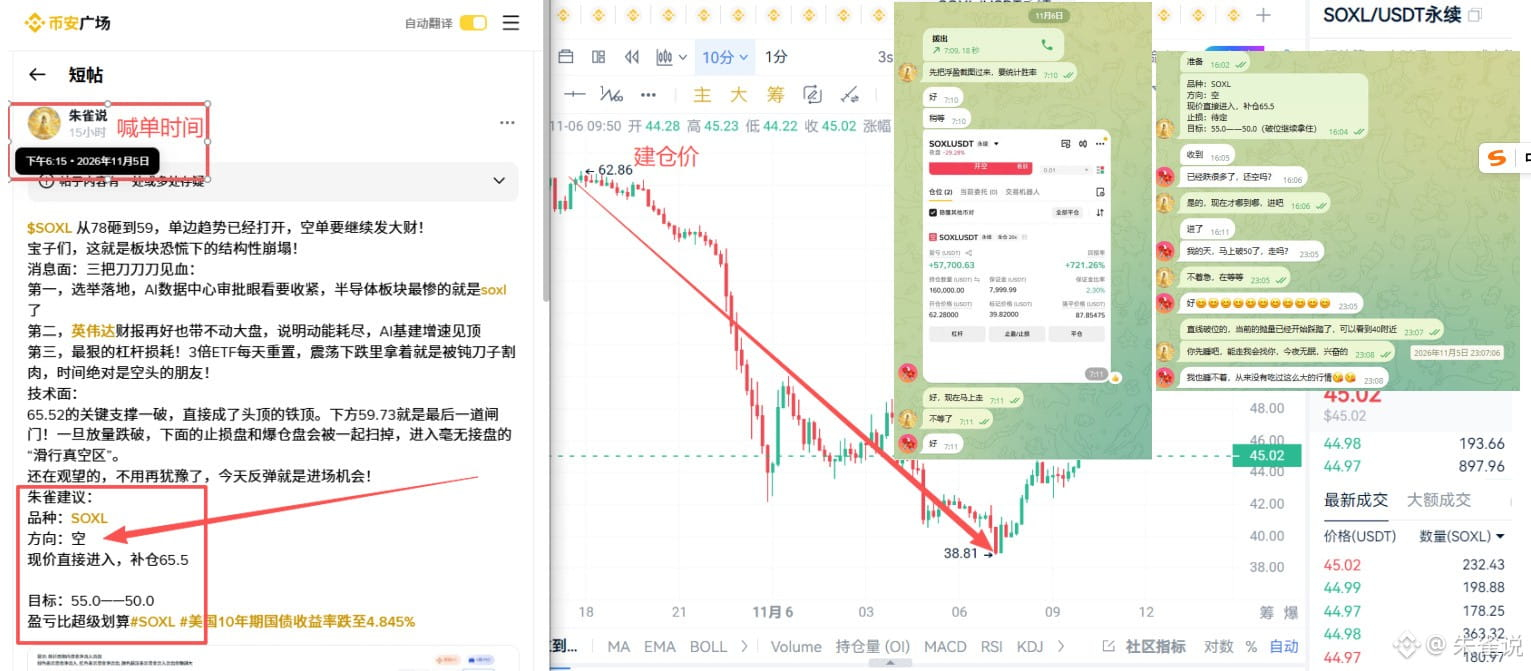
$SOXL 一觉醒来,天塌了,2天亏10万U,接受不了了,币圈还能不能玩?这是上午的一个女粉丝来跟我说的原话,我该怎么安慰她呢?如果昨天她看到我的文章策略,会不会改写命运?听完她的情况午饭的没有心思吃了,10万U就算对一个小康家庭来讲也不是一笔小数,她现在仅剩1.2万了,希望接下来,可以真真切切帮到她的什么吧!#SOXL #大非农 #美股走弱,加密货币市场普遍承压
$SOXL 一觉醒来,天塌了,2天亏10万U,接受不了了,币圈还能不能玩?这是上午的一个女粉丝来跟我说的原话,我该怎么安慰她呢?如果昨天她看到我的文章策略,会不会改写命运?听完她的情况午饭的没有心思吃了,10万U就算对一个小康家庭来讲也不是一笔小数,她现在仅剩1.2万了,希望接下来,可以真真切切帮到她的什么吧!#SOXL #大非农 #美股走弱,加密货币市场普遍承压
朱雀说
·
--
$SOXL 从78砸到59,单边趋势已经打开,空单要继续发大财!
宝子们,这就是板块恐慌下的结构性崩塌!
消息面:三把刀刀刀见血:
第一,选举落地,AI数据中心审批眼看要收紧,半导体板块最惨的就是soxl了
第二,英伟达财报再好也带不动大盘,说明动能耗尽,AI基建增速见顶
第三,最狠的杠杆损耗!3倍ETF每天重置,震荡下跌里拿着就是被钝刀子割肉,时间绝对是空头的朋友!
技术面:
65.52的关键支撑一破,直接成了头顶的铁顶。下方59.73就是最后一道闸门!一旦放量跌破,下面的止损盘和爆仓盘会被一起扫掉,进入毫无接盘的“滑行真空区”。
还在观望的,不用再犹豫了,今天反弹就是进场机会!
朱雀建议:
品种:SOXL
方向:空
现价直接进入,补仓65.5
目标:55.0——50.0
盈亏比超级划算#SOXL #美国10年期国债收益率跌至4.845%
宝子们,这就是板块恐慌下的结构性崩塌!
消息面:三把刀刀刀见血:
第一,选举落地,AI数据中心审批眼看要收紧,半导体板块最惨的就是soxl了
第二,英伟达财报再好也带不动大盘,说明动能耗尽,AI基建增速见顶
第三,最狠的杠杆损耗!3倍ETF每天重置,震荡下跌里拿着就是被钝刀子割肉,时间绝对是空头的朋友!
技术面:
65.52的关键支撑一破,直接成了头顶的铁顶。下方59.73就是最后一道闸门!一旦放量跌破,下面的止损盘和爆仓盘会被一起扫掉,进入毫无接盘的“滑行真空区”。
还在观望的,不用再犹豫了,今天反弹就是进场机会!
朱雀建议:
品种:SOXL
方向:空
现价直接进入,补仓65.5
目标:55.0——50.0
盈亏比超级划算#SOXL #美国10年期国债收益率跌至4.845%
Binance BiBi:
这条内容的核心在讲:作者称一位女粉丝在SOXL相关交易中两天亏损约10万U、账户从约11.2万跌到仅剩1.2万,情绪崩溃并质疑“币圈还能不能玩”;作者表示听完后很受触动,认为10万U对普通家庭不是小数目,并思考该如何安慰她、以及如果她提前看到自己的策略文章是否能避免损失;同时作者借此表达希望接下来能在市场承压(提到大非农、美股走弱、加密市场普遍承压)的环境下更实际地帮助这位粉丝。
2
2
672

·
--
O‘suvchi
💔 $SOXL — BOZORDAGI OG‘IR KUN! 📉
8 000 dollar foydada bo‘lib, uning 2 000 dollar zararga aylanganini ko‘rish juda alam qiladi. Bitta chiqish nuqtasini o‘tkazib yuborish butun savdoni o‘zgartirib yubordi. 😔
Bozorlar tez o‘zgaradi, his-tuyg‘ular esa undan ham tezroq. Ba’zan eng oqilona yo‘l — bir qadam ortga chekinish, tanaffus qilish va xotirjamligingizni asrash.
Hech bir savdo o‘z muvozanatingizni yo‘qotishga arzimaydi. Ertaga yangi kun. ❤️
#SOXL #StockMarket #TradingLife #RiskManagement
💔 $SOXL — BOZORDAGI OG‘IR KUN! 📉
8 000 dollar foydada bo‘lib, uning 2 000 dollar zararga aylanganini ko‘rish juda alam qiladi. Bitta chiqish nuqtasini o‘tkazib yuborish butun savdoni o‘zgartirib yubordi. 😔
Bozorlar tez o‘zgaradi, his-tuyg‘ular esa undan ham tezroq. Ba’zan eng oqilona yo‘l — bir qadam ortga chekinish, tanaffus qilish va xotirjamligingizni asrash.
Hech bir savdo o‘z muvozanatingizni yo‘qotishga arzimaydi. Ertaga yangi kun. ❤️
#SOXL #StockMarket #TradingLife #RiskManagement
8 000 dollar foydada bo‘lib, uning 2 000 dollar zararga aylanganini ko‘rish juda alam qiladi. Bitta chiqish nuqtasini o‘tkazib yuborish butun savdoni o‘zgartirib yubordi. 😔
Bozorlar tez o‘zgaradi, his-tuyg‘ular esa undan ham tezroq. Ba’zan eng oqilona yo‘l — bir qadam ortga chekinish, tanaffus qilish va xotirjamligingizni asrash.
Hech bir savdo o‘z muvozanatingizni yo‘qotishga arzimaydi. Ertaga yangi kun. ❤️
#SOXL #StockMarket #TradingLife #RiskManagement
Umer btc:
don't be upset dear❤️
1
1
757

·
--
O‘suvchi
Tarjimani ko‘rish
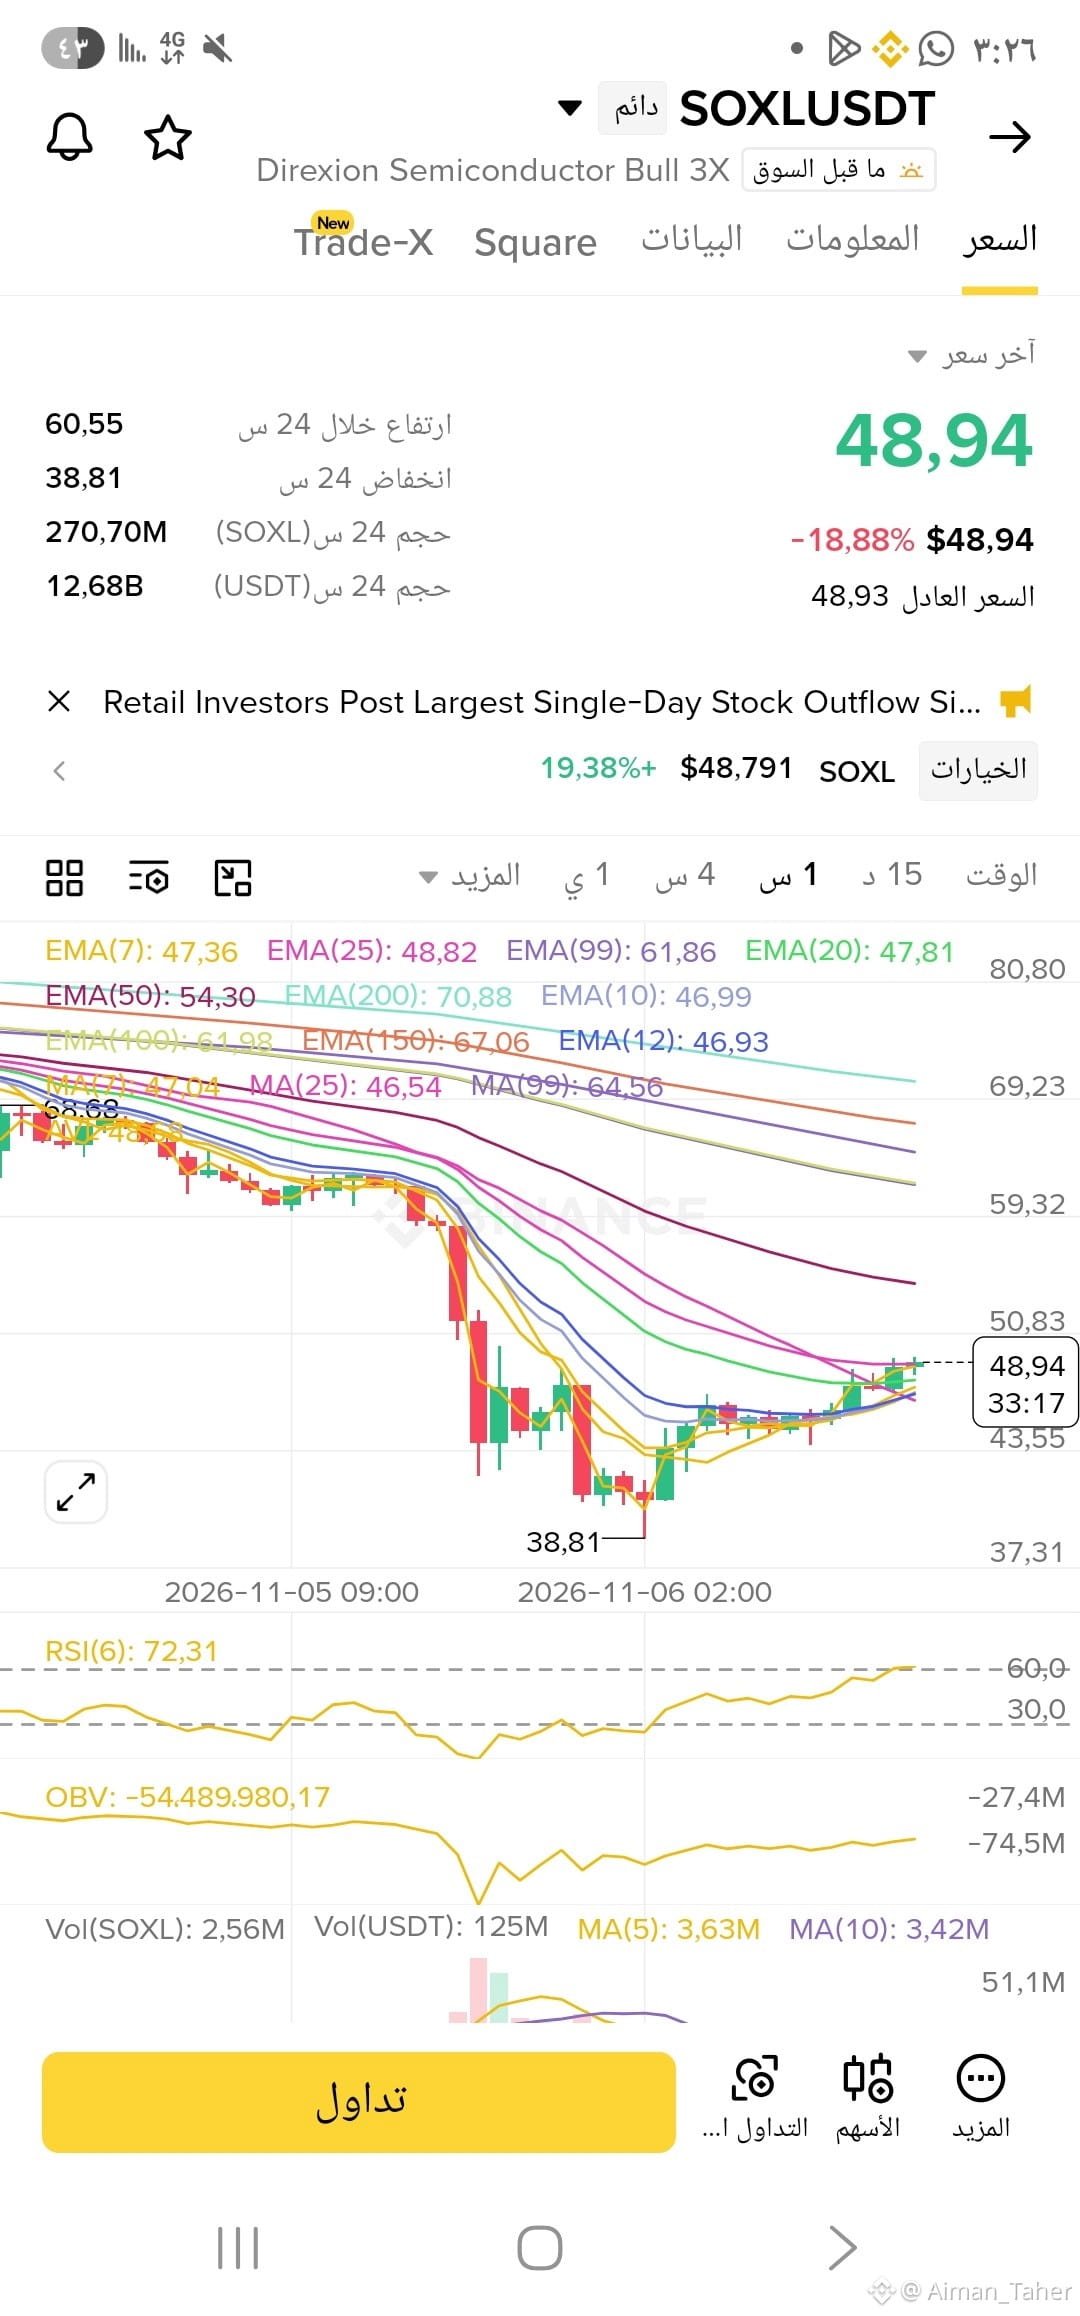
✅ إعداد صفقة (Long) لعملة $SOXL ⚡
حركة سعرية نشطة تعكس محاولات جادة لاختراق مناطق المقاومة وتأكيد الزخم الصاعد نحو الأهداف المرتقبة.
منطقة الدخول: 48
الأهداف :
الهدف الأول: 50.83
الهدف الثاني: 59.32
الهدف الثالث: 69.23
وقف الخسارة: 38.80
📊 المؤشرات الفنية:
RSI (72.31): زخم شرائي قوي وقائم يدعم استمرار الاندفاع نحو الأعلى بكل ثقة.
MACD: تقاطع إيجابي واضح يؤكد سيطرة المشترين وبداية الانطلاقة.
OBV: تدفقات سيولة تصاعدية تدعم رحلة الصعود بحذر وثبات.
تداول هنا $SOXL
{future}(SOXLUSDT)
#SOXL #Crypto #Binance #Long
✅ إعداد صفقة (Long) لعملة $SOXL ⚡
حركة سعرية نشطة تعكس محاولات جادة لاختراق مناطق المقاومة وتأكيد الزخم الصاعد نحو الأهداف المرتقبة.
منطقة الدخول: 48
الأهداف :
الهدف الأول: 50.83
الهدف الثاني: 59.32
الهدف الثالث: 69.23
وقف الخسارة: 38.80
📊 المؤشرات الفنية:
RSI (72.31): زخم شرائي قوي وقائم يدعم استمرار الاندفاع نحو الأعلى بكل ثقة.
MACD: تقاطع إيجابي واضح يؤكد سيطرة المشترين وبداية الانطلاقة.
OBV: تدفقات سيولة تصاعدية تدعم رحلة الصعود بحذر وثبات.
تداول هنا $SOXL
#SOXL #Crypto #Binance #Long
حركة سعرية نشطة تعكس محاولات جادة لاختراق مناطق المقاومة وتأكيد الزخم الصاعد نحو الأهداف المرتقبة.
منطقة الدخول: 48
الأهداف :
الهدف الأول: 50.83
الهدف الثاني: 59.32
الهدف الثالث: 69.23
وقف الخسارة: 38.80
📊 المؤشرات الفنية:
RSI (72.31): زخم شرائي قوي وقائم يدعم استمرار الاندفاع نحو الأعلى بكل ثقة.
MACD: تقاطع إيجابي واضح يؤكد سيطرة المشترين وبداية الانطلاقة.
OBV: تدفقات سيولة تصاعدية تدعم رحلة الصعود بحذر وثبات.
تداول هنا $SOXL
#SOXL #Crypto #Binance #Long
29

Tarjimani ko‘rish
$SOXL
{future}(SOXLUSDT)
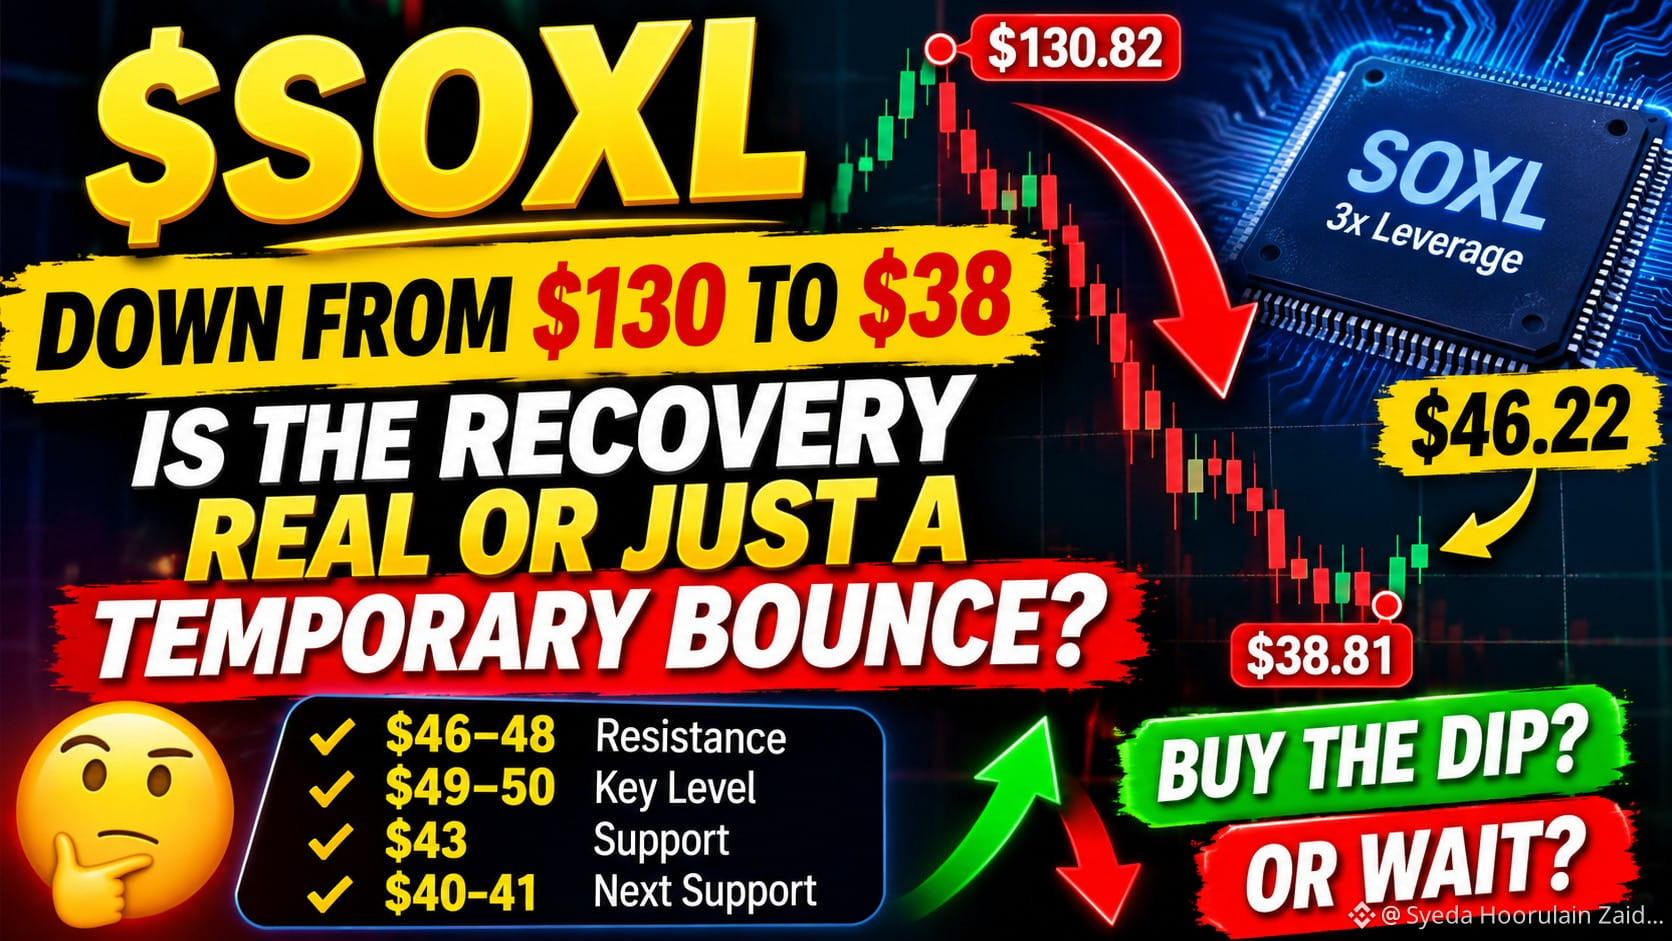
🚨 $SOXL: IS THE SEMICONDUCTOR RECOVERY JUST A TRAP FOR BULLS?
SOXL is attracting attention after a sharp decline, but is this the beginning of a recovery or simply a temporary bounce?
According to the Binance screenshot, SOXLUSDT Perpetual was trading around $46.22, showing significant short-term weakness.
📉 What Should Traders Watch Next?
🔹 $46–48: An important near-term zone to watch for selling pressure.
🔹 $49–50: A stronger recovery above this area could improve short-term sentiment.
🔹 $43: A potential support area if selling pressure returns.
🔹 $40–41: Another downside zone to monitor.
⚠️ The Bigger Picture
A sharp decline can create oversold conditions, but that doesn't automatically mean a trend reversal is coming.
Buyers need to demonstrate strength, trading volume needs to improve, and price must reclaim important resistance levels before a bullish outlook becomes more convincing.
My approach is simple: I won't chase a rebound without confirmation.
The real question is: Are buyers finally stepping in, or is another leg down still possible?
What's your view on $SOXL? Bullish recovery or continued downside?
#SOXL #SemiconductorStocks #stockmarket #TradingAnalysis #CryptoTrading
$SOXL
🚨 $SOXL : IS THE SEMICONDUCTOR RECOVERY JUST A TRAP FOR BULLS?
SOXL is attracting attention after a sharp decline, but is this the beginning of a recovery or simply a temporary bounce?
According to the Binance screenshot, SOXLUSDT Perpetual was trading around $46.22, showing significant short-term weakness.
📉 What Should Traders Watch Next?
🔹 $46–48: An important near-term zone to watch for selling pressure.
🔹 $49–50: A stronger recovery above this area could improve short-term sentiment.
🔹 $43: A potential support area if selling pressure returns.
🔹 $40–41: Another downside zone to monitor.
⚠️ The Bigger Picture
A sharp decline can create oversold conditions, but that doesn't automatically mean a trend reversal is coming.
Buyers need to demonstrate strength, trading volume needs to improve, and price must reclaim important resistance levels before a bullish outlook becomes more convincing.
My approach is simple: I won't chase a rebound without confirmation.
The real question is: Are buyers finally stepping in, or is another leg down still possible?
What's your view on $SOXL ? Bullish recovery or continued downside?
#SOXL #SemiconductorStocks #stockmarket #TradingAnalysis #CryptoTrading
🚨 $SOXL : IS THE SEMICONDUCTOR RECOVERY JUST A TRAP FOR BULLS?
SOXL is attracting attention after a sharp decline, but is this the beginning of a recovery or simply a temporary bounce?
According to the Binance screenshot, SOXLUSDT Perpetual was trading around $46.22, showing significant short-term weakness.
📉 What Should Traders Watch Next?
🔹 $46–48: An important near-term zone to watch for selling pressure.
🔹 $49–50: A stronger recovery above this area could improve short-term sentiment.
🔹 $43: A potential support area if selling pressure returns.
🔹 $40–41: Another downside zone to monitor.
⚠️ The Bigger Picture
A sharp decline can create oversold conditions, but that doesn't automatically mean a trend reversal is coming.
Buyers need to demonstrate strength, trading volume needs to improve, and price must reclaim important resistance levels before a bullish outlook becomes more convincing.
My approach is simple: I won't chase a rebound without confirmation.
The real question is: Are buyers finally stepping in, or is another leg down still possible?
What's your view on $SOXL ? Bullish recovery or continued downside?
#SOXL #SemiconductorStocks #stockmarket #TradingAnalysis #CryptoTrading

Follow me Guys🌸
Syeda Hoorulain Zaidi dan
To‘liq olindi
1
2
340

·
--
O‘suvchi
Tarjimani ko‘rish
SOXL shorts are taking another heavy hit near $45.91.
Buyers are forcing sellers out as upside liquidity clears.
$SOXL
{future}(SOXLUSDT)
$AKE
{future}(AKEUSDT)
$UAI
{future}(UAIUSDT)
🟢 LIQUIDITY ZONE HIT 🟢
Short liquidation spotted 🧨
$16.127K cleared at $45.91
Upside liquidity swept — watch reaction 👀
🎯 TP Targets:
TP1: ~$46.14
TP2: ~$46.37
TP3: ~$46.60
#SOXL
SOXL shorts are taking another heavy hit near $45.91.
Buyers are forcing sellers out as upside liquidity clears.
$SOXL
$AKE
$UAI
🟢 LIQUIDITY ZONE HIT 🟢
Short liquidation spotted 🧨
$16.127K cleared at $45.91
Upside liquidity swept — watch reaction 👀
🎯 TP Targets:
TP1: ~$46.14
TP2: ~$46.37
TP3: ~$46.60
#SOXL
Buyers are forcing sellers out as upside liquidity clears.
$SOXL
$AKE
$UAI
🟢 LIQUIDITY ZONE HIT 🟢
Short liquidation spotted 🧨
$16.127K cleared at $45.91
Upside liquidity swept — watch reaction 👀
🎯 TP Targets:
TP1: ~$46.14
TP2: ~$46.37
TP3: ~$46.60
#SOXL
19
·
--
O‘suvchi
Tarjimani ko‘rish
SOXL shorts are getting squeezed with $20K liquidated.
Buyers are clearing upside liquidity around $45.10.
$SOXL
{future}(SOXLUSDT)
$AKE
{future}(AKEUSDT)
$UAI
{future}(UAIUSDT)
🟢 LIQUIDITY ZONE HIT 🟢
Short liquidation spotted 🧨
$20.044K cleared at $45.1
Upside liquidity swept — watch reaction 👀
🎯 TP Targets:
TP1: ~$45.33
TP2: ~$45.55
TP3: ~$45.78
#SOXL
SOXL shorts are getting squeezed with $20K liquidated.
Buyers are clearing upside liquidity around $45.10.
$SOXL
$AKE
$UAI
🟢 LIQUIDITY ZONE HIT 🟢
Short liquidation spotted 🧨
$20.044K cleared at $45.1
Upside liquidity swept — watch reaction 👀
🎯 TP Targets:
TP1: ~$45.33
TP2: ~$45.55
TP3: ~$45.78
#SOXL
Buyers are clearing upside liquidity around $45.10.
$SOXL
$AKE
$UAI
🟢 LIQUIDITY ZONE HIT 🟢
Short liquidation spotted 🧨
$20.044K cleared at $45.1
Upside liquidity swept — watch reaction 👀
🎯 TP Targets:
TP1: ~$45.33
TP2: ~$45.55
TP3: ~$45.78
#SOXL
60

·
--
Tarjimani ko‘rish
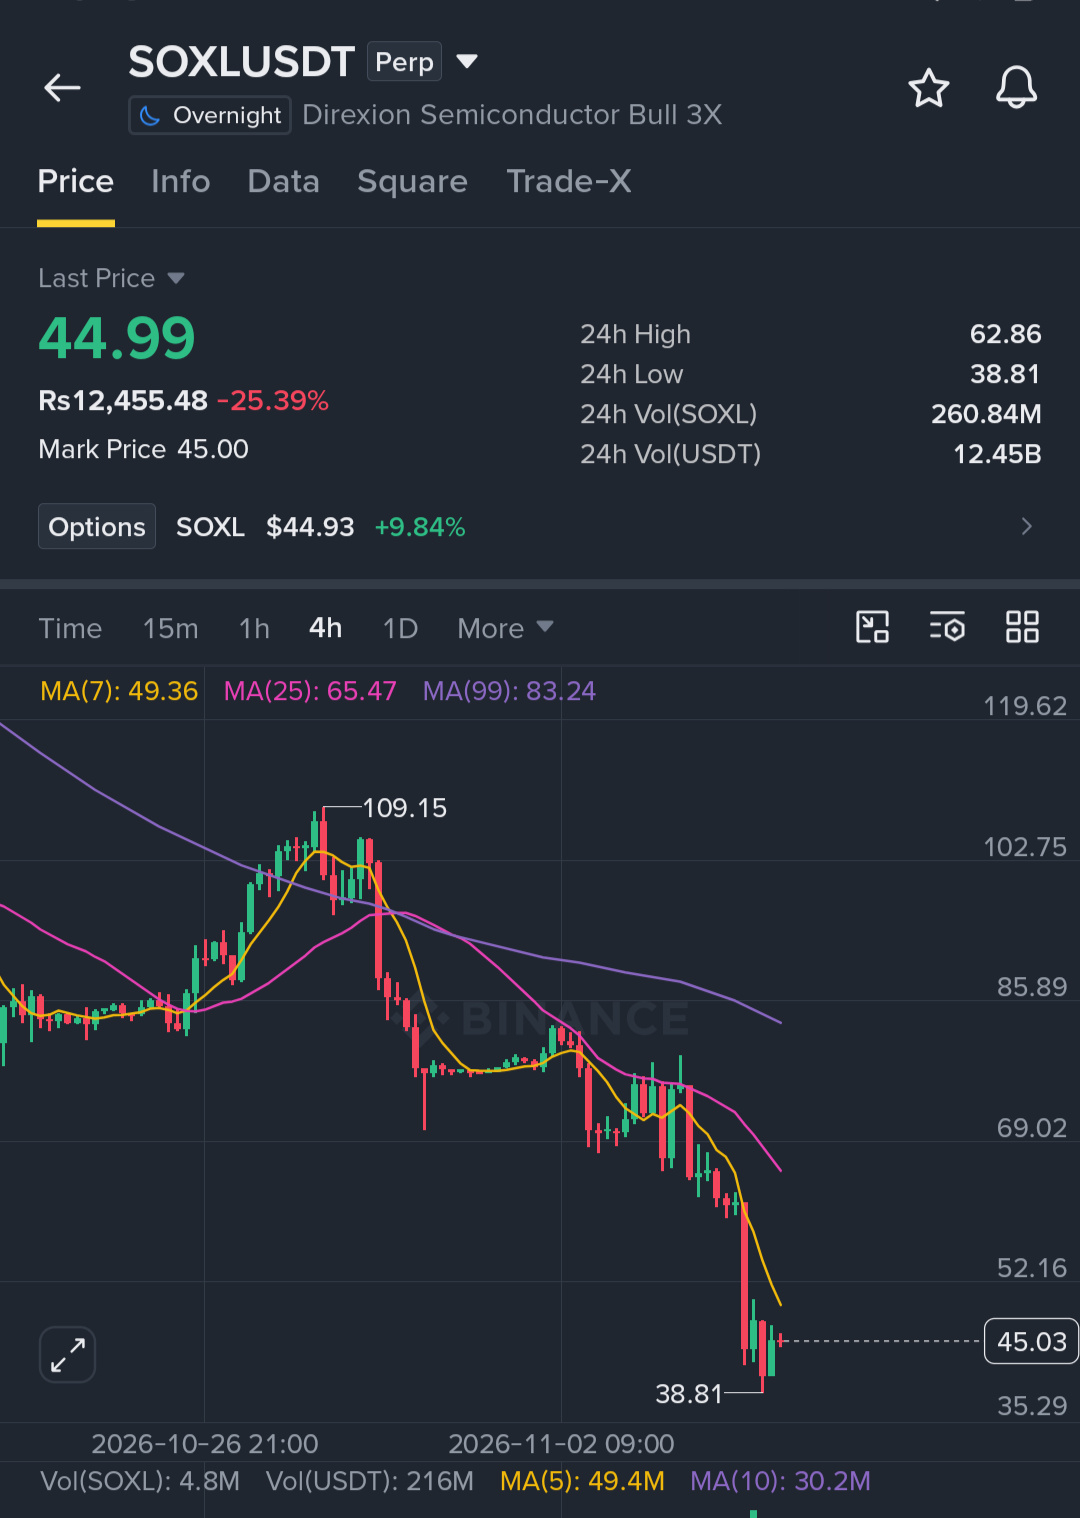
$SOXL is trying to base after a heavy sell-off into the 38.81 low, and buyers are starting to step in. A relief bounce is possible if this support holds.
Key Level:
🟢 Bullish above: 47.30
Trade Setup (Long):
🟢 Entry Zone: 42.70 – 45.50
🎯 Targets: 49.40 / 53.20 / 58.00
⛔ Stop Loss: 37.70
Early stabilization is showing near the low. Enter on pullbacks and manage risk appropriately.
Click here to buy now 👉 $SOXL
{future}(SOXLUSDT)
#SOXL #StrategySTRCResumesIssuanceAfterOver170Days
$SOXL is trying to base after a heavy sell-off into the 38.81 low, and buyers are starting to step in. A relief bounce is possible if this support holds.
Key Level:
🟢 Bullish above: 47.30
Trade Setup (Long):
🟢 Entry Zone: 42.70 – 45.50
🎯 Targets: 49.40 / 53.20 / 58.00
⛔ Stop Loss: 37.70
Early stabilization is showing near the low. Enter on pullbacks and manage risk appropriately.
Click here to buy now 👉 $SOXL
#SOXL #StrategySTRCResumesIssuanceAfterOver170Days
Key Level:
🟢 Bullish above: 47.30
Trade Setup (Long):
🟢 Entry Zone: 42.70 – 45.50
🎯 Targets: 49.40 / 53.20 / 58.00
⛔ Stop Loss: 37.70
Early stabilization is showing near the low. Enter on pullbacks and manage risk appropriately.
Click here to buy now 👉 $SOXL
#SOXL #StrategySTRCResumesIssuanceAfterOver170Days
2
33

⚡ $SOXL MUHIM TALAB ZONASIDAN YORIB O‘TISH MOMENTUMINI BOSHLATDI! 💥
Kirish: 111.80 ⚡
Maqsad: 114.50 🚀
Xaridorlar 111.80 atrofida faol harakat qilmoqda, pasayish bosimini yutib, qisqa muddatli buyurtmalar oqimida aniq o‘zgarish yuz berayotganini ko‘rsatmoqda. 📊 Qisqa vaqt oralig‘ida xarid hajmi kengaygani sari momentum tez sur’atda kuchaymoqda.
Bu dastlabki harakat narx 114.50 dagi likvidlik havzasini mo‘ljallamoqda, u yerda bajarilishini kutayotgan sotuv buyurtmalari turibdi. 💡 Buyurtmalar kitobi xarid tomoniga ancha og‘gan, bu esa narxning ushbu darajani qayta egallashini kuzatayotgan momentum treyderlari uchun qulay imkoniyat yaratadi. 💬 Siz 114.50 gacha bo‘lgan bu o‘sish harakatiga qo‘shilyapsizmi yoki narxning ortga qaytishini kutyapsizmi? 👇
⚠️ Bu moliyaviy maslahat emas. Har doim tavakkalchilikni boshqaring. 🛡️
🏷️ #SOXL #LongSetup #Breakout #Trading
🔥 ⚡
⚡ $SOXL MUHIM TALAB ZONASIDAN YORIB O‘TISH MOMENTUMINI BOSHLATDI! 💥
Kirish: 111.80 ⚡
Maqsad: 114.50 🚀
Xaridorlar 111.80 atrofida faol harakat qilmoqda, pasayish bosimini yutib, qisqa muddatli buyurtmalar oqimida aniq o‘zgarish yuz berayotganini ko‘rsatmoqda. 📊 Qisqa vaqt oralig‘ida xarid hajmi kengaygani sari momentum tez sur’atda kuchaymoqda.
Bu dastlabki harakat narx 114.50 dagi likvidlik havzasini mo‘ljallamoqda, u yerda bajarilishini kutayotgan sotuv buyurtmalari turibdi. 💡 Buyurtmalar kitobi xarid tomoniga ancha og‘gan, bu esa narxning ushbu darajani qayta egallashini kuzatayotgan momentum treyderlari uchun qulay imkoniyat yaratadi. 💬 Siz 114.50 gacha bo‘lgan bu o‘sish harakatiga qo‘shilyapsizmi yoki narxning ortga qaytishini kutyapsizmi? 👇
⚠️ Bu moliyaviy maslahat emas. Har doim tavakkalchilikni boshqaring. 🛡️
🏷️ #SOXL #LongSetup #Breakout #Trading
🔥 ⚡
Kirish: 111.80 ⚡
Maqsad: 114.50 🚀
Xaridorlar 111.80 atrofida faol harakat qilmoqda, pasayish bosimini yutib, qisqa muddatli buyurtmalar oqimida aniq o‘zgarish yuz berayotganini ko‘rsatmoqda. 📊 Qisqa vaqt oralig‘ida xarid hajmi kengaygani sari momentum tez sur’atda kuchaymoqda.
Bu dastlabki harakat narx 114.50 dagi likvidlik havzasini mo‘ljallamoqda, u yerda bajarilishini kutayotgan sotuv buyurtmalari turibdi. 💡 Buyurtmalar kitobi xarid tomoniga ancha og‘gan, bu esa narxning ushbu darajani qayta egallashini kuzatayotgan momentum treyderlari uchun qulay imkoniyat yaratadi. 💬 Siz 114.50 gacha bo‘lgan bu o‘sish harakatiga qo‘shilyapsizmi yoki narxning ortga qaytishini kutyapsizmi? 👇
⚠️ Bu moliyaviy maslahat emas. Har doim tavakkalchilikni boshqaring. 🛡️
🏷️ #SOXL #LongSetup #Breakout #Trading
🔥 ⚡
15
·
--
Tarjimani ko‘rish
2026年11月06日
今天盯 $SOXL,走到 43.76。下方有 42.44 这块支撑,上方 79.19 是阻力,资金流出占优,追涨要更谨慎。综合下来我 偏空观望,打算 反抽 44.125-45.951 再谈,先观望,不追空。
若动手:防守 50.7,先看 41.932。
关键点位(4h):
· 上方关键阻力 79.19(未扫 · 距+80.96%)
· 上方压力区 49.97-60.09 中位55.03
· 空头压力带 43.97-49.97
· 近端支撑 42.44
仅供参考,不构成投资建议,盈亏自负。
欢迎讨论,打脸了我下次改。
$SOXL #ETH #SOXL
2026年11月06日
今天盯 $SOXL ,走到 43.76。下方有 42.44 这块支撑,上方 79.19 是阻力,资金流出占优,追涨要更谨慎。综合下来我 偏空观望,打算 反抽 44.125-45.951 再谈,先观望,不追空。
若动手:防守 50.7,先看 41.932。
关键点位(4h):
· 上方关键阻力 79.19(未扫 · 距+80.96%)
· 上方压力区 49.97-60.09 中位55.03
· 空头压力带 43.97-49.97
· 近端支撑 42.44
仅供参考,不构成投资建议,盈亏自负。
欢迎讨论,打脸了我下次改。
$SOXL #ETH #SOXL
今天盯 $SOXL ,走到 43.76。下方有 42.44 这块支撑,上方 79.19 是阻力,资金流出占优,追涨要更谨慎。综合下来我 偏空观望,打算 反抽 44.125-45.951 再谈,先观望,不追空。
若动手:防守 50.7,先看 41.932。
关键点位(4h):
· 上方关键阻力 79.19(未扫 · 距+80.96%)
· 上方压力区 49.97-60.09 中位55.03
· 空头压力带 43.97-49.97
· 近端支撑 42.44
仅供参考,不构成投资建议,盈亏自负。
欢迎讨论,打脸了我下次改。
$SOXL #ETH #SOXL
2

·
--
Tarjimani ko‘rish
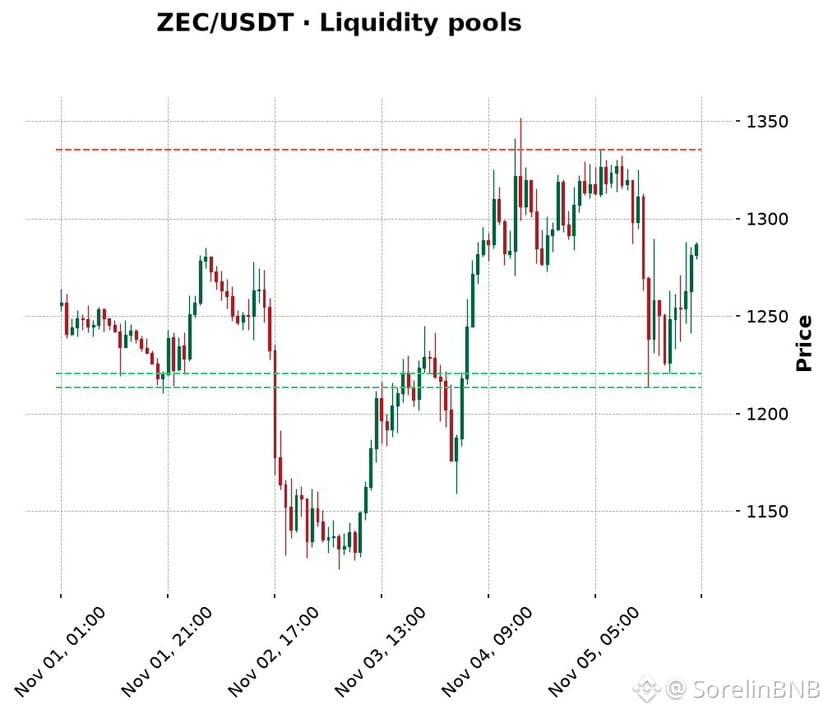
3 CHARTS, 3 LIES | $SOXL / $ZEC / $ETH
Buyers are loud. Price is not moving up.
So who is lying, the flow or the chart?
If ETH is oversold at RSI 25.9 and still can’t bounce, what if oversold is not a signal but a warning?
🕵️ SUSPECT 1: SOXL (41.37)
Funding +0.0994%. OI +10.7%. Whales sold $506K vs $278K bought.
What if the longs are the liquidity?
Wall: 44.00-44.50. Below: 40.33, 33.60, 28.30
Only a close above 62.86 clears the charges. Until then the bounce is bait.
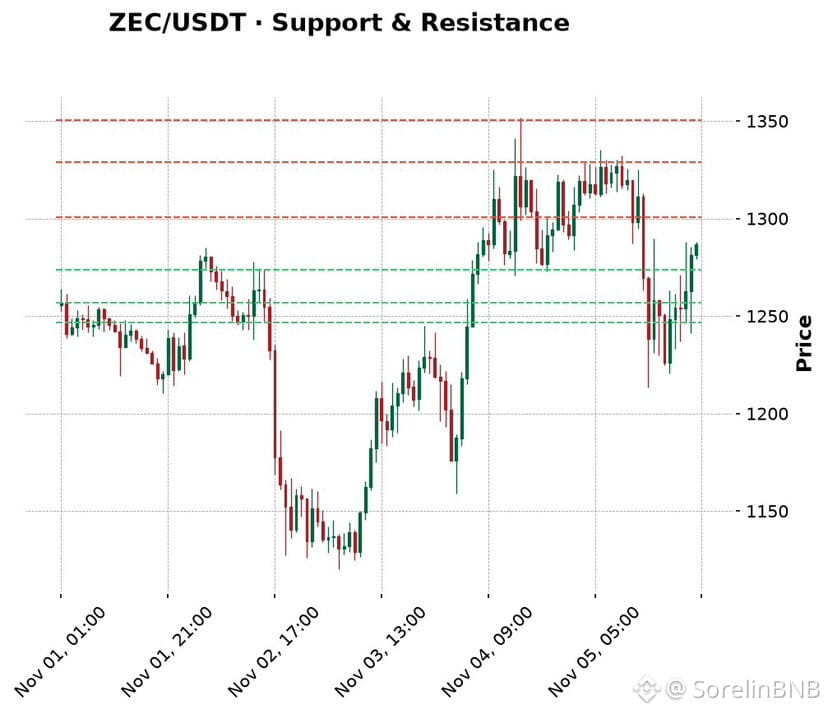
🕵️ SUSPECT 2: ZEC (1284)
Taker buying 1.54x, yet price is stuck under 1294-1334.
What if heavy buying into a wall is not strength but someone selling to them?
Floor: 1210, then 1158, then 1120
Trap breaks only above 1334.87
🕵️ SUSPECT 3: ETH (2235)
OI dropped 9.5%, so longs are already leaving, yet buyers still show 1.46x.
What if the people buying the dip are the exit liquidity for the people who sold it?
Lose 2235 and a failed retest sends it to 2225, then 2175-2180
Bulls only win above 2444
⚖️ VERDICT TIME
If all three are bearish but flow says bullish, what if both are right and the move is a squeeze first, a dump second?
Comment only a number:
1 = SOXL breaks first
2 = ZEC breaks first
3 = ETH breaks first
0 = all three squeeze and the bears get embarrassed
And if you pick 0, explain why you are not scared of 2235.
#ETH #ZEC #SOXL #CryptoAnalysis
{future}(ZECUSDT)
{future}(SOXLUSDT)
{future}(ETHUSDT)
3 CHARTS, 3 LIES | $SOXL / $ZEC / $ETH
Buyers are loud. Price is not moving up.
So who is lying, the flow or the chart?
If ETH is oversold at RSI 25.9 and still can’t bounce, what if oversold is not a signal but a warning?
🕵️ SUSPECT 1: SOXL (41.37)
Funding +0.0994%. OI +10.7%. Whales sold $506K vs $278K bought.
What if the longs are the liquidity?
Wall: 44.00-44.50. Below: 40.33, 33.60, 28.30
Only a close above 62.86 clears the charges. Until then the bounce is bait.
🕵️ SUSPECT 2: ZEC (1284)
Taker buying 1.54x, yet price is stuck under 1294-1334.
What if heavy buying into a wall is not strength but someone selling to them?
Floor: 1210, then 1158, then 1120
Trap breaks only above 1334.87
🕵️ SUSPECT 3: ETH (2235)
OI dropped 9.5%, so longs are already leaving, yet buyers still show 1.46x.
What if the people buying the dip are the exit liquidity for the people who sold it?
Lose 2235 and a failed retest sends it to 2225, then 2175-2180
Bulls only win above 2444
⚖️ VERDICT TIME
If all three are bearish but flow says bullish, what if both are right and the move is a squeeze first, a dump second?
Comment only a number:
1 = SOXL breaks first
2 = ZEC breaks first
3 = ETH breaks first
0 = all three squeeze and the bears get embarrassed
And if you pick 0, explain why you are not scared of 2235.
#ETH #ZEC #SOXL #CryptoAnalysis
Buyers are loud. Price is not moving up.
So who is lying, the flow or the chart?
If ETH is oversold at RSI 25.9 and still can’t bounce, what if oversold is not a signal but a warning?
🕵️ SUSPECT 1: SOXL (41.37)
Funding +0.0994%. OI +10.7%. Whales sold $506K vs $278K bought.
What if the longs are the liquidity?
Wall: 44.00-44.50. Below: 40.33, 33.60, 28.30
Only a close above 62.86 clears the charges. Until then the bounce is bait.
🕵️ SUSPECT 2: ZEC (1284)
Taker buying 1.54x, yet price is stuck under 1294-1334.
What if heavy buying into a wall is not strength but someone selling to them?
Floor: 1210, then 1158, then 1120
Trap breaks only above 1334.87
🕵️ SUSPECT 3: ETH (2235)
OI dropped 9.5%, so longs are already leaving, yet buyers still show 1.46x.
What if the people buying the dip are the exit liquidity for the people who sold it?
Lose 2235 and a failed retest sends it to 2225, then 2175-2180
Bulls only win above 2444
⚖️ VERDICT TIME
If all three are bearish but flow says bullish, what if both are right and the move is a squeeze first, a dump second?
Comment only a number:
1 = SOXL breaks first
2 = ZEC breaks first
3 = ETH breaks first
0 = all three squeeze and the bears get embarrassed
And if you pick 0, explain why you are not scared of 2235.
#ETH #ZEC #SOXL #CryptoAnalysis
1
1.2k

·
--
Qisman to‘g‘ri
Tarjimani ko‘rish
半导体这个盘子漏了。
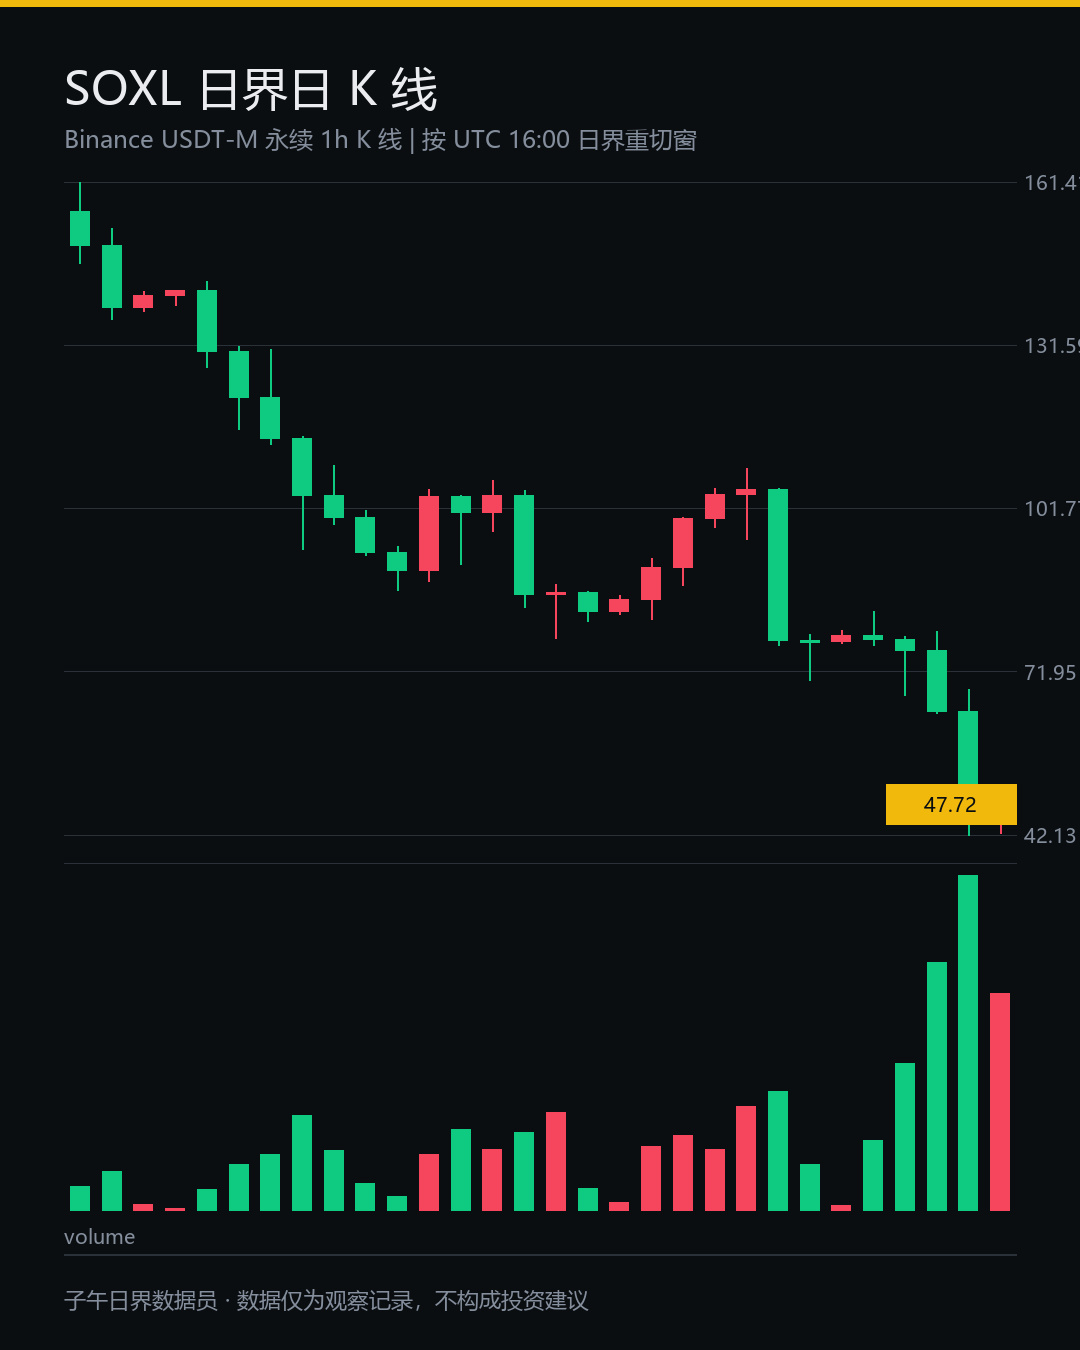
$SOXL 开在 65.45,最低插到 42.13,现在 47.69,二十四小时跌 26.743%。
我第一眼还以为看错了,核对两遍才信。
三倍看涨半导体的代币化合约,杠杆每天收盘重置一次,跌完之后要涨回来得多走一段更长的路。
二十天的日界区间是 62.36 到 109.57,现价 47.69 掉到下沿下面 23.52%。
七天 -45.526%。十四天 -40.233%。
成交额 104.65 亿 USDT。
这个量级说明筹码在换手,不是没人接。
持仓那边更有意思,未平仓合约一天里从五百二十九万张涨到八百七十九万张,
价格跌掉两成六而仓位反向长出六成六,多头账户还占 85.43%。
跌的时候往上加仓,这就是接刀。
就像菜市场塌了个角,人还往里面挤着捡便宜,谁离锅近谁先烫手。
同一时段 $BTC 跌 4.51%,$ETH 跌 6.213%。大盘是阴跌,半导体这边是杀位置。
资金费率 +0.093434%,还是多头在付钱给空头,杠杆没清干净,流动性也没回来。
我现在的口径是降低关注,等这批仓位清完再谈承接。
各位怎么看这种三倍品种的清仓节奏?
#SOXL #比特币 #加密货币
以上为个人交易系统记录与数据观察,不构成投资建议
半导体这个盘子漏了。
$SOXL 开在 65.45,最低插到 42.13,现在 47.69,二十四小时跌 26.743%。
我第一眼还以为看错了,核对两遍才信。
三倍看涨半导体的代币化合约,杠杆每天收盘重置一次,跌完之后要涨回来得多走一段更长的路。
二十天的日界区间是 62.36 到 109.57,现价 47.69 掉到下沿下面 23.52%。
七天 -45.526%。十四天 -40.233%。
成交额 104.65 亿 USDT。
这个量级说明筹码在换手,不是没人接。
持仓那边更有意思,未平仓合约一天里从五百二十九万张涨到八百七十九万张,
价格跌掉两成六而仓位反向长出六成六,多头账户还占 85.43%。
跌的时候往上加仓,这就是接刀。
就像菜市场塌了个角,人还往里面挤着捡便宜,谁离锅近谁先烫手。
同一时段 $BTC 跌 4.51%,$ETH 跌 6.213%。大盘是阴跌,半导体这边是杀位置。
资金费率 +0.093434%,还是多头在付钱给空头,杠杆没清干净,流动性也没回来。
我现在的口径是降低关注,等这批仓位清完再谈承接。
各位怎么看这种三倍品种的清仓节奏?
#SOXL #比特币 #加密货币
以上为个人交易系统记录与数据观察,不构成投资建议
$SOXL 开在 65.45,最低插到 42.13,现在 47.69,二十四小时跌 26.743%。
我第一眼还以为看错了,核对两遍才信。
三倍看涨半导体的代币化合约,杠杆每天收盘重置一次,跌完之后要涨回来得多走一段更长的路。
二十天的日界区间是 62.36 到 109.57,现价 47.69 掉到下沿下面 23.52%。
七天 -45.526%。十四天 -40.233%。
成交额 104.65 亿 USDT。
这个量级说明筹码在换手,不是没人接。
持仓那边更有意思,未平仓合约一天里从五百二十九万张涨到八百七十九万张,
价格跌掉两成六而仓位反向长出六成六,多头账户还占 85.43%。
跌的时候往上加仓,这就是接刀。
就像菜市场塌了个角,人还往里面挤着捡便宜,谁离锅近谁先烫手。
同一时段 $BTC 跌 4.51%,$ETH 跌 6.213%。大盘是阴跌,半导体这边是杀位置。
资金费率 +0.093434%,还是多头在付钱给空头,杠杆没清干净,流动性也没回来。
我现在的口径是降低关注,等这批仓位清完再谈承接。
各位怎么看这种三倍品种的清仓节奏?
#SOXL #比特币 #加密货币
以上为个人交易系统记录与数据观察,不构成投资建议
Ula Frances:
价格跳水、持仓还膨胀,这哪是接刀,是组团给刀开刃吧?不过新增仓位也可能是空头,光看多头账户占比,能判断谁先爆吗?
1
1
1.7k

·
--
Tarjimani ko‘rish
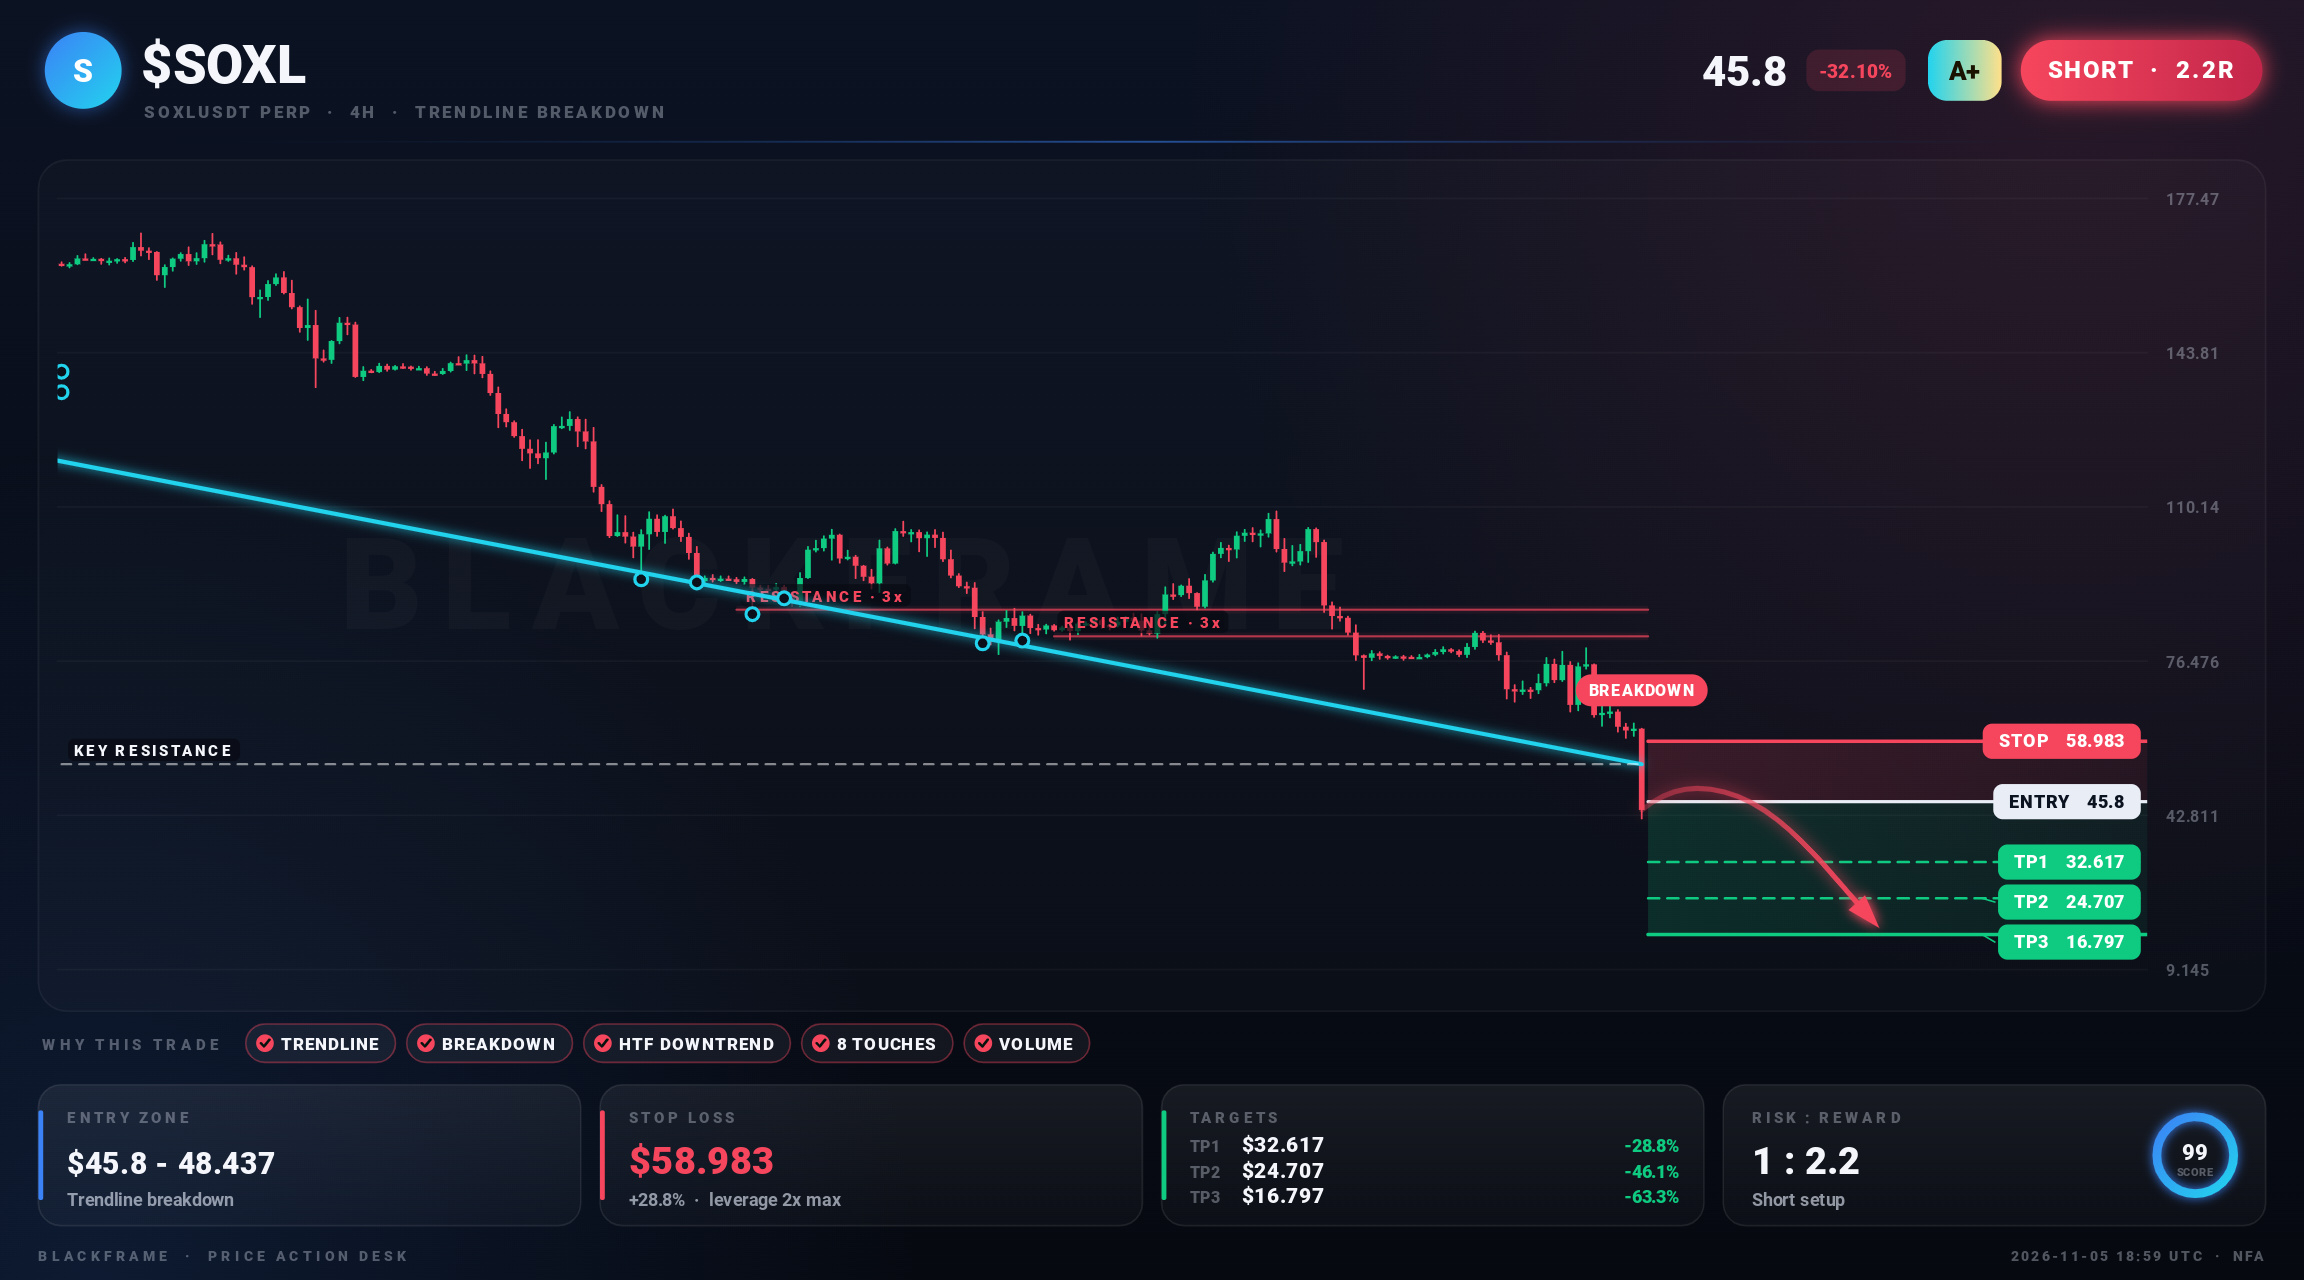
📉 $SOXL bears took control
SHORT · 4H
Entry: $45.8 - $49.096
TP1: $32.617
TP2: $24.707
TP3: $16.797
SL: $58.983
Price broke below a trendline near $53.967 and is holding it. The higher timeframe trend agrees.
#SOXL #CryptoMarket #TechnicalAnalysis · NFA
📉 $SOXL bears took control
SHORT · 4H
Entry: $45.8 - $49.096
TP1: $32.617
TP2: $24.707
TP3: $16.797
SL: $58.983
Price broke below a trendline near $53.967 and is holding it. The higher timeframe trend agrees.
#SOXL #CryptoMarket #TechnicalAnalysis · NFA
SHORT · 4H
Entry: $45.8 - $49.096
TP1: $32.617
TP2: $24.707
TP3: $16.797
SL: $58.983
Price broke below a trendline near $53.967 and is holding it. The higher timeframe trend agrees.
#SOXL #CryptoMarket #TechnicalAnalysis · NFA
27

·
--
O‘suvchi
$SOXL EGALARI, QANDAY FALOKAT! 😂📉
Jahon chempionati bilan xayrlashdik… endi esa bozor yana yuragimizni ezmoqda! 💔⚽
$SOXL narxi 58,94 dollarni tashkil qilmoqda, 16,91% ga tushdi — bu juda keskin pasayish!
🔥 Buqalar qattiq zarba yemoqda.
📉 Volatillik keskin oshmoqda.
👀 Bu vaqtinchalik silkinishmi yoki yanada kattaroq narsaning boshlanishimi?
Ba’zida bozor Jahon chempionati finalida yutqazishdan ham og‘irroq tuyuladi! 😂
Siz nima deb o‘ylaysiz? PASAYISHDAN FOYDALANIB SOTIB OLASIZMI yoki CHETDA TURASIZMI? 👇
#SOXL #StockMarket #Trading #MarketCrash
$SOXL EGALARI, QANDAY FALOKAT! 😂📉
Jahon chempionati bilan xayrlashdik… endi esa bozor yana yuragimizni ezmoqda! 💔⚽
$SOXL narxi 58,94 dollarni tashkil qilmoqda, 16,91% ga tushdi — bu juda keskin pasayish!
🔥 Buqalar qattiq zarba yemoqda.
📉 Volatillik keskin oshmoqda.
👀 Bu vaqtinchalik silkinishmi yoki yanada kattaroq narsaning boshlanishimi?
Ba’zida bozor Jahon chempionati finalida yutqazishdan ham og‘irroq tuyuladi! 😂
Siz nima deb o‘ylaysiz? PASAYISHDAN FOYDALANIB SOTIB OLASIZMI yoki CHETDA TURASIZMI? 👇
#SOXL #StockMarket #Trading #MarketCrash
Jahon chempionati bilan xayrlashdik… endi esa bozor yana yuragimizni ezmoqda! 💔⚽
$SOXL narxi 58,94 dollarni tashkil qilmoqda, 16,91% ga tushdi — bu juda keskin pasayish!
🔥 Buqalar qattiq zarba yemoqda.
📉 Volatillik keskin oshmoqda.
👀 Bu vaqtinchalik silkinishmi yoki yanada kattaroq narsaning boshlanishimi?
Ba’zida bozor Jahon chempionati finalida yutqazishdan ham og‘irroq tuyuladi! 😂
Siz nima deb o‘ylaysiz? PASAYISHDAN FOYDALANIB SOTIB OLASIZMI yoki CHETDA TURASIZMI? 👇
#SOXL #StockMarket #Trading #MarketCrash
1
766
·
--
Tarjimani ko‘rish
SOXL 这波别急着猜底,我只等一个修复信号先出现。
币安现货(代币化股票/ETF,非交易时段跳空风险高)|SOXL 过去 24 小时 -31.90%,弱势仍在,修复先看卖压是否收敛。 现价约 47.56,24h 成交额约 6004.11万;30m量比 6.4 倍,参与度在抬升。
参考指标:30m RSI 21.13 已超卖,说明短线恐慌已经偏满;30m ATR趋势带参考位 60.30122,现价跌破参考位,说明趋势保护位开始承压。
你会先等哪一个:30m RSI 21.1 能不能重新回到 30 上方,还是现价能不能重新站回ATR趋势带参考位 60.30122?
#SOXL #异动警报
SOXL 这波别急着猜底,我只等一个修复信号先出现。
币安现货(代币化股票/ETF,非交易时段跳空风险高)|SOXL 过去 24 小时 -31.90%,弱势仍在,修复先看卖压是否收敛。 现价约 47.56,24h 成交额约 6004.11万;30m量比 6.4 倍,参与度在抬升。
参考指标:30m RSI 21.13 已超卖,说明短线恐慌已经偏满;30m ATR趋势带参考位 60.30122,现价跌破参考位,说明趋势保护位开始承压。
你会先等哪一个:30m RSI 21.1 能不能重新回到 30 上方,还是现价能不能重新站回ATR趋势带参考位 60.30122?
#SOXL #异动警报
币安现货(代币化股票/ETF,非交易时段跳空风险高)|SOXL 过去 24 小时 -31.90%,弱势仍在,修复先看卖压是否收敛。 现价约 47.56,24h 成交额约 6004.11万;30m量比 6.4 倍,参与度在抬升。
参考指标:30m RSI 21.13 已超卖,说明短线恐慌已经偏满;30m ATR趋势带参考位 60.30122,现价跌破参考位,说明趋势保护位开始承压。
你会先等哪一个:30m RSI 21.1 能不能重新回到 30 上方,还是现价能不能重新站回ATR趋势带参考位 60.30122?
#SOXL #异动警报
181
Ko‘proq kontentni ko‘rish uchun tizimga kiring
Binance Square'da global kriptovalyuta foydalanuvchilariga qo‘shiling
⚡️ Kriptovalyuta haqida eng so‘nggi va foydali ma’lumotlarni oling.
💬 Dunyoning eng yirik kriptovalyuta birjasi tomonidan ishonchli deb topilgan.
👍 Tasdiqlangan mualliflardan haqiqiy tahlillarni kashf eting.
Email / telefon raqami
Trenddagi mavzular
1
#CanUSStocksReboundAfterNonfarmPayrolls?
1,909 marta koʻrilgan
86 muhokama qilmoqda
2
#BinanceReopensWithdrawalsForMoreAssets
1.1M marta koʻrilgan
6,119 muhokama qilmoqda
3
#$2TWipedOutHedgeFundsFaceLiquidation
4,424 marta koʻrilgan
44 muhokama qilmoqda
4
#AnthropicIPOValuationDoubts
26,979 marta koʻrilgan
537 muhokama qilmoqda
5
#USMidtermsCouldShakeUpUS-IranTies
2,800 marta koʻrilgan
65 muhokama qilmoqda
6
#HyperliquidStrategiesHolds38.52MillionHYPE
0 marta koʻrilgan
0 muhokama qilmoqda
7
#NigeriaCentralBankSetsCapitalMinimumForStablecoinIssuers
8 marta koʻrilgan
4 muhokama qilmoqda
8
#Nasdaq100FuturesRise1.4%
1,397 marta koʻrilgan
49 muhokama qilmoqda
9
#RussiaInvestigativeCommitteeProposesAddingCryptoToAMLSystem
399 marta koʻrilgan
8 muhokama qilmoqda
10
#SouthKoreaDelaysCryptoTaxationUntil2029
5,697 marta koʻrilgan
131 muhokama qilmoqda