
#ondo
ondo
8.5M marta koʻrilgan
22,569 muhokama qilmoqda
Ommabop
Eng so‘nggi

·
--
Yashirin oqim sekingina yo‘nalishini o‘zgartiryapti, $ONDO bo‘yicha eng ishonchli dalil aslida bir soatlik grafikda yashiringan — xaridorlar tinmay yuqoriga surmoqda, kunlik grafik hali yonlama harakatda bo‘lsa-da, qisqa muddatli impuls so‘nmagan. RSI yuqori darajaga yaqinlashayotganini ko‘ryapsiz, shoshilib xavotir olmang: bunday holat ko‘pincha trend endigina boshlanayotganidan darak beradi. Long pozitsiyaga kirishimiz tavakkal emas, hozirgi eng kuchli oqim yo‘nalishida harakat qilishdir.
Narxning qaytishidagi tuzilma buzilmadi, savdo hajmi ham keskin pasaymadi — ko‘tarilish tomonga moyil bo‘lishimning sababi shu. Pozitsiya hajmini biroz kichikroq tutib, xatolar uchun zaxira qoldiring. Kengroq manzara haqida gapirishdan oldin kunlik grafik ham tasdiqlashini kuting.
🟢 Savdo yo‘nalishi: long pozitsiya
📍 Kirish oralig‘i: 0.4026236 – 0.4038796
🛑 Stop-loss: 0.3905444
🎯 Foydani qayd etish 1: 0.4127820
🎯 Foydani qayd etish 2: 0.4191357
🎯 Foydani qayd etish 3: 0.4286662
Imkoniyat ortidan quvish shart emas, imkoniyatning o‘zi kelib qoladi.
Li opa bilan yelkama-yelka bo‘ling, har bir lahza aks-sado bersin.
#ONDO
Savdo qilish uchun quyidagini bosing 👇
Yashirin oqim sekingina yo‘nalishini o‘zgartiryapti, $ONDO bo‘yicha eng ishonchli dalil aslida bir soatlik grafikda yashiringan — xaridorlar tinmay yuqoriga surmoqda, kunlik grafik hali yonlama harakatda bo‘lsa-da, qisqa muddatli impuls so‘nmagan. RSI yuqori darajaga yaqinlashayotganini ko‘ryapsiz, shoshilib xavotir olmang: bunday holat ko‘pincha trend endigina boshlanayotganidan darak beradi. Long pozitsiyaga kirishimiz tavakkal emas, hozirgi eng kuchli oqim yo‘nalishida harakat qilishdir.
Narxning qaytishidagi tuzilma buzilmadi, savdo hajmi ham keskin pasaymadi — ko‘tarilish tomonga moyil bo‘lishimning sababi shu. Pozitsiya hajmini biroz kichikroq tutib, xatolar uchun zaxira qoldiring. Kengroq manzara haqida gapirishdan oldin kunlik grafik ham tasdiqlashini kuting.
🟢 Savdo yo‘nalishi: long pozitsiya
📍 Kirish oralig‘i: 0.4026236 – 0.4038796
🛑 Stop-loss: 0.3905444
🎯 Foydani qayd etish 1: 0.4127820
🎯 Foydani qayd etish 2: 0.4191357
🎯 Foydani qayd etish 3: 0.4286662
Imkoniyat ortidan quvish shart emas, imkoniyatning o‘zi kelib qoladi.
Li opa bilan yelkama-yelka bo‘ling, har bir lahza aks-sado bersin.
#ONDO
Savdo qilish uchun quyidagini bosing 👇
Narxning qaytishidagi tuzilma buzilmadi, savdo hajmi ham keskin pasaymadi — ko‘tarilish tomonga moyil bo‘lishimning sababi shu. Pozitsiya hajmini biroz kichikroq tutib, xatolar uchun zaxira qoldiring. Kengroq manzara haqida gapirishdan oldin kunlik grafik ham tasdiqlashini kuting.
🟢 Savdo yo‘nalishi: long pozitsiya
📍 Kirish oralig‘i: 0.4026236 – 0.4038796
🛑 Stop-loss: 0.3905444
🎯 Foydani qayd etish 1: 0.4127820
🎯 Foydani qayd etish 2: 0.4191357
🎯 Foydani qayd etish 3: 0.4286662
Imkoniyat ortidan quvish shart emas, imkoniyatning o‘zi kelib qoladi.
Li opa bilan yelkama-yelka bo‘ling, har bir lahza aks-sado bersin.
#ONDO
Savdo qilish uchun quyidagini bosing 👇
Ray Rosek WyG5:
0.47
1
209

·
--
$ONDO 🚀 $ONDO UZUN POZITSIYA 🟢
$ONDO so‘nggi 24 soat ichida 6.92% ga mustahkam o‘sib, sezilarli kuch namoyon qilmoqda. Bu xaridorlar bosimi kuchli ekanidan dalolat beradi. Narx $0.4108 darajasi atrofida saqlanib turgani va savdo hajmi yuqori — $11,982,011.36 bo‘lgani — hozirda bozordagi tendensiyada o‘sish sur’ati ustunlik qilayotganini ko‘rsatadi.
📊 24 soat: +6.92% | Hajm: $11,982,011.36
📈 SAVDO REJASI
🔹 Kirish: 0.4108
🛑 Zararni to‘xtatish: 0.3950
🎯 TP1: 0.4345
🎯 TP2: 0.4480
🎯 TP3: 0.4650
⚖️ Xavf:foyda (TP1): 1:1.50
🔔 Signal: So‘nggi 24 soatdagi 0.4204 maksimumdan yuqorida barqaror yorib o‘tish va shamning yopilishi ushbu $ONDO o‘sish harakatini yanada tasdiqlaydi.
⚠️ Xavf haqida eslatma: Kriptovalyuta bozorlari juda o‘zgaruvchan. Pozitsiya hajmini ehtiyotkorlik bilan belgilang va zarar to‘xtatish darajangizga rioya qiling.
Kirish pozitsiyasini ochishdan oldin qo‘llab-quvvatlash darajasi aniq qayta sinovdan o‘tishini kuting.
Savdo qilish uchun quyidagini bosing 👇🏻
$ONDO
Ko‘proq yangiliklar uchun @T4_TZX sahifasini kuzatib boring...
#ONDO #CryptoTrading #MarketAnalysis #BinanceSquare
$ONDO 🚀 $ONDO UZUN POZITSIYA 🟢
$ONDO so‘nggi 24 soat ichida 6.92% ga mustahkam o‘sib, sezilarli kuch namoyon qilmoqda. Bu xaridorlar bosimi kuchli ekanidan dalolat beradi. Narx $0.4108 darajasi atrofida saqlanib turgani va savdo hajmi yuqori — $11,982,011.36 bo‘lgani — hozirda bozordagi tendensiyada o‘sish sur’ati ustunlik qilayotganini ko‘rsatadi.
📊 24 soat: +6.92% | Hajm: $11,982,011.36
📈 SAVDO REJASI
🔹 Kirish: 0.4108
🛑 Zararni to‘xtatish: 0.3950
🎯 TP1: 0.4345
🎯 TP2: 0.4480
🎯 TP3: 0.4650
⚖️ Xavf:foyda (TP1): 1:1.50
🔔 Signal: So‘nggi 24 soatdagi 0.4204 maksimumdan yuqorida barqaror yorib o‘tish va shamning yopilishi ushbu $ONDO o‘sish harakatini yanada tasdiqlaydi.
⚠️ Xavf haqida eslatma: Kriptovalyuta bozorlari juda o‘zgaruvchan. Pozitsiya hajmini ehtiyotkorlik bilan belgilang va zarar to‘xtatish darajangizga rioya qiling.
Kirish pozitsiyasini ochishdan oldin qo‘llab-quvvatlash darajasi aniq qayta sinovdan o‘tishini kuting.
Savdo qilish uchun quyidagini bosing 👇🏻
$ONDO
Ko‘proq yangiliklar uchun @T4_TZX sahifasini kuzatib boring...
#ONDO #CryptoTrading #MarketAnalysis #BinanceSquare
$ONDO so‘nggi 24 soat ichida 6.92% ga mustahkam o‘sib, sezilarli kuch namoyon qilmoqda. Bu xaridorlar bosimi kuchli ekanidan dalolat beradi. Narx $0.4108 darajasi atrofida saqlanib turgani va savdo hajmi yuqori — $11,982,011.36 bo‘lgani — hozirda bozordagi tendensiyada o‘sish sur’ati ustunlik qilayotganini ko‘rsatadi.
📊 24 soat: +6.92% | Hajm: $11,982,011.36
📈 SAVDO REJASI
🔹 Kirish: 0.4108
🛑 Zararni to‘xtatish: 0.3950
🎯 TP1: 0.4345
🎯 TP2: 0.4480
🎯 TP3: 0.4650
⚖️ Xavf:foyda (TP1): 1:1.50
🔔 Signal: So‘nggi 24 soatdagi 0.4204 maksimumdan yuqorida barqaror yorib o‘tish va shamning yopilishi ushbu $ONDO o‘sish harakatini yanada tasdiqlaydi.
⚠️ Xavf haqida eslatma: Kriptovalyuta bozorlari juda o‘zgaruvchan. Pozitsiya hajmini ehtiyotkorlik bilan belgilang va zarar to‘xtatish darajangizga rioya qiling.
Kirish pozitsiyasini ochishdan oldin qo‘llab-quvvatlash darajasi aniq qayta sinovdan o‘tishini kuting.
Savdo qilish uchun quyidagini bosing 👇🏻
$ONDO
Ko‘proq yangiliklar uchun @T4_TZX sahifasini kuzatib boring...
#ONDO #CryptoTrading #MarketAnalysis #BinanceSquare
53

$ONDO bir qancha muhim ekotizim yangiliklaridan so‘ng e’tiborga loyiq.
So‘nggi e’lonlar:
* Ondo Intelligent Portfolios Solana’da ishga tushdi.
* DTCC Tokenization Service bilan hamkorlik.
* Ondo Stocks Robinhood Chain’da foydalanish uchun taqdim etildi.
* 3-noyabr kuni USDY uchun kun davomida uzluksiz narxlash e’lon qilindi.
Bu yangiliklar an’anaviy moliya bozorlari va blokcheyn infratuzilmasi o‘rtasidagi tobora kuchayib borayotgan aloqani mustahkamlaydi.
Investitsiya tezisi:
Tokenizatsiyadagi eng katta imkoniyat navbatdagi spekulyativ token bo‘lmasligi mumkin.
U an’anaviy qimmatli qog‘ozlar, institutsional kapital va blokcheyn orqali hisob-kitoblarni bog‘laydigan infratuzilma bo‘lishi mumkin.
$ONDO o‘zini shu bozorda namoyon qilmoqda.
Ammo ekotizimning kengayishi token qiymatining darhol oshishini anglatmaydi.
SO‘ROVNOMA — Tokenizatsiyalangan moliyada g‘oliblarni nima belgilaydi?
#ONDO #RWA
$ONDO bir qancha muhim ekotizim yangiliklaridan so‘ng e’tiborga loyiq.
So‘nggi e’lonlar:
* Ondo Intelligent Portfolios Solana’da ishga tushdi.
* DTCC Tokenization Service bilan hamkorlik.
* Ondo Stocks Robinhood Chain’da foydalanish uchun taqdim etildi.
* 3-noyabr kuni USDY uchun kun davomida uzluksiz narxlash e’lon qilindi.
Bu yangiliklar an’anaviy moliya bozorlari va blokcheyn infratuzilmasi o‘rtasidagi tobora kuchayib borayotgan aloqani mustahkamlaydi.
Investitsiya tezisi:
Tokenizatsiyadagi eng katta imkoniyat navbatdagi spekulyativ token bo‘lmasligi mumkin.
U an’anaviy qimmatli qog‘ozlar, institutsional kapital va blokcheyn orqali hisob-kitoblarni bog‘laydigan infratuzilma bo‘lishi mumkin.
$ONDO o‘zini shu bozorda namoyon qilmoqda.
Ammo ekotizimning kengayishi token qiymatining darhol oshishini anglatmaydi.
SO‘ROVNOMA — Tokenizatsiyalangan moliyada g‘oliblarni nima belgilaydi?
#ONDO #RWA
So‘nggi e’lonlar:
* Ondo Intelligent Portfolios Solana’da ishga tushdi.
* DTCC Tokenization Service bilan hamkorlik.
* Ondo Stocks Robinhood Chain’da foydalanish uchun taqdim etildi.
* 3-noyabr kuni USDY uchun kun davomida uzluksiz narxlash e’lon qilindi.
Bu yangiliklar an’anaviy moliya bozorlari va blokcheyn infratuzilmasi o‘rtasidagi tobora kuchayib borayotgan aloqani mustahkamlaydi.
Investitsiya tezisi:
Tokenizatsiyadagi eng katta imkoniyat navbatdagi spekulyativ token bo‘lmasligi mumkin.
U an’anaviy qimmatli qog‘ozlar, institutsional kapital va blokcheyn orqali hisob-kitoblarni bog‘laydigan infratuzilma bo‘lishi mumkin.
$ONDO o‘zini shu bozorda namoyon qilmoqda.
Ammo ekotizimning kengayishi token qiymatining darhol oshishini anglatmaydi.
SO‘ROVNOMA — Tokenizatsiyalangan moliyada g‘oliblarni nima belgilaydi?
#ONDO #RWA
Institutional partnerships.
0%
Regulatory clarity.
0%
Liquidity and adoption.
0%
Real revenue generation.
0%
0 Ovozlar • Ovoz berish yopildi
229

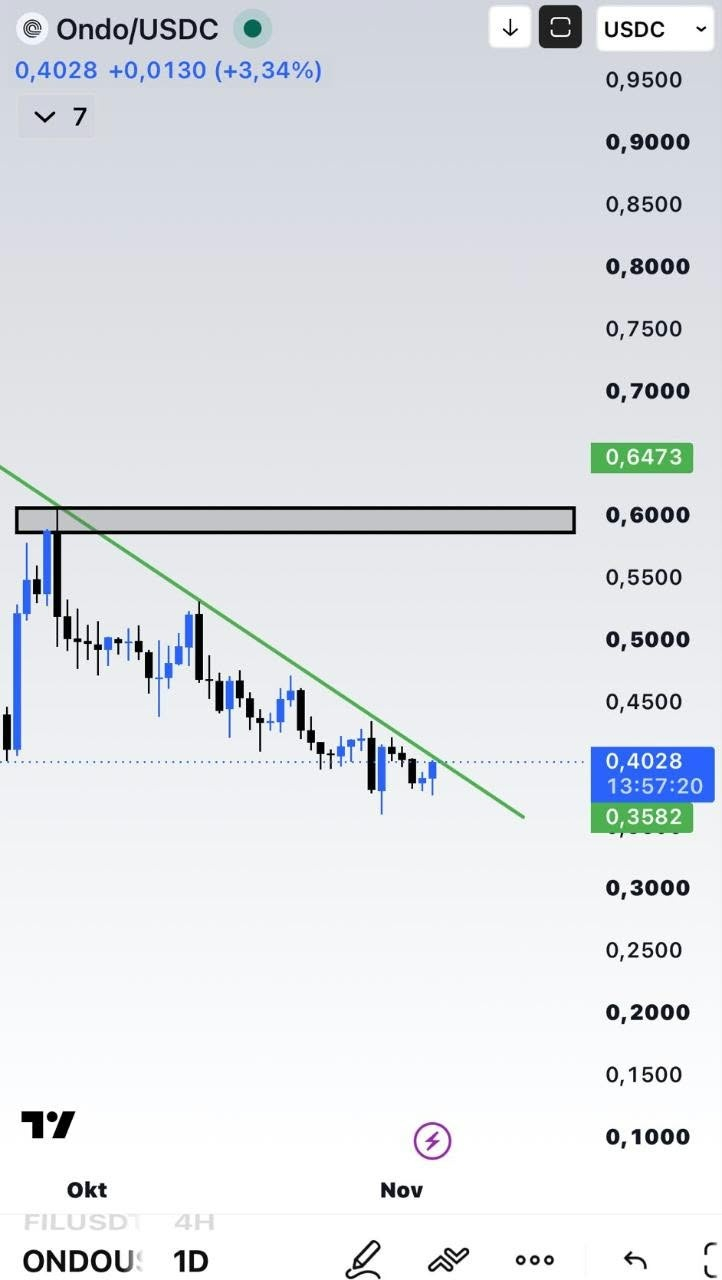
$ONDO nihoyat kunlik grafikda trend chizig‘iga qarshi yuqoriga harakat qilmoqda va ko‘rayotganlarim menga ma’qul.
Do‘stlar, oktabrda 0.60 atrofida rad etilganidan beri narx shu chiziq ostida pasayib kelayotgandi. Har bir ko‘tarilishda sotuvchilar paydo bo‘ldi, shuning uchun narx bir necha haftadan beri ilk bor biroz kuch bilan chiziqqa tomon ko‘tarildi. Kuchli +3% kun ortidan narx hozir 0.40 atrofida, xaridorlar shunchaki umid qilmay, haqiqatan ham xaridga kirishayotganga o‘xshaydi.
Hozircha buni to‘liq burilish deb atamayman. Avval kunlik yopilish chiziqdan yuqorida bo‘lishini, keyin esa narx chiziqni qayta sinab, uning ustida saqlanishini ko‘rmoqchiman. Agar shunday bo‘lsa, 0.45 darajasi ochiladi, 0.60 dagi taklif zonasi esa kattaroq maqsad bo‘ladi. Agar narx yana rad etilsa, pasayishda 0.358 darajasini kuzataman.
Hozircha buni ijobiy o‘zgarish deb baholayman va vaziyatni diqqat bilan kuzatyapman.
O‘zingiz mustaqil tadqiqot qiling.
$ONDO #Ondo #RWA #Crypto
#TechnicalAnalysis
{future}(ONDOUSDT)
$ONDO nihoyat kunlik grafikda trend chizig‘iga qarshi yuqoriga harakat qilmoqda va ko‘rayotganlarim menga ma’qul.
Do‘stlar, oktabrda 0.60 atrofida rad etilganidan beri narx shu chiziq ostida pasayib kelayotgandi. Har bir ko‘tarilishda sotuvchilar paydo bo‘ldi, shuning uchun narx bir necha haftadan beri ilk bor biroz kuch bilan chiziqqa tomon ko‘tarildi. Kuchli +3% kun ortidan narx hozir 0.40 atrofida, xaridorlar shunchaki umid qilmay, haqiqatan ham xaridga kirishayotganga o‘xshaydi.
Hozircha buni to‘liq burilish deb atamayman. Avval kunlik yopilish chiziqdan yuqorida bo‘lishini, keyin esa narx chiziqni qayta sinab, uning ustida saqlanishini ko‘rmoqchiman. Agar shunday bo‘lsa, 0.45 darajasi ochiladi, 0.60 dagi taklif zonasi esa kattaroq maqsad bo‘ladi. Agar narx yana rad etilsa, pasayishda 0.358 darajasini kuzataman.
Hozircha buni ijobiy o‘zgarish deb baholayman va vaziyatni diqqat bilan kuzatyapman.
O‘zingiz mustaqil tadqiqot qiling.
$ONDO #Ondo #RWA #Crypto
#TechnicalAnalysis
Do‘stlar, oktabrda 0.60 atrofida rad etilganidan beri narx shu chiziq ostida pasayib kelayotgandi. Har bir ko‘tarilishda sotuvchilar paydo bo‘ldi, shuning uchun narx bir necha haftadan beri ilk bor biroz kuch bilan chiziqqa tomon ko‘tarildi. Kuchli +3% kun ortidan narx hozir 0.40 atrofida, xaridorlar shunchaki umid qilmay, haqiqatan ham xaridga kirishayotganga o‘xshaydi.
Hozircha buni to‘liq burilish deb atamayman. Avval kunlik yopilish chiziqdan yuqorida bo‘lishini, keyin esa narx chiziqni qayta sinab, uning ustida saqlanishini ko‘rmoqchiman. Agar shunday bo‘lsa, 0.45 darajasi ochiladi, 0.60 dagi taklif zonasi esa kattaroq maqsad bo‘ladi. Agar narx yana rad etilsa, pasayishda 0.358 darajasini kuzataman.
Hozircha buni ijobiy o‘zgarish deb baholayman va vaziyatni diqqat bilan kuzatyapman.
O‘zingiz mustaqil tadqiqot qiling.
$ONDO #Ondo #RWA #Crypto
#TechnicalAnalysis
127


Tarjimani ko‘rish
$ONDO: Deciphering Momentum Across the Venue
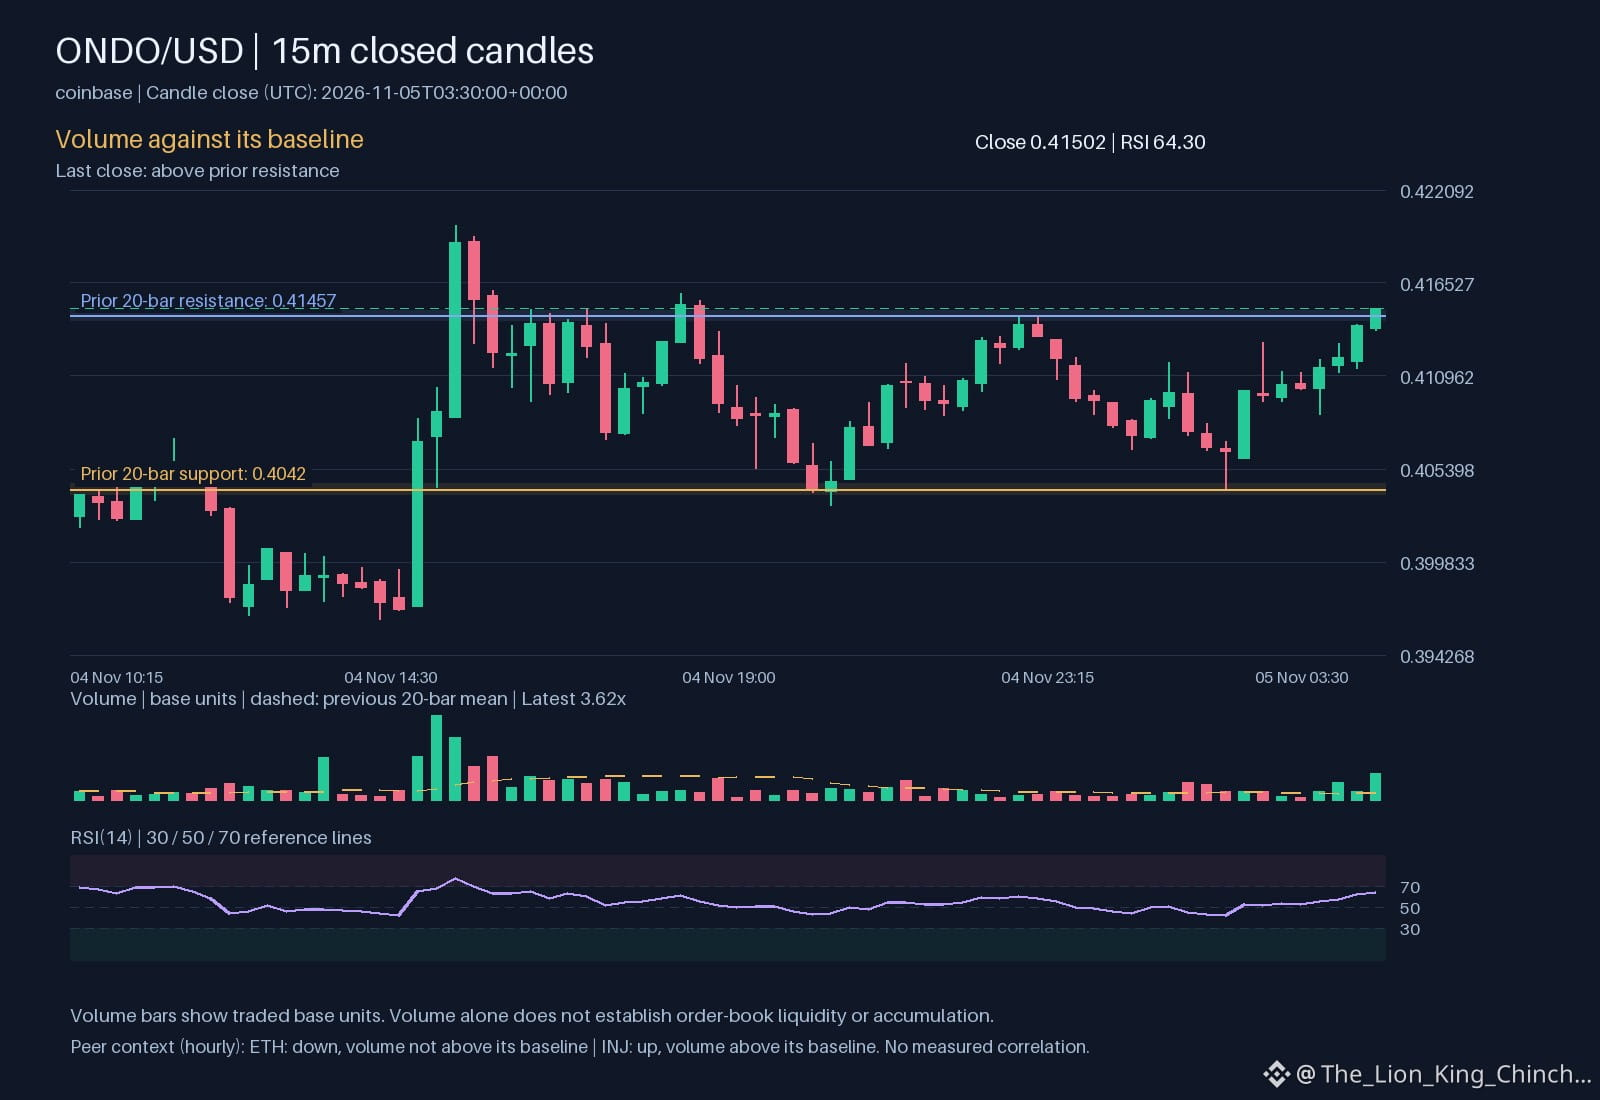
The current chart for $ONDO shows price at 0.41502 which is above resistance at 0.41457. This move aligns with an hourly direction of up while volume stays above its baseline. While seeing a green candle on the primary asset suggests immediate strength, we must compare this against broader venue activity. For example, peer assets like ETH show an hourly direction down with volume not above its baseline. In contrast, INJ displays an hourly direction up with volume above its baseline. These differences illustrate that even on the same exchange, assets do not move in a single pack.
One mechanism worth exploring is how relative volume at 3.6157 indicates the intensity of a move. When volume is high, it suggests the price is being tested by more participants. However, a shared upward direction between $ONDO and INJ does not imply a common cause. It is a thought experiment to consider if these assets are truly linked or simply reacting to isolated buy orders.
What matters most is whether the move holds or fades quickly. If RSI at 64.3047 becomes overextended while the move lacks sustained volume, the trend may be fragile. Traders can reassess the interpretation by watching if $ONDO maintains support at 0.4042 over several hourly closes. A leader on a specific list is not necessarily leading the whole market. 🕯️
Probabilistic market research, not a recommendation or guaranteed return.
The comparison to keep in mind: $ETH has hourly direction down and volume not above its baseline; $INJ has hourly direction up and volume above its baseline. This alone does not establish correlation.
Which matters more in this comparison: direction or how the move holds?
#ONDO #ETH
$ONDO : Deciphering Momentum Across the Venue
The current chart for $ONDO shows price at 0.41502 which is above resistance at 0.41457. This move aligns with an hourly direction of up while volume stays above its baseline. While seeing a green candle on the primary asset suggests immediate strength, we must compare this against broader venue activity. For example, peer assets like ETH show an hourly direction down with volume not above its baseline. In contrast, INJ displays an hourly direction up with volume above its baseline. These differences illustrate that even on the same exchange, assets do not move in a single pack.
One mechanism worth exploring is how relative volume at 3.6157 indicates the intensity of a move. When volume is high, it suggests the price is being tested by more participants. However, a shared upward direction between $ONDO and INJ does not imply a common cause. It is a thought experiment to consider if these assets are truly linked or simply reacting to isolated buy orders.
What matters most is whether the move holds or fades quickly. If RSI at 64.3047 becomes overextended while the move lacks sustained volume, the trend may be fragile. Traders can reassess the interpretation by watching if $ONDO maintains support at 0.4042 over several hourly closes. A leader on a specific list is not necessarily leading the whole market. 🕯️
Probabilistic market research, not a recommendation or guaranteed return.
The comparison to keep in mind: $ETH has hourly direction down and volume not above its baseline; $INJ has hourly direction up and volume above its baseline. This alone does not establish correlation.
Which matters more in this comparison: direction or how the move holds?
#ONDO #ETH
The current chart for $ONDO shows price at 0.41502 which is above resistance at 0.41457. This move aligns with an hourly direction of up while volume stays above its baseline. While seeing a green candle on the primary asset suggests immediate strength, we must compare this against broader venue activity. For example, peer assets like ETH show an hourly direction down with volume not above its baseline. In contrast, INJ displays an hourly direction up with volume above its baseline. These differences illustrate that even on the same exchange, assets do not move in a single pack.
One mechanism worth exploring is how relative volume at 3.6157 indicates the intensity of a move. When volume is high, it suggests the price is being tested by more participants. However, a shared upward direction between $ONDO and INJ does not imply a common cause. It is a thought experiment to consider if these assets are truly linked or simply reacting to isolated buy orders.
What matters most is whether the move holds or fades quickly. If RSI at 64.3047 becomes overextended while the move lacks sustained volume, the trend may be fragile. Traders can reassess the interpretation by watching if $ONDO maintains support at 0.4042 over several hourly closes. A leader on a specific list is not necessarily leading the whole market. 🕯️
Probabilistic market research, not a recommendation or guaranteed return.
The comparison to keep in mind: $ETH has hourly direction down and volume not above its baseline; $INJ has hourly direction up and volume above its baseline. This alone does not establish correlation.
Which matters more in this comparison: direction or how the move holds?
#ONDO #ETH
20

·
--
Tarjimani ko‘rish
ONDO buy pressure is strengthening.
Buy Share
15m 78.4% | 1h 51.2%
4h 52.4% | 12h 53.2% | 1D 52.8%
15m Flow
Buy $93.44K | Sell $25.72K
Net +$67.72K | B/S 3.63
Cash Share 0.5%
Market
12h 50.0% | 1D 52.6%
Order Book: Bid-heavy (1.13)
Buy-side flow is also supported by bid-heavy order-book depth.
RADAVOX Market Intelligence
#ONDO #Crypto
ONDO buy pressure is strengthening.
Buy Share
15m 78.4% | 1h 51.2%
4h 52.4% | 12h 53.2% | 1D 52.8%
15m Flow
Buy $93.44K | Sell $25.72K
Net +$67.72K | B/S 3.63
Cash Share 0.5%
Market
12h 50.0% | 1D 52.6%
Order Book: Bid-heavy (1.13)
Buy-side flow is also supported by bid-heavy order-book depth.
RADAVOX Market Intelligence
#ONDO #Crypto
Buy Share
15m 78.4% | 1h 51.2%
4h 52.4% | 12h 53.2% | 1D 52.8%
15m Flow
Buy $93.44K | Sell $25.72K
Net +$67.72K | B/S 3.63
Cash Share 0.5%
Market
12h 50.0% | 1D 52.6%
Order Book: Bid-heavy (1.13)
Buy-side flow is also supported by bid-heavy order-book depth.
RADAVOX Market Intelligence
#ONDO #Crypto
8

·
--
🔍 $ONDO o‘sish tahlili
5 daqiqa: -0.29%
1 soat: +0.78%
4 soat: +0.66%
24 soat: +7.13%
Joriy narx: 0.4115, 24 soatlik savdo hajmi: $1193万
O‘sish asosan 1 soat ichida yuz berdi — bu kutilmagan narx ko‘tarilishi.
Sizningcha, bu haqiqiy yorib o‘tishmi yoki narxni ko‘tarib, sotib yuborishmi? 👇
(Ma’lumotlar tahlili, investitsiya tavsiyasi emas, DYOR)
#ONDO #Ondo
🔍 $ONDO o‘sish tahlili
5 daqiqa: -0.29%
1 soat: +0.78%
4 soat: +0.66%
24 soat: +7.13%
Joriy narx: 0.4115, 24 soatlik savdo hajmi: $1193万
O‘sish asosan 1 soat ichida yuz berdi — bu kutilmagan narx ko‘tarilishi.
Sizningcha, bu haqiqiy yorib o‘tishmi yoki narxni ko‘tarib, sotib yuborishmi? 👇
(Ma’lumotlar tahlili, investitsiya tavsiyasi emas, DYOR)
#ONDO #Ondo
5 daqiqa: -0.29%
1 soat: +0.78%
4 soat: +0.66%
24 soat: +7.13%
Joriy narx: 0.4115, 24 soatlik savdo hajmi: $1193万
O‘sish asosan 1 soat ichida yuz berdi — bu kutilmagan narx ko‘tarilishi.
Sizningcha, bu haqiqiy yorib o‘tishmi yoki narxni ko‘tarib, sotib yuborishmi? 👇
(Ma’lumotlar tahlili, investitsiya tavsiyasi emas, DYOR)
#ONDO #Ondo

$ONDO tezkor momentum kuchayishi mumkin bo‘lgan muhim qaror zonasiga yetib bormoqda.
$ONDO qo‘llab-quvvatlash darajasiga yaqin turibdi va bu yerdagi navbatdagi reaksiya kun ichidagi keyingi harakatni belgilashi mumkin.
LONG sozlamasi $ONDO (maks. 10x)
🎯 Kirish: 0.4045 - 0.4077
🛑 SL: 0.4035
✅ TP1: 0.4118
✅ TP2: 0.4171
✅ TP3: 0.4232
• So‘nggi 24 soatdagi o‘zgaruvchanlik yanada aniqroq savdo sozlamasini yaratmoqda
• Nisbiy savdo hajmi bu grafikni kuzatuv ro‘yxatlarida faol saqlamoqda
$ONDO bo‘yicha sizga qaysi biri ma’qul: yorib o‘tishmi yoki qayta testdan keyingi kirishmi?
Bu yerda savdo qiling $ONDO 👇
#ONDO #MarketStructure #SavdoSozlamasi
$ONDO tezkor momentum kuchayishi mumkin bo‘lgan muhim qaror zonasiga yetib bormoqda.
$ONDO qo‘llab-quvvatlash darajasiga yaqin turibdi va bu yerdagi navbatdagi reaksiya kun ichidagi keyingi harakatni belgilashi mumkin.
LONG sozlamasi $ONDO (maks. 10x)
🎯 Kirish: 0.4045 - 0.4077
🛑 SL: 0.4035
✅ TP1: 0.4118
✅ TP2: 0.4171
✅ TP3: 0.4232
• So‘nggi 24 soatdagi o‘zgaruvchanlik yanada aniqroq savdo sozlamasini yaratmoqda
• Nisbiy savdo hajmi bu grafikni kuzatuv ro‘yxatlarida faol saqlamoqda
$ONDO bo‘yicha sizga qaysi biri ma’qul: yorib o‘tishmi yoki qayta testdan keyingi kirishmi?
Bu yerda savdo qiling $ONDO 👇
#ONDO #MarketStructure #SavdoSozlamasi
$ONDO qo‘llab-quvvatlash darajasiga yaqin turibdi va bu yerdagi navbatdagi reaksiya kun ichidagi keyingi harakatni belgilashi mumkin.
LONG sozlamasi $ONDO (maks. 10x)
🎯 Kirish: 0.4045 - 0.4077
🛑 SL: 0.4035
✅ TP1: 0.4118
✅ TP2: 0.4171
✅ TP3: 0.4232
• So‘nggi 24 soatdagi o‘zgaruvchanlik yanada aniqroq savdo sozlamasini yaratmoqda
• Nisbiy savdo hajmi bu grafikni kuzatuv ro‘yxatlarida faol saqlamoqda
$ONDO bo‘yicha sizga qaysi biri ma’qul: yorib o‘tishmi yoki qayta testdan keyingi kirishmi?
Bu yerda savdo qiling $ONDO 👇
#ONDO #MarketStructure #SavdoSozlamasi
52

·
--
$ONDO bu yerdan yuqoriga ko‘tarilishga tayyor ko‘rinadi
🎯 Xarid: $ONDO 0.40456 dan 0.40924 gacha
Stop-loss: 0.40038
Maqsadlar: 0.42018 / 0.42809 / 0.43997
Bugun 6.0 foizga ko‘tarildi va mustahkam turibdi
RSI 57, demak xaridorlar uchun hali imkoniyat bor
Buni yozayotganimda narx zona ichida turibdi
Xarid qilish uchun $ONDO ustiga bosing
Xarid qilasizmi yoki kuzatib turasizmi
#ONDO #SavdoSignallari
$ONDO bu yerdan yuqoriga ko‘tarilishga tayyor ko‘rinadi
🎯 Xarid: $ONDO 0.40456 dan 0.40924 gacha
Stop-loss: 0.40038
Maqsadlar: 0.42018 / 0.42809 / 0.43997
Bugun 6.0 foizga ko‘tarildi va mustahkam turibdi
RSI 57, demak xaridorlar uchun hali imkoniyat bor
Buni yozayotganimda narx zona ichida turibdi
Xarid qilish uchun $ONDO ustiga bosing
Xarid qilasizmi yoki kuzatib turasizmi
#ONDO #SavdoSignallari
🎯 Xarid: $ONDO 0.40456 dan 0.40924 gacha
Stop-loss: 0.40038
Maqsadlar: 0.42018 / 0.42809 / 0.43997
Bugun 6.0 foizga ko‘tarildi va mustahkam turibdi
RSI 57, demak xaridorlar uchun hali imkoniyat bor
Buni yozayotganimda narx zona ichida turibdi
Xarid qilish uchun $ONDO ustiga bosing
Xarid qilasizmi yoki kuzatib turasizmi
#ONDO #SavdoSignallari
29

·
--
$ONDO bugun ertalab ortida haqiqiy harakat turgan trenddagi nom — hajm qariyb $128M bo‘lgan holda, taxminan 6,7% ga ko‘tarilib, $0.41 atrofida turibdi. Shu bilan birga, RWA sohasi ham trenddagi toifalarda ko‘rinishda davom etmoqda. Yaqin atrofda $ETH yanada shiddatliroq o‘smoqda: qariyb 7% ga ko‘tarilib, $2,423 atrofida. Demak, bu shunchaki alohida qisqa muddatli sakrash emas. $ONDO $0.40 dan yuqorida qoladimi, shuni kuzatyapman; agar shunday bo‘lsa, trenddagi bu e’tibor yana biroz davom etsa kerak. #ONDO
$ONDO bugun ertalab ortida haqiqiy harakat turgan trenddagi nom — hajm qariyb $128M bo‘lgan holda, taxminan 6,7% ga ko‘tarilib, $0.41 atrofida turibdi. Shu bilan birga, RWA sohasi ham trenddagi toifalarda ko‘rinishda davom etmoqda. Yaqin atrofda $ETH yanada shiddatliroq o‘smoqda: qariyb 7% ga ko‘tarilib, $2,423 atrofida. Demak, bu shunchaki alohida qisqa muddatli sakrash emas. $ONDO $0.40 dan yuqorida qoladimi, shuni kuzatyapman; agar shunday bo‘lsa, trenddagi bu e’tibor yana biroz davom etsa kerak. #ONDO
55

·
--
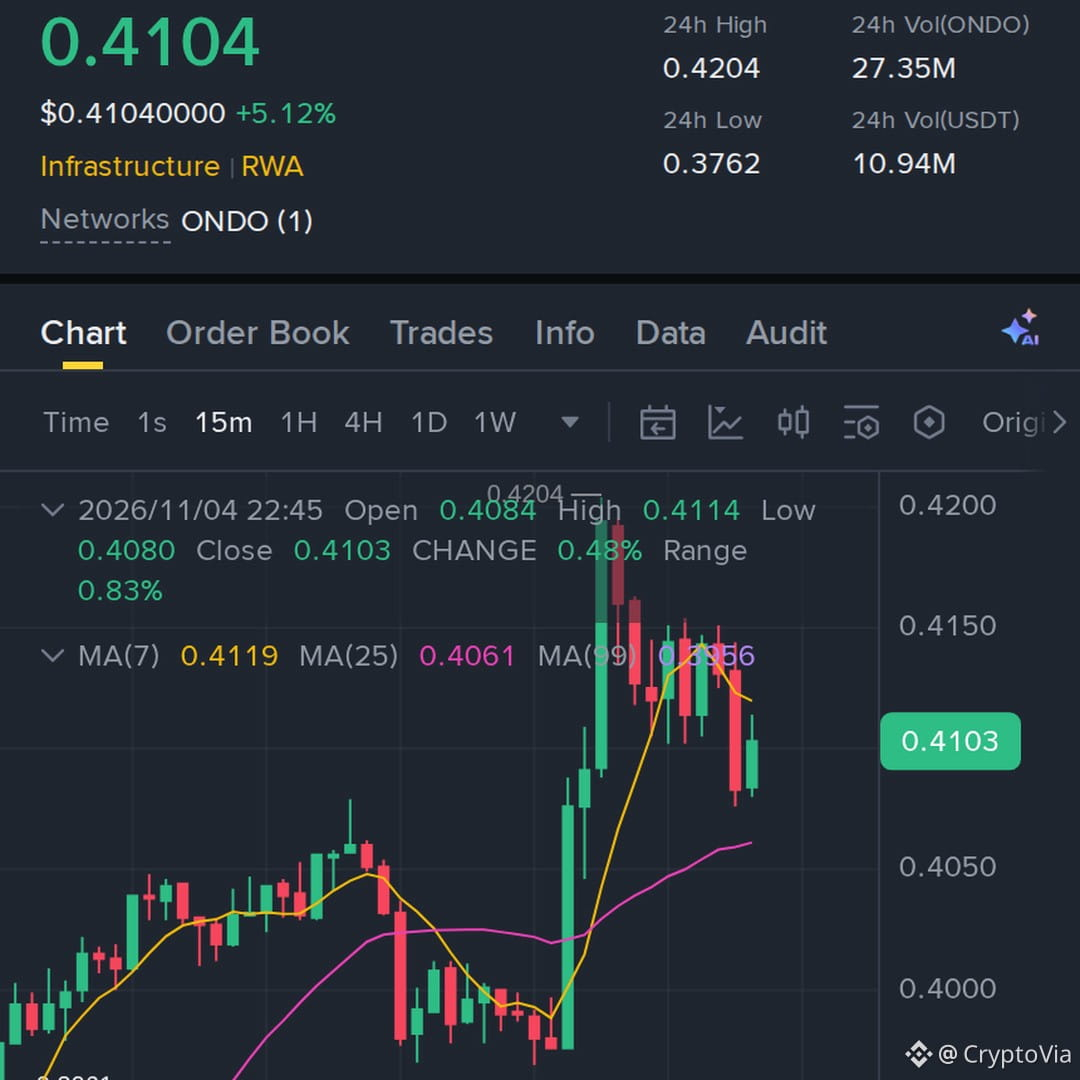
6.75% kunlik o‘sish fonida savdo hajmining pastligi narx ortidan quvmaslik kerakligidan ogohlantiradi.
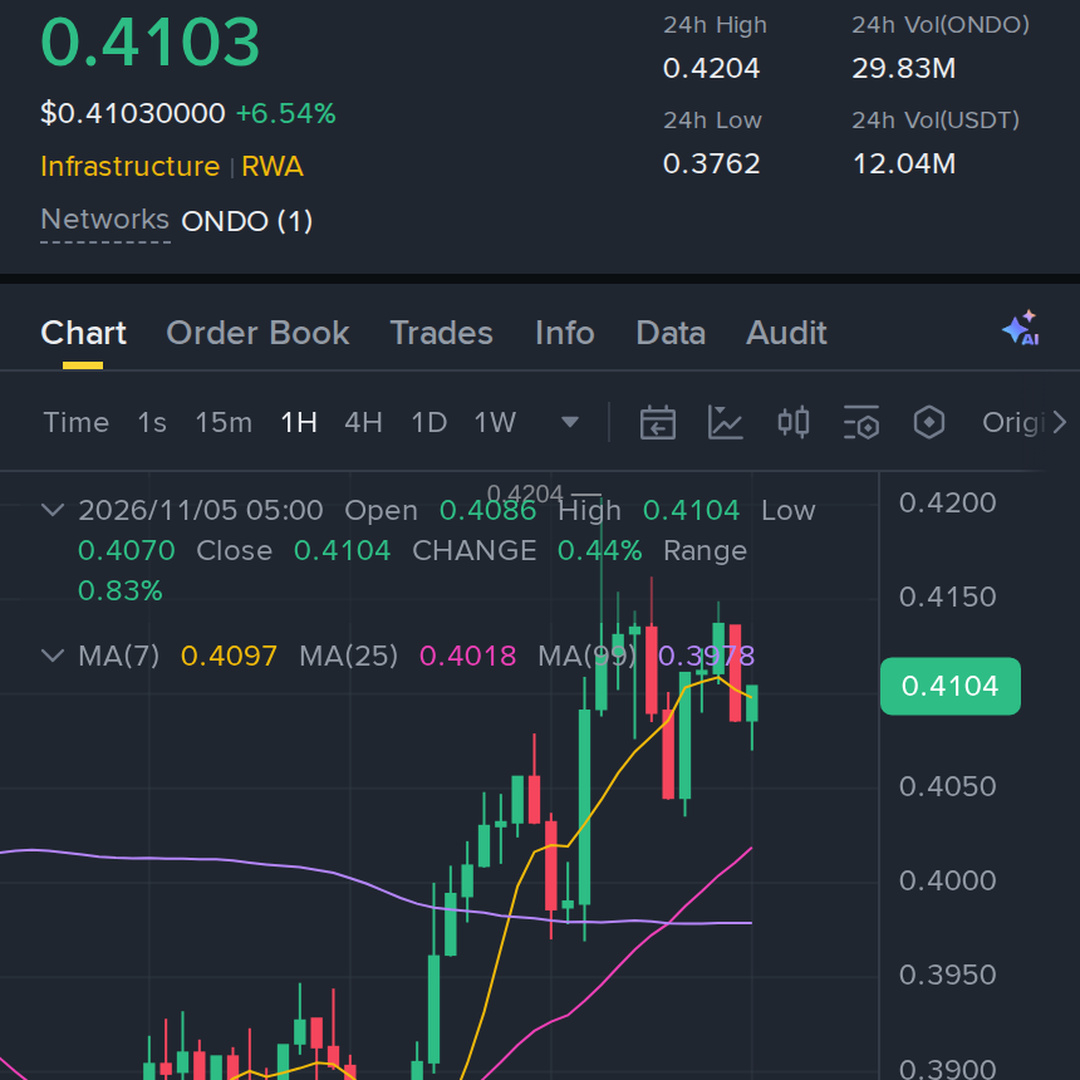
$ONDO savdo $0.4096 narxda va kunlik $12.02M hajmda amalga oshmoqda, biroq oxirgi soatlik sham oldingi 23 soatlik o‘rtacha ko‘rsatkichga nisbatan 0.46x past hajmda 1.21% ga pasaydi.
Bu tafovut momentumni barqarorlikdan ajratib turadi.
O‘sish tasdiqlanishi uchun hajm ortib borayotgan sharoitda narx 23 soatlik $0.4204 cho‘qqisiga qarab barqaror ko‘tarilishi kerak. Aksincha, 23 soatlik $0.3762 eng past darajasidan pastga tushish o‘sish ssenariysini bekor qiladi.
$0.4204 dan yuqoriga hajm bilan tasdiqlangan yorib o‘tishni kutasizmi yoki $0.3762 atrofidagi qayta sinovni kuzatyapsizmi?
Jonli grafikni ko‘rish uchun $ONDO ustiga bosing. #ONDO #BinanceSquare
6.75% kunlik o‘sish fonida savdo hajmining pastligi narx ortidan quvmaslik kerakligidan ogohlantiradi.
$ONDO savdo $0.4096 narxda va kunlik $12.02M hajmda amalga oshmoqda, biroq oxirgi soatlik sham oldingi 23 soatlik o‘rtacha ko‘rsatkichga nisbatan 0.46x past hajmda 1.21% ga pasaydi.
Bu tafovut momentumni barqarorlikdan ajratib turadi.
O‘sish tasdiqlanishi uchun hajm ortib borayotgan sharoitda narx 23 soatlik $0.4204 cho‘qqisiga qarab barqaror ko‘tarilishi kerak. Aksincha, 23 soatlik $0.3762 eng past darajasidan pastga tushish o‘sish ssenariysini bekor qiladi.
$0.4204 dan yuqoriga hajm bilan tasdiqlangan yorib o‘tishni kutasizmi yoki $0.3762 atrofidagi qayta sinovni kuzatyapsizmi?
Jonli grafikni ko‘rish uchun $ONDO ustiga bosing. #ONDO #BinanceSquare
$ONDO savdo $0.4096 narxda va kunlik $12.02M hajmda amalga oshmoqda, biroq oxirgi soatlik sham oldingi 23 soatlik o‘rtacha ko‘rsatkichga nisbatan 0.46x past hajmda 1.21% ga pasaydi.
Bu tafovut momentumni barqarorlikdan ajratib turadi.
O‘sish tasdiqlanishi uchun hajm ortib borayotgan sharoitda narx 23 soatlik $0.4204 cho‘qqisiga qarab barqaror ko‘tarilishi kerak. Aksincha, 23 soatlik $0.3762 eng past darajasidan pastga tushish o‘sish ssenariysini bekor qiladi.
$0.4204 dan yuqoriga hajm bilan tasdiqlangan yorib o‘tishni kutasizmi yoki $0.3762 atrofidagi qayta sinovni kuzatyapsizmi?
Jonli grafikni ko‘rish uchun $ONDO ustiga bosing. #ONDO #BinanceSquare
69

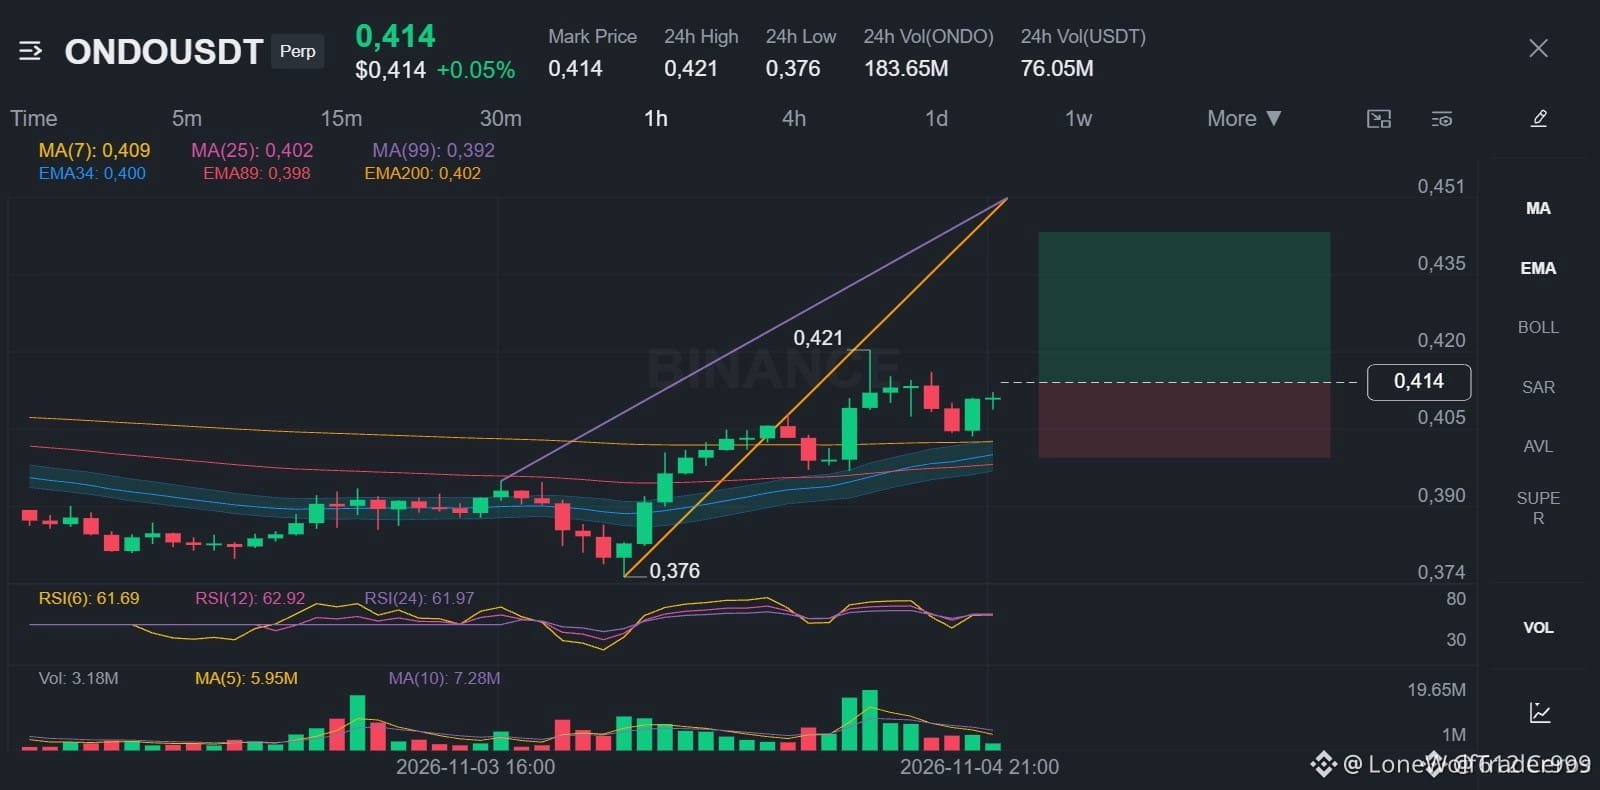
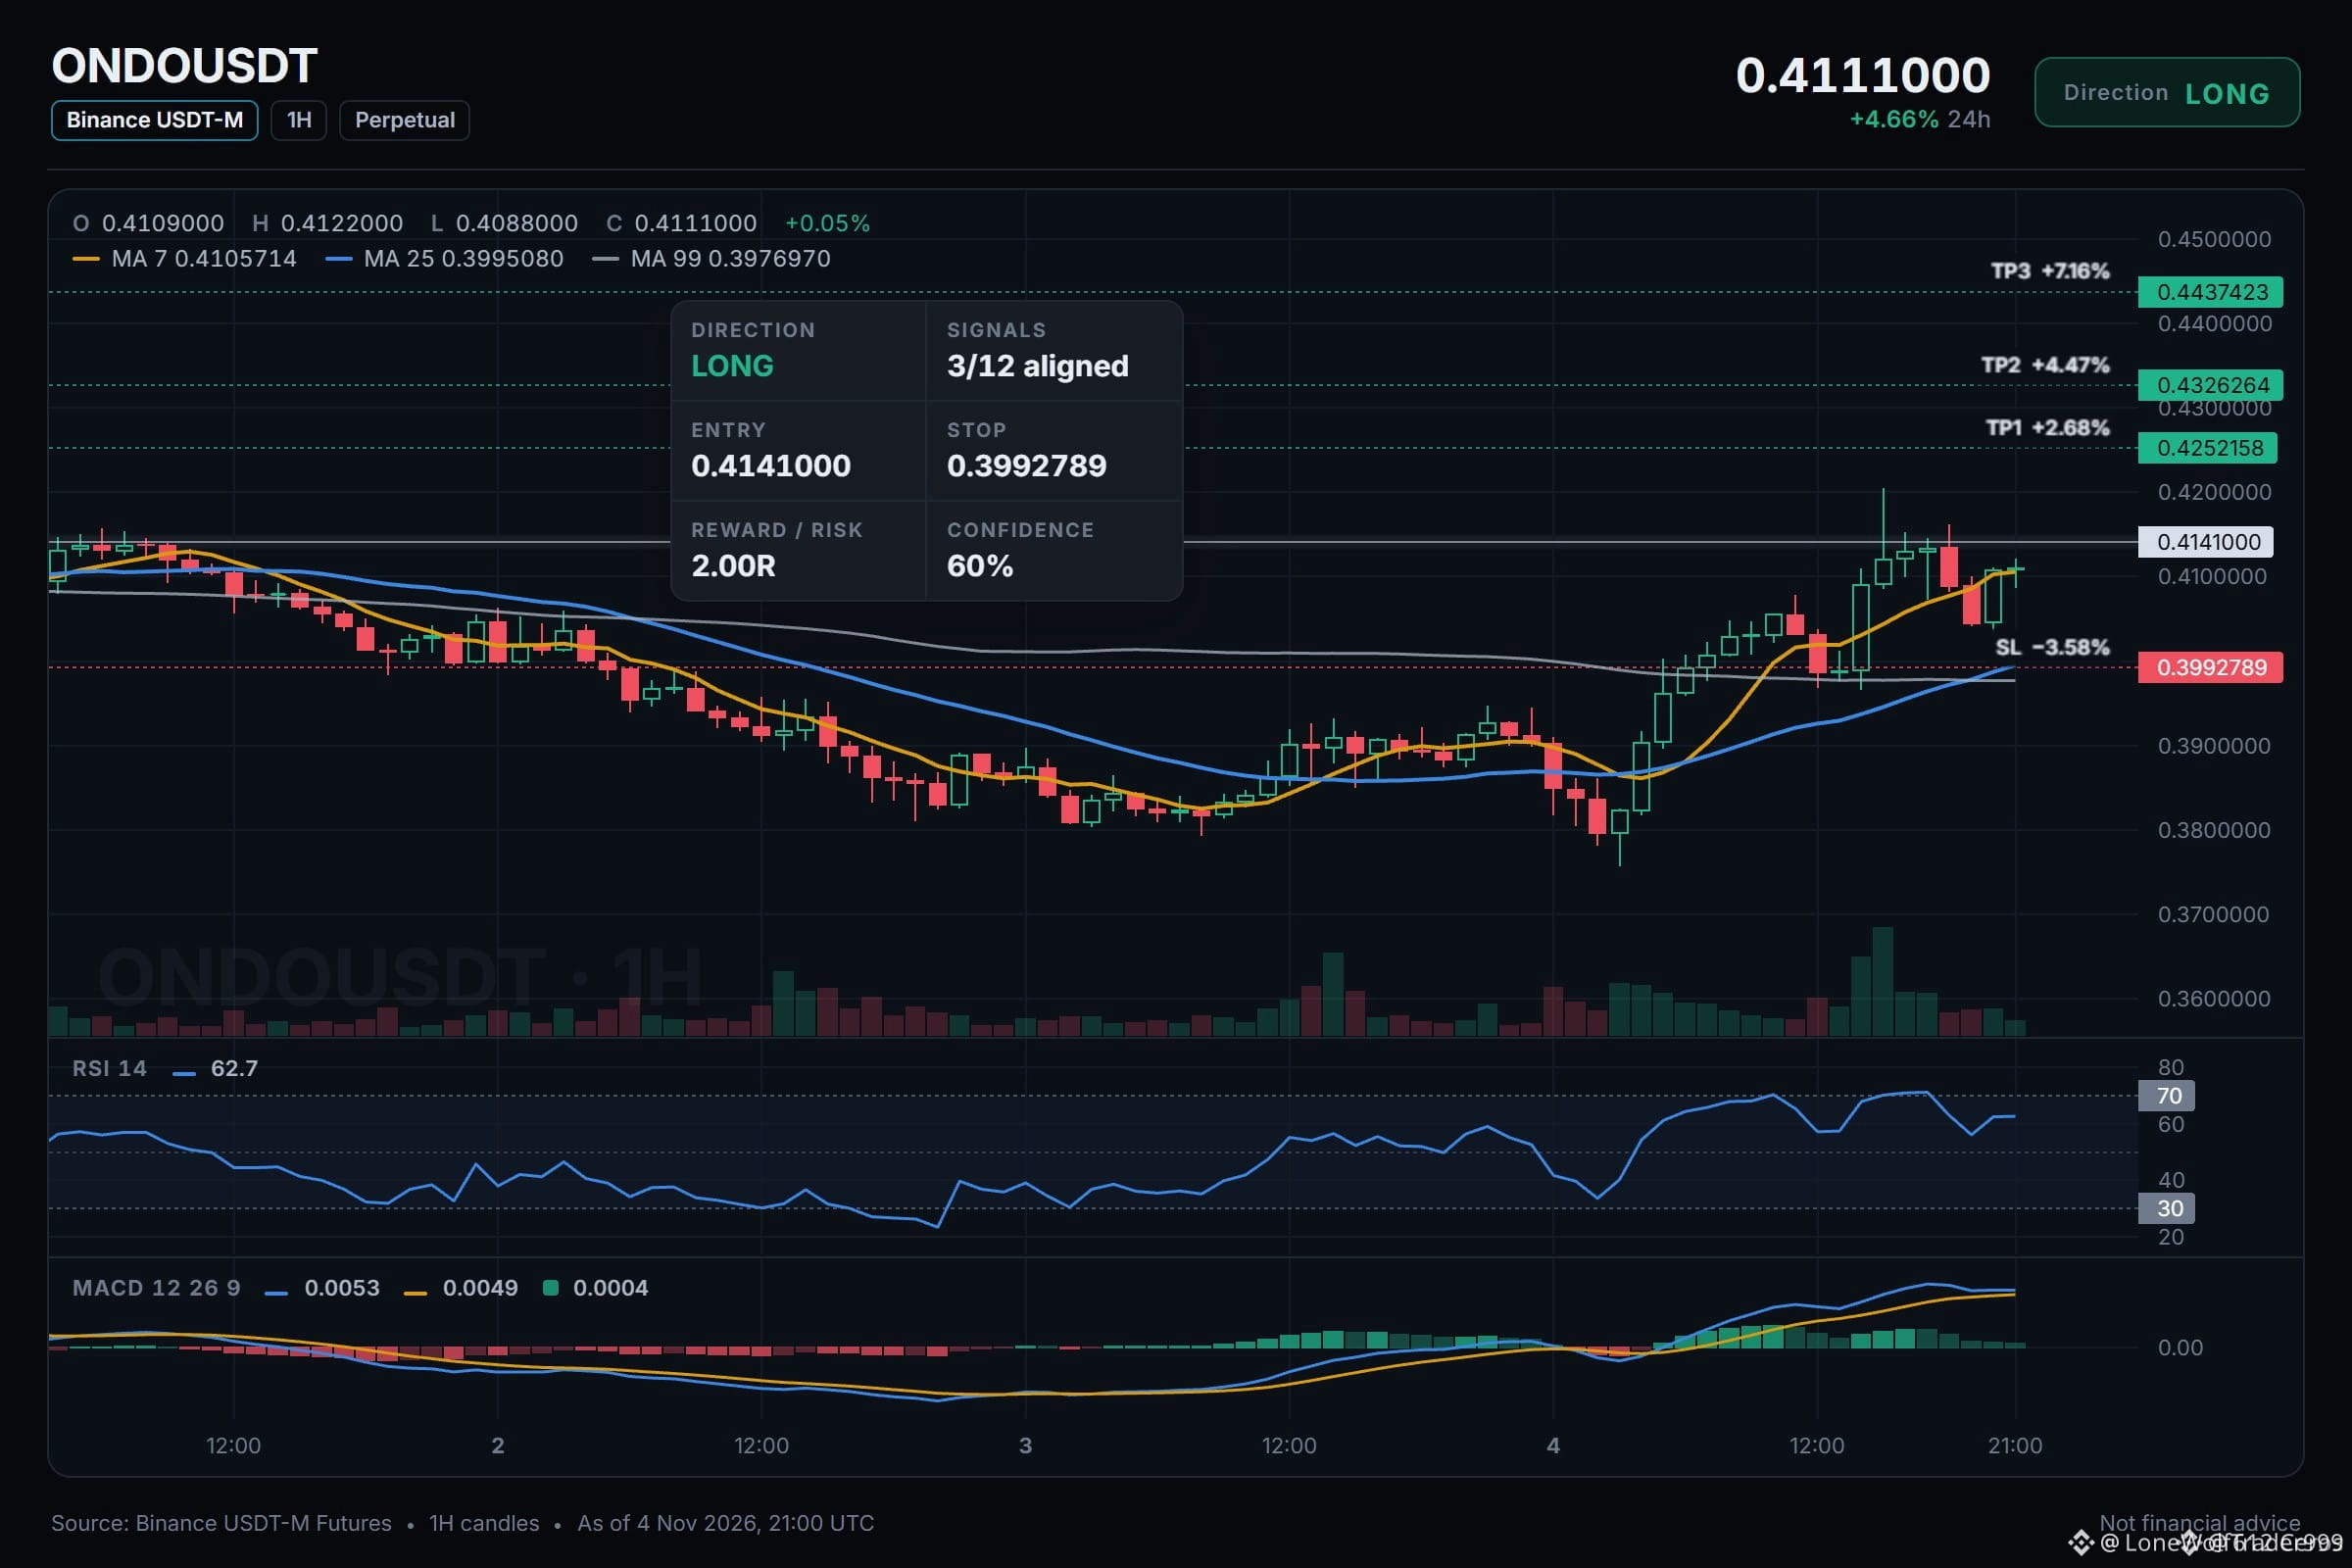
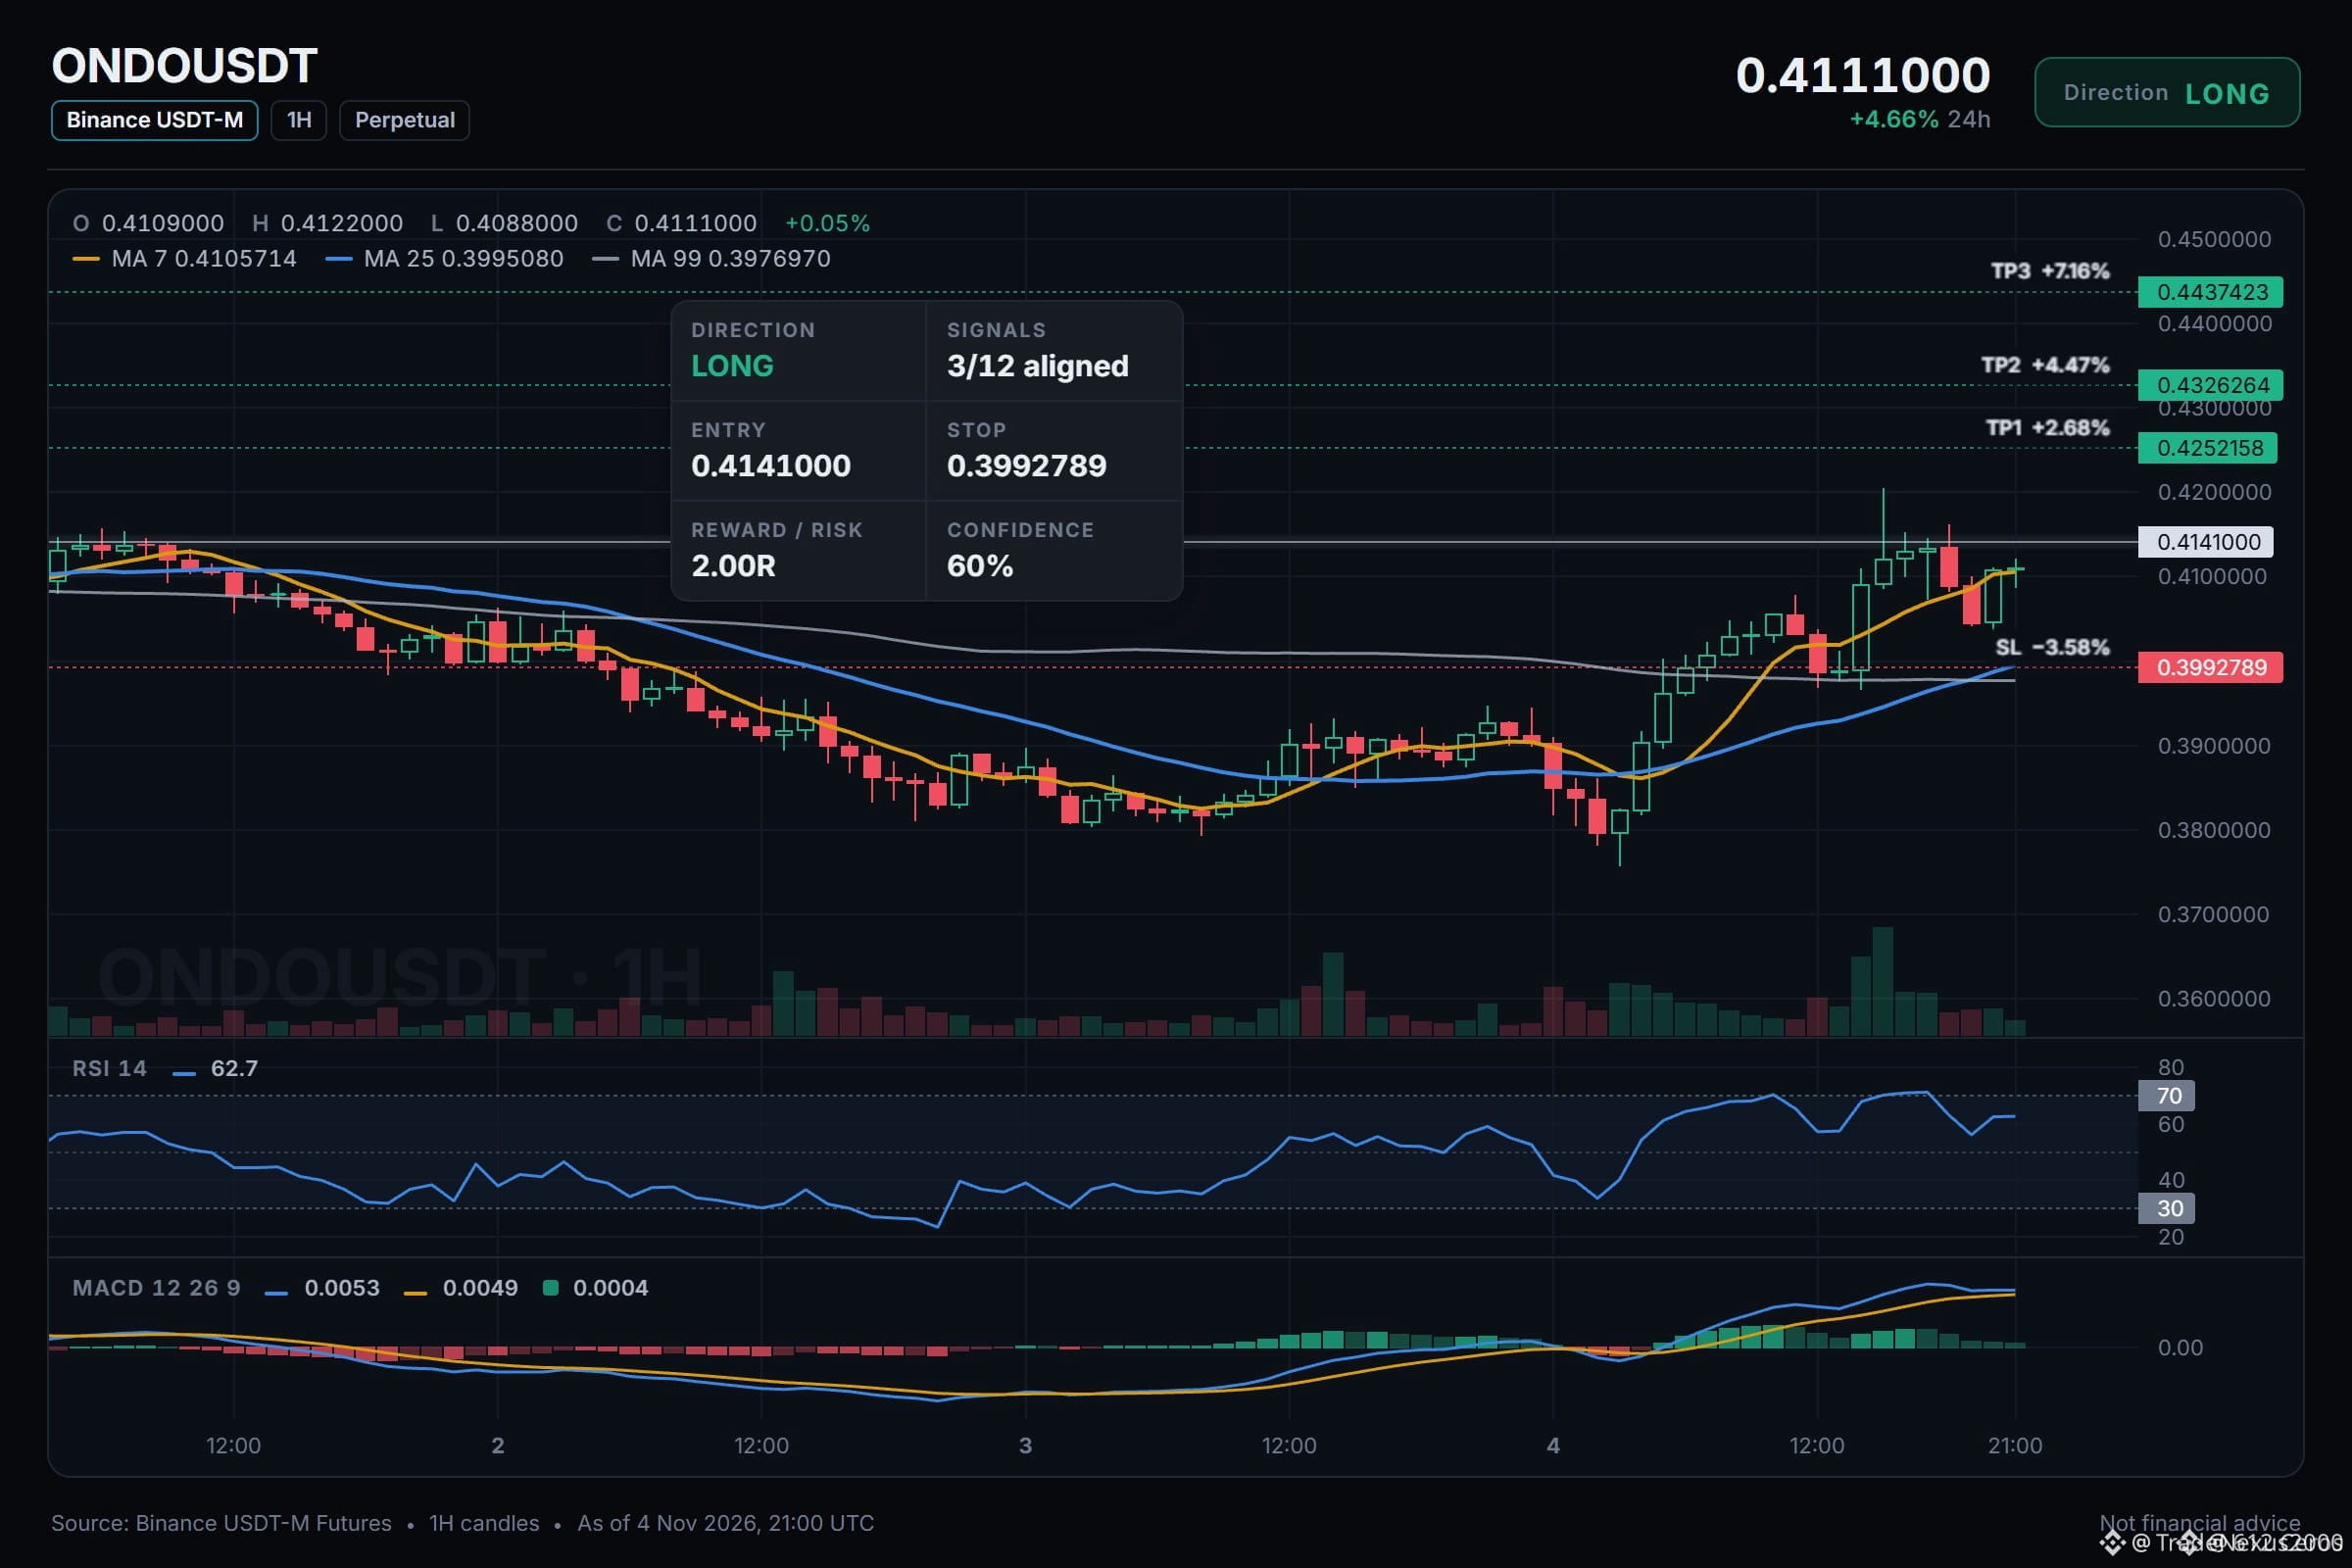
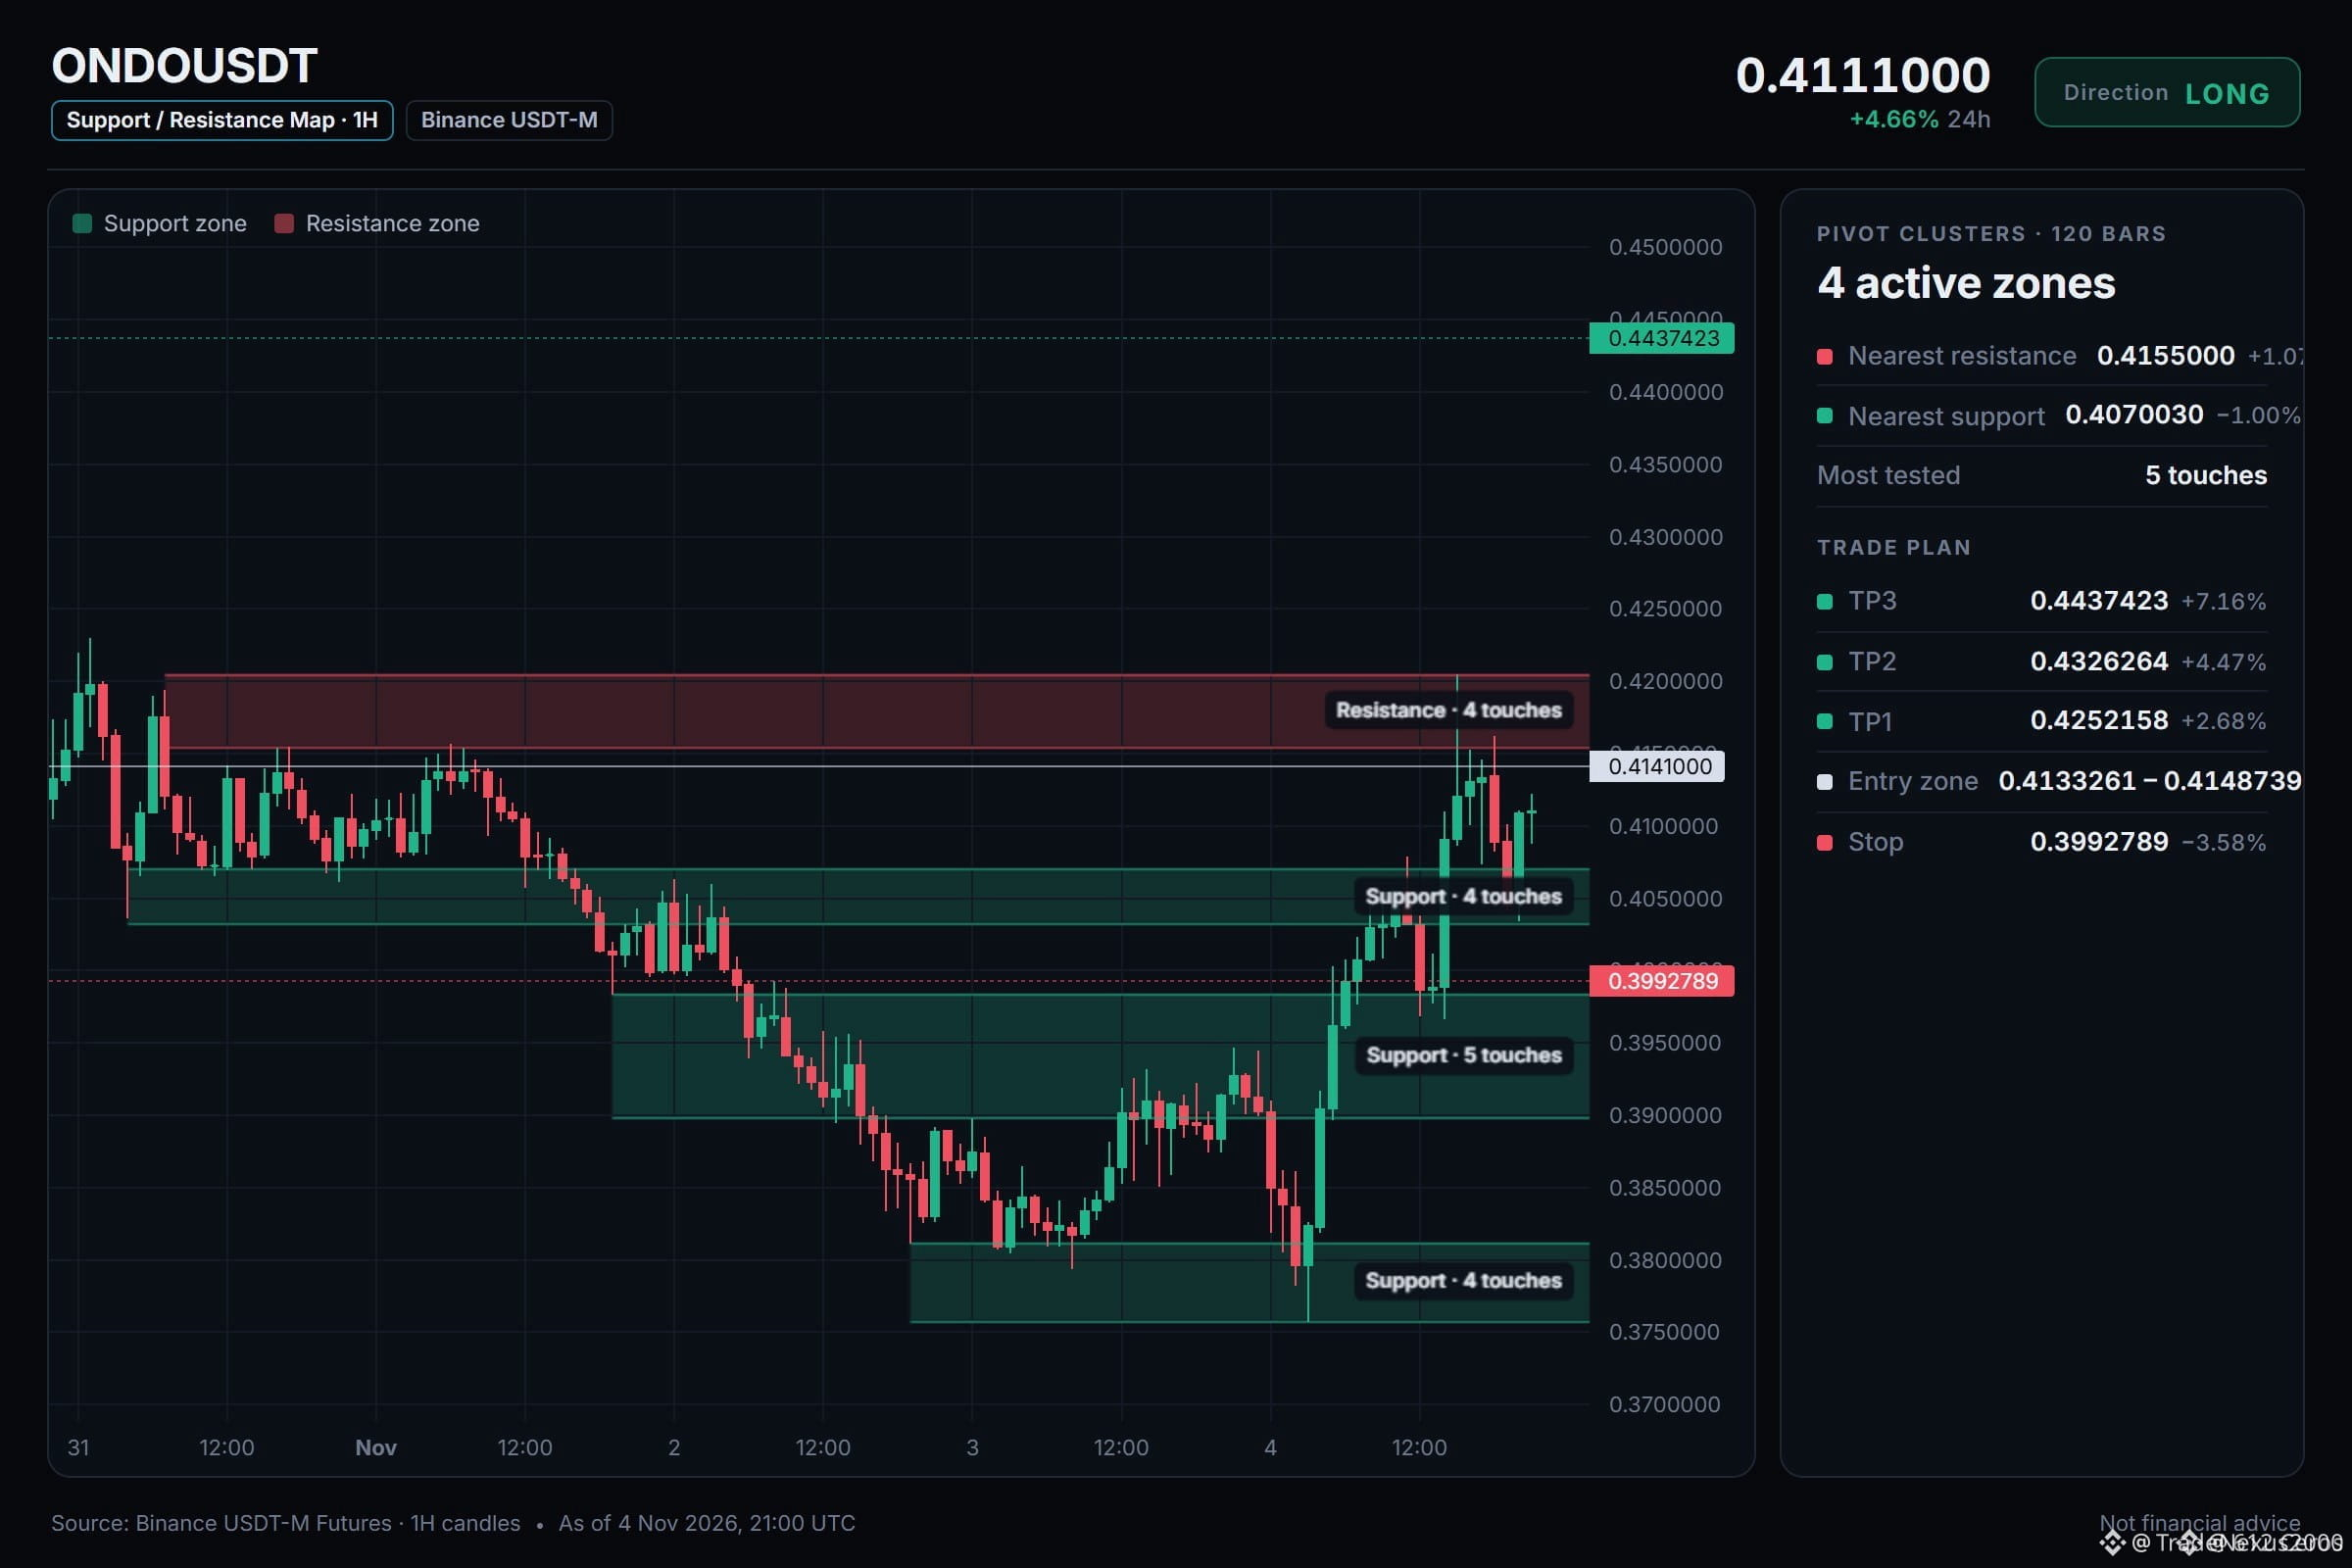
🚀 $ONDO aqlli pul yo‘nalishi bilan keskin ko‘tarilmoqda – kirish zonasi ogohlantirishi! 📈
Kirish: 0.4133-0.4149 ⚡
Maqsad: 0.4252 🚀
Maqsad: 0.4326 🚀
Maqsad: 0.4437 🚀
Zararni to‘xtatish: 0.3992789 ⚠️
📊 BTC’ning ko‘tarilish to‘lqini $ONDO ni yuqoriga tortmoqda, 1 soatlik RSI 62.7 bo‘lib, xaridorlar vaziyatni nazorat qilayotganini tasdiqlaydi. 🌊 Tor kirish diapazoni yangi talab blokiga yaqin joylashgan bo‘lib, pastda likvidlik kamayib borayotgan bir paytda o‘sish uchun qulay nuqta yaratadi.
💡 Ishonch o‘rtacha bo‘lgani uchun pozitsiyani kichik saqlaymiz: TP1’da 50% ni yopamiz, qolganini esa TP2 va TP3’da yopamiz. Birinchi foydadan so‘ng stopni zararsizlik darajasiga ko‘taramiz. ⚡
💬 Ushbu ko‘tarilish to‘lqinida $ONDO ni jamg‘arishga tayyormisiz? 👇
⚠️ Bu moliyaviy maslahat emas. Har doim tavakkalingizni boshqaring. 🛡️
🏷️ #ONDO #LongSetup #Crypto #RSI #Bullish
🔥 💎
🚀 $ONDO aqlli pul yo‘nalishi bilan keskin ko‘tarilmoqda – kirish zonasi ogohlantirishi! 📈
Kirish: 0.4133-0.4149 ⚡
Maqsad: 0.4252 🚀
Maqsad: 0.4326 🚀
Maqsad: 0.4437 🚀
Zararni to‘xtatish: 0.3992789 ⚠️
📊 BTC’ning ko‘tarilish to‘lqini $ONDO ni yuqoriga tortmoqda, 1 soatlik RSI 62.7 bo‘lib, xaridorlar vaziyatni nazorat qilayotganini tasdiqlaydi. 🌊 Tor kirish diapazoni yangi talab blokiga yaqin joylashgan bo‘lib, pastda likvidlik kamayib borayotgan bir paytda o‘sish uchun qulay nuqta yaratadi.
💡 Ishonch o‘rtacha bo‘lgani uchun pozitsiyani kichik saqlaymiz: TP1’da 50% ni yopamiz, qolganini esa TP2 va TP3’da yopamiz. Birinchi foydadan so‘ng stopni zararsizlik darajasiga ko‘taramiz. ⚡
💬 Ushbu ko‘tarilish to‘lqinida $ONDO ni jamg‘arishga tayyormisiz? 👇
⚠️ Bu moliyaviy maslahat emas. Har doim tavakkalingizni boshqaring. 🛡️
🏷️ #ONDO #LongSetup #Crypto #RSI #Bullish
🔥 💎
Kirish: 0.4133-0.4149 ⚡
Maqsad: 0.4252 🚀
Maqsad: 0.4326 🚀
Maqsad: 0.4437 🚀
Zararni to‘xtatish: 0.3992789 ⚠️
📊 BTC’ning ko‘tarilish to‘lqini $ONDO ni yuqoriga tortmoqda, 1 soatlik RSI 62.7 bo‘lib, xaridorlar vaziyatni nazorat qilayotganini tasdiqlaydi. 🌊 Tor kirish diapazoni yangi talab blokiga yaqin joylashgan bo‘lib, pastda likvidlik kamayib borayotgan bir paytda o‘sish uchun qulay nuqta yaratadi.
💡 Ishonch o‘rtacha bo‘lgani uchun pozitsiyani kichik saqlaymiz: TP1’da 50% ni yopamiz, qolganini esa TP2 va TP3’da yopamiz. Birinchi foydadan so‘ng stopni zararsizlik darajasiga ko‘taramiz. ⚡
💬 Ushbu ko‘tarilish to‘lqinida $ONDO ni jamg‘arishga tayyormisiz? 👇
⚠️ Bu moliyaviy maslahat emas. Har doim tavakkalingizni boshqaring. 🛡️
🏷️ #ONDO #LongSetup #Crypto #RSI #Bullish
🔥 💎
9
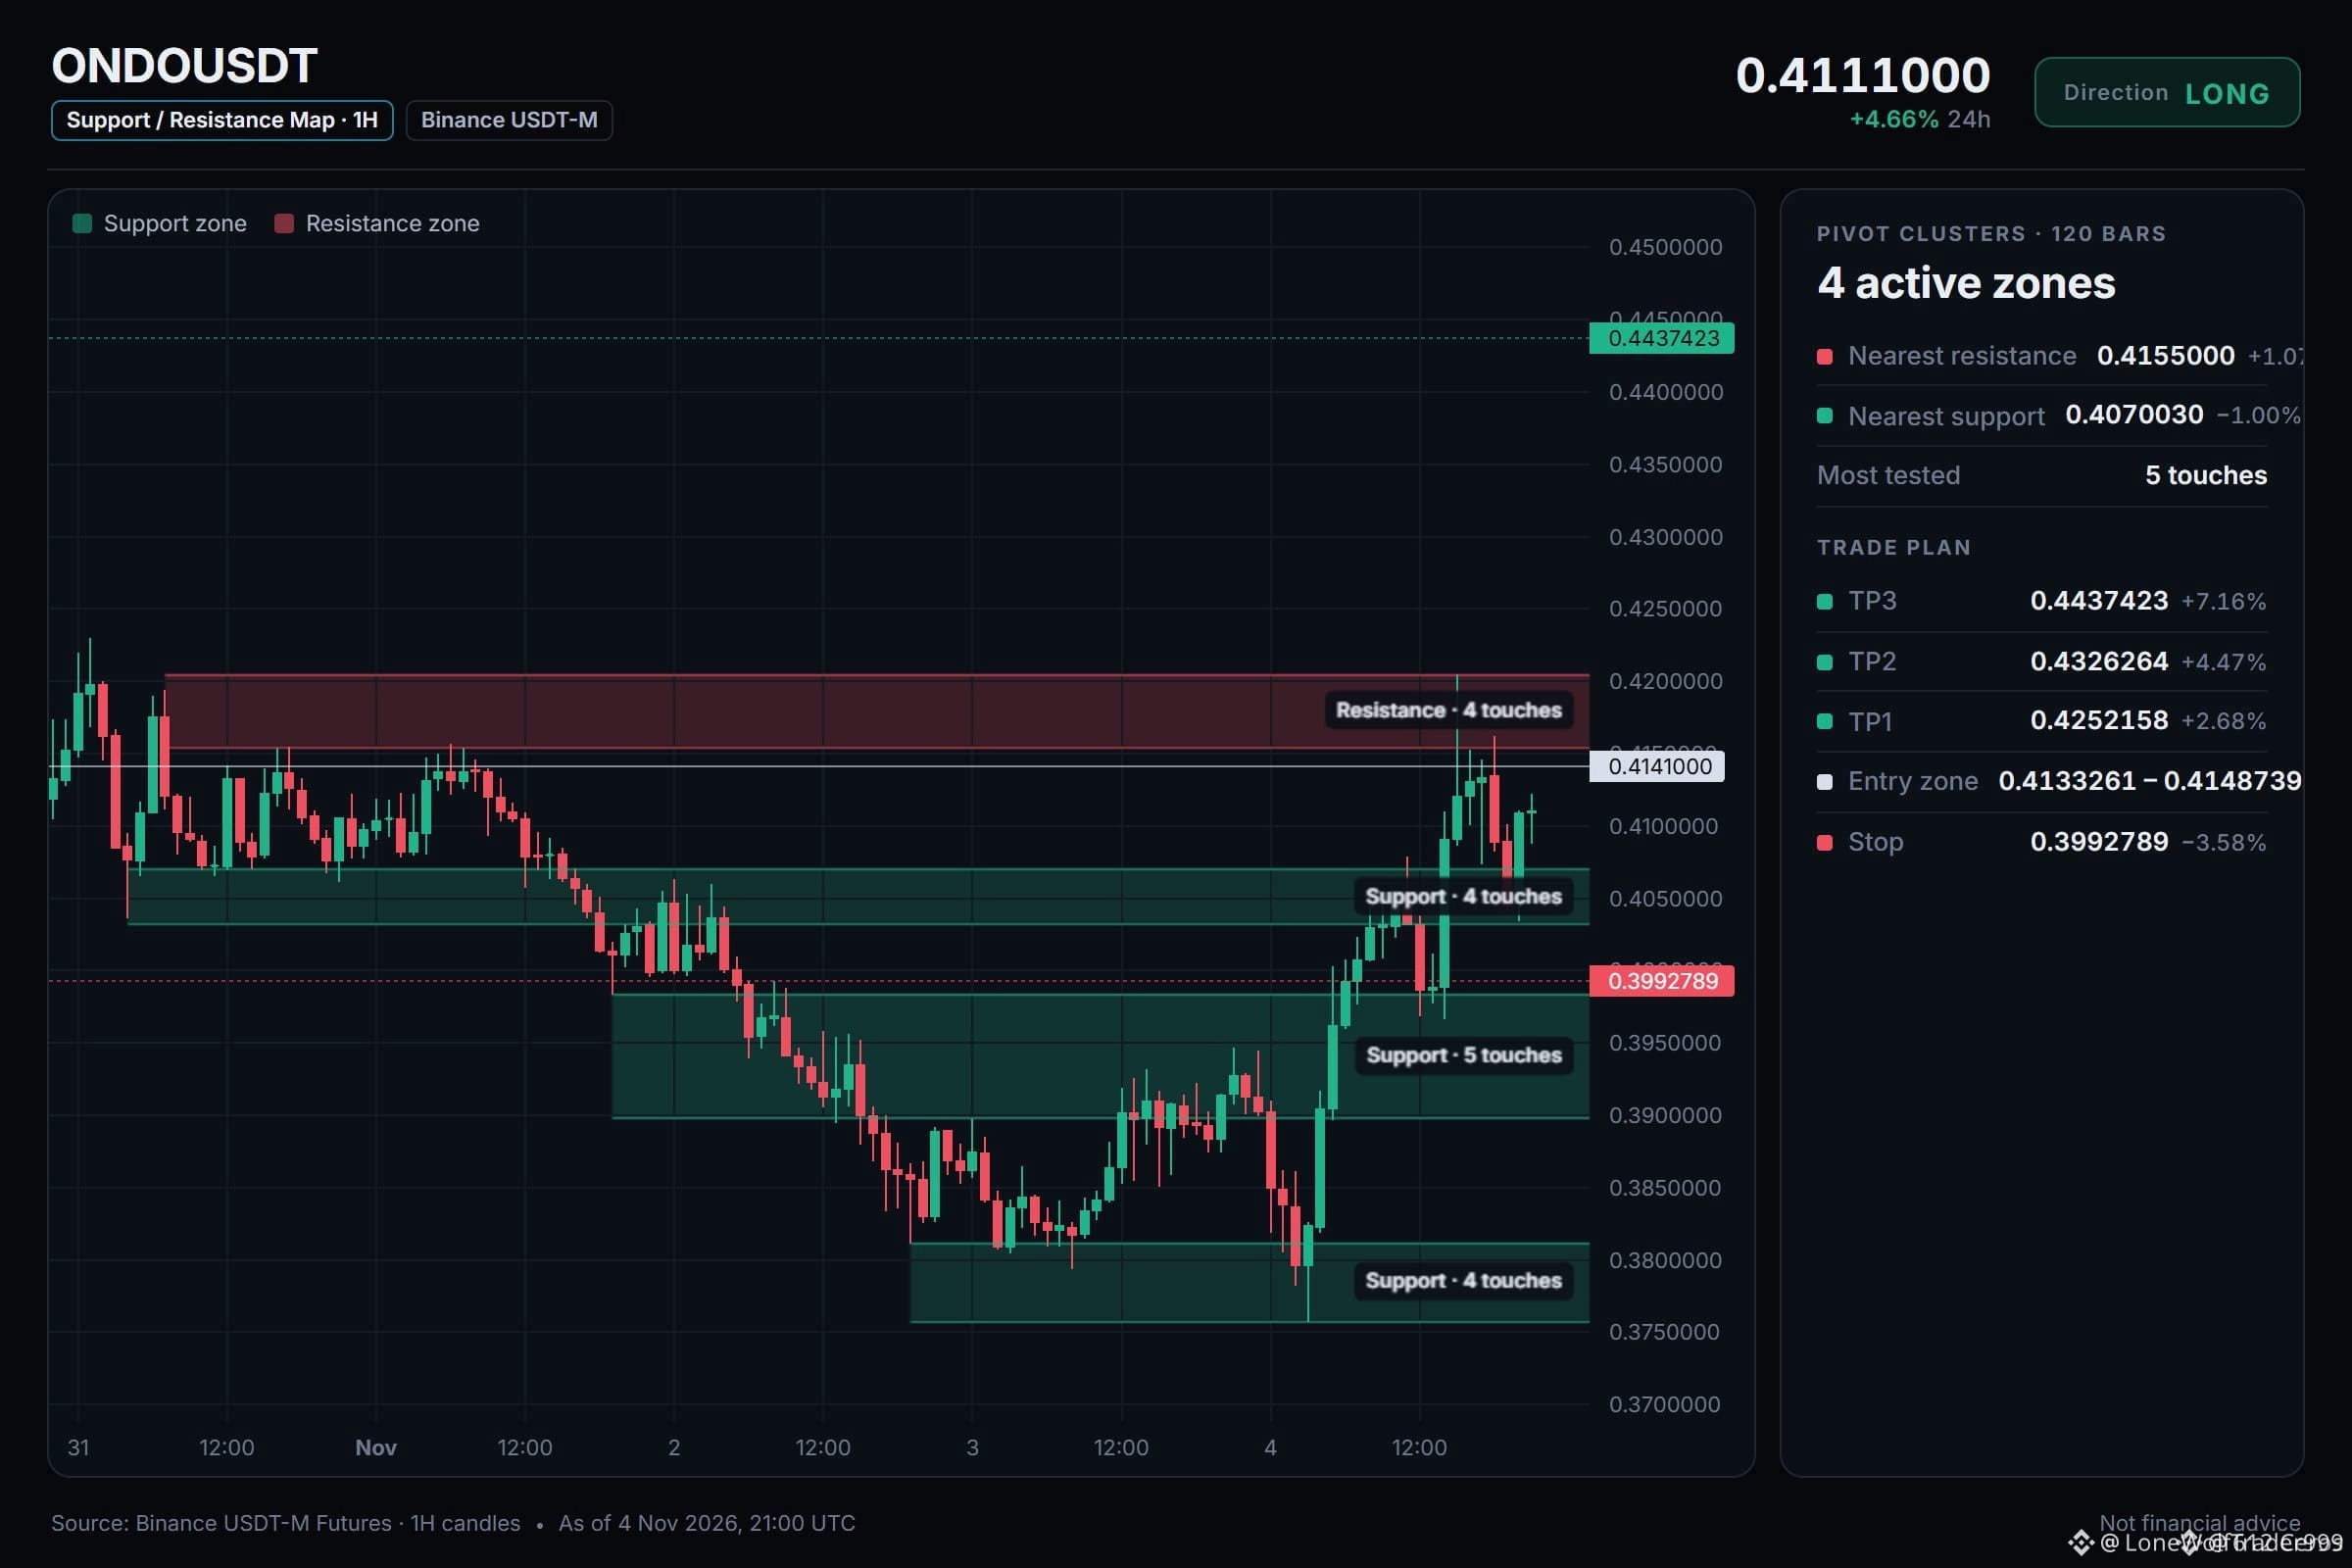
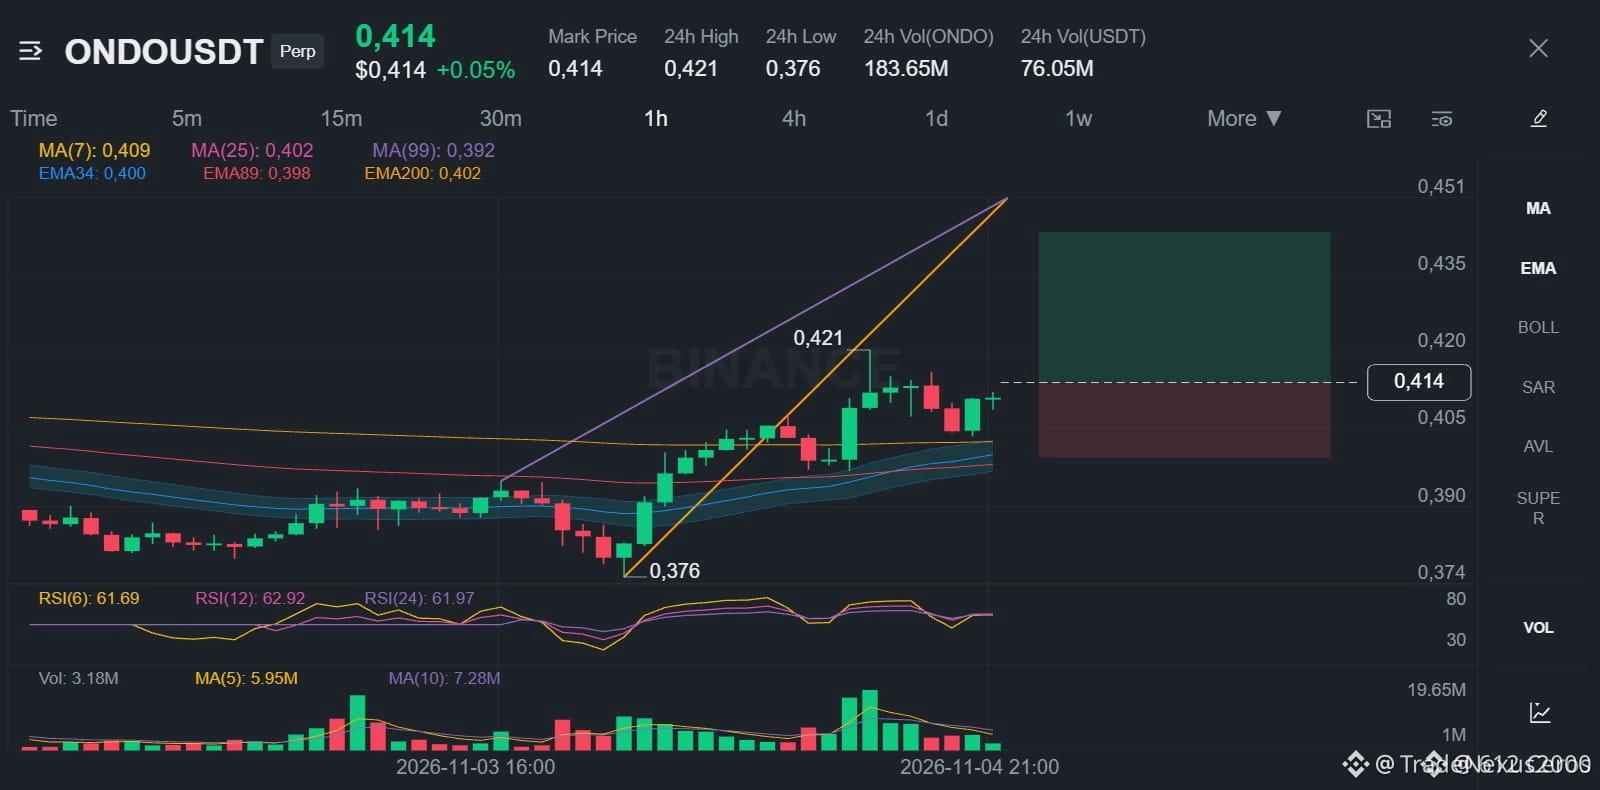
🚀 $ONDO KUCHLI RSI IMPULSI BILAN O‘SISH SUR’ATI TEZLASHMOQDA! 📈
Kirish: 0.4133261‑0.4148739 ⚡
Maqsad: 0.4252158 🚀
Maqsad: 0.4326264 🎯
Maqsad: 0.4437423 💥
Zararni to‘xtatish: 0.3992789 ⚠️
📊 1 soatlik RSI 62.7 darajasida bo‘lib, xaridorlar hamon ustunligini ko‘rsatmoqda; bu 0.399 darajasida pastroq likvidlikni yutib yuborgan nozik order-blokni shakllantirmoqda. 🦈 Aqlli pul kirish diapazoni yaqinida to‘planayotganga o‘xshaydi va narx ko‘tarilishi bilan keyingi talab zonasini ko‘zlamoqda. 💡 Ishonch darajasi mo‘tadil bo‘lgani uchun, har bir TP darajasida pozitsiyaning bir qismini yopish kapitalni saqlashga yordam beradi, birinchi foyda olingach esa stop-loss zararsizlik nuqtasiga ko‘tariladi.
💬 Bosqichma-bosqich chiqish rejasi nazorat ostidagi long pozitsiya uchun tavakkalchilikka munosabatingizga mos keladimi? 👇
⚠️ Bu moliyaviy maslahat emas. Har doim tavakkalchilikni boshqaring. 🛡️
🏷️ #ONDO #LongSetup #RSI #Crypto
🔥 💎
🚀 $ONDO KUCHLI RSI IMPULSI BILAN O‘SISH SUR’ATI TEZLASHMOQDA! 📈
Kirish: 0.4133261‑0.4148739 ⚡
Maqsad: 0.4252158 🚀
Maqsad: 0.4326264 🎯
Maqsad: 0.4437423 💥
Zararni to‘xtatish: 0.3992789 ⚠️
📊 1 soatlik RSI 62.7 darajasida bo‘lib, xaridorlar hamon ustunligini ko‘rsatmoqda; bu 0.399 darajasida pastroq likvidlikni yutib yuborgan nozik order-blokni shakllantirmoqda. 🦈 Aqlli pul kirish diapazoni yaqinida to‘planayotganga o‘xshaydi va narx ko‘tarilishi bilan keyingi talab zonasini ko‘zlamoqda. 💡 Ishonch darajasi mo‘tadil bo‘lgani uchun, har bir TP darajasida pozitsiyaning bir qismini yopish kapitalni saqlashga yordam beradi, birinchi foyda olingach esa stop-loss zararsizlik nuqtasiga ko‘tariladi.
💬 Bosqichma-bosqich chiqish rejasi nazorat ostidagi long pozitsiya uchun tavakkalchilikka munosabatingizga mos keladimi? 👇
⚠️ Bu moliyaviy maslahat emas. Har doim tavakkalchilikni boshqaring. 🛡️
🏷️ #ONDO #LongSetup #RSI #Crypto
🔥 💎
Kirish: 0.4133261‑0.4148739 ⚡
Maqsad: 0.4252158 🚀
Maqsad: 0.4326264 🎯
Maqsad: 0.4437423 💥
Zararni to‘xtatish: 0.3992789 ⚠️
📊 1 soatlik RSI 62.7 darajasida bo‘lib, xaridorlar hamon ustunligini ko‘rsatmoqda; bu 0.399 darajasida pastroq likvidlikni yutib yuborgan nozik order-blokni shakllantirmoqda. 🦈 Aqlli pul kirish diapazoni yaqinida to‘planayotganga o‘xshaydi va narx ko‘tarilishi bilan keyingi talab zonasini ko‘zlamoqda. 💡 Ishonch darajasi mo‘tadil bo‘lgani uchun, har bir TP darajasida pozitsiyaning bir qismini yopish kapitalni saqlashga yordam beradi, birinchi foyda olingach esa stop-loss zararsizlik nuqtasiga ko‘tariladi.
💬 Bosqichma-bosqich chiqish rejasi nazorat ostidagi long pozitsiya uchun tavakkalchilikka munosabatingizga mos keladimi? 👇
⚠️ Bu moliyaviy maslahat emas. Har doim tavakkalchilikni boshqaring. 🛡️
🏷️ #ONDO #LongSetup #RSI #Crypto
🔥 💎
4
·
--
O‘suvchi
15 soatdan ko‘proq vaqt oldin $ONDO tangasi haqida ajoyib yangilanish e’lon qilib, u tanga narxini oshirishini aytgandim, mana ko‘rib turibsiz 👇 O‘shanda tanga narxi 38 sent edi, hozir esa 42 sentga ko‘tarildi 🔥🔥 O‘sish taxminan 10.53% ni tashkil qiladi, ya’ni yangilanish e’lon qilingan paytda tangani 1000 dollarga sotib olgan bo‘lsangiz, 100 dollardan ko‘proq foyda ko‘rardingiz 💰💰
#ONDO #predictons #trading #crypto
{spot}(ONDOUSDT)
15 soatdan ko‘proq vaqt oldin $ONDO tangasi haqida ajoyib yangilanish e’lon qilib, u tanga narxini oshirishini aytgandim, mana ko‘rib turibsiz 👇 O‘shanda tanga narxi 38 sent edi, hozir esa 42 sentga ko‘tarildi 🔥🔥 O‘sish taxminan 10.53% ni tashkil qiladi, ya’ni yangilanish e’lon qilingan paytda tangani 1000 dollarga sotib olgan bo‘lsangiz, 100 dollardan ko‘proq foyda ko‘rardingiz 💰💰
#ONDO #predictons #trading #crypto
#ONDO #predictons #trading #crypto
DAB3_1997
·
--
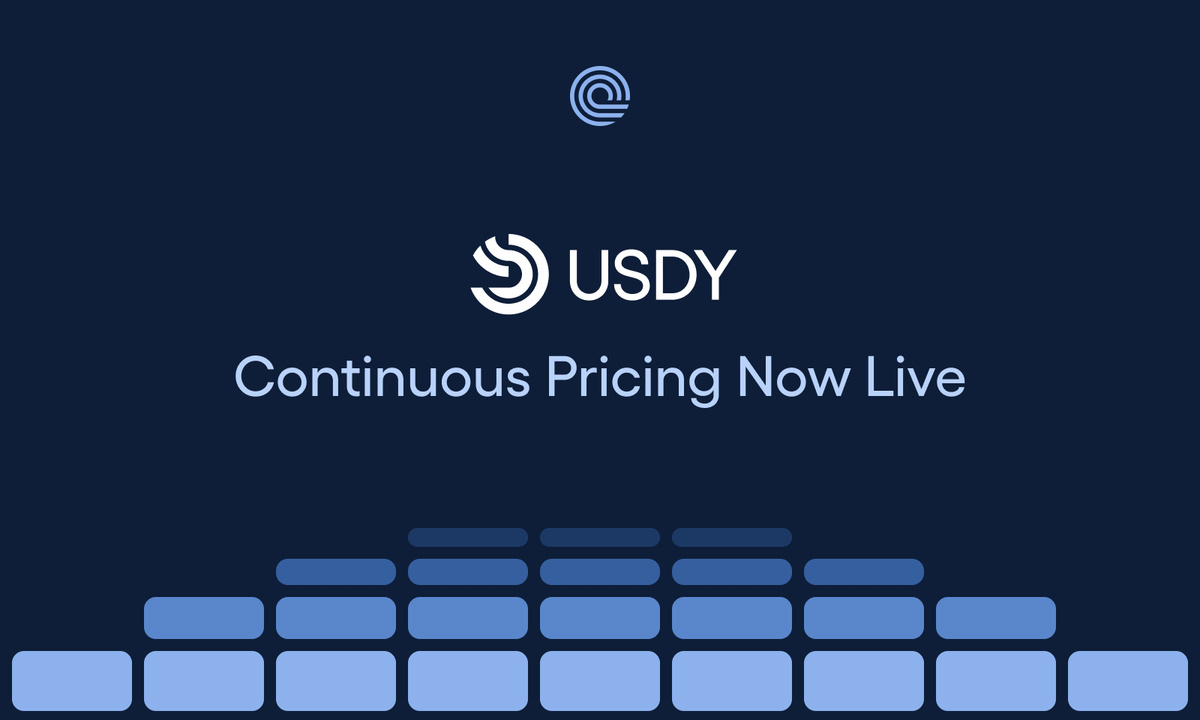
O‘suvchiOndo Finance’ning muhim yangilanishi va uning ONDO tokeniga ta’siri
Ondo Finance platformasi USDY uchun uzluksiz narxlash (Continuous Pricing) joriy etilganini rasman e’lon qildi. Endi uning narxi Ethereum, BNB Chain, Mantle va Tempo kabi tarmoqlarda real vaqt rejimida yangilanadi.
Bu yangilanish nimani anglatadi?
Kun ichidagi daromad (Intraday Yield): USDY egalari tokenni qancha vaqt ushlab tursalar, hatto bir necha soat bo‘lsa ham, shu muddat uchun daromad olishlari mumkin.
Yuqori moslashuvchanlik: daromad olish uchun tokenni ushlab turish, daromad olishda davom etgan holda undan garov sifatida foydalanib qarz olish va uni 11 ta turli tarmoq bo‘ylab o‘tkazish imkoniyati.
$ONDO tokeniga ta’siri:
Ushbu texnik kengayish va real aktivlar (RWA) mahsulotlari samaradorligining oshishi butun Ondo ekotizimining ommalashuviga yordam beradi. Bu esa loyihaning kuchayishiga va bozordagi yetakchi RWA loyihalaridan biri bo‘lgan ONDO tokeniga uzoq muddatli talabning oshishiga ijobiy ta’sir ko‘rsatadi.
#ONDO #RWA #bullish #CryptoUpdate
#HODL $ONDO
Ondo Finance platformasi USDY uchun uzluksiz narxlash (Continuous Pricing) joriy etilganini rasman e’lon qildi. Endi uning narxi Ethereum, BNB Chain, Mantle va Tempo kabi tarmoqlarda real vaqt rejimida yangilanadi.
Bu yangilanish nimani anglatadi?
Kun ichidagi daromad (Intraday Yield): USDY egalari tokenni qancha vaqt ushlab tursalar, hatto bir necha soat bo‘lsa ham, shu muddat uchun daromad olishlari mumkin.
Yuqori moslashuvchanlik: daromad olish uchun tokenni ushlab turish, daromad olishda davom etgan holda undan garov sifatida foydalanib qarz olish va uni 11 ta turli tarmoq bo‘ylab o‘tkazish imkoniyati.
$ONDO tokeniga ta’siri:
Ushbu texnik kengayish va real aktivlar (RWA) mahsulotlari samaradorligining oshishi butun Ondo ekotizimining ommalashuviga yordam beradi. Bu esa loyihaning kuchayishiga va bozordagi yetakchi RWA loyihalaridan biri bo‘lgan ONDO tokeniga uzoq muddatli talabning oshishiga ijobiy ta’sir ko‘rsatadi.
#ONDO #RWA #bullish #CryptoUpdate
#HODL $ONDO
1
46

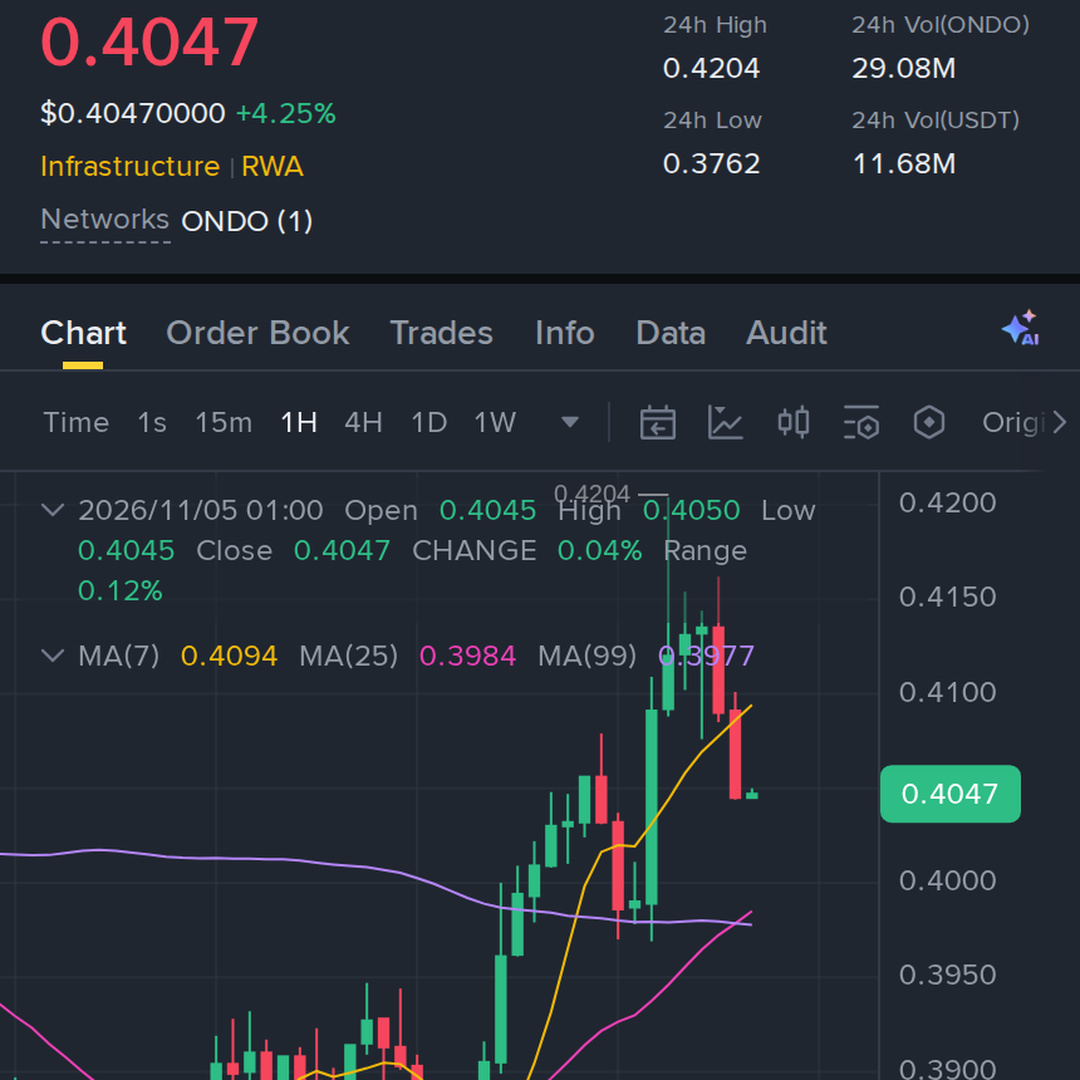
$ONDO narx harakati kutilganidan yaxshiroq pasayishga bardosh bermoqda, taxminan 47x imkoniyatni saqlab qolmoqda
Kirish: 0.4031–0.4049
TP1: 0.4165 | TP2: 0.4269 | TP3: 0.4404
Zararni to‘xtatish: 0.3956
#ONDO #Write2Earn #Crypto #Binance
$ONDO narx harakati kutilganidan yaxshiroq pasayishga bardosh bermoqda, taxminan 47x imkoniyatni saqlab qolmoqda
Kirish: 0.4031–0.4049
TP1: 0.4165 | TP2: 0.4269 | TP3: 0.4404
Zararni to‘xtatish: 0.3956
#ONDO #Write2Earn #Crypto #Binance
Kirish: 0.4031–0.4049
TP1: 0.4165 | TP2: 0.4269 | TP3: 0.4404
Zararni to‘xtatish: 0.3956
#ONDO #Write2Earn #Crypto #Binance
1
50

·
--
$ONDO bugun kechqurun yana trendlar ro‘yxatiga qaytdi, bu safar narx dinamikasi yaxshiroq ko‘rinmoqda — taxminan 4,3% ga ko‘tarilib, qariyb 145 mln dollarlik savdo hajmi bilan $0,405 atrofida turibdi. Avvalgi trenddagi davrida esa narxi tushishda davom etgandi. $BTC ham fon rejimida mustahkamlanmoqda — taxminan 3,1% ga ko‘tarilib, $79 941 atrofida, demak, kayfiyat unga qarshi emas, aksincha yordam bermoqda. $ONDO narxi $0,40 dan yuqorida saqlanib qolish-qolmasligini kuzatyapman — shu darajadan yuqorida tursa, trenddagi e’tibor undan ko‘proq foyda olishga yordam berishi mumkin. #Ondo
$ONDO bugun kechqurun yana trendlar ro‘yxatiga qaytdi, bu safar narx dinamikasi yaxshiroq ko‘rinmoqda — taxminan 4,3% ga ko‘tarilib, qariyb 145 mln dollarlik savdo hajmi bilan $0,405 atrofida turibdi. Avvalgi trenddagi davrida esa narxi tushishda davom etgandi. $BTC ham fon rejimida mustahkamlanmoqda — taxminan 3,1% ga ko‘tarilib, $79 941 atrofida, demak, kayfiyat unga qarshi emas, aksincha yordam bermoqda. $ONDO narxi $0,40 dan yuqorida saqlanib qolish-qolmasligini kuzatyapman — shu darajadan yuqorida tursa, trenddagi e’tibor undan ko‘proq foyda olishga yordam berishi mumkin. #Ondo
2
·
--
Savdo hajmi pasayib borayotgan soatlik yopilishni ortda qoldira oladimi?
$ONDO ta savdo $0.4084 narxda amalga oshmoqda; $11.55M hajm bilan 24 soatda 4.83% ga ko‘tarildi.
So‘nggi yopilgan sham 1.09% ga pasayganiga qaramay, soatlik savdo hajmi 23 soatlik o‘rtacha ko‘rsatkichning 1.22 baravariga teng.
23 soatlik diapazon $0.3762 dan $0.4204 gacha. $0.4204 cho‘qqisidan yuqoriga barqaror ko‘tarilish o‘sish davom etayotganidan darak beradi, $0.3762 dan pastga tushish esa o‘sish strukturasini bekor qiladi.
$0.4204 cho‘qqisidan yuqoriga qaytish momentumni tasdiqlaydimi yoki $0.3762 dan pastga tushish bu harakatni bekor qiladimi?
Jonli grafikni ko‘rish uchun $ONDO tugmasini bosing. #ONDO #BinanceSquare
Savdo hajmi pasayib borayotgan soatlik yopilishni ortda qoldira oladimi?
$ONDO ta savdo $0.4084 narxda amalga oshmoqda; $11.55M hajm bilan 24 soatda 4.83% ga ko‘tarildi.
So‘nggi yopilgan sham 1.09% ga pasayganiga qaramay, soatlik savdo hajmi 23 soatlik o‘rtacha ko‘rsatkichning 1.22 baravariga teng.
23 soatlik diapazon $0.3762 dan $0.4204 gacha. $0.4204 cho‘qqisidan yuqoriga barqaror ko‘tarilish o‘sish davom etayotganidan darak beradi, $0.3762 dan pastga tushish esa o‘sish strukturasini bekor qiladi.
$0.4204 cho‘qqisidan yuqoriga qaytish momentumni tasdiqlaydimi yoki $0.3762 dan pastga tushish bu harakatni bekor qiladimi?
Jonli grafikni ko‘rish uchun $ONDO tugmasini bosing. #ONDO #BinanceSquare
$ONDO ta savdo $0.4084 narxda amalga oshmoqda; $11.55M hajm bilan 24 soatda 4.83% ga ko‘tarildi.
So‘nggi yopilgan sham 1.09% ga pasayganiga qaramay, soatlik savdo hajmi 23 soatlik o‘rtacha ko‘rsatkichning 1.22 baravariga teng.
23 soatlik diapazon $0.3762 dan $0.4204 gacha. $0.4204 cho‘qqisidan yuqoriga barqaror ko‘tarilish o‘sish davom etayotganidan darak beradi, $0.3762 dan pastga tushish esa o‘sish strukturasini bekor qiladi.
$0.4204 cho‘qqisidan yuqoriga qaytish momentumni tasdiqlaydimi yoki $0.3762 dan pastga tushish bu harakatni bekor qiladimi?
Jonli grafikni ko‘rish uchun $ONDO tugmasini bosing. #ONDO #BinanceSquare
4

·
--
Yuqori foyda-xavf nisbati ko‘pincha boshqalar ikkilanayotgan joylarda yashirinadi. $ONDO — ayni shu nuqta ancha qiziq: tuzoqdek tuyulishiga sabab kunlik grafik hali ham diapazonda tebranmoqda, ammo bir soatlik grafikda xaridorlar ritmni yaqqol qo‘lga olayotgani ko‘rinadi. RSI yuqori darajaga yaqin, lekin o‘sish to‘xtagani yo‘q — bu harakatlantiruvchi kuch hali borligini, o‘sish shunchaki soxta emasligini anglatadi. Men uchun eng muhimi — narx qaytib kelganda tuzilmaning pastki nuqtasi buzilmayapti, hajm qisqargach esa yana ortmoqda. Bunday shakllanish xaridorlar foydasiga.
Kunlik grafikda yorib chiqish kuzatilmaguncha katta pozitsiya ochish ma’qul emas. Ammo kichik pozitsiya bilan xarid qilib, tasdiqni kutib, keyin qo‘shish — foyda-xavf nisbati nuqtayi nazaridan o‘zini oqlaydi. Muhim daraja saqlansa, yuqoriga harakat uchun imkoniyat ochiladi.
🟢 Savdo yo‘nalishi: xarid qilish
📍 Kirish diapazoni: 0.4026497 – 0.4039057
🛑 Stop-loss: 0.3905697
🎯 Foyda olish 1: 0.4128088
🎯 Foyda olish 2: 0.4191629
🎯 Foyda olish 3: 0.4286939
Tog‘-dengizlar kengligini ko‘rib, bozorning nozik jihatlarini ilg‘aymiz.
Xiong amaki bilan birga bo‘lib, foyda va zararning butun manzarasini ko‘ramiz.
#ONDO
Savdo qilish uchun quyidagi tugmani bosing 👇
Yuqori foyda-xavf nisbati ko‘pincha boshqalar ikkilanayotgan joylarda yashirinadi. $ONDO — ayni shu nuqta ancha qiziq: tuzoqdek tuyulishiga sabab kunlik grafik hali ham diapazonda tebranmoqda, ammo bir soatlik grafikda xaridorlar ritmni yaqqol qo‘lga olayotgani ko‘rinadi. RSI yuqori darajaga yaqin, lekin o‘sish to‘xtagani yo‘q — bu harakatlantiruvchi kuch hali borligini, o‘sish shunchaki soxta emasligini anglatadi. Men uchun eng muhimi — narx qaytib kelganda tuzilmaning pastki nuqtasi buzilmayapti, hajm qisqargach esa yana ortmoqda. Bunday shakllanish xaridorlar foydasiga.
Kunlik grafikda yorib chiqish kuzatilmaguncha katta pozitsiya ochish ma’qul emas. Ammo kichik pozitsiya bilan xarid qilib, tasdiqni kutib, keyin qo‘shish — foyda-xavf nisbati nuqtayi nazaridan o‘zini oqlaydi. Muhim daraja saqlansa, yuqoriga harakat uchun imkoniyat ochiladi.
🟢 Savdo yo‘nalishi: xarid qilish
📍 Kirish diapazoni: 0.4026497 – 0.4039057
🛑 Stop-loss: 0.3905697
🎯 Foyda olish 1: 0.4128088
🎯 Foyda olish 2: 0.4191629
🎯 Foyda olish 3: 0.4286939
Tog‘-dengizlar kengligini ko‘rib, bozorning nozik jihatlarini ilg‘aymiz.
Xiong amaki bilan birga bo‘lib, foyda va zararning butun manzarasini ko‘ramiz.
#ONDO
Savdo qilish uchun quyidagi tugmani bosing 👇
Kunlik grafikda yorib chiqish kuzatilmaguncha katta pozitsiya ochish ma’qul emas. Ammo kichik pozitsiya bilan xarid qilib, tasdiqni kutib, keyin qo‘shish — foyda-xavf nisbati nuqtayi nazaridan o‘zini oqlaydi. Muhim daraja saqlansa, yuqoriga harakat uchun imkoniyat ochiladi.
🟢 Savdo yo‘nalishi: xarid qilish
📍 Kirish diapazoni: 0.4026497 – 0.4039057
🛑 Stop-loss: 0.3905697
🎯 Foyda olish 1: 0.4128088
🎯 Foyda olish 2: 0.4191629
🎯 Foyda olish 3: 0.4286939
Tog‘-dengizlar kengligini ko‘rib, bozorning nozik jihatlarini ilg‘aymiz.
Xiong amaki bilan birga bo‘lib, foyda va zararning butun manzarasini ko‘ramiz.
#ONDO
Savdo qilish uchun quyidagi tugmani bosing 👇
Ray Rosek WyG5:
0.49
1
131

Ko‘proq kontentni ko‘rish uchun tizimga kiring
Binance Square'da global kriptovalyuta foydalanuvchilariga qo‘shiling
⚡️ Kriptovalyuta haqida eng so‘nggi va foydali ma’lumotlarni oling.
💬 Dunyoning eng yirik kriptovalyuta birjasi tomonidan ishonchli deb topilgan.
👍 Tasdiqlangan mualliflardan haqiqiy tahlillarni kashf eting.
Email / telefon raqami
Trenddagi mavzular
1
#BinanceReopensWithdrawalsForMoreAssets
574,917 marta koʻrilgan
2,612 muhokama qilmoqda
2
#BTCRebounds80K
100,374 marta koʻrilgan
1,000 muhokama qilmoqda
3
#Binance98PercentReplenished
54,055 marta koʻrilgan
733 muhokama qilmoqda
4
#USMidterms-WhatAreMarketsExpecting?
393,427 marta koʻrilgan
2,235 muhokama qilmoqda
5
#USOctoberNFP-AreRateCutsStillPossible
420,282 marta koʻrilgan
2,955 muhokama qilmoqda
6
#TRUMPFalls18.1%In24HoursToRecordLow
571 marta koʻrilgan
29 muhokama qilmoqda
7
#USClearsSingleStockPerpetualFutures
3,374 marta koʻrilgan
91 muhokama qilmoqda
8
#StrategySTRCHits$100ForFirstTimeSinceMay
68 marta koʻrilgan
3 muhokama qilmoqda
9
#TrumpFamilyBackedBitcoinMinerReportsQ3Profit
2,229 marta koʻrilgan
60 muhokama qilmoqda
10
#SouthKoreaPlansImmediateCryptoSecurityIncidentReportingRules
140 marta koʻrilgan
6 muhokama qilmoqda