

#ethereum
ethereum
102.2M marta koʻrilgan
242,408 muhokama qilmoqda
Ommabop
Eng so‘nggi

·
--
Tasdiqlangan
Tarjimani ko‘rish
Vitalik:Hegota之后,$ETH更像「密码学世界计算机」这不是又一篇空喊路线图。Vitalik 9/27 长文直接改名:post-Lean 的 $ETH,叫 blockchain 多半是历史惯性——本质是链式共识 + 现代密码学的混合体,他管这叫 cryptographic world computer。
筛几点硬的:
1️⃣ Hegota(明年那次)很可能是最后一次「正常人能看懂」的 fork;之后主线是 recursive STARKs、形式化验证、高度优化共识,以及全量子安全。
2️⃣ 验证要从「全量下载重跑」走向 PeerDAS 抽样 + SNARK 校验;PeerDAS 已在 Fusaka 落地,后续还会盖到完整区块内容。
3️⃣ 2030 目标色:slot 约 4–8 秒,finality 约 8–32 秒。链本身别指望打赢中心化服务器延迟,外围基础设施可以补。
4️⃣ 去中心化不全是成本——并行存、并行算、藏元数据,有时反而成性能优势;缺的那块「如何验证切分后的工作」被现代密码学补上了。
愿景≠已上线。Hegota 还没到,Glamsterdam 还在 2026 Q4 窗口。这篇是架构叙事切换,不是明天就能用的功能清单。
不构成投资建议。
#$ETH #Ethereum #Vitalik #Web3 #加密
Vitalik:Hegota之后,$ETH更像「密码学世界计算机」
这不是又一篇空喊路线图。Vitalik 9/27 长文直接改名:post-Lean 的 $ETH ,叫 blockchain 多半是历史惯性——本质是链式共识 + 现代密码学的混合体,他管这叫 cryptographic world computer。
筛几点硬的:
1️⃣ Hegota(明年那次)很可能是最后一次「正常人能看懂」的 fork;之后主线是 recursive STARKs、形式化验证、高度优化共识,以及全量子安全。
2️⃣ 验证要从「全量下载重跑」走向 PeerDAS 抽样 + SNARK 校验;PeerDAS 已在 Fusaka 落地,后续还会盖到完整区块内容。
3️⃣ 2030 目标色:slot 约 4–8 秒,finality 约 8–32 秒。链本身别指望打赢中心化服务器延迟,外围基础设施可以补。
4️⃣ 去中心化不全是成本——并行存、并行算、藏元数据,有时反而成性能优势;缺的那块「如何验证切分后的工作」被现代密码学补上了。
愿景≠已上线。Hegota 还没到,Glamsterdam 还在 2026 Q4 窗口。这篇是架构叙事切换,不是明天就能用的功能清单。
不构成投资建议。
#$ETH #Ethereum #Vitalik #Web3 #加密
筛几点硬的:
1️⃣ Hegota(明年那次)很可能是最后一次「正常人能看懂」的 fork;之后主线是 recursive STARKs、形式化验证、高度优化共识,以及全量子安全。
2️⃣ 验证要从「全量下载重跑」走向 PeerDAS 抽样 + SNARK 校验;PeerDAS 已在 Fusaka 落地,后续还会盖到完整区块内容。
3️⃣ 2030 目标色:slot 约 4–8 秒,finality 约 8–32 秒。链本身别指望打赢中心化服务器延迟,外围基础设施可以补。
4️⃣ 去中心化不全是成本——并行存、并行算、藏元数据,有时反而成性能优势;缺的那块「如何验证切分后的工作」被现代密码学补上了。
愿景≠已上线。Hegota 还没到,Glamsterdam 还在 2026 Q4 窗口。这篇是架构叙事切换,不是明天就能用的功能清单。
不构成投资建议。
#$ETH #Ethereum #Vitalik #Web3 #加密
风中浪客:
Vitalik 这叙事包装确实高级,但 $ETH 能不能兑现还得看生态和真实需求,不是改个名就起飞。老韭菜先不急着上头。
2
1
1.1k

·
--
O‘suvchi
Tarjimani ko‘rish
Lo que los impacientes no entienden sobre las ballenas cripto 🐋💼
El mayor error de un principiante es entrar al mercado esperando volverse millonario en 48 horas. Ven que un proyecto no sube un 50% en una semana y se desesperan, venden y se van a buscar la siguiente moneda de moda.
Mientras tanto, las "ballenas" (los grandes inversores institucionales) hacen exactamente lo contrario. Ellos compran cuando nadie está prestando atención, acumulan en silencio durante meses y dejan que la infraestructura del proyecto crezca.
El dinero real en este mercado no se hace persiguiendo pantallas verdes de un día; se hace entendiendo dónde se está construyendo el futuro de las aplicaciones descentralizadas y los contratos inteligentes. La paciencia paga más que cualquier estrategia de trading rápido.
¿Eres de los que se desesperan si el precio no se mueve en tres días, o tienes la mentalidad de acumular a largo plazo? Deja tu opinión abajo 👇
#Ethereum #EducaciónFinanciera
$ETH
Lo que los impacientes no entienden sobre las ballenas cripto 🐋💼
El mayor error de un principiante es entrar al mercado esperando volverse millonario en 48 horas. Ven que un proyecto no sube un 50% en una semana y se desesperan, venden y se van a buscar la siguiente moneda de moda.
Mientras tanto, las "ballenas" (los grandes inversores institucionales) hacen exactamente lo contrario. Ellos compran cuando nadie está prestando atención, acumulan en silencio durante meses y dejan que la infraestructura del proyecto crezca.
El dinero real en este mercado no se hace persiguiendo pantallas verdes de un día; se hace entendiendo dónde se está construyendo el futuro de las aplicaciones descentralizadas y los contratos inteligentes. La paciencia paga más que cualquier estrategia de trading rápido.
¿Eres de los que se desesperan si el precio no se mueve en tres días, o tienes la mentalidad de acumular a largo plazo? Deja tu opinión abajo 👇
#Ethereum #EducaciónFinanciera
$ETH
El mayor error de un principiante es entrar al mercado esperando volverse millonario en 48 horas. Ven que un proyecto no sube un 50% en una semana y se desesperan, venden y se van a buscar la siguiente moneda de moda.
Mientras tanto, las "ballenas" (los grandes inversores institucionales) hacen exactamente lo contrario. Ellos compran cuando nadie está prestando atención, acumulan en silencio durante meses y dejan que la infraestructura del proyecto crezca.
El dinero real en este mercado no se hace persiguiendo pantallas verdes de un día; se hace entendiendo dónde se está construyendo el futuro de las aplicaciones descentralizadas y los contratos inteligentes. La paciencia paga más que cualquier estrategia de trading rápido.
¿Eres de los que se desesperan si el precio no se mueve en tres días, o tienes la mentalidad de acumular a largo plazo? Deja tu opinión abajo 👇
#Ethereum #EducaciónFinanciera
$ETH
1.2k

Maqola
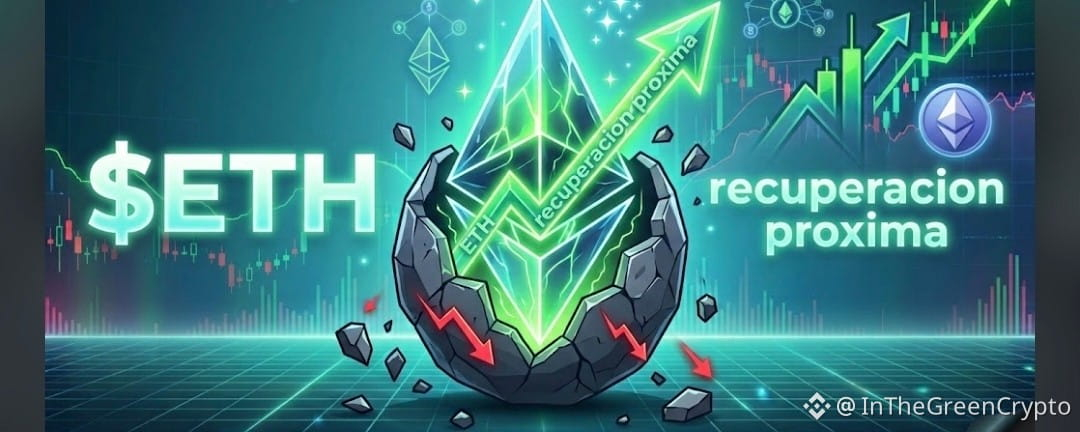
ETH bo‘yicha makro tahlil:
Uning keyingi katta tiklanishi haqidagi 3 ta texnik signalHammaga salom! 👋.
Bugun sizlarga bozor holatini to‘liq tushunish va bozordagi ikkinchi yirik kriptovalutaning qaysi tomonga ketayotgani haqida chuqur texnik tahlil taqdim etaman. Buning uchun uchta turli vaqt oralig‘idan foydalanamiz. 🚀
🔍 Hozir TradingView grafiklari bizga nimani ko‘rsatmoqda?
📐 1. Makro tuzilma: yuqorilab borayotgan maksimumlar va minimumlar
Agar masofani olib, uzoq muddatli tarixga nazar tashlasak, Ethereum juda katta ko‘tariluvchi kanal ichida harakat qilmoqda 📈. Kuchli tuzatishlarga qaramay, chuqurliklar (tarixiy tagliklar) tobora balandroq. Asosiy trend hali ham juda sog‘lom. 💪
ETH bo‘yicha makro tahlil: Uning keyingi katta tiklanishi haqidagi 3 ta texnik signal
Hammaga salom! 👋.
Bugun sizlarga bozor holatini to‘liq tushunish va bozordagi ikkinchi yirik kriptovalutaning qaysi tomonga ketayotgani haqida chuqur texnik tahlil taqdim etaman. Buning uchun uchta turli vaqt oralig‘idan foydalanamiz. 🚀
🔍 Hozir TradingView grafiklari bizga nimani ko‘rsatmoqda?
📐 1. Makro tuzilma: yuqorilab borayotgan maksimumlar va minimumlar
Agar masofani olib, uzoq muddatli tarixga nazar tashlasak, Ethereum juda katta ko‘tariluvchi kanal ichida harakat qilmoqda 📈. Kuchli tuzatishlarga qaramay, chuqurliklar (tarixiy tagliklar) tobora balandroq. Asosiy trend hali ham juda sog‘lom. 💪
Bugun sizlarga bozor holatini to‘liq tushunish va bozordagi ikkinchi yirik kriptovalutaning qaysi tomonga ketayotgani haqida chuqur texnik tahlil taqdim etaman. Buning uchun uchta turli vaqt oralig‘idan foydalanamiz. 🚀
🔍 Hozir TradingView grafiklari bizga nimani ko‘rsatmoqda?
📐 1. Makro tuzilma: yuqorilab borayotgan maksimumlar va minimumlar
Agar masofani olib, uzoq muddatli tarixga nazar tashlasak, Ethereum juda katta ko‘tariluvchi kanal ichida harakat qilmoqda 📈. Kuchli tuzatishlarga qaramay, chuqurliklar (tarixiy tagliklar) tobora balandroq. Asosiy trend hali ham juda sog‘lom. 💪
Carita Brege hKys:
eso espero siempre firme con ETH
4
3
819

·
--
Tasdiqlangan
🚨 ETH JUST FLIPPED THE FLOW — AND THE NUMBERS ARE GETTING HARD TO IGNORE 🚨
$ETH katta ETF teskari aylanishini amalga oshirdi.
AQShning spot Ethereum ETFlari oʻtgan haftada $689.9Mga kirim qildi va avvalgi haftadagi qariyb $140M chiqimni toʻliq teskarisiga aylantirdi.
Lekin eng qiziq joyi shunda…
Xarid faqat bitta sessiyada jamlanmagan.
ETH ETFlari hafta davomida kuchli kirimlarni qayd etdi, BlackRockning ETHA esa $326.2M bilan yetakchilik qildi.
Bozor manzarasi esa qanday?
ETH hozir $2.7K atrofida savdo qilmoqda, yaqinda eʼlon qilingan texnik tahlil esa $2,661.52ni muhim breakout (kesib oʻtish) darajasi sifatida ko‘rsatdi.
Demak, haqiqiy voqea shunchaki “ETH oshyapti” emas.
Gap shundaki:
Institutsional ETF oqimlari birdan yana ijobiy tomonga oʻtdi.
Keyingi savol: bu talab davom eta oladimi?
$ETH
{future}(ETHUSDT)
.
.
#ETH #Ethereum #Write2Earn
🚨 ETH JUST FLIPPED THE FLOW — AND THE NUMBERS ARE GETTING HARD TO IGNORE 🚨
$ETH katta ETF teskari aylanishini amalga oshirdi.
AQShning spot Ethereum ETFlari oʻtgan haftada $689.9Mga kirim qildi va avvalgi haftadagi qariyb $140M chiqimni toʻliq teskarisiga aylantirdi.
Lekin eng qiziq joyi shunda…
Xarid faqat bitta sessiyada jamlanmagan.
ETH ETFlari hafta davomida kuchli kirimlarni qayd etdi, BlackRockning ETHA esa $326.2M bilan yetakchilik qildi.
Bozor manzarasi esa qanday?
ETH hozir $2.7K atrofida savdo qilmoqda, yaqinda eʼlon qilingan texnik tahlil esa $2,661.52ni muhim breakout (kesib oʻtish) darajasi sifatida ko‘rsatdi.
Demak, haqiqiy voqea shunchaki “ETH oshyapti” emas.
Gap shundaki:
Institutsional ETF oqimlari birdan yana ijobiy tomonga oʻtdi.
Keyingi savol: bu talab davom eta oladimi?
$ETH
.
.
#ETH #Ethereum #Write2Earn
$ETH katta ETF teskari aylanishini amalga oshirdi.
AQShning spot Ethereum ETFlari oʻtgan haftada $689.9Mga kirim qildi va avvalgi haftadagi qariyb $140M chiqimni toʻliq teskarisiga aylantirdi.
Lekin eng qiziq joyi shunda…
Xarid faqat bitta sessiyada jamlanmagan.
ETH ETFlari hafta davomida kuchli kirimlarni qayd etdi, BlackRockning ETHA esa $326.2M bilan yetakchilik qildi.
Bozor manzarasi esa qanday?
ETH hozir $2.7K atrofida savdo qilmoqda, yaqinda eʼlon qilingan texnik tahlil esa $2,661.52ni muhim breakout (kesib oʻtish) darajasi sifatida ko‘rsatdi.
Demak, haqiqiy voqea shunchaki “ETH oshyapti” emas.
Gap shundaki:
Institutsional ETF oqimlari birdan yana ijobiy tomonga oʻtdi.
Keyingi savol: bu talab davom eta oladimi?
$ETH
.
.
#ETH #Ethereum #Write2Earn
549
·
--
Pasayuvchi
Tarjimani ko‘rish
💬 Ethereum Update
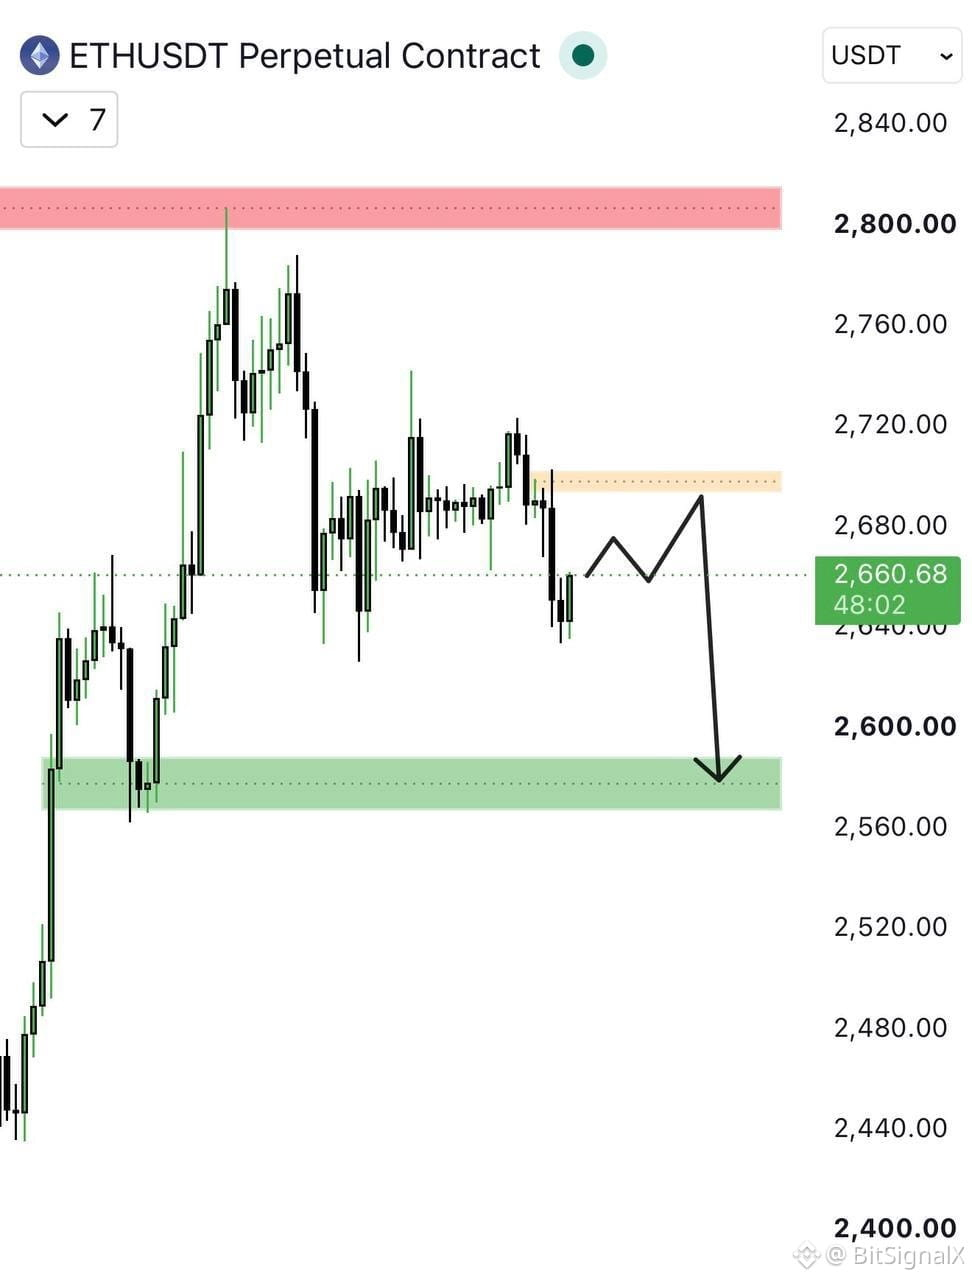
#ETH продолжает уверенно двигаться по нисходящему сценарию.
После ложного теста сопротивления в районе $2 800 актив развернулся и плавно корректируется вниз.
📊 Без изменений: ожидаю доставку цены к следующему уровню поддержки в зоне.
$2 570.
⚙️ Структура остаётся медвежьей, давление сохраняется — следим за реакцией рынка на ближайшие уровни.
🔥 Поддержите канал!
Ставьте лайк, пишите комментарии и подписывайтесь, чтобы не пропустить свежие апдейты по ETH.
#ETH🔥🔥🔥🔥🔥🔥 #ETH #Ethereum #Crypto_Jobs🎯 $ETH
{spot}(ETHUSDT)
BitSignal
💬 Ethereum Update
#ETH продолжает уверенно двигаться по нисходящему сценарию.
После ложного теста сопротивления в районе $2 800 актив развернулся и плавно корректируется вниз.
📊 Без изменений: ожидаю доставку цены к следующему уровню поддержки в зоне.
$2 570.
⚙️ Структура остаётся медвежьей, давление сохраняется — следим за реакцией рынка на ближайшие уровни.
🔥 Поддержите канал!
Ставьте лайк, пишите комментарии и подписывайтесь, чтобы не пропустить свежие апдейты по ETH.
#ETH🔥🔥🔥🔥🔥🔥 #ETH #Ethereum #Crypto_Jobs🎯 $ETH
BitSignal
#ETH продолжает уверенно двигаться по нисходящему сценарию.
После ложного теста сопротивления в районе $2 800 актив развернулся и плавно корректируется вниз.
📊 Без изменений: ожидаю доставку цены к следующему уровню поддержки в зоне.
$2 570.
⚙️ Структура остаётся медвежьей, давление сохраняется — следим за реакцией рынка на ближайшие уровни.
🔥 Поддержите канал!
Ставьте лайк, пишите комментарии и подписывайтесь, чтобы не пропустить свежие апдейты по ETH.
#ETH🔥🔥🔥🔥🔥🔥 #ETH #Ethereum #Crypto_Jobs🎯 $ETH
BitSignal
2
319

·
--

Maqola
Tarjimani ko‘rish
🐋 ملايين الدولارات تتجه نحو Ethereum.. هل تستعد ETH لحركة كبيرة؟ 🔥بينما يراقب المتداولون أسعار العملات الرقمية، تظهر تحركات لافتة من كبار حاملي إيثريوم!
تشير تقارير حديثة إلى أن إحدى المحافظ جمعت نحو 9,158 ETH بقيمة تقارب 24.34 مليون دولار خلال ثلاثة أسابيع، بالتزامن مع استمرار التوسع في الحيازات المؤسسية لإيثريوم.
📊 لماذا تستحق هذه التحركات الاهتمام؟
🔹 تراكم الحيتان: عمليات الشراء الكبيرة قد تعكس استراتيجيات استثمارية طويلة الأجل، لكنها لا تضمن ارتفاع السعر.
🔹 الطلب المؤسسي: تزايد حيازات الشركات يفتح نقاشاً حول دور ETH في المحافظ الاستثمارية.
🔹 معروض المنصات: انخفاض العملات المتاحة للتداول قد يؤثر في السيولة، خصوصاً خلال فترات التقلبات.
🔥 هل التراكم يعني اقتراب الصعود؟
ليس بالضرورة! تحركات الحيتان وحدها لا تكفي لتحديد اتجاه السوق، إذ تلعب الظروف الاقتصادية وحركة بيتكوين وتدفقات صناديق ETF دوراً مهماً أيضاً.
ما سأراقبه خلال الفترة القادمة هو استمرار عمليات التراكم ومدى انعكاسها على أحجام التداول والنشاط الفعلي للشبكة.
💬 هل تعتقدون أن إيثريوم تستعد لاستعادة زخمها، أم أن السوق يحتاج إلى محفزات أقوى؟
$ETH
#Ethereum #ETH #CryptoWhales #altcoins #KBH3
✍️ KBH 3
⚠️ هذا المحتوى إخباري وتعليمي فقط، وليس نصيحة مالية.
🐋 ملايين الدولارات تتجه نحو Ethereum.. هل تستعد ETH لحركة كبيرة؟ 🔥
بينما يراقب المتداولون أسعار العملات الرقمية، تظهر تحركات لافتة من كبار حاملي إيثريوم!
تشير تقارير حديثة إلى أن إحدى المحافظ جمعت نحو 9,158 ETH بقيمة تقارب 24.34 مليون دولار خلال ثلاثة أسابيع، بالتزامن مع استمرار التوسع في الحيازات المؤسسية لإيثريوم.
📊 لماذا تستحق هذه التحركات الاهتمام؟
🔹 تراكم الحيتان: عمليات الشراء الكبيرة قد تعكس استراتيجيات استثمارية طويلة الأجل، لكنها لا تضمن ارتفاع السعر.
🔹 الطلب المؤسسي: تزايد حيازات الشركات يفتح نقاشاً حول دور ETH في المحافظ الاستثمارية.
🔹 معروض المنصات: انخفاض العملات المتاحة للتداول قد يؤثر في السيولة، خصوصاً خلال فترات التقلبات.
🔥 هل التراكم يعني اقتراب الصعود؟
ليس بالضرورة! تحركات الحيتان وحدها لا تكفي لتحديد اتجاه السوق، إذ تلعب الظروف الاقتصادية وحركة بيتكوين وتدفقات صناديق ETF دوراً مهماً أيضاً.
ما سأراقبه خلال الفترة القادمة هو استمرار عمليات التراكم ومدى انعكاسها على أحجام التداول والنشاط الفعلي للشبكة.
💬 هل تعتقدون أن إيثريوم تستعد لاستعادة زخمها، أم أن السوق يحتاج إلى محفزات أقوى؟
$ETH
#Ethereum #ETH #CryptoWhales #altcoins #KBH3
✍️ KBH 3
⚠️ هذا المحتوى إخباري وتعليمي فقط، وليس نصيحة مالية.
تشير تقارير حديثة إلى أن إحدى المحافظ جمعت نحو 9,158 ETH بقيمة تقارب 24.34 مليون دولار خلال ثلاثة أسابيع، بالتزامن مع استمرار التوسع في الحيازات المؤسسية لإيثريوم.
📊 لماذا تستحق هذه التحركات الاهتمام؟
🔹 تراكم الحيتان: عمليات الشراء الكبيرة قد تعكس استراتيجيات استثمارية طويلة الأجل، لكنها لا تضمن ارتفاع السعر.
🔹 الطلب المؤسسي: تزايد حيازات الشركات يفتح نقاشاً حول دور ETH في المحافظ الاستثمارية.
🔹 معروض المنصات: انخفاض العملات المتاحة للتداول قد يؤثر في السيولة، خصوصاً خلال فترات التقلبات.
🔥 هل التراكم يعني اقتراب الصعود؟
ليس بالضرورة! تحركات الحيتان وحدها لا تكفي لتحديد اتجاه السوق، إذ تلعب الظروف الاقتصادية وحركة بيتكوين وتدفقات صناديق ETF دوراً مهماً أيضاً.
ما سأراقبه خلال الفترة القادمة هو استمرار عمليات التراكم ومدى انعكاسها على أحجام التداول والنشاط الفعلي للشبكة.
💬 هل تعتقدون أن إيثريوم تستعد لاستعادة زخمها، أم أن السوق يحتاج إلى محفزات أقوى؟
$ETH
#Ethereum #ETH #CryptoWhales #altcoins #KBH3
✍️ KBH 3
⚠️ هذا المحتوى إخباري وتعليمي فقط، وليس نصيحة مالية.
2
300

Maqola
Tarjimani ko‘rish
📈 BTC and ETH: Market Analysis and Key Levels (4H)Following a strong impulsive move, the cryptocurrency market has entered a phase of local consolidation. We analyze the current structure and potential price scenarios for BTC and ETH based on the 4-hour timeframe.
{future}(BTCUSDT)
🪙 #bitcoin ($BTC /USD)
Current price: ~$83,383
Bitcoin established a new local high at $87,374 before entering a sideways range (accumulation). The price is currently trading near the lower boundary of this consolidation zone.
Key zones:
Resistance: $86,000 and the target block at $87,374 – $88,813.
Support: $81,266 – $82,000 (previous breakout zone) and the main block at $76,000 – $76,850.
Scenarios:
🟢 Bullish: Holding current levels and breaking out of the sideways range to the upside, aiming to retest $87,374.
🔴 Corrective: A local liquidity sweep with a drop to the $81,200 – $82,000 zone before the trend resumes.
{future}(ETHUSDT)
💠 #Ethereum ($ETH /USD)
Current price: ~$2,655
Ethereum continues to show a stable bullish structure, consistently forming higher highs and higher lows. After reaching a local peak of $2,805, the price is currently pausing. Key zones:
Resistance: $2,770 – $2,805.
Support: $2,530 – $2,610 (immediate block) and $2,380 – $2,450 (primary buyer zone).
Scenarios:
🟢 Bullish: Establishing a position above $2,610 and a renewed attempt to break the $2,770 – $2,805 zone.
🔴 Corrective: A pullback toward $2,530 to allow buyers to regroup and to sweep accumulated stop-loss orders.
⚠️ Summary:
The overall trend on the 4-hour chart remains bullish. The current sideways movement is a natural phase preceding the next impulse move. As long as bulls hold the key support zones, the priority remains a resumption of the uptrend.
📈 BTC and ETH: Market Analysis and Key Levels (4H)
Following a strong impulsive move, the cryptocurrency market has entered a phase of local consolidation. We analyze the current structure and potential price scenarios for BTC and ETH based on the 4-hour timeframe.
🪙 #bitcoin ($BTC /USD)
Current price: ~$83,383
Bitcoin established a new local high at $87,374 before entering a sideways range (accumulation). The price is currently trading near the lower boundary of this consolidation zone.
Key zones:
Resistance: $86,000 and the target block at $87,374 – $88,813.
Support: $81,266 – $82,000 (previous breakout zone) and the main block at $76,000 – $76,850.
Scenarios:
🟢 Bullish: Holding current levels and breaking out of the sideways range to the upside, aiming to retest $87,374.
🔴 Corrective: A local liquidity sweep with a drop to the $81,200 – $82,000 zone before the trend resumes.
💠 #Ethereum ($ETH /USD)
Current price: ~$2,655
Ethereum continues to show a stable bullish structure, consistently forming higher highs and higher lows. After reaching a local peak of $2,805, the price is currently pausing. Key zones:
Resistance: $2,770 – $2,805.
Support: $2,530 – $2,610 (immediate block) and $2,380 – $2,450 (primary buyer zone).
Scenarios:
🟢 Bullish: Establishing a position above $2,610 and a renewed attempt to break the $2,770 – $2,805 zone.
🔴 Corrective: A pullback toward $2,530 to allow buyers to regroup and to sweep accumulated stop-loss orders.
⚠️ Summary:
The overall trend on the 4-hour chart remains bullish. The current sideways movement is a natural phase preceding the next impulse move. As long as bulls hold the key support zones, the priority remains a resumption of the uptrend.
🪙 #bitcoin ($BTC /USD)
Current price: ~$83,383
Bitcoin established a new local high at $87,374 before entering a sideways range (accumulation). The price is currently trading near the lower boundary of this consolidation zone.
Key zones:
Resistance: $86,000 and the target block at $87,374 – $88,813.
Support: $81,266 – $82,000 (previous breakout zone) and the main block at $76,000 – $76,850.
Scenarios:
🟢 Bullish: Holding current levels and breaking out of the sideways range to the upside, aiming to retest $87,374.
🔴 Corrective: A local liquidity sweep with a drop to the $81,200 – $82,000 zone before the trend resumes.
💠 #Ethereum ($ETH /USD)
Current price: ~$2,655
Ethereum continues to show a stable bullish structure, consistently forming higher highs and higher lows. After reaching a local peak of $2,805, the price is currently pausing. Key zones:
Resistance: $2,770 – $2,805.
Support: $2,530 – $2,610 (immediate block) and $2,380 – $2,450 (primary buyer zone).
Scenarios:
🟢 Bullish: Establishing a position above $2,610 and a renewed attempt to break the $2,770 – $2,805 zone.
🔴 Corrective: A pullback toward $2,530 to allow buyers to regroup and to sweep accumulated stop-loss orders.
⚠️ Summary:
The overall trend on the 4-hour chart remains bullish. The current sideways movement is a natural phase preceding the next impulse move. As long as bulls hold the key support zones, the priority remains a resumption of the uptrend.
129

·
--
Maqola
Tarjimani ko‘rish
ETH/USDT — Weekly Trading Plan
...#Ethereum $ETH
{future}(ETHUSDT)
ETH/USDT — Weekly Trading Plan
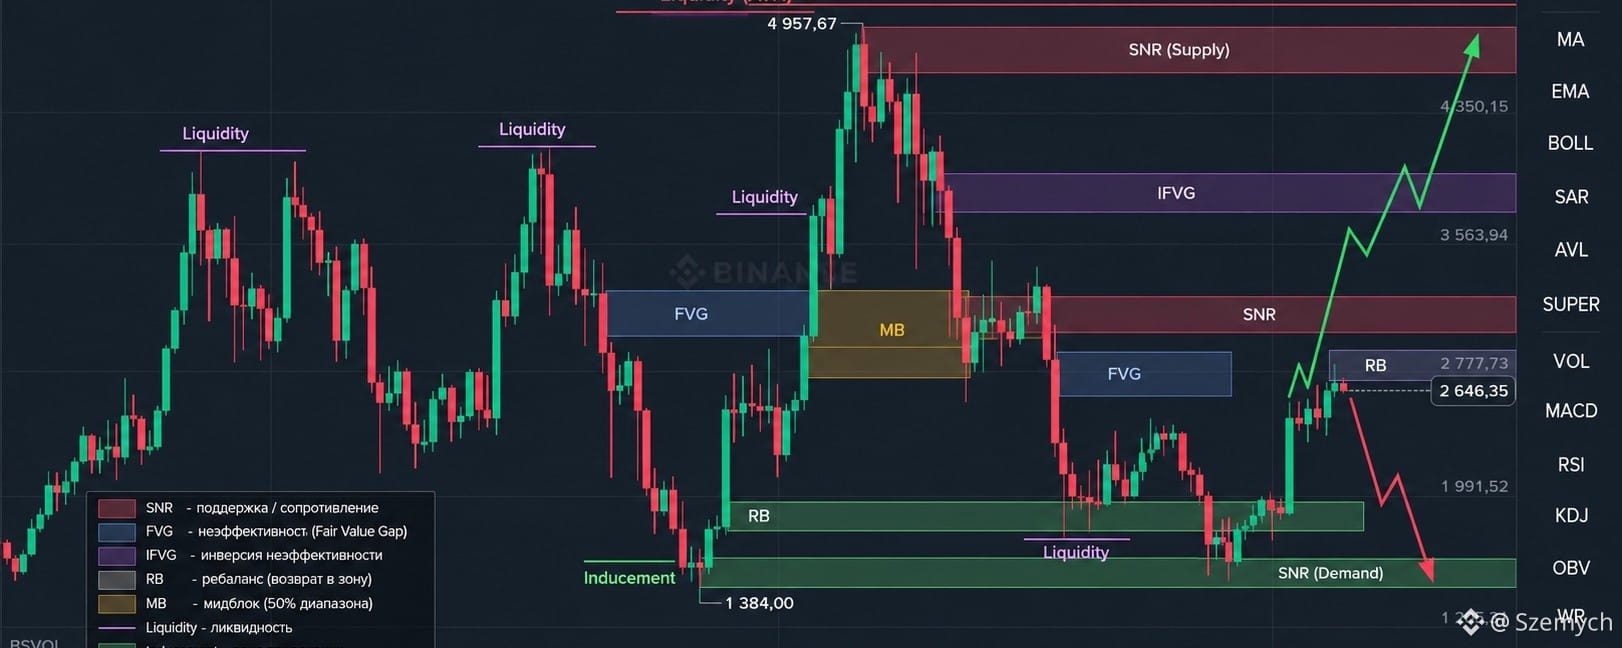
По структуре W1 → D1 → H4 → H1 → M15 → M5 цена находится около 2645. Главный факт недели: после достижения 2806.76 рынок не получил acceptance выше и начал коррекционную доставку вниз. При этом старший bullish leg от района 1500 пока не отменён.
HTF-контекст
На W1/D1 сохраняется восходящая структура, но 2806 сейчас выступает ключевой BSL/high. После его теста цена перешла в фазу mitigation.
На H4/H1 уже видна локальная bearish delivery:
2806 → 2720 → 2650
Цена последовательно теряет локальные поддержки, а область 2680–2720 становится ближайшей зоной предложения/возврата в неэффективность.
Ключевые зоны недели
ЗонаЗначение2800–2807External BSL / главный high2720–2735H1 supply / bearish POI2680–2705M15–H1 FVG/IFVG, зона ретеста2630–2655текущая SNR / зона проторговки2626–2634локальная SSL2580–2600следующая downside inefficiency2500–2540глубокая H1/H4 POI
По этим скриншотам точный POC/HVN определить нельзя без Volume Profile; зоны проторговки выше определены по времени принятия цены и перекрытию свечей.
🔴 SHORT-сценарий
Приоритет появляется при возврате 2680–2705, а глубже — 2720–2735.
Ищу:
Inducement/BSL → raid → bearish displacement → FVG/IFVG → retest → M15/M5 entry.
Цели доставки:
2650 → 2634/2626 → 2600 → 2580.
Acceptance ниже 2626 усилит вероятность более глубокой доставки к 2500–2540.
🟢 LONG-сценарий
Покупку от текущих уровней без подтверждения я бы не закладывал. Интереснее сначала увидеть снятие:
2634–2626 SSL
и затем:
bullish displacement → возврат выше 2655 → FVG/IFVG retest → M15/M5 confirmation.
Тогда цели:
2680 → 2705/2720 → 2806.
Возврат и acceptance выше 2806 будет уже сигналом возобновления HTF bullish delivery.
Логика недели
Сейчас ключевая цепочка:
2806 BSL → bearish displacement → 2680–2720 inefficiency → 2634/2626 SSL.
Поэтому 2626–2634 — главный decision point. Не сам уровень определяет сделку, а реакция после снятия ликвидности.
Ниже 2626 + acceptance → delivery к 2600/2580.
Sweep 2626 + reclaim 2655 → возврат к 2680–2720.
Weekly execution: Liquidity → Inducement → Displacement → FVG/IFVG → SNR/RB/MB → Entry.
В середине диапазона — без сделки.$ETH
ETH/USDT — Weekly Trading Plan ...
#Ethereum $ETH
ETH/USDT — Weekly Trading Plan
По структуре W1 → D1 → H4 → H1 → M15 → M5 цена находится около 2645. Главный факт недели: после достижения 2806.76 рынок не получил acceptance выше и начал коррекционную доставку вниз. При этом старший bullish leg от района 1500 пока не отменён.
HTF-контекст
На W1/D1 сохраняется восходящая структура, но 2806 сейчас выступает ключевой BSL/high. После его теста цена перешла в фазу mitigation.
На H4/H1 уже видна локальная bearish delivery:
2806 → 2720 → 2650
Цена последовательно теряет локальные поддержки, а область 2680–2720 становится ближайшей зоной предложения/возврата в неэффективность.
Ключевые зоны недели
ЗонаЗначение2800–2807External BSL / главный high2720–2735H1 supply / bearish POI2680–2705M15–H1 FVG/IFVG, зона ретеста2630–2655текущая SNR / зона проторговки2626–2634локальная SSL2580–2600следующая downside inefficiency2500–2540глубокая H1/H4 POI
По этим скриншотам точный POC/HVN определить нельзя без Volume Profile; зоны проторговки выше определены по времени принятия цены и перекрытию свечей.
🔴 SHORT-сценарий
Приоритет появляется при возврате 2680–2705, а глубже — 2720–2735.
Ищу:
Inducement/BSL → raid → bearish displacement → FVG/IFVG → retest → M15/M5 entry.
Цели доставки:
2650 → 2634/2626 → 2600 → 2580.
Acceptance ниже 2626 усилит вероятность более глубокой доставки к 2500–2540.
🟢 LONG-сценарий
Покупку от текущих уровней без подтверждения я бы не закладывал. Интереснее сначала увидеть снятие:
2634–2626 SSL
и затем:
bullish displacement → возврат выше 2655 → FVG/IFVG retest → M15/M5 confirmation.
Тогда цели:
2680 → 2705/2720 → 2806.
Возврат и acceptance выше 2806 будет уже сигналом возобновления HTF bullish delivery.
Логика недели
Сейчас ключевая цепочка:
2806 BSL → bearish displacement → 2680–2720 inefficiency → 2634/2626 SSL.
Поэтому 2626–2634 — главный decision point. Не сам уровень определяет сделку, а реакция после снятия ликвидности.
Ниже 2626 + acceptance → delivery к 2600/2580.
Sweep 2626 + reclaim 2655 → возврат к 2680–2720.
Weekly execution: Liquidity → Inducement → Displacement → FVG/IFVG → SNR/RB/MB → Entry.
В середине диапазона — без сделки.$ETH
ETH/USDT — Weekly Trading Plan
По структуре W1 → D1 → H4 → H1 → M15 → M5 цена находится около 2645. Главный факт недели: после достижения 2806.76 рынок не получил acceptance выше и начал коррекционную доставку вниз. При этом старший bullish leg от района 1500 пока не отменён.
HTF-контекст
На W1/D1 сохраняется восходящая структура, но 2806 сейчас выступает ключевой BSL/high. После его теста цена перешла в фазу mitigation.
На H4/H1 уже видна локальная bearish delivery:
2806 → 2720 → 2650
Цена последовательно теряет локальные поддержки, а область 2680–2720 становится ближайшей зоной предложения/возврата в неэффективность.
Ключевые зоны недели
ЗонаЗначение2800–2807External BSL / главный high2720–2735H1 supply / bearish POI2680–2705M15–H1 FVG/IFVG, зона ретеста2630–2655текущая SNR / зона проторговки2626–2634локальная SSL2580–2600следующая downside inefficiency2500–2540глубокая H1/H4 POI
По этим скриншотам точный POC/HVN определить нельзя без Volume Profile; зоны проторговки выше определены по времени принятия цены и перекрытию свечей.
🔴 SHORT-сценарий
Приоритет появляется при возврате 2680–2705, а глубже — 2720–2735.
Ищу:
Inducement/BSL → raid → bearish displacement → FVG/IFVG → retest → M15/M5 entry.
Цели доставки:
2650 → 2634/2626 → 2600 → 2580.
Acceptance ниже 2626 усилит вероятность более глубокой доставки к 2500–2540.
🟢 LONG-сценарий
Покупку от текущих уровней без подтверждения я бы не закладывал. Интереснее сначала увидеть снятие:
2634–2626 SSL
и затем:
bullish displacement → возврат выше 2655 → FVG/IFVG retest → M15/M5 confirmation.
Тогда цели:
2680 → 2705/2720 → 2806.
Возврат и acceptance выше 2806 будет уже сигналом возобновления HTF bullish delivery.
Логика недели
Сейчас ключевая цепочка:
2806 BSL → bearish displacement → 2680–2720 inefficiency → 2634/2626 SSL.
Поэтому 2626–2634 — главный decision point. Не сам уровень определяет сделку, а реакция после снятия ликвидности.
Ниже 2626 + acceptance → delivery к 2600/2580.
Sweep 2626 + reclaim 2655 → возврат к 2680–2720.
Weekly execution: Liquidity → Inducement → Displacement → FVG/IFVG → SNR/RB/MB → Entry.
В середине диапазона — без сделки.$ETH
101

·
--
Pasayuvchi
Tarjimani ko‘rish
$ETH Update 🔷
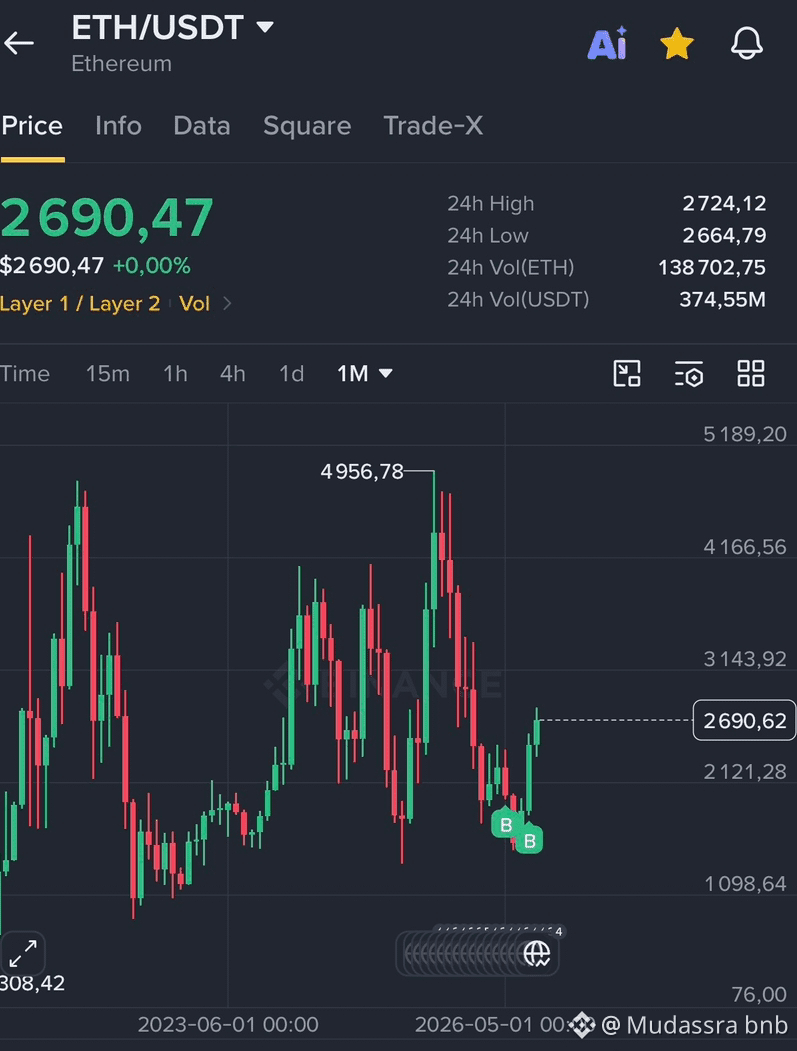
ETH cooling near $2,400–2,500 amid macro pressure. Reclaiming $2,600 could flip momentum bullish. Watching closely. 👀 Trade $ETH here
{spot}(ETHUSDT)
#Ethereum #ETH #Write2Earn
$ETH Update 🔷
ETH cooling near $2,400–2,500 amid macro pressure. Reclaiming $2,600 could flip momentum bullish. Watching closely. 👀 Trade $ETH here
#Ethereum #ETH #Write2Earn
ETH cooling near $2,400–2,500 amid macro pressure. Reclaiming $2,600 could flip momentum bullish. Watching closely. 👀 Trade $ETH here
#Ethereum #ETH #Write2Earn
3
2
210

·
--
Tarjimani ko‘rish
ETH cần điều kiện gì để hướng tới 3.000 USD?
ETH cần vượt vùng kháng cự 2.722–2.822 USD để củng cố kịch bản hướng tới 3.000 USD. Nếu giá tăng khiến người bán khống phải mua lại ETH để đóng vị thế, lực mua bổ sung có thể tạo ra một đợt ép đóng lệnh bán.
Quy mô bán khống lớn có thể trở thành yếu tố khuếch đại đà tăng khi giá đi ngược kỳ vọng của người bán. Tuy nhiên, mức tăng 13.000% của vị thế bán khống không tự bảo đảm rằng một đợt ép đóng lệnh sẽ xảy ra.
Kịch bản ETH đạt 3.000 USD trong tháng 10 vẫn phụ thuộc vào khả năng vượt kháng cự và sự xuất hiện của lực mua. Hoạt động tích lũy của cá voi cùng lượng staking tăng là các yếu tố hỗ trợ được nêu, không phải bằng chứng giá chắc chắn sẽ đạt mốc này.
$ETH $ETHW
#WriteToEarn
#Ethereum
ETH cần điều kiện gì để hướng tới 3.000 USD?
ETH cần vượt vùng kháng cự 2.722–2.822 USD để củng cố kịch bản hướng tới 3.000 USD. Nếu giá tăng khiến người bán khống phải mua lại ETH để đóng vị thế, lực mua bổ sung có thể tạo ra một đợt ép đóng lệnh bán.
Quy mô bán khống lớn có thể trở thành yếu tố khuếch đại đà tăng khi giá đi ngược kỳ vọng của người bán. Tuy nhiên, mức tăng 13.000% của vị thế bán khống không tự bảo đảm rằng một đợt ép đóng lệnh sẽ xảy ra.
Kịch bản ETH đạt 3.000 USD trong tháng 10 vẫn phụ thuộc vào khả năng vượt kháng cự và sự xuất hiện của lực mua. Hoạt động tích lũy của cá voi cùng lượng staking tăng là các yếu tố hỗ trợ được nêu, không phải bằng chứng giá chắc chắn sẽ đạt mốc này.
$ETH $ETHW
#WriteToEarn
#Ethereum
ETH cần vượt vùng kháng cự 2.722–2.822 USD để củng cố kịch bản hướng tới 3.000 USD. Nếu giá tăng khiến người bán khống phải mua lại ETH để đóng vị thế, lực mua bổ sung có thể tạo ra một đợt ép đóng lệnh bán.
Quy mô bán khống lớn có thể trở thành yếu tố khuếch đại đà tăng khi giá đi ngược kỳ vọng của người bán. Tuy nhiên, mức tăng 13.000% của vị thế bán khống không tự bảo đảm rằng một đợt ép đóng lệnh sẽ xảy ra.
Kịch bản ETH đạt 3.000 USD trong tháng 10 vẫn phụ thuộc vào khả năng vượt kháng cự và sự xuất hiện của lực mua. Hoạt động tích lũy của cá voi cùng lượng staking tăng là các yếu tố hỗ trợ được nêu, không phải bằng chứng giá chắc chắn sẽ đạt mốc này.
$ETH $ETHW
#WriteToEarn
#Ethereum
195

·
--
Tarjimani ko‘rish
🚀 Ethereum | ETH
ETH من العملات الرئيسية في سوق العملات الرقمية، وتتميز بنشاط تداول مرتفع على Binance.
📈 قبل الشراء، تابع اتجاه السوق وحجم التداول وحدد نقطة دخول وخروج مناسبة لخطة تداولك.
⚠️ لا يوجد ربح مضمون في سوق العملات الرقمية.
✍️ مستر السيد
#ETH #Ethereum #Binance #تداول_اليوم #Crypto #عملات_رقمية
#Ethereum #FedProposesPaymentStablecoinRules $NVDAB
🚀 Ethereum | ETH
ETH من العملات الرئيسية في سوق العملات الرقمية، وتتميز بنشاط تداول مرتفع على Binance.
📈 قبل الشراء، تابع اتجاه السوق وحجم التداول وحدد نقطة دخول وخروج مناسبة لخطة تداولك.
⚠️ لا يوجد ربح مضمون في سوق العملات الرقمية.
✍️ مستر السيد
#ETH #Ethereum #Binance #تداول_اليوم #Crypto #عملات_رقمية
#Ethereum #FedProposesPaymentStablecoinRules $NVDAB
ETH من العملات الرئيسية في سوق العملات الرقمية، وتتميز بنشاط تداول مرتفع على Binance.
📈 قبل الشراء، تابع اتجاه السوق وحجم التداول وحدد نقطة دخول وخروج مناسبة لخطة تداولك.
⚠️ لا يوجد ربح مضمون في سوق العملات الرقمية.
✍️ مستر السيد
#ETH #Ethereum #Binance #تداول_اليوم #Crypto #عملات_رقمية
#Ethereum #FedProposesPaymentStablecoinRules $NVDAB

1
84

·
--
Tarjimani ko‘rish
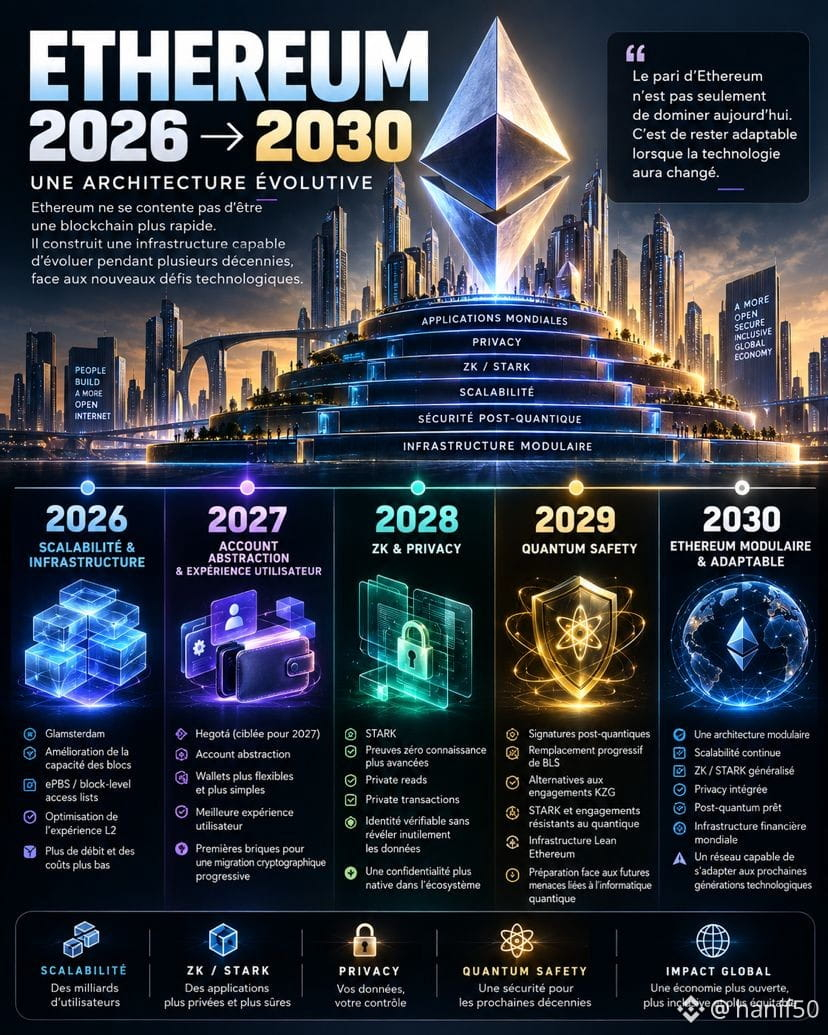
Il décrit un réseau qui s'appuie de plus en plus sur la cryptographie moderne : STARKs récursifs, vérification formelle, confidentialité, résistance aux ordinateurs quantiques.
Le but n'est plus seulement d'aller plus vite, mais de vérifier beaucoup plus de choses avec moins de travail pour chaque participant.
Hegota, prévu pour 2027, pourrait être le dernier « fork classique » avant cette nouvelle phase.
Sur le long terme, c'est cette trajectoire qu'il faut regarder, pas seulement le prix du jour. 👀
$ETH #Ethereum #crypto #Web3
{spot}(ETHUSDT)
Il décrit un réseau qui s'appuie de plus en plus sur la cryptographie moderne : STARKs récursifs, vérification formelle, confidentialité, résistance aux ordinateurs quantiques.
Le but n'est plus seulement d'aller plus vite, mais de vérifier beaucoup plus de choses avec moins de travail pour chaque participant.
Hegota, prévu pour 2027, pourrait être le dernier « fork classique » avant cette nouvelle phase.
Sur le long terme, c'est cette trajectoire qu'il faut regarder, pas seulement le prix du jour. 👀
$ETH #Ethereum #crypto #Web3
Le but n'est plus seulement d'aller plus vite, mais de vérifier beaucoup plus de choses avec moins de travail pour chaque participant.
Hegota, prévu pour 2027, pourrait être le dernier « fork classique » avant cette nouvelle phase.
Sur le long terme, c'est cette trajectoire qu'il faut regarder, pas seulement le prix du jour. 👀
$ETH #Ethereum #crypto #Web3
1
107

Tarjimani ko‘rish
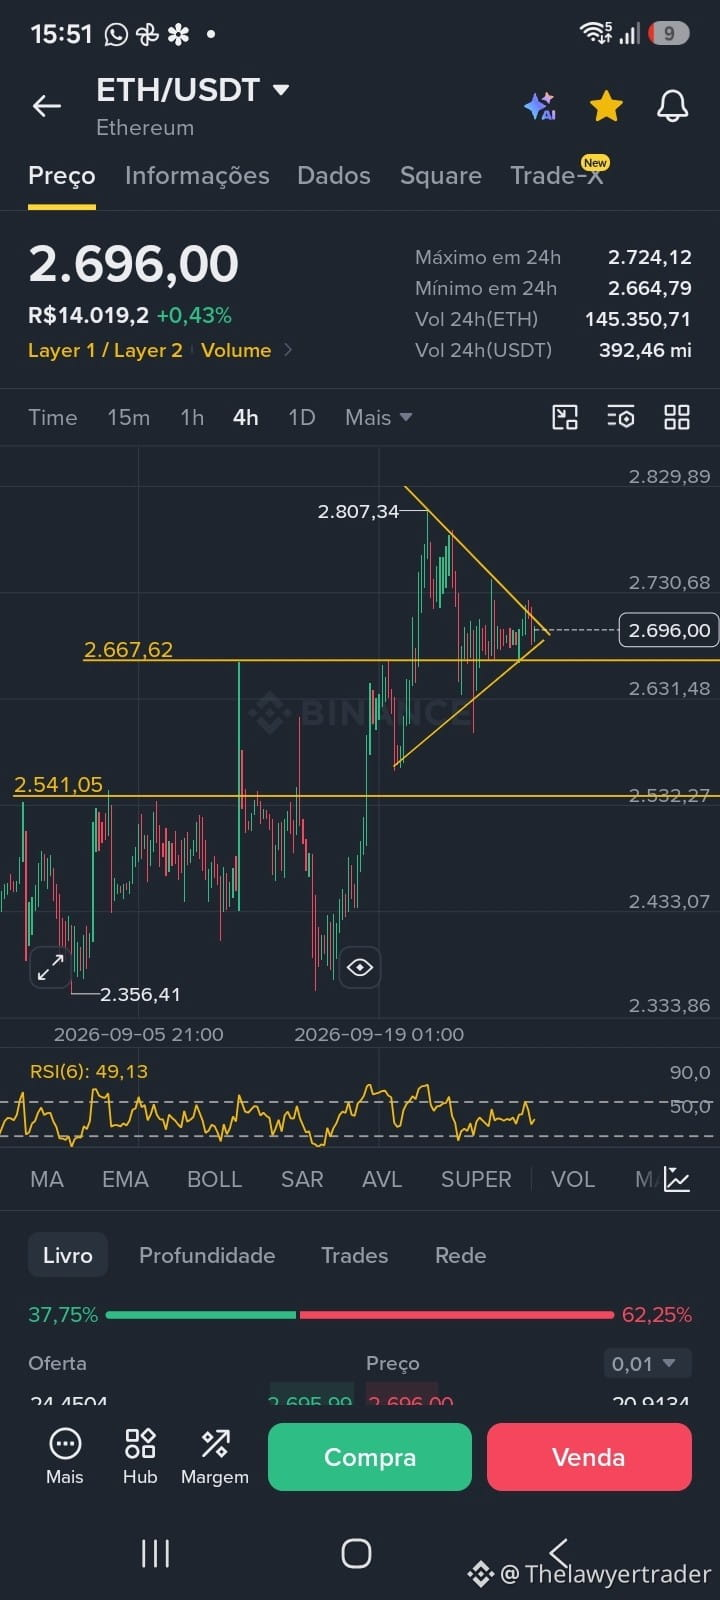
Análise ETH/USDT (gráfico 4h)
O Ethereum está em uma zona de consolidação em triângulo simétrico, com o preço comprimido entre uma resistência descendente e um suporte ascendente. Esse padrão indica indecisão do mercado e costuma anteceder um movimento de rompimento, que define a direção da tendência de curto prazo.
Pontos-chave:
Nível de referência: suporte/resistência em 2.667,62, atualmente sendo testado.
Zona de decisão: o triângulo converge próximo de 2.696,00. A saída dessa faixa (para cima ou para baixo) tende a direcionar o próximo movimento.
RSI(6): em 49,13, neutro, sem sobrecompra ou sobrevenda.
Fluxo de ordens: sentimento vendedor predominante, com 62,25% de ordens de venda contra 37,75% de compra.
Leitura: padrão de triângulo simétrico tem probabilidade moderada de rompimento, mas a direção ainda não está confirmada. O viés do livro de ofertas pende para o lado vendedor, o que sugere cautela. A confirmação viria com um fechamento consistente acima de 2.696 (alta) ou abaixo de 2.667 (baixa).
Aviso: análise técnica apenas, com base nos dados visuais do gráfico. Cripto é volátil; não é recomendação de investimento. Faça sua própria pesquisa.
#Ethereum $ETH
Análise ETH/USDT (gráfico 4h)
O Ethereum está em uma zona de consolidação em triângulo simétrico, com o preço comprimido entre uma resistência descendente e um suporte ascendente. Esse padrão indica indecisão do mercado e costuma anteceder um movimento de rompimento, que define a direção da tendência de curto prazo.
Pontos-chave:
Nível de referência: suporte/resistência em 2.667,62, atualmente sendo testado.
Zona de decisão: o triângulo converge próximo de 2.696,00. A saída dessa faixa (para cima ou para baixo) tende a direcionar o próximo movimento.
RSI(6): em 49,13, neutro, sem sobrecompra ou sobrevenda.
Fluxo de ordens: sentimento vendedor predominante, com 62,25% de ordens de venda contra 37,75% de compra.
Leitura: padrão de triângulo simétrico tem probabilidade moderada de rompimento, mas a direção ainda não está confirmada. O viés do livro de ofertas pende para o lado vendedor, o que sugere cautela. A confirmação viria com um fechamento consistente acima de 2.696 (alta) ou abaixo de 2.667 (baixa).
Aviso: análise técnica apenas, com base nos dados visuais do gráfico. Cripto é volátil; não é recomendação de investimento. Faça sua própria pesquisa.
#Ethereum $ETH
O Ethereum está em uma zona de consolidação em triângulo simétrico, com o preço comprimido entre uma resistência descendente e um suporte ascendente. Esse padrão indica indecisão do mercado e costuma anteceder um movimento de rompimento, que define a direção da tendência de curto prazo.
Pontos-chave:
Nível de referência: suporte/resistência em 2.667,62, atualmente sendo testado.
Zona de decisão: o triângulo converge próximo de 2.696,00. A saída dessa faixa (para cima ou para baixo) tende a direcionar o próximo movimento.
RSI(6): em 49,13, neutro, sem sobrecompra ou sobrevenda.
Fluxo de ordens: sentimento vendedor predominante, com 62,25% de ordens de venda contra 37,75% de compra.
Leitura: padrão de triângulo simétrico tem probabilidade moderada de rompimento, mas a direção ainda não está confirmada. O viés do livro de ofertas pende para o lado vendedor, o que sugere cautela. A confirmação viria com um fechamento consistente acima de 2.696 (alta) ou abaixo de 2.667 (baixa).
Aviso: análise técnica apenas, com base nos dados visuais do gráfico. Cripto é volátil; não é recomendação de investimento. Faça sua própria pesquisa.
#Ethereum $ETH
159


·
--
Tarjimani ko‘rish
A game about breeding cartoon cats slowed down all of Ethereum in December 2017.
CryptoKitties let users buy, breed, and trade unique digital cats as NFTs, before most people had even heard that word. Demand exploded so fast that pending transactions backed up across the network, and gas fees spiked for everyone.
Some of these cats sold for over $100,000 apiece. Meanwhile, ordinary ETH transfers that used to cost pennies were suddenly competing for block space with cartoon cats.
Ethereum survived, obviously, but the incident became one of the earliest public proofs that a single popular app could bring a major blockchain to a crawl.
ETH is at $2,648 today, on a network that's been rebuilt more than once partly because of moments like this one.
Did you ever try to mint or trade anything during a gas spike like that?
Personal view, not advice. Do your own research.
#Ethereum #CryptoKitties
A game about breeding cartoon cats slowed down all of Ethereum in December 2017.
CryptoKitties let users buy, breed, and trade unique digital cats as NFTs, before most people had even heard that word. Demand exploded so fast that pending transactions backed up across the network, and gas fees spiked for everyone.
Some of these cats sold for over $100,000 apiece. Meanwhile, ordinary ETH transfers that used to cost pennies were suddenly competing for block space with cartoon cats.
Ethereum survived, obviously, but the incident became one of the earliest public proofs that a single popular app could bring a major blockchain to a crawl.
ETH is at $2,648 today, on a network that's been rebuilt more than once partly because of moments like this one.
Did you ever try to mint or trade anything during a gas spike like that?
Personal view, not advice. Do your own research.
#Ethereum #CryptoKitties
CryptoKitties let users buy, breed, and trade unique digital cats as NFTs, before most people had even heard that word. Demand exploded so fast that pending transactions backed up across the network, and gas fees spiked for everyone.
Some of these cats sold for over $100,000 apiece. Meanwhile, ordinary ETH transfers that used to cost pennies were suddenly competing for block space with cartoon cats.
Ethereum survived, obviously, but the incident became one of the earliest public proofs that a single popular app could bring a major blockchain to a crawl.
ETH is at $2,648 today, on a network that's been rebuilt more than once partly because of moments like this one.
Did you ever try to mint or trade anything during a gas spike like that?
Personal view, not advice. Do your own research.
#Ethereum #CryptoKitties
517

·
--
Tarjimani ko‘rish
💰 $5 000 000+ ЗА ОДНУ СДЕЛКУ НА BINANCE
Звучит как сказка. Но это реальный кейс, опубликованный Binance.
Трейдер с ником «If I Don’t Understand» открыл LONG на 40 000 ETH-контрактов, когда рынок был настроен против Ethereum.
Итог этой сделки — более $5 млн прибыли.
А суммарно его прибыль на Binance Futures приблизилась к $9 млн. 🔥
Но самое интересное — не сумма.
Он сам подчёркивает: сделка была основана не на «чуйке», а на анализе ETF-притоков, фундаментальных факторов и управлении риском.
⚠️ Вот главный урок:
$5 млн — это результат стратегии, а не повод залетать в LONG с плечом ×100.
Новички смотрят на чужую прибыль.
Профессионалы — на то, сколько человек мог потерять, если сценарий оказался бы неверным.
Не охоться за быстрыми иксами.
Сначала научись не терять депозит.
Выживание → дисциплина → статистика → масштабирование. 📈
#Binance #Ethereum #futures #Crypto #Trading #Trader #BTC #Altcoins
💰 $5 000 000+ ЗА ОДНУ СДЕЛКУ НА BINANCE
Звучит как сказка. Но это реальный кейс, опубликованный Binance.
Трейдер с ником «If I Don’t Understand» открыл LONG на 40 000 ETH-контрактов, когда рынок был настроен против Ethereum.
Итог этой сделки — более $5 млн прибыли.
А суммарно его прибыль на Binance Futures приблизилась к $9 млн. 🔥
Но самое интересное — не сумма.
Он сам подчёркивает: сделка была основана не на «чуйке», а на анализе ETF-притоков, фундаментальных факторов и управлении риском.
⚠️ Вот главный урок:
$5 млн — это результат стратегии, а не повод залетать в LONG с плечом ×100.
Новички смотрят на чужую прибыль.
Профессионалы — на то, сколько человек мог потерять, если сценарий оказался бы неверным.
Не охоться за быстрыми иксами.
Сначала научись не терять депозит.
Выживание → дисциплина → статистика → масштабирование. 📈
#Binance #Ethereum #futures #Crypto #Trading #Trader #BTC #Altcoins
Звучит как сказка. Но это реальный кейс, опубликованный Binance.
Трейдер с ником «If I Don’t Understand» открыл LONG на 40 000 ETH-контрактов, когда рынок был настроен против Ethereum.
Итог этой сделки — более $5 млн прибыли.
А суммарно его прибыль на Binance Futures приблизилась к $9 млн. 🔥
Но самое интересное — не сумма.
Он сам подчёркивает: сделка была основана не на «чуйке», а на анализе ETF-притоков, фундаментальных факторов и управлении риском.
⚠️ Вот главный урок:
$5 млн — это результат стратегии, а не повод залетать в LONG с плечом ×100.
Новички смотрят на чужую прибыль.
Профессионалы — на то, сколько человек мог потерять, если сценарий оказался бы неверным.
Не охоться за быстрыми иксами.
Сначала научись не терять депозит.
Выживание → дисциплина → статистика → масштабирование. 📈
#Binance #Ethereum #futures #Crypto #Trading #Trader #BTC #Altcoins
415

·
--
Tarjimani ko‘rish
Конец привычной эпохи Ethereum близок.
Виталик Бутерин объявил, что запланированный на 2027 год хардфорк Hegota станет последним «нормальным» обновлением сети. Дальше старый блокчейн окончательно переродится в сложнейший децентрализованный криптографический механизм, где вместо привычных транзакций править бал будут безликие доказательства и скрытые вычисления. Разработчикам придется платить за структуру кода, а привычная прозрачность растворится в продвинутом шифровании. Сеть мутирует, навсегда оставляя позади классические технологии 2015 года. Наступает эра полной неопределенности.
#Ethereum #VitalikButerin #HEGOTA #cryptofuture #BlockchainMutation
Конец привычной эпохи Ethereum близок.
Виталик Бутерин объявил, что запланированный на 2027 год хардфорк Hegota станет последним «нормальным» обновлением сети. Дальше старый блокчейн окончательно переродится в сложнейший децентрализованный криптографический механизм, где вместо привычных транзакций править бал будут безликие доказательства и скрытые вычисления. Разработчикам придется платить за структуру кода, а привычная прозрачность растворится в продвинутом шифровании. Сеть мутирует, навсегда оставляя позади классические технологии 2015 года. Наступает эра полной неопределенности.
#Ethereum #VitalikButerin #HEGOTA #cryptofuture #BlockchainMutation
Виталик Бутерин объявил, что запланированный на 2027 год хардфорк Hegota станет последним «нормальным» обновлением сети. Дальше старый блокчейн окончательно переродится в сложнейший децентрализованный криптографический механизм, где вместо привычных транзакций править бал будут безликие доказательства и скрытые вычисления. Разработчикам придется платить за структуру кода, а привычная прозрачность растворится в продвинутом шифровании. Сеть мутирует, навсегда оставляя позади классические технологии 2015 года. Наступает эра полной неопределенности.
#Ethereum #VitalikButerin #HEGOTA #cryptofuture #BlockchainMutation
357

·
--
Tarjimani ko‘rish
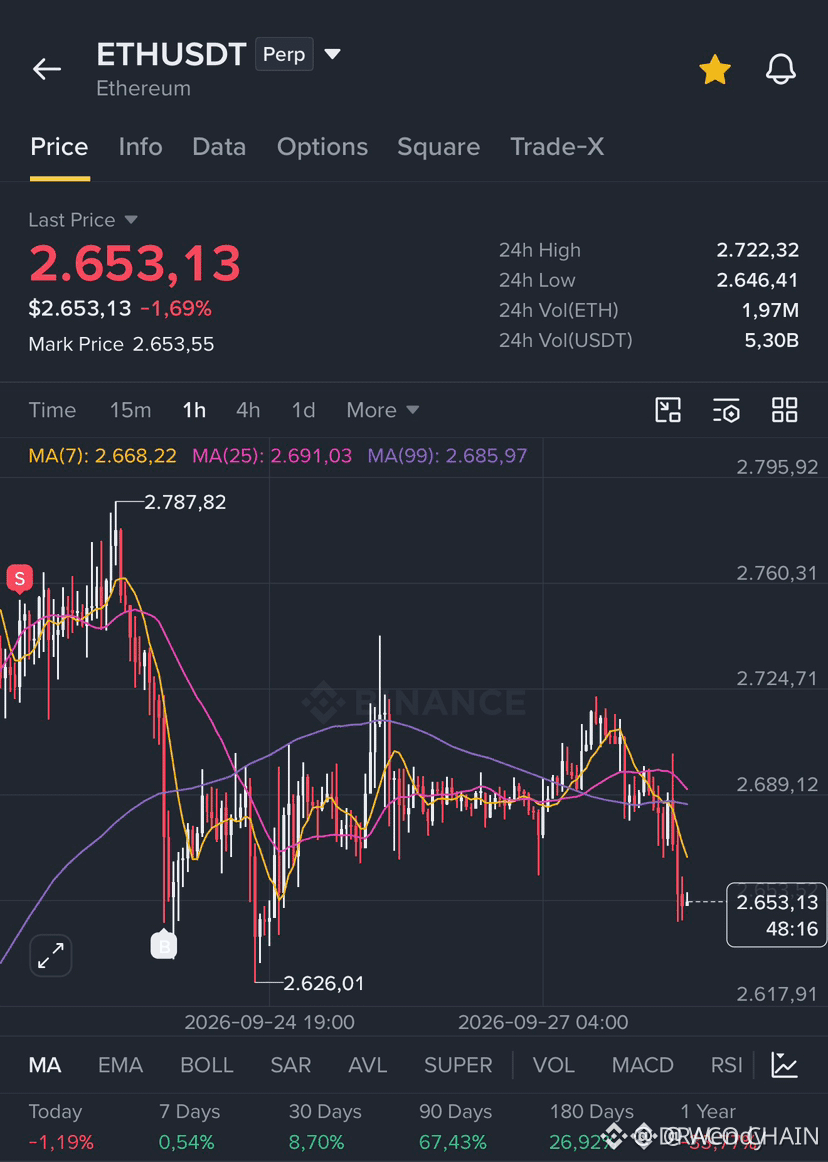
🚨 $ETH RISKS ACCELERATED LIQUIDITY FLUSH AS KEY SUPPORT STRUCTURE FAILS 🔻
Entry: 2650 - 2665 ⚡
Target: 2628 / 2585 / 2540 🎯
Stop Loss: 2695 ⚠️
Smart money has been systematically capping upside attempts, printing a sequence of lower highs that signals structural exhaustion across higher timeframes. 📊 As order flow turns decisive, losing this key range boundary threatens to trigger a sharp liquidity sweep into lower demand imbalances.
📌 With overhead supply resting tightly around 2695, the risk-to-reward clearly favors positioning for downside expansion toward the 2540 target zone. 🔍 💬 Are you waiting for a confirmed candle close below support or taking proactive entry in the premium zone? 👇
⚠️ Not financial advice. Always manage your risk. 🛡️
🏷️ #ETH #ShortSetup #Ethereum #Crypto
🎯 🦈
🚨 $ETH RISKS ACCELERATED LIQUIDITY FLUSH AS KEY SUPPORT STRUCTURE FAILS 🔻
Entry: 2650 - 2665 ⚡
Target: 2628 / 2585 / 2540 🎯
Stop Loss: 2695 ⚠️
Smart money has been systematically capping upside attempts, printing a sequence of lower highs that signals structural exhaustion across higher timeframes. 📊 As order flow turns decisive, losing this key range boundary threatens to trigger a sharp liquidity sweep into lower demand imbalances.
📌 With overhead supply resting tightly around 2695, the risk-to-reward clearly favors positioning for downside expansion toward the 2540 target zone. 🔍 💬 Are you waiting for a confirmed candle close below support or taking proactive entry in the premium zone? 👇
⚠️ Not financial advice. Always manage your risk. 🛡️
🏷️ #ETH #ShortSetup #Ethereum #Crypto
🎯 🦈
Entry: 2650 - 2665 ⚡
Target: 2628 / 2585 / 2540 🎯
Stop Loss: 2695 ⚠️
Smart money has been systematically capping upside attempts, printing a sequence of lower highs that signals structural exhaustion across higher timeframes. 📊 As order flow turns decisive, losing this key range boundary threatens to trigger a sharp liquidity sweep into lower demand imbalances.
📌 With overhead supply resting tightly around 2695, the risk-to-reward clearly favors positioning for downside expansion toward the 2540 target zone. 🔍 💬 Are you waiting for a confirmed candle close below support or taking proactive entry in the premium zone? 👇
⚠️ Not financial advice. Always manage your risk. 🛡️
🏷️ #ETH #ShortSetup #Ethereum #Crypto
🎯 🦈
13

Tasdiqlangan

Maqola
Tarjimani ko‘rish
Ethereum dejará de ser una blockchain al estilo Bitcoin, asegura Vitalik ButerinPara el cofundador de Ethereum, la red se encamina a un sistema que combina ideas de Nakamoto con nuevas herramientas criptográficas.
Vitalik Buterin es el cofundador de Ethereum
Buterin detalla el camino y asegura que Hegotá será la última actualización “normal”.
Después la actualización, el consenso cuántico seguro impulsará una nueva arquitectura.
Vitalik Buterin publicó este 27 de septiembre un ensayo en el que plantea un cambio de paradigma: Ethereum ya no debe pensarse únicamente como una «blockchain» al estilo de Bitcoin. Según el cofundador, la red se dirige a convertirse en lo que denomina «la computadora criptográfica mundial».
El desarrollador habla de un nuevo sistema que, a su juicio, combina las ideas originales de Satoshi Nakamoto con herramientas criptográficas maduras que ni siquiera existían en 2009.
El texto compara punto por punto el diseño de Bitcoin de 2010 con la red Ethereum de 2015 y la red actual. Y de ahí, proyecta que, para 2030, casi todas las propiedades fundamentales de la red serán transformadas.
La publicación destaca que todo esto será posible porque la criptografía moderna —especialmente las pruebas de conocimiento cero— permite algo que en la década de 2010 era imposible: descentralizar no solo por robustez, sino también para ganar escala y privacidad.
Para el Buterin, el camino hacia ese destino ya está en marcha en Ethereum, pues PeerDAS (el sistema de muestreo de disponibilidad de datos entre pares) marcó el inicio real de la transición. Es así porque permite a los nodos verificar la disponibilidad de datos mediante muestreo, en lugar de descargar y reejecutar todo el bloque.
Se trata de una mejora, ya activa, que reduce drásticamente los requisitos de hardware y prepara el terreno para una verificación basada en SNARKs (prueba de conocimiento cero).
El siguiente hito concreto es Hegotá, la actualización planeada para el próximo año, cuyas propuestas han sido reportadas por Criptonoticias.
Según el ensayo, será el último «fork normal» de Ethereum, con características todavía reconocibles para alguien que conociera la red en 2015. A partir de ahí, la transformación se convierte en la narrativa principal: llegada de STARKs recursivos, verificación formal automatizada, algoritmos de consenso altamente optimizados y medidas para hacer todo el sistema resistente a computadoras cuánticas.
En paralelo, los equipos también trabajan en dos frentes técnicos clave:
El primero es hacer las pruebas de conocimiento cero lo suficientemente eficientes y seguras. Buterin señala que esta complejidad está «encapsulada» y ya se optimiza con herramientas de inteligencia artificial.
El segundo, más sistémico, es gestionar y paralelizar el acceso a grandes volúmenes de estado.
Adicionalmente, existen varias propuestas en el horizonte que todavía deben refinarse según las aplicaciones que realmente se construyan.
Dinámica distinta para desarrolladores
El diseño también cambia los incentivos para los desarrolladores. En la arquitectura futura, el mismo volumen de computación costará mucho más si se concentra en una transacción serial opaca, y mucho menos si se organiza en dependencias bien encapsuladas que puedan paralelizarse o agregarse antes de entrar al bloque final.
Con el tiempo, esto empujará a las aplicaciones a publicar on-chain solo la información esencial sobre cambios de estado no conmutativos y a agregar el resto fuera de la cadena.
Buterin insiste en que la descentralización deja de ser únicamente un costo de seguridad, y gracias a la criptografía moderna se convierte, en ciertos casos, en una ventaja de rendimiento y privacidad. La red distribuida puede almacenar y procesar datos en paralelo y ocultar metadatos de formas que los sistemas centralizados no logran.
De esta forma, el resultado proyectado para 2030 es una capa de computación de alta seguridad, más barata, escalable y privada que cualquier cosa posible con la tecnología de la era anterior.
Ya no se trata solo de un libro contable donde se vuelca información, sino de una arquitectura que combina blockchain, criptografía avanzada y componentes descentralizados fuera de cadena.
Esa es, en sus palabras, la «computadora criptográfica mundial». Una propuesta que, de acuerdo con el debate que se generó en redes sociales, es positiva, aunque con matices. Mientras muchos usuarios celebraron la visión como un salto cualitativo más allá del modelo blockchain tradicional, algunos cuestionaron la «economía política» de esta computadora mundial.
Una de las grandes dudas que manifestaron los comentaristas de X es si, tras Hegotá, debería dejarse de decir a los desarrolladores de aplicaciones que «escriben para una blockchain». La respuesta solo la dará el tiempo. Habrá que esperar.
#bitcoin #Ethereum #VitalikButerin #blockchain #Desarrolladores $BTC $ETH
Ethereum dejará de ser una blockchain al estilo Bitcoin, asegura Vitalik Buterin
Para el cofundador de Ethereum, la red se encamina a un sistema que combina ideas de Nakamoto con nuevas herramientas criptográficas.
Vitalik Buterin es el cofundador de Ethereum
Buterin detalla el camino y asegura que Hegotá será la última actualización “normal”.
Después la actualización, el consenso cuántico seguro impulsará una nueva arquitectura.
Vitalik Buterin publicó este 27 de septiembre un ensayo en el que plantea un cambio de paradigma: Ethereum ya no debe pensarse únicamente como una «blockchain» al estilo de Bitcoin. Según el cofundador, la red se dirige a convertirse en lo que denomina «la computadora criptográfica mundial».
El desarrollador habla de un nuevo sistema que, a su juicio, combina las ideas originales de Satoshi Nakamoto con herramientas criptográficas maduras que ni siquiera existían en 2009.
El texto compara punto por punto el diseño de Bitcoin de 2010 con la red Ethereum de 2015 y la red actual. Y de ahí, proyecta que, para 2030, casi todas las propiedades fundamentales de la red serán transformadas.
La publicación destaca que todo esto será posible porque la criptografía moderna —especialmente las pruebas de conocimiento cero— permite algo que en la década de 2010 era imposible: descentralizar no solo por robustez, sino también para ganar escala y privacidad.
Para el Buterin, el camino hacia ese destino ya está en marcha en Ethereum, pues PeerDAS (el sistema de muestreo de disponibilidad de datos entre pares) marcó el inicio real de la transición. Es así porque permite a los nodos verificar la disponibilidad de datos mediante muestreo, en lugar de descargar y reejecutar todo el bloque.
Se trata de una mejora, ya activa, que reduce drásticamente los requisitos de hardware y prepara el terreno para una verificación basada en SNARKs (prueba de conocimiento cero).
El siguiente hito concreto es Hegotá, la actualización planeada para el próximo año, cuyas propuestas han sido reportadas por Criptonoticias.
Según el ensayo, será el último «fork normal» de Ethereum, con características todavía reconocibles para alguien que conociera la red en 2015. A partir de ahí, la transformación se convierte en la narrativa principal: llegada de STARKs recursivos, verificación formal automatizada, algoritmos de consenso altamente optimizados y medidas para hacer todo el sistema resistente a computadoras cuánticas.
En paralelo, los equipos también trabajan en dos frentes técnicos clave:
El primero es hacer las pruebas de conocimiento cero lo suficientemente eficientes y seguras. Buterin señala que esta complejidad está «encapsulada» y ya se optimiza con herramientas de inteligencia artificial.
El segundo, más sistémico, es gestionar y paralelizar el acceso a grandes volúmenes de estado.
Adicionalmente, existen varias propuestas en el horizonte que todavía deben refinarse según las aplicaciones que realmente se construyan.
Dinámica distinta para desarrolladores
El diseño también cambia los incentivos para los desarrolladores. En la arquitectura futura, el mismo volumen de computación costará mucho más si se concentra en una transacción serial opaca, y mucho menos si se organiza en dependencias bien encapsuladas que puedan paralelizarse o agregarse antes de entrar al bloque final.
Con el tiempo, esto empujará a las aplicaciones a publicar on-chain solo la información esencial sobre cambios de estado no conmutativos y a agregar el resto fuera de la cadena.
Buterin insiste en que la descentralización deja de ser únicamente un costo de seguridad, y gracias a la criptografía moderna se convierte, en ciertos casos, en una ventaja de rendimiento y privacidad. La red distribuida puede almacenar y procesar datos en paralelo y ocultar metadatos de formas que los sistemas centralizados no logran.
De esta forma, el resultado proyectado para 2030 es una capa de computación de alta seguridad, más barata, escalable y privada que cualquier cosa posible con la tecnología de la era anterior.
Ya no se trata solo de un libro contable donde se vuelca información, sino de una arquitectura que combina blockchain, criptografía avanzada y componentes descentralizados fuera de cadena.
Esa es, en sus palabras, la «computadora criptográfica mundial». Una propuesta que, de acuerdo con el debate que se generó en redes sociales, es positiva, aunque con matices. Mientras muchos usuarios celebraron la visión como un salto cualitativo más allá del modelo blockchain tradicional, algunos cuestionaron la «economía política» de esta computadora mundial.
Una de las grandes dudas que manifestaron los comentaristas de X es si, tras Hegotá, debería dejarse de decir a los desarrolladores de aplicaciones que «escriben para una blockchain». La respuesta solo la dará el tiempo. Habrá que esperar.
#bitcoin #Ethereum #VitalikButerin #blockchain #Desarrolladores $BTC $ETH
Vitalik Buterin es el cofundador de Ethereum
Buterin detalla el camino y asegura que Hegotá será la última actualización “normal”.
Después la actualización, el consenso cuántico seguro impulsará una nueva arquitectura.
Vitalik Buterin publicó este 27 de septiembre un ensayo en el que plantea un cambio de paradigma: Ethereum ya no debe pensarse únicamente como una «blockchain» al estilo de Bitcoin. Según el cofundador, la red se dirige a convertirse en lo que denomina «la computadora criptográfica mundial».
El desarrollador habla de un nuevo sistema que, a su juicio, combina las ideas originales de Satoshi Nakamoto con herramientas criptográficas maduras que ni siquiera existían en 2009.
El texto compara punto por punto el diseño de Bitcoin de 2010 con la red Ethereum de 2015 y la red actual. Y de ahí, proyecta que, para 2030, casi todas las propiedades fundamentales de la red serán transformadas.
La publicación destaca que todo esto será posible porque la criptografía moderna —especialmente las pruebas de conocimiento cero— permite algo que en la década de 2010 era imposible: descentralizar no solo por robustez, sino también para ganar escala y privacidad.
Para el Buterin, el camino hacia ese destino ya está en marcha en Ethereum, pues PeerDAS (el sistema de muestreo de disponibilidad de datos entre pares) marcó el inicio real de la transición. Es así porque permite a los nodos verificar la disponibilidad de datos mediante muestreo, en lugar de descargar y reejecutar todo el bloque.
Se trata de una mejora, ya activa, que reduce drásticamente los requisitos de hardware y prepara el terreno para una verificación basada en SNARKs (prueba de conocimiento cero).
El siguiente hito concreto es Hegotá, la actualización planeada para el próximo año, cuyas propuestas han sido reportadas por Criptonoticias.
Según el ensayo, será el último «fork normal» de Ethereum, con características todavía reconocibles para alguien que conociera la red en 2015. A partir de ahí, la transformación se convierte en la narrativa principal: llegada de STARKs recursivos, verificación formal automatizada, algoritmos de consenso altamente optimizados y medidas para hacer todo el sistema resistente a computadoras cuánticas.
En paralelo, los equipos también trabajan en dos frentes técnicos clave:
El primero es hacer las pruebas de conocimiento cero lo suficientemente eficientes y seguras. Buterin señala que esta complejidad está «encapsulada» y ya se optimiza con herramientas de inteligencia artificial.
El segundo, más sistémico, es gestionar y paralelizar el acceso a grandes volúmenes de estado.
Adicionalmente, existen varias propuestas en el horizonte que todavía deben refinarse según las aplicaciones que realmente se construyan.
Dinámica distinta para desarrolladores
El diseño también cambia los incentivos para los desarrolladores. En la arquitectura futura, el mismo volumen de computación costará mucho más si se concentra en una transacción serial opaca, y mucho menos si se organiza en dependencias bien encapsuladas que puedan paralelizarse o agregarse antes de entrar al bloque final.
Con el tiempo, esto empujará a las aplicaciones a publicar on-chain solo la información esencial sobre cambios de estado no conmutativos y a agregar el resto fuera de la cadena.
Buterin insiste en que la descentralización deja de ser únicamente un costo de seguridad, y gracias a la criptografía moderna se convierte, en ciertos casos, en una ventaja de rendimiento y privacidad. La red distribuida puede almacenar y procesar datos en paralelo y ocultar metadatos de formas que los sistemas centralizados no logran.
De esta forma, el resultado proyectado para 2030 es una capa de computación de alta seguridad, más barata, escalable y privada que cualquier cosa posible con la tecnología de la era anterior.
Ya no se trata solo de un libro contable donde se vuelca información, sino de una arquitectura que combina blockchain, criptografía avanzada y componentes descentralizados fuera de cadena.
Esa es, en sus palabras, la «computadora criptográfica mundial». Una propuesta que, de acuerdo con el debate que se generó en redes sociales, es positiva, aunque con matices. Mientras muchos usuarios celebraron la visión como un salto cualitativo más allá del modelo blockchain tradicional, algunos cuestionaron la «economía política» de esta computadora mundial.
Una de las grandes dudas que manifestaron los comentaristas de X es si, tras Hegotá, debería dejarse de decir a los desarrolladores de aplicaciones que «escriben para una blockchain». La respuesta solo la dará el tiempo. Habrá que esperar.
#bitcoin #Ethereum #VitalikButerin #blockchain #Desarrolladores $BTC $ETH
44

·
--
O‘suvchi
Tarjimani ko‘rish
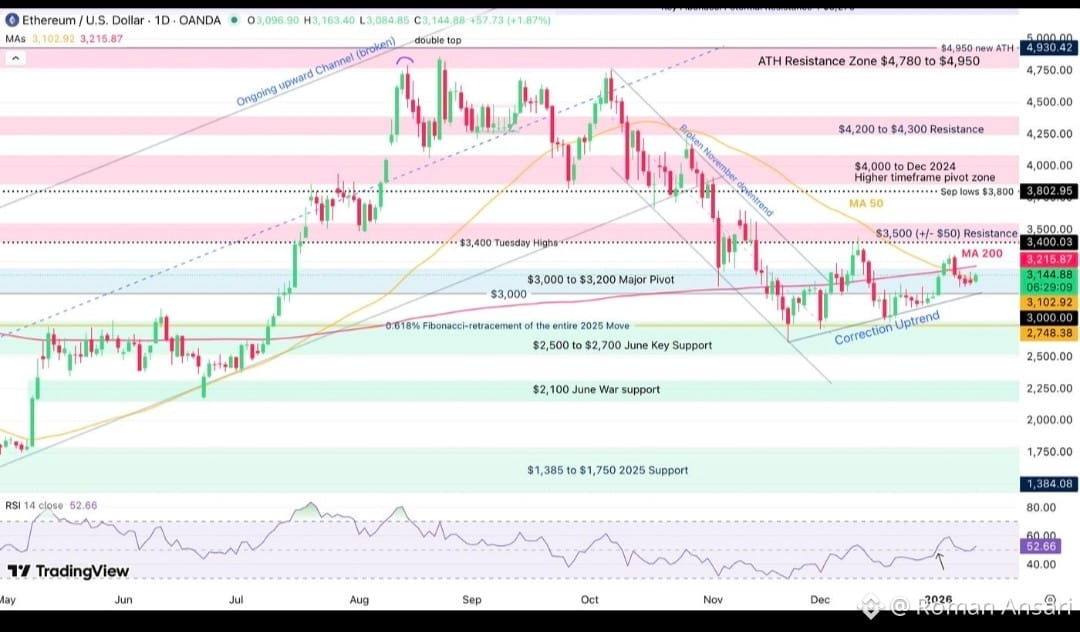
📊 #Ethereum Latest Analysis — 28 Sep 2026
Current price: around $2,650. ETH is in a short-term pullback after rejection near $2,800. �
CoinMarketCap +1
🟢 Bullish: Daily trend remains constructive while #ETH holds above roughly $2,580–$2,600.
🔑 Resistance: $2,700–$2,800. A clean breakout above $2,800 could open the way toward $3,000–$3,050. �
Reuters
🔴 Support: $2,580, then around $2,450 if support breaks. �
CoinMarketCap
⚠️ Short term: Momentum has weakened, so volatility and another dip are possible before the next move.
Overall: 🟢 Medium-term bullish, short-term cautious. ETH needs to reclaim $2,700–$2,800 for stronger bullish confirmation.
Not financial advice; crypto is highly volatile.
#Ethereum #bitcoin #tradingtechnique
{spot}(ETHUSDT)
📊 #Ethereum Latest Analysis — 28 Sep 2026
Current price: around $2,650. ETH is in a short-term pullback after rejection near $2,800. �
CoinMarketCap +1
🟢 Bullish: Daily trend remains constructive while #ETH holds above roughly $2,580–$2,600.
🔑 Resistance: $2,700–$2,800. A clean breakout above $2,800 could open the way toward $3,000–$3,050. �
Reuters
🔴 Support: $2,580, then around $2,450 if support breaks. �
CoinMarketCap
⚠️ Short term: Momentum has weakened, so volatility and another dip are possible before the next move.
Overall: 🟢 Medium-term bullish, short-term cautious. ETH needs to reclaim $2,700–$2,800 for stronger bullish confirmation.
Not financial advice; crypto is highly volatile.
#Ethereum #bitcoin #tradingtechnique
Current price: around $2,650. ETH is in a short-term pullback after rejection near $2,800. �
CoinMarketCap +1
🟢 Bullish: Daily trend remains constructive while #ETH holds above roughly $2,580–$2,600.
🔑 Resistance: $2,700–$2,800. A clean breakout above $2,800 could open the way toward $3,000–$3,050. �
Reuters
🔴 Support: $2,580, then around $2,450 if support breaks. �
CoinMarketCap
⚠️ Short term: Momentum has weakened, so volatility and another dip are possible before the next move.
Overall: 🟢 Medium-term bullish, short-term cautious. ETH needs to reclaim $2,700–$2,800 for stronger bullish confirmation.
Not financial advice; crypto is highly volatile.
#Ethereum #bitcoin #tradingtechnique
1
3

·
--
Tarjimani ko‘rish
Most people are focused on $ETH is current price.
But the bigger story may be what Ethereum is being built to become. 🔥
Vitalik has described a vision of Ethereum as a true “world cryptographic computer” — combining security, privacy, verification, and massive-scale computation.
And the roadmap gets even more interesting:
⚡ Hegota — 2027
⚡ Recursive STARKs
⚡ Formal verification
⚡ Quantum-resistant architecture
⚡ Major scalability upgrades
If Ethereum executes on this vision, the network could operate at a completely different level.
And that raises one serious question:
💰 Is $10,000 ETH actually unrealistic?
I think the market may still be underestimating Ethereum’s long-term potential.
The question isn’t whether ETH can move…
It’s whether you’ll still be watching when the next major expansion begins. 👀🚀
#Ethereum #Crypto #Trading #ETH
{spot}(ETHUSDT)
Most people are focused on $ETH is current price.
But the bigger story may be what Ethereum is being built to become. 🔥
Vitalik has described a vision of Ethereum as a true “world cryptographic computer” — combining security, privacy, verification, and massive-scale computation.
And the roadmap gets even more interesting:
⚡ Hegota — 2027
⚡ Recursive STARKs
⚡ Formal verification
⚡ Quantum-resistant architecture
⚡ Major scalability upgrades
If Ethereum executes on this vision, the network could operate at a completely different level.
And that raises one serious question:
💰 Is $10,000 ETH actually unrealistic?
I think the market may still be underestimating Ethereum’s long-term potential.
The question isn’t whether ETH can move…
It’s whether you’ll still be watching when the next major expansion begins. 👀🚀
#Ethereum #Crypto #Trading #ETH
But the bigger story may be what Ethereum is being built to become. 🔥
Vitalik has described a vision of Ethereum as a true “world cryptographic computer” — combining security, privacy, verification, and massive-scale computation.
And the roadmap gets even more interesting:
⚡ Hegota — 2027
⚡ Recursive STARKs
⚡ Formal verification
⚡ Quantum-resistant architecture
⚡ Major scalability upgrades
If Ethereum executes on this vision, the network could operate at a completely different level.
And that raises one serious question:
💰 Is $10,000 ETH actually unrealistic?
I think the market may still be underestimating Ethereum’s long-term potential.
The question isn’t whether ETH can move…
It’s whether you’ll still be watching when the next major expansion begins. 👀🚀
#Ethereum #Crypto #Trading #ETH
13
Ko‘proq kontentni ko‘rish uchun tizimga kiring
Binance Square'da global kriptovalyuta foydalanuvchilariga qo‘shiling
⚡️ Kriptovalyuta haqida eng so‘nggi va foydali ma’lumotlarni oling.
💬 Dunyoning eng yirik kriptovalyuta birjasi tomonidan ishonchli deb topilgan.
👍 Tasdiqlangan mualliflardan haqiqiy tahlillarni kashf eting.
Email / telefon raqami
Trenddagi mavzular
1
#GoldFallsTo$4144
1,368 marta koʻrilgan
48 muhokama qilmoqda
2
#QNTFallsOver40%FromMorningHigh
9,941 marta koʻrilgan
378 muhokama qilmoqda
3
#KospiFalls2.7%SamsungSKHynixDropOver5%
790 marta koʻrilgan
121 muhokama qilmoqda
4
#BitgetCEOConfirms$388MStolenInHack
495 marta koʻrilgan
22 muhokama qilmoqda
5
#BTCFallsBelow$83000
10,835 marta koʻrilgan
105 muhokama qilmoqda
6
#BitgetDetailsSecurityIncidentTimeline
8,527 marta koʻrilgan
281 muhokama qilmoqda
7
#BitcoinSpotETFs$2.39BWeeklyNetInflow
3,832 marta koʻrilgan
24 muhokama qilmoqda
8
#FedProposesPaymentStablecoinRules
34,808 marta koʻrilgan
644 muhokama qilmoqda
9
#ChinaMayLetAlibabaByteDanceBuyNvidiaChips
36,544 marta koʻrilgan
679 muhokama qilmoqda
10
#USChinaRelease$30BTariffCutProductLists
3,460 marta koʻrilgan
51 muhokama qilmoqda