

Théok
488 Публікації

Théok
Поскаржитись
Заблокувати користувача
Binance Angel 🦅 | Web3 & Crypto Educator
Breaking down Binance, DeFi & TradFi for Africa 🌍
Congo (DRC) | Building the future of finance
📊 Weekly insights
18 Підписки
23.5K+ Підписники
8.1K+ Вподобань
Публікації
Усі
Цитування
Трансляції
·
--

Стаття
Переглянути переклад
Tokenized Stocks Cross $3B: The On-Chain Economy Is No Longer SpeculationTokenized stocks crossed $3 billion in market capitalization in the fourth week of September a milestone for an on-chain economy shifting from speculation to real financial markets. The numbers underneath tell the story: on-chain RWA transfers hit $100B in Q3 (vs. $6B in Q1), RWAs now account for 5% of DEX activity (up from under 1%), and the broader RWA market reached $38B, up 50% year to date. At the center sits BNB Chain — #1 for tokenized-stock market cap and holders, with bStocks the fastest-growing and most-transferred tokenized-stock product of 2026.
📊 The $3B Milestone What It Actually Means
Numbers in crypto get big fast. Billions get thrown around casually. So it is worth pausing on what the $3B tokenized stock market cap milestone actually represents because this one is different.
It is not speculation capital. Every dollar in tokenized stock market cap represents a real US stock Apple, NVIDIA, Tesla, Amazon that has been purchased by a real investor and represented on-chain. This is not a speculative token backed by nothing. It is equity capital that has migrated from traditional markets to blockchain rails.
It is not theoretical demand. The $3B figure reflects actual purchases, actual on-chain transfers, and actual holders who chose to access US equities through tokenized infrastructure rather than traditional brokerage. These are real investment decisions made by real people.
It is not a singleproduct. The $3B represents an ecosystem multiple platforms, multiple chains, multiple products all serving investors who want on-chain access to real-world financial assets.
But within that ecosystem, one player dominates: BNB Chain, with bStocks as the fastest-growing and most-transferred tokenized-stock product of 2026.
The milestone is not a prediction. It is a measurement. And what it measures is an on-chain economy that has moved past its speculative phase into something that looks increasingly like real financial market infrastructure.
📈 The Q3 Numbers That Tell the Deeper Story
The $3B headline is the visible number. The Q3 data underneath it tells you why this milestone is structurally significant rather than a temporary spike.
On-chain RWA transfers: $100B in Q3vs. $6B in Q1.
This is the number that should stop you. In Q1 2026, on-chain RWA transfers totaled $6 billion. By Q3, that figure had grown to $100 billion. That is not linear growth. That is a 16x increase in two quarters. When transfer volume grows at that rate, it tells you that real capital is moving — not just sitting on-chain, but actively transacting, deploying, and flowing through DeFi.
RWAs now account for 5% of DEX activity, up from under 1%.
Six months ago, RWAs were a rounding error in DEX volume. Today they represent 1 in 20 DEX transactions. That shift from under 1% to 5% is not a gradual evolution it is a step change. It means RWAs have crossed the threshold from "niche alternative" to "mainstream DeFi activity." When DeFi users execute 5% of their trades in real-world assets, you are looking at a structural integration, not an experiment.
The broader RWA market reached $38B, up 50% year to date.
The tokenized stock milestone sits within a broader context: the entire RWA market has grown 50% year to date, reaching $38 billion. That growth is not concentrated in one asset class it spans tokenized stocks, tokenized bonds, tokenized real estate, tokenized commodities, and tokenized money market funds. The diversification tells you this is not a single-product narrative. It is a category expansion.
What these three numbers tell you together:
When transfer volume grows 16x, when DEX market share quintuples, and when the entire category grows 50% year to date you are not watching a trend. You are watching a structural shift in how financial capital interacts with blockchain infrastructure. The on-chain economy is no longer a speculation market. It is becoming a real financial market.
🏆 BNB Chain for Tokenized Stock Market Cap and Holders
Within the tokenized equity category, BNB Chain holds the top position by two of the most important metrics: market cap and holders.
Why these two metrics matter:
Market cap tells you where the capital is. Holders tell you where the users are. When one chain leads on both simultaneously, it tells you that capital and participation are aligned — not split between a high-AUM chain with few active users and a high-user chain with shallow capital.
BNB Chain's position at #1 reflects years of infrastructure building, liquidity accumulation, and user onboarding that produced an ecosystem where tokenized stockshave both depth and breadth. Deep capital without broad holders produces thin markets. Broad holders without deep capital produces illiquid markets. BNB Chain has both.
The infrastructure that built this position:
Binance's bStocks product is the primary driver of BNB Chain's tokenized stock leadership. With $21.6B in cumulative on-chain trading volume, 450,000 holders, and 43 million on-chain transactions, bStocks has built the infrastructure base that makes BNB Chain the destination for tokenized equity activity.
The P2P mobile money rails connecting MTN, Orange Money, M-Pesa, and Airtel to USDT and then to tokenized stocks mean that BNB Chain's user base extends across Africa and emerging markets in a way that no other chain has replicated. When an investor in Lagos converts MTNMobile Money to USDT and buys NVDA, that transaction flows through BNB Chain infrastructure. That is a user that Ethereum-based tokenized stock platforms are not capturing.
🚀 bStocks Fastest-Growing and Most-Transferred Tokenized Stock Product of 2026
Being the fastest-growing product in the fastest-growing category is the compound growth story that matters for 2026.
What "fastest-growing" means in practice:
Growth in tokenized equities is measured by new users, new AUM, and new on-chain activity. bStocks has led all three metrics through 2026. As Robin hood entered the category, as Ondo expanded, as Backed built bStocks grew faster than all of them.
What "most-transferred" means:
Transfer volume is the purest measure of active use. A tokenized stock that sits in a wallet generating no activity contributes to market cap but not to the on-chain economy's vitality. bStocks is not sitting idle it is the most-transferred tokenized stock product of 2026, meaning its holders are actively trading, deploying into DeFi, and using their positions as productive financial instruments.
This is the difference between a store of value and an active financial instrument. bStocks is being used and the transfer data proves it.
The PAR implication:
The most-transferred status directly feeds Binance's Programmable Asset Ratio (PAR) framework. High transfer volume means bStocks holders are not just holding they are deploying. That deployment into DeFi protocols, lending markets, and liquidity pools is exactly what PAR measures. bStocks' position as the most-transferred product means its PAR is structurally higher than competitors assets are active, not dormant.
🌍 What the $3B Milestone Means for African Investors
The crossing of $3B in tokenized stock market cap is not a number that lives in isolation. It has direct implications for African investors who are using bStocks and BNB Chain infrastructure to access US equity markets.
Deeper markets mean better execution. As the tokenized stock market cap grows, more capital sits in order books, spreads tighten, and slippage decreases. An African investor buying $1,000 of NVDA through bStocks gets a better fill price when the market is at $3B than when it was at $300M because more capital absorbs the order without moving the price against them.
**More DEX activity means more DeFi opportunity.**When RWAs reach 5% of DEX activity, it means more DeFi protocols are integrating tokenized stocks as productive assets. For an investor in Kinshasa who holds bStocks, that means more options for earning yield, using positions as collateral, and deploying capital productively not just holding.
The P2P bridge is the structural advantage. As the tokenized stock market grows globally, Binance's P2P infrastructure connecting African mobile money to USDT to bStocks remains the most direct path from local fiat to global equity exposure. That path does not exist on Ethereum-based tokenized stock platforms. It does not exist on Robin hood. It exists on Binance because Binance built the P2P rails first, years ago, when nobody was watching.
**The $100B in Q3 RWA transfers includes African users.**Every MTN Mobile Money conversion to USDT to bStocks transaction contributes to that $100B. African investors are not passive observers of the RWA market's growth they are participants in it, and the infrastructure that enables their participation is BNB Chain and bStocks.
🔗 The Shift From Speculation to Real Financial Markets
The phrase "the on-chain economy is no longer speculation" deserves unpacking because it is a strong claim, and the data supports it.
What speculation looks like: Tokens with no underlying asset, backed by community belief and momentum. Value derived from what someone will pay in the future, not from any current economic activity. Markets that collapse when sentiment shifts.
What real financial markets look like: Assets backed by real cash flows,earnings, and economic activity. Markets with continuous price discovery, deep liquidity, and active participants. Value derived from underlying performance, not from speculation.
Tokenized stocks are the second thing, not the first.
When you buy NVDA through bStocks, you are buying exposure to a company that designs the chips powering AI a company with $60B+ in annual revenue, institutional ownership, and earnings that move markets. The token is just the delivery mechanism. The underlying value is real.
The Q3 data confirms the shift:
$100B in RWA transfers is not speculation volume it is real capital moving between real financial instruments5% of DEX activity in RWAs means DeFi users are allocating meaningful portfolio weight to real-world assets, not just speculative tokens$38B in total RWA market cap means the category has reached scale that attracts institutional capital, not just early adopters
The on-chain economy is maturing. The speculation phase where everything was priced on future potential is giving way to a phase where assets are priced on present reality. Tokenized stocks are at the leading edge of that maturation.
🔮 What Comes Next
The $3B milestone is a floor, not a ceiling.
The structural drivers are accelerating:
Robin hood's entry validates the category and brings new usersRegulatory clarity in the US (CLARITY Act, despite its Senate setback, will eventually pass) will remove institutional barriersDeFi protocol integration deepens more yield strategies, more collateral use cases, more composability- African and emerging market adoption expands as P2P mobile money rails extend to more countries
The BNB Chain trajectory:
BNB Chain's #1 position in tokenized stock market cap and holders compounds as the category growsbStocks' fastest-growing status means its market share within the category is expanding, not just its absolute numbersThe PAR framework becomes an industry standard, and bStocks' high transfer volume positions it as the benchmark for active programmable assets
The number to watch next: When tokenized stocks cross $10B, the category will have demonstrated that the $3B milestone was a waypoint, not a peak. Based on the Q3 growth trajectory $100B in transfers, 5% DEX share, 50% year-to-date RWA growth $10B is not a prediction. It is a projection with strong supporting data.
FAQs
Q: What does the $3B tokenized stock market cap milestone mean for crypto markets?
A: The $3B milestone signals that tokenized stocks have crossed from niche experiment to real financial market infrastructure. Unlike speculative tokens, every dollar in tokenized stock market cap represents a real underlying equity Apple, NVIDIA, Tesla, or other US-listed companies held on-chain and actively traded. The supporting data makes the milestone structurally significant: on-chain RWA transfers grew from $6B in Q1 to $100B in Q3, RWAs reached 5% of DEX activity (from under 1%), and the broader RWA market hit $38B, up 50% year to date. This is a category that has moved past speculation into real financial market activity.
Q: Why is BNB Chain #1 for tokenized stock market cap and holders?
A: BNB Chain's leadership in tokenized stocks reflects Binance's multi-year infrastructure investment in bStocks a product with $21.6B in cumulative on-chain trading volume, 450,000 holders, 43 million on-chain transactions, and $8.7M AUM per active asset. BNB Chain leads both market cap (capital depth) and holders (user breadth) simultaneously a combination that indicates deep, active markets rather than either shallow institutional pools or thin retail activity. The P2P mobile money integration (MTN, Orange, M-Pesa, Airtel) extends BNB Chain's user base across Africa and emerging markets in a way that Ethereum-based tokenized stock platforms cannot replicate.
Q: What does bStocks being the most-transferred tokenized stock product mean for investors?
A: Transfer volume is the purest measure of active use it tells you whether a tokenized asset is being held passively or actively deployed. bStocks being the most-transferred product of 2026 means its holders are trading, deploying into DeFi, and using their positions as productive financial instruments rather than simply storing them. For investors, this signals deep market liquidity (active trading compresses spreads), strong DeFi integration (active deployment creates yield opportunities), and a high Programmable Asset Ratio (PAR) meaning bStocks capital is working, not dormant.
📌 Sources: Tokenized stock market cap data (September 2026); On-chain RWA transfer volume Q1-Q3 2026; DEX RWA market share data (Q3 2026); Binance bStocks on-chain metrics (2026); BNB Chain tokenized equity rankings (2026).
⚠️ Educational content only. Tokenized equities are available only to eligible users in authorized countries. Non available to US persons. Past performance does not guarantee future results. Does not constitute financial advice.
Tokenized Stocks Cross $3B: The On-Chain Economy Is No Longer Speculation
Tokenized stocks crossed $3 billion in market capitalization in the fourth week of September a milestone for an on-chain economy shifting from speculation to real financial markets. The numbers underneath tell the story: on-chain RWA transfers hit $100B in Q3 (vs. $6B in Q1), RWAs now account for 5% of DEX activity (up from under 1%), and the broader RWA market reached $38B, up 50% year to date. At the center sits BNB Chain — #1 for tokenized-stock market cap and holders, with bStocks the fastest-growing and most-transferred tokenized-stock product of 2026.
📊 The $3B Milestone What It Actually Means
Numbers in crypto get big fast. Billions get thrown around casually. So it is worth pausing on what the $3B tokenized stock market cap milestone actually represents because this one is different.
It is not speculation capital. Every dollar in tokenized stock market cap represents a real US stock Apple, NVIDIA, Tesla, Amazon that has been purchased by a real investor and represented on-chain. This is not a speculative token backed by nothing. It is equity capital that has migrated from traditional markets to blockchain rails.
It is not theoretical demand. The $3B figure reflects actual purchases, actual on-chain transfers, and actual holders who chose to access US equities through tokenized infrastructure rather than traditional brokerage. These are real investment decisions made by real people.
It is not a singleproduct. The $3B represents an ecosystem multiple platforms, multiple chains, multiple products all serving investors who want on-chain access to real-world financial assets.
But within that ecosystem, one player dominates: BNB Chain, with bStocks as the fastest-growing and most-transferred tokenized-stock product of 2026.
The milestone is not a prediction. It is a measurement. And what it measures is an on-chain economy that has moved past its speculative phase into something that looks increasingly like real financial market infrastructure.
📈 The Q3 Numbers That Tell the Deeper Story
The $3B headline is the visible number. The Q3 data underneath it tells you why this milestone is structurally significant rather than a temporary spike.
On-chain RWA transfers: $100B in Q3vs. $6B in Q1.
This is the number that should stop you. In Q1 2026, on-chain RWA transfers totaled $6 billion. By Q3, that figure had grown to $100 billion. That is not linear growth. That is a 16x increase in two quarters. When transfer volume grows at that rate, it tells you that real capital is moving — not just sitting on-chain, but actively transacting, deploying, and flowing through DeFi.
RWAs now account for 5% of DEX activity, up from under 1%.
Six months ago, RWAs were a rounding error in DEX volume. Today they represent 1 in 20 DEX transactions. That shift from under 1% to 5% is not a gradual evolution it is a step change. It means RWAs have crossed the threshold from "niche alternative" to "mainstream DeFi activity." When DeFi users execute 5% of their trades in real-world assets, you are looking at a structural integration, not an experiment.
The broader RWA market reached $38B, up 50% year to date.
The tokenized stock milestone sits within a broader context: the entire RWA market has grown 50% year to date, reaching $38 billion. That growth is not concentrated in one asset class it spans tokenized stocks, tokenized bonds, tokenized real estate, tokenized commodities, and tokenized money market funds. The diversification tells you this is not a single-product narrative. It is a category expansion.
What these three numbers tell you together:
When transfer volume grows 16x, when DEX market share quintuples, and when the entire category grows 50% year to date you are not watching a trend. You are watching a structural shift in how financial capital interacts with blockchain infrastructure. The on-chain economy is no longer a speculation market. It is becoming a real financial market.
🏆 BNB Chain for Tokenized Stock Market Cap and Holders
Within the tokenized equity category, BNB Chain holds the top position by two of the most important metrics: market cap and holders.
Why these two metrics matter:
Market cap tells you where the capital is. Holders tell you where the users are. When one chain leads on both simultaneously, it tells you that capital and participation are aligned — not split between a high-AUM chain with few active users and a high-user chain with shallow capital.
BNB Chain's position at #1 reflects years of infrastructure building, liquidity accumulation, and user onboarding that produced an ecosystem where tokenized stockshave both depth and breadth. Deep capital without broad holders produces thin markets. Broad holders without deep capital produces illiquid markets. BNB Chain has both.
The infrastructure that built this position:
Binance's bStocks product is the primary driver of BNB Chain's tokenized stock leadership. With $21.6B in cumulative on-chain trading volume, 450,000 holders, and 43 million on-chain transactions, bStocks has built the infrastructure base that makes BNB Chain the destination for tokenized equity activity.
The P2P mobile money rails connecting MTN, Orange Money, M-Pesa, and Airtel to USDT and then to tokenized stocks mean that BNB Chain's user base extends across Africa and emerging markets in a way that no other chain has replicated. When an investor in Lagos converts MTNMobile Money to USDT and buys NVDA, that transaction flows through BNB Chain infrastructure. That is a user that Ethereum-based tokenized stock platforms are not capturing.
🚀 bStocks Fastest-Growing and Most-Transferred Tokenized Stock Product of 2026
Being the fastest-growing product in the fastest-growing category is the compound growth story that matters for 2026.
What "fastest-growing" means in practice:
Growth in tokenized equities is measured by new users, new AUM, and new on-chain activity. bStocks has led all three metrics through 2026. As Robin hood entered the category, as Ondo expanded, as Backed built bStocks grew faster than all of them.
What "most-transferred" means:
Transfer volume is the purest measure of active use. A tokenized stock that sits in a wallet generating no activity contributes to market cap but not to the on-chain economy's vitality. bStocks is not sitting idle it is the most-transferred tokenized stock product of 2026, meaning its holders are actively trading, deploying into DeFi, and using their positions as productive financial instruments.
This is the difference between a store of value and an active financial instrument. bStocks is being used and the transfer data proves it.
The PAR implication:
The most-transferred status directly feeds Binance's Programmable Asset Ratio (PAR) framework. High transfer volume means bStocks holders are not just holding they are deploying. That deployment into DeFi protocols, lending markets, and liquidity pools is exactly what PAR measures. bStocks' position as the most-transferred product means its PAR is structurally higher than competitors assets are active, not dormant.
🌍 What the $3B Milestone Means for African Investors
The crossing of $3B in tokenized stock market cap is not a number that lives in isolation. It has direct implications for African investors who are using bStocks and BNB Chain infrastructure to access US equity markets.
Deeper markets mean better execution. As the tokenized stock market cap grows, more capital sits in order books, spreads tighten, and slippage decreases. An African investor buying $1,000 of NVDA through bStocks gets a better fill price when the market is at $3B than when it was at $300M because more capital absorbs the order without moving the price against them.
**More DEX activity means more DeFi opportunity.**When RWAs reach 5% of DEX activity, it means more DeFi protocols are integrating tokenized stocks as productive assets. For an investor in Kinshasa who holds bStocks, that means more options for earning yield, using positions as collateral, and deploying capital productively not just holding.
The P2P bridge is the structural advantage. As the tokenized stock market grows globally, Binance's P2P infrastructure connecting African mobile money to USDT to bStocks remains the most direct path from local fiat to global equity exposure. That path does not exist on Ethereum-based tokenized stock platforms. It does not exist on Robin hood. It exists on Binance because Binance built the P2P rails first, years ago, when nobody was watching.
**The $100B in Q3 RWA transfers includes African users.**Every MTN Mobile Money conversion to USDT to bStocks transaction contributes to that $100B. African investors are not passive observers of the RWA market's growth they are participants in it, and the infrastructure that enables their participation is BNB Chain and bStocks.
🔗 The Shift From Speculation to Real Financial Markets
The phrase "the on-chain economy is no longer speculation" deserves unpacking because it is a strong claim, and the data supports it.
What speculation looks like: Tokens with no underlying asset, backed by community belief and momentum. Value derived from what someone will pay in the future, not from any current economic activity. Markets that collapse when sentiment shifts.
What real financial markets look like: Assets backed by real cash flows,earnings, and economic activity. Markets with continuous price discovery, deep liquidity, and active participants. Value derived from underlying performance, not from speculation.
Tokenized stocks are the second thing, not the first.
When you buy NVDA through bStocks, you are buying exposure to a company that designs the chips powering AI a company with $60B+ in annual revenue, institutional ownership, and earnings that move markets. The token is just the delivery mechanism. The underlying value is real.
The Q3 data confirms the shift:
$100B in RWA transfers is not speculation volume it is real capital moving between real financial instruments5% of DEX activity in RWAs means DeFi users are allocating meaningful portfolio weight to real-world assets, not just speculative tokens$38B in total RWA market cap means the category has reached scale that attracts institutional capital, not just early adopters
The on-chain economy is maturing. The speculation phase where everything was priced on future potential is giving way to a phase where assets are priced on present reality. Tokenized stocks are at the leading edge of that maturation.
🔮 What Comes Next
The $3B milestone is a floor, not a ceiling.
The structural drivers are accelerating:
Robin hood's entry validates the category and brings new usersRegulatory clarity in the US (CLARITY Act, despite its Senate setback, will eventually pass) will remove institutional barriersDeFi protocol integration deepens more yield strategies, more collateral use cases, more composability- African and emerging market adoption expands as P2P mobile money rails extend to more countries
The BNB Chain trajectory:
BNB Chain's #1 position in tokenized stock market cap and holders compounds as the category growsbStocks' fastest-growing status means its market share within the category is expanding, not just its absolute numbersThe PAR framework becomes an industry standard, and bStocks' high transfer volume positions it as the benchmark for active programmable assets
The number to watch next: When tokenized stocks cross $10B, the category will have demonstrated that the $3B milestone was a waypoint, not a peak. Based on the Q3 growth trajectory $100B in transfers, 5% DEX share, 50% year-to-date RWA growth $10B is not a prediction. It is a projection with strong supporting data.
FAQs
Q: What does the $3B tokenized stock market cap milestone mean for crypto markets?
A: The $3B milestone signals that tokenized stocks have crossed from niche experiment to real financial market infrastructure. Unlike speculative tokens, every dollar in tokenized stock market cap represents a real underlying equity Apple, NVIDIA, Tesla, or other US-listed companies held on-chain and actively traded. The supporting data makes the milestone structurally significant: on-chain RWA transfers grew from $6B in Q1 to $100B in Q3, RWAs reached 5% of DEX activity (from under 1%), and the broader RWA market hit $38B, up 50% year to date. This is a category that has moved past speculation into real financial market activity.
Q: Why is BNB Chain #1 for tokenized stock market cap and holders?
A: BNB Chain's leadership in tokenized stocks reflects Binance's multi-year infrastructure investment in bStocks a product with $21.6B in cumulative on-chain trading volume, 450,000 holders, 43 million on-chain transactions, and $8.7M AUM per active asset. BNB Chain leads both market cap (capital depth) and holders (user breadth) simultaneously a combination that indicates deep, active markets rather than either shallow institutional pools or thin retail activity. The P2P mobile money integration (MTN, Orange, M-Pesa, Airtel) extends BNB Chain's user base across Africa and emerging markets in a way that Ethereum-based tokenized stock platforms cannot replicate.
Q: What does bStocks being the most-transferred tokenized stock product mean for investors?
A: Transfer volume is the purest measure of active use it tells you whether a tokenized asset is being held passively or actively deployed. bStocks being the most-transferred product of 2026 means its holders are trading, deploying into DeFi, and using their positions as productive financial instruments rather than simply storing them. For investors, this signals deep market liquidity (active trading compresses spreads), strong DeFi integration (active deployment creates yield opportunities), and a high Programmable Asset Ratio (PAR) meaning bStocks capital is working, not dormant.
📌 Sources: Tokenized stock market cap data (September 2026); On-chain RWA transfer volume Q1-Q3 2026; DEX RWA market share data (Q3 2026); Binance bStocks on-chain metrics (2026); BNB Chain tokenized equity rankings (2026).
⚠️ Educational content only. Tokenized equities are available only to eligible users in authorized countries. Non available to US persons. Past performance does not guarantee future results. Does not constitute financial advice.
📊 The $3B Milestone What It Actually Means
Numbers in crypto get big fast. Billions get thrown around casually. So it is worth pausing on what the $3B tokenized stock market cap milestone actually represents because this one is different.
It is not speculation capital. Every dollar in tokenized stock market cap represents a real US stock Apple, NVIDIA, Tesla, Amazon that has been purchased by a real investor and represented on-chain. This is not a speculative token backed by nothing. It is equity capital that has migrated from traditional markets to blockchain rails.
It is not theoretical demand. The $3B figure reflects actual purchases, actual on-chain transfers, and actual holders who chose to access US equities through tokenized infrastructure rather than traditional brokerage. These are real investment decisions made by real people.
It is not a singleproduct. The $3B represents an ecosystem multiple platforms, multiple chains, multiple products all serving investors who want on-chain access to real-world financial assets.
But within that ecosystem, one player dominates: BNB Chain, with bStocks as the fastest-growing and most-transferred tokenized-stock product of 2026.
The milestone is not a prediction. It is a measurement. And what it measures is an on-chain economy that has moved past its speculative phase into something that looks increasingly like real financial market infrastructure.
📈 The Q3 Numbers That Tell the Deeper Story
The $3B headline is the visible number. The Q3 data underneath it tells you why this milestone is structurally significant rather than a temporary spike.
On-chain RWA transfers: $100B in Q3vs. $6B in Q1.
This is the number that should stop you. In Q1 2026, on-chain RWA transfers totaled $6 billion. By Q3, that figure had grown to $100 billion. That is not linear growth. That is a 16x increase in two quarters. When transfer volume grows at that rate, it tells you that real capital is moving — not just sitting on-chain, but actively transacting, deploying, and flowing through DeFi.
RWAs now account for 5% of DEX activity, up from under 1%.
Six months ago, RWAs were a rounding error in DEX volume. Today they represent 1 in 20 DEX transactions. That shift from under 1% to 5% is not a gradual evolution it is a step change. It means RWAs have crossed the threshold from "niche alternative" to "mainstream DeFi activity." When DeFi users execute 5% of their trades in real-world assets, you are looking at a structural integration, not an experiment.
The broader RWA market reached $38B, up 50% year to date.
The tokenized stock milestone sits within a broader context: the entire RWA market has grown 50% year to date, reaching $38 billion. That growth is not concentrated in one asset class it spans tokenized stocks, tokenized bonds, tokenized real estate, tokenized commodities, and tokenized money market funds. The diversification tells you this is not a single-product narrative. It is a category expansion.
What these three numbers tell you together:
When transfer volume grows 16x, when DEX market share quintuples, and when the entire category grows 50% year to date you are not watching a trend. You are watching a structural shift in how financial capital interacts with blockchain infrastructure. The on-chain economy is no longer a speculation market. It is becoming a real financial market.
🏆 BNB Chain for Tokenized Stock Market Cap and Holders
Within the tokenized equity category, BNB Chain holds the top position by two of the most important metrics: market cap and holders.
Why these two metrics matter:
Market cap tells you where the capital is. Holders tell you where the users are. When one chain leads on both simultaneously, it tells you that capital and participation are aligned — not split between a high-AUM chain with few active users and a high-user chain with shallow capital.
BNB Chain's position at #1 reflects years of infrastructure building, liquidity accumulation, and user onboarding that produced an ecosystem where tokenized stockshave both depth and breadth. Deep capital without broad holders produces thin markets. Broad holders without deep capital produces illiquid markets. BNB Chain has both.
The infrastructure that built this position:
Binance's bStocks product is the primary driver of BNB Chain's tokenized stock leadership. With $21.6B in cumulative on-chain trading volume, 450,000 holders, and 43 million on-chain transactions, bStocks has built the infrastructure base that makes BNB Chain the destination for tokenized equity activity.
The P2P mobile money rails connecting MTN, Orange Money, M-Pesa, and Airtel to USDT and then to tokenized stocks mean that BNB Chain's user base extends across Africa and emerging markets in a way that no other chain has replicated. When an investor in Lagos converts MTNMobile Money to USDT and buys NVDA, that transaction flows through BNB Chain infrastructure. That is a user that Ethereum-based tokenized stock platforms are not capturing.
🚀 bStocks Fastest-Growing and Most-Transferred Tokenized Stock Product of 2026
Being the fastest-growing product in the fastest-growing category is the compound growth story that matters for 2026.
What "fastest-growing" means in practice:
Growth in tokenized equities is measured by new users, new AUM, and new on-chain activity. bStocks has led all three metrics through 2026. As Robin hood entered the category, as Ondo expanded, as Backed built bStocks grew faster than all of them.
What "most-transferred" means:
Transfer volume is the purest measure of active use. A tokenized stock that sits in a wallet generating no activity contributes to market cap but not to the on-chain economy's vitality. bStocks is not sitting idle it is the most-transferred tokenized stock product of 2026, meaning its holders are actively trading, deploying into DeFi, and using their positions as productive financial instruments.
This is the difference between a store of value and an active financial instrument. bStocks is being used and the transfer data proves it.
The PAR implication:
The most-transferred status directly feeds Binance's Programmable Asset Ratio (PAR) framework. High transfer volume means bStocks holders are not just holding they are deploying. That deployment into DeFi protocols, lending markets, and liquidity pools is exactly what PAR measures. bStocks' position as the most-transferred product means its PAR is structurally higher than competitors assets are active, not dormant.
🌍 What the $3B Milestone Means for African Investors
The crossing of $3B in tokenized stock market cap is not a number that lives in isolation. It has direct implications for African investors who are using bStocks and BNB Chain infrastructure to access US equity markets.
Deeper markets mean better execution. As the tokenized stock market cap grows, more capital sits in order books, spreads tighten, and slippage decreases. An African investor buying $1,000 of NVDA through bStocks gets a better fill price when the market is at $3B than when it was at $300M because more capital absorbs the order without moving the price against them.
**More DEX activity means more DeFi opportunity.**When RWAs reach 5% of DEX activity, it means more DeFi protocols are integrating tokenized stocks as productive assets. For an investor in Kinshasa who holds bStocks, that means more options for earning yield, using positions as collateral, and deploying capital productively not just holding.
The P2P bridge is the structural advantage. As the tokenized stock market grows globally, Binance's P2P infrastructure connecting African mobile money to USDT to bStocks remains the most direct path from local fiat to global equity exposure. That path does not exist on Ethereum-based tokenized stock platforms. It does not exist on Robin hood. It exists on Binance because Binance built the P2P rails first, years ago, when nobody was watching.
**The $100B in Q3 RWA transfers includes African users.**Every MTN Mobile Money conversion to USDT to bStocks transaction contributes to that $100B. African investors are not passive observers of the RWA market's growth they are participants in it, and the infrastructure that enables their participation is BNB Chain and bStocks.
🔗 The Shift From Speculation to Real Financial Markets
The phrase "the on-chain economy is no longer speculation" deserves unpacking because it is a strong claim, and the data supports it.
What speculation looks like: Tokens with no underlying asset, backed by community belief and momentum. Value derived from what someone will pay in the future, not from any current economic activity. Markets that collapse when sentiment shifts.
What real financial markets look like: Assets backed by real cash flows,earnings, and economic activity. Markets with continuous price discovery, deep liquidity, and active participants. Value derived from underlying performance, not from speculation.
Tokenized stocks are the second thing, not the first.
When you buy NVDA through bStocks, you are buying exposure to a company that designs the chips powering AI a company with $60B+ in annual revenue, institutional ownership, and earnings that move markets. The token is just the delivery mechanism. The underlying value is real.
The Q3 data confirms the shift:
$100B in RWA transfers is not speculation volume it is real capital moving between real financial instruments5% of DEX activity in RWAs means DeFi users are allocating meaningful portfolio weight to real-world assets, not just speculative tokens$38B in total RWA market cap means the category has reached scale that attracts institutional capital, not just early adopters
The on-chain economy is maturing. The speculation phase where everything was priced on future potential is giving way to a phase where assets are priced on present reality. Tokenized stocks are at the leading edge of that maturation.
🔮 What Comes Next
The $3B milestone is a floor, not a ceiling.
The structural drivers are accelerating:
Robin hood's entry validates the category and brings new usersRegulatory clarity in the US (CLARITY Act, despite its Senate setback, will eventually pass) will remove institutional barriersDeFi protocol integration deepens more yield strategies, more collateral use cases, more composability- African and emerging market adoption expands as P2P mobile money rails extend to more countries
The BNB Chain trajectory:
BNB Chain's #1 position in tokenized stock market cap and holders compounds as the category growsbStocks' fastest-growing status means its market share within the category is expanding, not just its absolute numbersThe PAR framework becomes an industry standard, and bStocks' high transfer volume positions it as the benchmark for active programmable assets
The number to watch next: When tokenized stocks cross $10B, the category will have demonstrated that the $3B milestone was a waypoint, not a peak. Based on the Q3 growth trajectory $100B in transfers, 5% DEX share, 50% year-to-date RWA growth $10B is not a prediction. It is a projection with strong supporting data.
FAQs
Q: What does the $3B tokenized stock market cap milestone mean for crypto markets?
A: The $3B milestone signals that tokenized stocks have crossed from niche experiment to real financial market infrastructure. Unlike speculative tokens, every dollar in tokenized stock market cap represents a real underlying equity Apple, NVIDIA, Tesla, or other US-listed companies held on-chain and actively traded. The supporting data makes the milestone structurally significant: on-chain RWA transfers grew from $6B in Q1 to $100B in Q3, RWAs reached 5% of DEX activity (from under 1%), and the broader RWA market hit $38B, up 50% year to date. This is a category that has moved past speculation into real financial market activity.
Q: Why is BNB Chain #1 for tokenized stock market cap and holders?
A: BNB Chain's leadership in tokenized stocks reflects Binance's multi-year infrastructure investment in bStocks a product with $21.6B in cumulative on-chain trading volume, 450,000 holders, 43 million on-chain transactions, and $8.7M AUM per active asset. BNB Chain leads both market cap (capital depth) and holders (user breadth) simultaneously a combination that indicates deep, active markets rather than either shallow institutional pools or thin retail activity. The P2P mobile money integration (MTN, Orange, M-Pesa, Airtel) extends BNB Chain's user base across Africa and emerging markets in a way that Ethereum-based tokenized stock platforms cannot replicate.
Q: What does bStocks being the most-transferred tokenized stock product mean for investors?
A: Transfer volume is the purest measure of active use it tells you whether a tokenized asset is being held passively or actively deployed. bStocks being the most-transferred product of 2026 means its holders are trading, deploying into DeFi, and using their positions as productive financial instruments rather than simply storing them. For investors, this signals deep market liquidity (active trading compresses spreads), strong DeFi integration (active deployment creates yield opportunities), and a high Programmable Asset Ratio (PAR) meaning bStocks capital is working, not dormant.
📌 Sources: Tokenized stock market cap data (September 2026); On-chain RWA transfer volume Q1-Q3 2026; DEX RWA market share data (Q3 2026); Binance bStocks on-chain metrics (2026); BNB Chain tokenized equity rankings (2026).
⚠️ Educational content only. Tokenized equities are available only to eligible users in authorized countries. Non available to US persons. Past performance does not guarantee future results. Does not constitute financial advice.
1
113
·
--
Стаття
Переглянути переклад
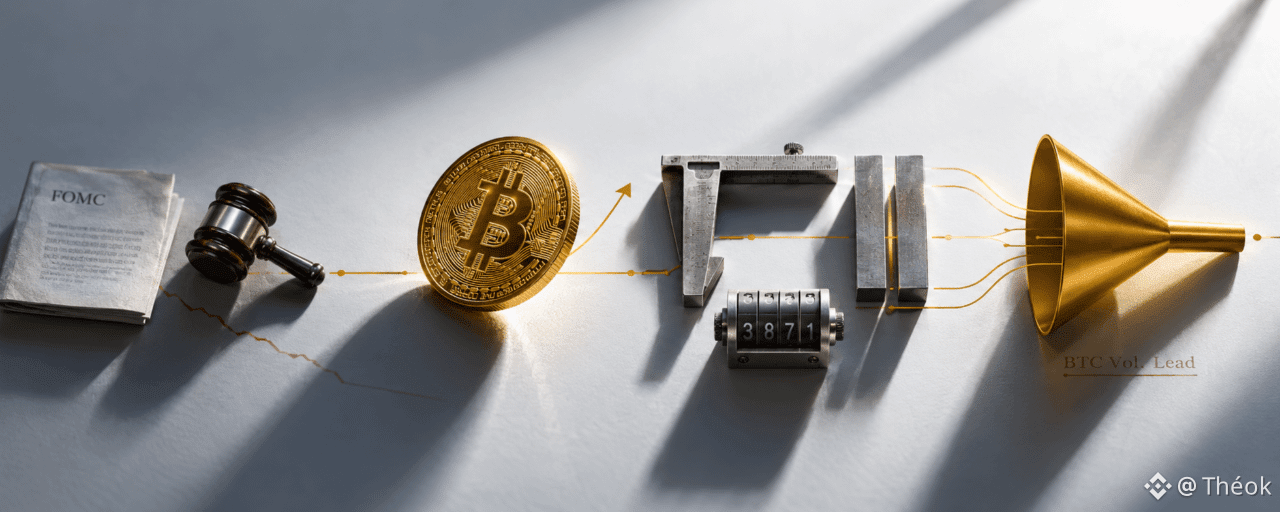
Bitcoin's Strongest September Since 2012: Why Traders Turned to Binance When It MatteredSeptember is historically Bitcoin's weakest month, yet BTC is on track for its strongest September since 2012 holding momentum through a Fed rate hike and the CLARITY Act setback in the US Senate. During the month's key moves, traders concentrated their activity on the market's deepest venue: Binance leads in BTC trading volume and liquidity. Deep order books, tight bid-ask spreads, and low slippage are exactly what traders lean on when volatility spikes and this September proved it. The story isn't just the rally; it's that when Bitcoin moved, traders came to Binance.
📅 September Was Supposed to Be Bad It Wasn't
Every cryptotrader knows the meme: "Rektember." September has historically been Bitcoin's worst performing month. The data going back to 2013 consistently shows negative average returns in September making it the one month most traders quietly dread.
This September broke the pattern and broke it hard.
BTC entered the month with momentum and held it through two macro events that would have crushed a weaker market: a Federal Reserve rate decision and a major legislative setback in the US Senate. The CLARITY Act one of the most anticipated pieces of crypto legislation in years hit a wall in the Senate, generating headlines and uncertainty. The Fed moved rates in a direction that typically pressures risk assets. And yet Bitcoin held. And then it moved higher.
For the first time since 2012, Bitcoin is on track for a genuinely strong September not "less bad than expected," but actually strong, with positive returns and sustained momentum through the month's most challenging moments.
Why did this happen? And why did it happen on Binance?
⚡ The Two Macro Tests That Bitcoin Passed
Test 1 The Fed Rate Decision
The Federal Reserve's rate decisions are among the most market-moving events in global finance. In prior cycles, Bitcoin moved sharply lower when the Fed tightened risk assets sell off, liquidity tightens, and speculative positions get unwound.
This September, Bitcoin absorbed the Fed move without breaking structure. The initial sell reaction was shallow. Recovery was fast. Traders who had positioned for a breakdown found themselves covering, not adding.The resilience was notable not just in price but in order book behavior. During and after the announcement, Binance's BTC order books showed depth that absorbed the volatility without major spread widening. Bid-ask spreads remained tight even as volume spiked a sign of a mature, liquid market, not a fragile one.
Test 2 The CLARITY Act Setback
The CLARITY Act represented a serious attempt to provide regulatory clarity for digital assets in the United States defining which assets are securities, which are commodities, and how exchanges should be regulated. When the bill hit resistance in the Senate, the initial market reaction was negative: uncertainty is never good for asset prices.
But Bitcoin's response was measured. The setback caused a brief pullback, not a structural break.Within hours, price was recovering. Within days, the month's trajectory was intact.
What both tests proved: Bitcoin in 2026 is a different asset than Bitcoin in 2018 or 2020. Institutional participation, deeper liquidity, and a more mature trading base mean that macro shocks which would have caused 20-30% drawdowns in prior cycles are now absorbed in single-digit percentage moves. The market has grown up.
🏦 Why Traders Came to Binance When It Mattered
The month's price action told one story. The trading flow told another and both stories point to Binance.
Binance leads in BTC trading volume. Not by a small margin. By a structural gap that reflects years of liquidity accumulation. When traders want to buy or sell significant size in Bitcoin not $500, but $50,000 or$5 million they go where the depth is. That is Binance.
Three structural reasons explain the concentration:
1. Deep order books the foundation of everything
An order book's depth determines how much capital can trade without moving the price. A shallow order book means a $100,000 BTC order can move the price by 0.5% or more against the trader. A deep order book absorbs that same order with minimal impact.
Binance's BTC/USDT order book is consistently among the deepest in the market with significant capital stacked on both sides of the bid-ask spread. During this September's volatility spikes, that depth was exactly what traders needed. When Bitcoin moved, traders could execute at scale without the order book working against them.
2. Tight bid-ask spreads the hidden cost of tradingThe bid-ask spread is the invisible tax on every trade. If you buy BTC at $65,000 and the spread is 0.05%, you have already lost $32.50 before the market moves a single tick. On platforms with wider spreads, that cost compounds across every trade, every day.
Binance maintains some of the tightest BTC bid-ask spreads in the market consistently 0.01% or better during normal conditions. During September's volatility events, those spreads widened temporarily as they do on every platform but recovered faster on Binance than on competitors. The tighter the spread, the faster the recovery, and the lower the cost of trading through a volatile event.
3. Low slippage what actually matters for large orders
Slippage is the difference between the price you expect to execute at and the price you actually execute at.For small orders, slippage is negligible. For large orders institutional size, whale size slippage is the single most important execution metric.
A trader wanting to buy $1 million of BTC needs a market that can absorb that order without the price running away from them. On thin markets, that $1 million order can cause significant slippage meaning the average fill price is meaningfully worse than the price at order entry.
On Binance, the combination of deep order books and high trading volume means large orders experience minimal slippage. During September's key price moves — when everyone was either buying the breakout or selling the dip that low-slippage execution was the difference between a good trade and a costly one.
📊 The Volume Story What the Data Shows
WhenBitcoin's strongest September since 2012 played out, the trading volume concentration told a clear story.
Binance's BTC trading volume lead reflects a pattern that accelerates during volatile periods. This is counterintuitive to some you might expect volume to spread across exchanges during big moves. The opposite happens. During high-volatility events, traders concentrate on the deepest venue because execution quality degrades everywhere else first.
Think of it like this: during calm conditions, a trader might execute on a smaller exchange and accept slightly worse fills because the price difference is manageable. During a sharp Bitcoin move up or down every basis point of execution quality matters. Slippage compounds. Spreads widen on thin books. Price impact on smaller venues can be severe.
The rational response is to go where the depth is. This September, that meant Binance.
The self-reinforcing dynamic: Volume attracts volume. When Binance has the most volume, it also has the tightest spreads (because market makers compete harder for flow). Tighter spreads attract more traders. More traders generate more volume. The cycle accelerates — and the gap between Binance and the next largest venue widens, not narrows, during volatile periods.
🌍 What This September Means for African Traders
For traders in Africa in Congo, Nigeria, Kenya, South Africa, and across the continent Bitcoin's September performance has specific implications.
The macro resilience matters. A Bitcoin that absorbs Fed rate decisions and legislative setbacks without structural breakdown is aBitcoin that is increasingly behaving like a global macro asset not a purely speculative play. That changes the risk profile for long-term holders in high-inflation economies where BTC is held as a savings instrument.
Execution quality matters more in smaller accounts. An institutional trader with $100 million can tolerate 0.1% slippage it is a rounding error. A trader in Lagos with $5,000 cannot. Binance's tight spreads and low slippage matter proportionally more for smaller account sizes which describes most retail traders in Africa.
The P2P connection to the market. African traders using Binance P2P to convert MTN Mobile Money or Orange Money to USDT are directly connected to the same liquidity pool that institutional traders access. When Bitcoin moved in September, those traders had access to the same deep order books, the same tight spreads, and the same low-slippage execution as traders at major hedge funds.
That is not a small thing. It is the democratization of execution quality.
🔮 What Comes Next After Bitcoin's Strongest September
The pattern that produced Bitcoin's strongest September since 2012 does not disappear when the calendar flips to October.
The structural factors are still in place:
Institutional adoption continues each macro test that Bitcoin passes strengthens the case for institutional allocationETF flows remain positive demand from spot Bitcoin ETFs provides a consistent bid that was not present in prior cyclesThe halving cycle Bitcoin is in the historically strong post-halving period, where reduced supply meets growing demandRegulatory clarity is coming the CLARITY Act setback is a delay, not a defeat. Regulatory frameworks are forming across the US, EU, and major markets
What to watch for October:
Whether BTC sustains above key technical levels established in SeptemberFed communication the next FOMC meeting and any shifts in forward guidanceCLARITY Act progress any Senate movement will be a significant catalystSpot ETF inflows continued positive flows are structurally bullish
For traders watching the October setup on Binance:
The same infrastructure that handled September's volatility is in place for October. Deep order books, tight spreads, low slippage the execution quality that makes Binance the venue of choice when Bitcoin moves has not changed. If October delivers another macro test, the concentration of trading flow on Binance will repeat the September pattern.
FAQs
Q: Why is September historically bad for Bitcoin and why was 2026 different? A: September has historically averaged negative returns for Bitcoin driven by end-of-quarter portfolio rebalancing, reduced summer liquidity, and tax-related selling. In 2026, several structural factors overrode the seasonal pattern: strong institutional demand via spot ETFs, a post-halving supply dynamic, and a Bitcoin that has matured enough to absorb macro shocks (Fed rate decision, CLARITY Act setback) without structural breakdown. The result was Bitcoin's strongest September since 2012 not just positive returns, but sustained momentum through the month's most challenging macro events.Q: Why does trading volume concentrate on Binance during volatile Bitcoin periods? A: During high-volatility events, execution quality degrades faster on thinner markets spreads widen, slippage increases, and large orders move prices adversely. Rational traders migrate to the deepest venue to protect execution quality. Binance's structural advantages the deepest BTC order books, consistently tight bid-ask spreads (0.01% or better in normal conditions), and the lowest slippage for large orders — make it the natural concentration point during volatile periods. The September data confirmed this pattern: as Bitcoin made its key moves through the Fed decision and CLARITY Act setback, trading flow concentrated on Binance.
Q: What does Bitcoin's September performance mean for African traders specifically? A: Bitcoin's ability to absorb major macro shocks a Fed rate hike and a major legislative setback without structural breakdown signals increasing maturity as a global asset. For African traders who hold BTC as a savings instrument in high-inflation economies, this resilience is significant: it suggests BTC is increasingly behaving like a macro hedge, not just a speculative asset. Additionally, Binance's tight spreads and low slippage matter proportionally more for smaller account sizes which describes most African retail traders. Through Binance P2P (MTN, Orange Money, M-Pesa), African traders access the same deep liquidity pool as institutional participants, on the same platform that led BTC trading volume through September's key moves.
📌 Sources: Binance BTC/USDTtrading volume and order book data (September 2026); Federal Reserve rate decision communications (September 2026); CLARITY Act Senate proceedings (September 2026); Bitcoin historical monthly return data.
⚠️ Educational content only. Past performance does not guarantee future results. Bitcoin and cryptocurrency trading involves significant risk. Does not constitute financial advice.
Bitcoin's Strongest September Since 2012: Why Traders Turned to Binance When It Mattered
September is historically Bitcoin's weakest month, yet BTC is on track for its strongest September since 2012 holding momentum through a Fed rate hike and the CLARITY Act setback in the US Senate. During the month's key moves, traders concentrated their activity on the market's deepest venue: Binance leads in BTC trading volume and liquidity. Deep order books, tight bid-ask spreads, and low slippage are exactly what traders lean on when volatility spikes and this September proved it. The story isn't just the rally; it's that when Bitcoin moved, traders came to Binance.
📅 September Was Supposed to Be Bad It Wasn't
Every cryptotrader knows the meme: "Rektember." September has historically been Bitcoin's worst performing month. The data going back to 2013 consistently shows negative average returns in September making it the one month most traders quietly dread.
This September broke the pattern and broke it hard.
BTC entered the month with momentum and held it through two macro events that would have crushed a weaker market: a Federal Reserve rate decision and a major legislative setback in the US Senate. The CLARITY Act one of the most anticipated pieces of crypto legislation in years hit a wall in the Senate, generating headlines and uncertainty. The Fed moved rates in a direction that typically pressures risk assets. And yet Bitcoin held. And then it moved higher.
For the first time since 2012, Bitcoin is on track for a genuinely strong September not "less bad than expected," but actually strong, with positive returns and sustained momentum through the month's most challenging moments.
Why did this happen? And why did it happen on Binance?
⚡ The Two Macro Tests That Bitcoin Passed
Test 1 The Fed Rate Decision
The Federal Reserve's rate decisions are among the most market-moving events in global finance. In prior cycles, Bitcoin moved sharply lower when the Fed tightened risk assets sell off, liquidity tightens, and speculative positions get unwound.
This September, Bitcoin absorbed the Fed move without breaking structure. The initial sell reaction was shallow. Recovery was fast. Traders who had positioned for a breakdown found themselves covering, not adding.The resilience was notable not just in price but in order book behavior. During and after the announcement, Binance's BTC order books showed depth that absorbed the volatility without major spread widening. Bid-ask spreads remained tight even as volume spiked a sign of a mature, liquid market, not a fragile one.
Test 2 The CLARITY Act Setback
The CLARITY Act represented a serious attempt to provide regulatory clarity for digital assets in the United States defining which assets are securities, which are commodities, and how exchanges should be regulated. When the bill hit resistance in the Senate, the initial market reaction was negative: uncertainty is never good for asset prices.
But Bitcoin's response was measured. The setback caused a brief pullback, not a structural break.Within hours, price was recovering. Within days, the month's trajectory was intact.
What both tests proved: Bitcoin in 2026 is a different asset than Bitcoin in 2018 or 2020. Institutional participation, deeper liquidity, and a more mature trading base mean that macro shocks which would have caused 20-30% drawdowns in prior cycles are now absorbed in single-digit percentage moves. The market has grown up.
🏦 Why Traders Came to Binance When It Mattered
The month's price action told one story. The trading flow told another and both stories point to Binance.
Binance leads in BTC trading volume. Not by a small margin. By a structural gap that reflects years of liquidity accumulation. When traders want to buy or sell significant size in Bitcoin not $500, but $50,000 or$5 million they go where the depth is. That is Binance.
Three structural reasons explain the concentration:
1. Deep order books the foundation of everything
An order book's depth determines how much capital can trade without moving the price. A shallow order book means a $100,000 BTC order can move the price by 0.5% or more against the trader. A deep order book absorbs that same order with minimal impact.
Binance's BTC/USDT order book is consistently among the deepest in the market with significant capital stacked on both sides of the bid-ask spread. During this September's volatility spikes, that depth was exactly what traders needed. When Bitcoin moved, traders could execute at scale without the order book working against them.
2. Tight bid-ask spreads the hidden cost of tradingThe bid-ask spread is the invisible tax on every trade. If you buy BTC at $65,000 and the spread is 0.05%, you have already lost $32.50 before the market moves a single tick. On platforms with wider spreads, that cost compounds across every trade, every day.
Binance maintains some of the tightest BTC bid-ask spreads in the market consistently 0.01% or better during normal conditions. During September's volatility events, those spreads widened temporarily as they do on every platform but recovered faster on Binance than on competitors. The tighter the spread, the faster the recovery, and the lower the cost of trading through a volatile event.
3. Low slippage what actually matters for large orders
Slippage is the difference between the price you expect to execute at and the price you actually execute at.For small orders, slippage is negligible. For large orders institutional size, whale size slippage is the single most important execution metric.
A trader wanting to buy $1 million of BTC needs a market that can absorb that order without the price running away from them. On thin markets, that $1 million order can cause significant slippage meaning the average fill price is meaningfully worse than the price at order entry.
On Binance, the combination of deep order books and high trading volume means large orders experience minimal slippage. During September's key price moves — when everyone was either buying the breakout or selling the dip that low-slippage execution was the difference between a good trade and a costly one.
📊 The Volume Story What the Data Shows
WhenBitcoin's strongest September since 2012 played out, the trading volume concentration told a clear story.
Binance's BTC trading volume lead reflects a pattern that accelerates during volatile periods. This is counterintuitive to some you might expect volume to spread across exchanges during big moves. The opposite happens. During high-volatility events, traders concentrate on the deepest venue because execution quality degrades everywhere else first.
Think of it like this: during calm conditions, a trader might execute on a smaller exchange and accept slightly worse fills because the price difference is manageable. During a sharp Bitcoin move up or down every basis point of execution quality matters. Slippage compounds. Spreads widen on thin books. Price impact on smaller venues can be severe.
The rational response is to go where the depth is. This September, that meant Binance.
The self-reinforcing dynamic: Volume attracts volume. When Binance has the most volume, it also has the tightest spreads (because market makers compete harder for flow). Tighter spreads attract more traders. More traders generate more volume. The cycle accelerates — and the gap between Binance and the next largest venue widens, not narrows, during volatile periods.
🌍 What This September Means for African Traders
For traders in Africa in Congo, Nigeria, Kenya, South Africa, and across the continent Bitcoin's September performance has specific implications.
The macro resilience matters. A Bitcoin that absorbs Fed rate decisions and legislative setbacks without structural breakdown is aBitcoin that is increasingly behaving like a global macro asset not a purely speculative play. That changes the risk profile for long-term holders in high-inflation economies where BTC is held as a savings instrument.
Execution quality matters more in smaller accounts. An institutional trader with $100 million can tolerate 0.1% slippage it is a rounding error. A trader in Lagos with $5,000 cannot. Binance's tight spreads and low slippage matter proportionally more for smaller account sizes which describes most retail traders in Africa.
The P2P connection to the market. African traders using Binance P2P to convert MTN Mobile Money or Orange Money to USDT are directly connected to the same liquidity pool that institutional traders access. When Bitcoin moved in September, those traders had access to the same deep order books, the same tight spreads, and the same low-slippage execution as traders at major hedge funds.
That is not a small thing. It is the democratization of execution quality.
🔮 What Comes Next After Bitcoin's Strongest September
The pattern that produced Bitcoin's strongest September since 2012 does not disappear when the calendar flips to October.
The structural factors are still in place:
Institutional adoption continues each macro test that Bitcoin passes strengthens the case for institutional allocationETF flows remain positive demand from spot Bitcoin ETFs provides a consistent bid that was not present in prior cyclesThe halving cycle Bitcoin is in the historically strong post-halving period, where reduced supply meets growing demandRegulatory clarity is coming the CLARITY Act setback is a delay, not a defeat. Regulatory frameworks are forming across the US, EU, and major markets
What to watch for October:
Whether BTC sustains above key technical levels established in SeptemberFed communication the next FOMC meeting and any shifts in forward guidanceCLARITY Act progress any Senate movement will be a significant catalystSpot ETF inflows continued positive flows are structurally bullish
For traders watching the October setup on Binance:
The same infrastructure that handled September's volatility is in place for October. Deep order books, tight spreads, low slippage the execution quality that makes Binance the venue of choice when Bitcoin moves has not changed. If October delivers another macro test, the concentration of trading flow on Binance will repeat the September pattern.
FAQs
Q: Why is September historically bad for Bitcoin and why was 2026 different? A: September has historically averaged negative returns for Bitcoin driven by end-of-quarter portfolio rebalancing, reduced summer liquidity, and tax-related selling. In 2026, several structural factors overrode the seasonal pattern: strong institutional demand via spot ETFs, a post-halving supply dynamic, and a Bitcoin that has matured enough to absorb macro shocks (Fed rate decision, CLARITY Act setback) without structural breakdown. The result was Bitcoin's strongest September since 2012 not just positive returns, but sustained momentum through the month's most challenging macro events.Q: Why does trading volume concentrate on Binance during volatile Bitcoin periods? A: During high-volatility events, execution quality degrades faster on thinner markets spreads widen, slippage increases, and large orders move prices adversely. Rational traders migrate to the deepest venue to protect execution quality. Binance's structural advantages the deepest BTC order books, consistently tight bid-ask spreads (0.01% or better in normal conditions), and the lowest slippage for large orders — make it the natural concentration point during volatile periods. The September data confirmed this pattern: as Bitcoin made its key moves through the Fed decision and CLARITY Act setback, trading flow concentrated on Binance.
Q: What does Bitcoin's September performance mean for African traders specifically? A: Bitcoin's ability to absorb major macro shocks a Fed rate hike and a major legislative setback without structural breakdown signals increasing maturity as a global asset. For African traders who hold BTC as a savings instrument in high-inflation economies, this resilience is significant: it suggests BTC is increasingly behaving like a macro hedge, not just a speculative asset. Additionally, Binance's tight spreads and low slippage matter proportionally more for smaller account sizes which describes most African retail traders. Through Binance P2P (MTN, Orange Money, M-Pesa), African traders access the same deep liquidity pool as institutional participants, on the same platform that led BTC trading volume through September's key moves.
📌 Sources: Binance BTC/USDTtrading volume and order book data (September 2026); Federal Reserve rate decision communications (September 2026); CLARITY Act Senate proceedings (September 2026); Bitcoin historical monthly return data.
⚠️ Educational content only. Past performance does not guarantee future results. Bitcoin and cryptocurrency trading involves significant risk. Does not constitute financial advice.
📅 September Was Supposed to Be Bad It Wasn't
Every cryptotrader knows the meme: "Rektember." September has historically been Bitcoin's worst performing month. The data going back to 2013 consistently shows negative average returns in September making it the one month most traders quietly dread.
This September broke the pattern and broke it hard.
BTC entered the month with momentum and held it through two macro events that would have crushed a weaker market: a Federal Reserve rate decision and a major legislative setback in the US Senate. The CLARITY Act one of the most anticipated pieces of crypto legislation in years hit a wall in the Senate, generating headlines and uncertainty. The Fed moved rates in a direction that typically pressures risk assets. And yet Bitcoin held. And then it moved higher.
For the first time since 2012, Bitcoin is on track for a genuinely strong September not "less bad than expected," but actually strong, with positive returns and sustained momentum through the month's most challenging moments.
Why did this happen? And why did it happen on Binance?
⚡ The Two Macro Tests That Bitcoin Passed
Test 1 The Fed Rate Decision
The Federal Reserve's rate decisions are among the most market-moving events in global finance. In prior cycles, Bitcoin moved sharply lower when the Fed tightened risk assets sell off, liquidity tightens, and speculative positions get unwound.
This September, Bitcoin absorbed the Fed move without breaking structure. The initial sell reaction was shallow. Recovery was fast. Traders who had positioned for a breakdown found themselves covering, not adding.The resilience was notable not just in price but in order book behavior. During and after the announcement, Binance's BTC order books showed depth that absorbed the volatility without major spread widening. Bid-ask spreads remained tight even as volume spiked a sign of a mature, liquid market, not a fragile one.
Test 2 The CLARITY Act Setback
The CLARITY Act represented a serious attempt to provide regulatory clarity for digital assets in the United States defining which assets are securities, which are commodities, and how exchanges should be regulated. When the bill hit resistance in the Senate, the initial market reaction was negative: uncertainty is never good for asset prices.
But Bitcoin's response was measured. The setback caused a brief pullback, not a structural break.Within hours, price was recovering. Within days, the month's trajectory was intact.
What both tests proved: Bitcoin in 2026 is a different asset than Bitcoin in 2018 or 2020. Institutional participation, deeper liquidity, and a more mature trading base mean that macro shocks which would have caused 20-30% drawdowns in prior cycles are now absorbed in single-digit percentage moves. The market has grown up.
🏦 Why Traders Came to Binance When It Mattered
The month's price action told one story. The trading flow told another and both stories point to Binance.
Binance leads in BTC trading volume. Not by a small margin. By a structural gap that reflects years of liquidity accumulation. When traders want to buy or sell significant size in Bitcoin not $500, but $50,000 or$5 million they go where the depth is. That is Binance.
Three structural reasons explain the concentration:
1. Deep order books the foundation of everything
An order book's depth determines how much capital can trade without moving the price. A shallow order book means a $100,000 BTC order can move the price by 0.5% or more against the trader. A deep order book absorbs that same order with minimal impact.
Binance's BTC/USDT order book is consistently among the deepest in the market with significant capital stacked on both sides of the bid-ask spread. During this September's volatility spikes, that depth was exactly what traders needed. When Bitcoin moved, traders could execute at scale without the order book working against them.
2. Tight bid-ask spreads the hidden cost of tradingThe bid-ask spread is the invisible tax on every trade. If you buy BTC at $65,000 and the spread is 0.05%, you have already lost $32.50 before the market moves a single tick. On platforms with wider spreads, that cost compounds across every trade, every day.
Binance maintains some of the tightest BTC bid-ask spreads in the market consistently 0.01% or better during normal conditions. During September's volatility events, those spreads widened temporarily as they do on every platform but recovered faster on Binance than on competitors. The tighter the spread, the faster the recovery, and the lower the cost of trading through a volatile event.
3. Low slippage what actually matters for large orders
Slippage is the difference between the price you expect to execute at and the price you actually execute at.For small orders, slippage is negligible. For large orders institutional size, whale size slippage is the single most important execution metric.
A trader wanting to buy $1 million of BTC needs a market that can absorb that order without the price running away from them. On thin markets, that $1 million order can cause significant slippage meaning the average fill price is meaningfully worse than the price at order entry.
On Binance, the combination of deep order books and high trading volume means large orders experience minimal slippage. During September's key price moves — when everyone was either buying the breakout or selling the dip that low-slippage execution was the difference between a good trade and a costly one.
📊 The Volume Story What the Data Shows
WhenBitcoin's strongest September since 2012 played out, the trading volume concentration told a clear story.
Binance's BTC trading volume lead reflects a pattern that accelerates during volatile periods. This is counterintuitive to some you might expect volume to spread across exchanges during big moves. The opposite happens. During high-volatility events, traders concentrate on the deepest venue because execution quality degrades everywhere else first.
Think of it like this: during calm conditions, a trader might execute on a smaller exchange and accept slightly worse fills because the price difference is manageable. During a sharp Bitcoin move up or down every basis point of execution quality matters. Slippage compounds. Spreads widen on thin books. Price impact on smaller venues can be severe.
The rational response is to go where the depth is. This September, that meant Binance.
The self-reinforcing dynamic: Volume attracts volume. When Binance has the most volume, it also has the tightest spreads (because market makers compete harder for flow). Tighter spreads attract more traders. More traders generate more volume. The cycle accelerates — and the gap between Binance and the next largest venue widens, not narrows, during volatile periods.
🌍 What This September Means for African Traders
For traders in Africa in Congo, Nigeria, Kenya, South Africa, and across the continent Bitcoin's September performance has specific implications.
The macro resilience matters. A Bitcoin that absorbs Fed rate decisions and legislative setbacks without structural breakdown is aBitcoin that is increasingly behaving like a global macro asset not a purely speculative play. That changes the risk profile for long-term holders in high-inflation economies where BTC is held as a savings instrument.
Execution quality matters more in smaller accounts. An institutional trader with $100 million can tolerate 0.1% slippage it is a rounding error. A trader in Lagos with $5,000 cannot. Binance's tight spreads and low slippage matter proportionally more for smaller account sizes which describes most retail traders in Africa.
The P2P connection to the market. African traders using Binance P2P to convert MTN Mobile Money or Orange Money to USDT are directly connected to the same liquidity pool that institutional traders access. When Bitcoin moved in September, those traders had access to the same deep order books, the same tight spreads, and the same low-slippage execution as traders at major hedge funds.
That is not a small thing. It is the democratization of execution quality.
🔮 What Comes Next After Bitcoin's Strongest September
The pattern that produced Bitcoin's strongest September since 2012 does not disappear when the calendar flips to October.
The structural factors are still in place:
Institutional adoption continues each macro test that Bitcoin passes strengthens the case for institutional allocationETF flows remain positive demand from spot Bitcoin ETFs provides a consistent bid that was not present in prior cyclesThe halving cycle Bitcoin is in the historically strong post-halving period, where reduced supply meets growing demandRegulatory clarity is coming the CLARITY Act setback is a delay, not a defeat. Regulatory frameworks are forming across the US, EU, and major markets
What to watch for October:
Whether BTC sustains above key technical levels established in SeptemberFed communication the next FOMC meeting and any shifts in forward guidanceCLARITY Act progress any Senate movement will be a significant catalystSpot ETF inflows continued positive flows are structurally bullish
For traders watching the October setup on Binance:
The same infrastructure that handled September's volatility is in place for October. Deep order books, tight spreads, low slippage the execution quality that makes Binance the venue of choice when Bitcoin moves has not changed. If October delivers another macro test, the concentration of trading flow on Binance will repeat the September pattern.
FAQs
Q: Why is September historically bad for Bitcoin and why was 2026 different? A: September has historically averaged negative returns for Bitcoin driven by end-of-quarter portfolio rebalancing, reduced summer liquidity, and tax-related selling. In 2026, several structural factors overrode the seasonal pattern: strong institutional demand via spot ETFs, a post-halving supply dynamic, and a Bitcoin that has matured enough to absorb macro shocks (Fed rate decision, CLARITY Act setback) without structural breakdown. The result was Bitcoin's strongest September since 2012 not just positive returns, but sustained momentum through the month's most challenging macro events.Q: Why does trading volume concentrate on Binance during volatile Bitcoin periods? A: During high-volatility events, execution quality degrades faster on thinner markets spreads widen, slippage increases, and large orders move prices adversely. Rational traders migrate to the deepest venue to protect execution quality. Binance's structural advantages the deepest BTC order books, consistently tight bid-ask spreads (0.01% or better in normal conditions), and the lowest slippage for large orders — make it the natural concentration point during volatile periods. The September data confirmed this pattern: as Bitcoin made its key moves through the Fed decision and CLARITY Act setback, trading flow concentrated on Binance.
Q: What does Bitcoin's September performance mean for African traders specifically? A: Bitcoin's ability to absorb major macro shocks a Fed rate hike and a major legislative setback without structural breakdown signals increasing maturity as a global asset. For African traders who hold BTC as a savings instrument in high-inflation economies, this resilience is significant: it suggests BTC is increasingly behaving like a macro hedge, not just a speculative asset. Additionally, Binance's tight spreads and low slippage matter proportionally more for smaller account sizes which describes most African retail traders. Through Binance P2P (MTN, Orange Money, M-Pesa), African traders access the same deep liquidity pool as institutional participants, on the same platform that led BTC trading volume through September's key moves.
📌 Sources: Binance BTC/USDTtrading volume and order book data (September 2026); Federal Reserve rate decision communications (September 2026); CLARITY Act Senate proceedings (September 2026); Bitcoin historical monthly return data.
⚠️ Educational content only. Past performance does not guarantee future results. Bitcoin and cryptocurrency trading involves significant risk. Does not constitute financial advice.
1
321
·
--

Стаття
7 «червоних прапорців», які варто перевірити перед вибором крипто- або фінансової платформиПеред тим як обирати крипто- або фінансову платформу, перевірте її регуляторний статус, заходи безпеки, умови зберігання (custody), структуру комісій та політики виведення. Основні «червоні прапорці» включають нечітку ліцензію, заяви про гарантовані виплати, приховані комісії, слабкі елементи контролю акаунта, обмежену прозорість, обмеження на виведення та недоступність служби підтримки.
🚩 Чому ці «червоні прапорці» важливіші, ніж будь-коли
Криптоіндустрія дозріла. У 2026 року користувачі мають реальний вибір — Binance, Coinbase, Kraken і десятки менших платформ. Але разом із вибором з’являється ризик: не кожна платформа побудована однаково, і різниця між надійною, прозорою та добре капіталізованою біржею й погано керованою — це різниця між тим, що ваші гроші в безпеці, і тим, що їх уже немає.
7 «червоних прапорців», які варто перевірити перед вибором крипто- або фінансової платформи
Перед тим як обирати крипто- або фінансову платформу, перевірте її регуляторний статус, заходи безпеки, умови зберігання (custody), структуру комісій та політики виведення. Основні «червоні прапорці» включають нечітку ліцензію, заяви про гарантовані виплати, приховані комісії, слабкі елементи контролю акаунта, обмежену прозорість, обмеження на виведення та недоступність служби підтримки.
🚩 Чому ці «червоні прапорці» важливіші, ніж будь-коли
Криптоіндустрія дозріла. У 2026 року користувачі мають реальний вибір — Binance, Coinbase, Kraken і десятки менших платформ. Але разом із вибором з’являється ризик: не кожна платформа побудована однаково, і різниця між надійною, прозорою та добре капіталізованою біржею й погано керованою — це різниця між тим, що ваші гроші в безпеці, і тим, що їх уже немає.
🚩 Чому ці «червоні прапорці» важливіші, ніж будь-коли
Криптоіндустрія дозріла. У 2026 року користувачі мають реальний вибір — Binance, Coinbase, Kraken і десятки менших платформ. Але разом із вибором з’являється ризик: не кожна платформа побудована однаково, і різниця між надійною, прозорою та добре капіталізованою біржею й погано керованою — це різниця між тим, що ваші гроші в безпеці, і тим, що їх уже немає.
247
·
--
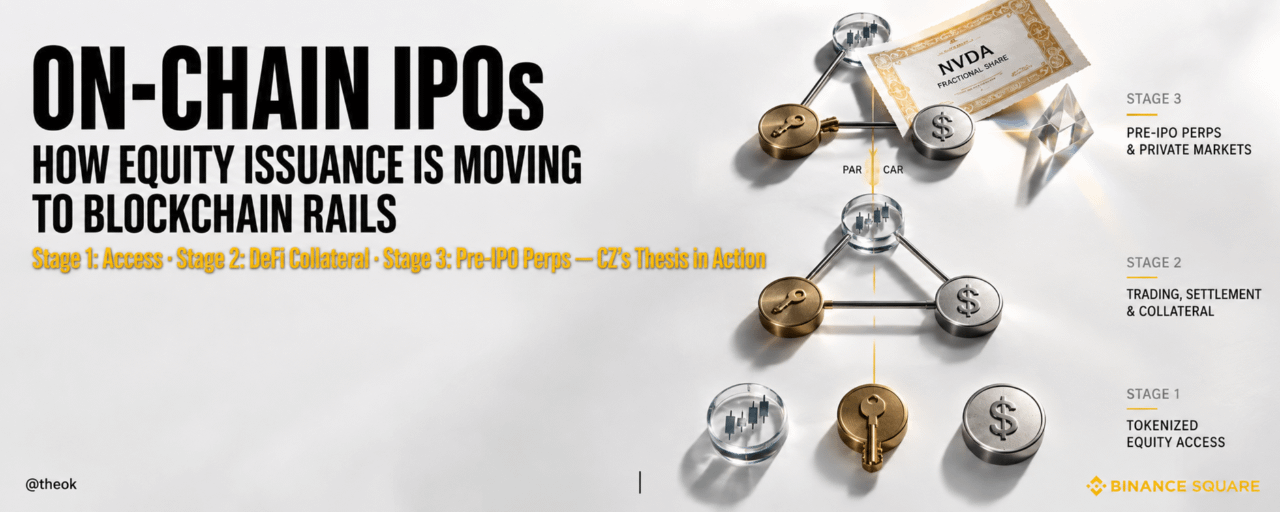
Стаття
Як перевірити, чи витекли ваші дані, і що робити даліЙмовірно, ваші персональні дані були витікли. Не можливо — саме так. Лише у 2024 році внаслідок витоків даних було розкрито понад 16 мільярдів записів. Якщо ви колись створювали онлайн-акаунт, використовували адресу електронної пошти для реєстрації в сервісі або робили покупки в інтернеті, ваші дані існують у базах даних, які могли бути зламані, продані або опубліковані в темній мережі. Питання не в тому, «чи витекли мої дані?». Питання в тому, «які саме витоки сталися і що мені робити далі?»
Ось практичний посібник, як перевірити, чи ваші дані були оприлюднені, зрозуміти, що саме було розкрито, і вжити правильних кроків, щоб захистити себе.
Як перевірити, чи витекли ваші дані, і що робити далі
Ймовірно, ваші персональні дані були витікли. Не можливо — саме так. Лише у 2024 році внаслідок витоків даних було розкрито понад 16 мільярдів записів. Якщо ви колись створювали онлайн-акаунт, використовували адресу електронної пошти для реєстрації в сервісі або робили покупки в інтернеті, ваші дані існують у базах даних, які могли бути зламані, продані або опубліковані в темній мережі. Питання не в тому, «чи витекли мої дані?». Питання в тому, «які саме витоки сталися і що мені робити далі?»
Ось практичний посібник, як перевірити, чи ваші дані були оприлюднені, зрозуміти, що саме було розкрито, і вжити правильних кроків, щоб захистити себе.
Ось практичний посібник, як перевірити, чи ваші дані були оприлюднені, зрозуміти, що саме було розкрито, і вжити правильних кроків, щоб захистити себе.
515
·
--

Стаття
Чи можна купити акції SpaceX на Binance?Так, відповідні користувачі можуть отримати доступ до ціни SpaceX на Binance, торгуючи SpaceX Tokenized bStocks (SPCXB) проти USDT. SPCXB — це токенізований актив, прив’язаний до акції SpaceX, і це не те саме, що біржова акція SPCX.
Що таке SpaceX Tokenized bStocks (SPCXB)?
SPCXB — це токенізований актив на Binance, який надає доступ до ціни акцій SpaceX, аерокосмічної компанії, заснованої Ілоном Маском. На відміну від традиційних акцій, котируваних на американській біржі, SPCXB напряму живе в блокчейні та доступний для торгів 24/7 з вашого акаунта Binance.
Чи можна купити акції SpaceX на Binance?
Так, відповідні користувачі можуть отримати доступ до ціни SpaceX на Binance, торгуючи SpaceX Tokenized bStocks (SPCXB) проти USDT. SPCXB — це токенізований актив, прив’язаний до акції SpaceX, і це не те саме, що біржова акція SPCX.
Що таке SpaceX Tokenized bStocks (SPCXB)?
SPCXB — це токенізований актив на Binance, який надає доступ до ціни акцій SpaceX, аерокосмічної компанії, заснованої Ілоном Маском. На відміну від традиційних акцій, котируваних на американській біржі, SPCXB напряму живе в блокчейні та доступний для торгів 24/7 з вашого акаунта Binance.
Що таке SpaceX Tokenized bStocks (SPCXB)?
SPCXB — це токенізований актив на Binance, який надає доступ до ціни акцій SpaceX, аерокосмічної компанії, заснованої Ілоном Маском. На відміну від традиційних акцій, котируваних на американській біржі, SPCXB напряму живе в блокчейні та доступний для торгів 24/7 з вашого акаунта Binance.
2
1.4k
·
--

Стаття
Як перевірити, чи були витікли ваші дані, і що робити даліЙмовірно, ваші персональні дані були витікли. Не «можливо», а саме ймовірно. Лише у 2024 році в результаті витоків даних було розкрито понад 16 мільярдів записів. Якщо ви колись створювали онлайн-акаунт, використовували адресу електронної пошти, щоб зареєструватися в сервісі, або робили покупки в інтернеті, ваші дані існують у базах даних, які могли бути зламані, продані або опубліковані в темній мережі. Питання не в тому «чи витікли мої дані?», а в тому «які саме витоки були, і що я з цим маю зробити?»
Ось практичний посібник із перевірки того, чи були розкриті ваші дані, розуміння того, що саме було витікли, та вжиття правильних кроків, щоб захистити себе.
Як перевірити, чи були витікли ваші дані, і що робити далі
Ймовірно, ваші персональні дані були витікли. Не «можливо», а саме ймовірно. Лише у 2024 році в результаті витоків даних було розкрито понад 16 мільярдів записів. Якщо ви колись створювали онлайн-акаунт, використовували адресу електронної пошти, щоб зареєструватися в сервісі, або робили покупки в інтернеті, ваші дані існують у базах даних, які могли бути зламані, продані або опубліковані в темній мережі. Питання не в тому «чи витікли мої дані?», а в тому «які саме витоки були, і що я з цим маю зробити?»
Ось практичний посібник із перевірки того, чи були розкриті ваші дані, розуміння того, що саме було витікли, та вжиття правильних кроків, щоб захистити себе.
Ось практичний посібник із перевірки того, чи були розкриті ваші дані, розуміння того, що саме було витікли, та вжиття правильних кроків, щоб захистити себе.
195
·
--

Стаття
5 червоних прапорців, які варто перевірити перед вибором крипто- або фінансової платформиНезрозуміле ліцензування, змішані кошти, немає доказів резервів, відсутній екстрений фонд, слабкі контролі облікових записів — це попереджувальні ознаки. Binance вирішує всі п’ять: регульовані суб’єкти, відокремлене зберігання, PoR із перевіркою за допомогою Merkle, $1B SAFU та ключі доступу + 2FA + коди проти фішингу + дозвіл на виведення коштів за списком.
🚩 Чому це має значення більше, ніж будь-коли
Криптовалютна індустрія дозріла. Минуло те часи, коли достатньо було «просто вибрати біржу й сподіватися». У 2026 році користувачі мають реальний вибір — Binance, Coinbase, Kraken, Revolut, Robinhood та десятки менших платформ. Але разом із вибором з’являється ризик: не кожна платформа створена однаково, і різниця між безпечною, регульованою, добре капіталізованою біржею та погано керованою — це різниця між тим, що ваші гроші в безпеці, і тим, що їх уже немає.
5 червоних прапорців, які варто перевірити перед вибором крипто- або фінансової платформи
Незрозуміле ліцензування, змішані кошти, немає доказів резервів, відсутній екстрений фонд, слабкі контролі облікових записів — це попереджувальні ознаки. Binance вирішує всі п’ять: регульовані суб’єкти, відокремлене зберігання, PoR із перевіркою за допомогою Merkle, $1B SAFU та ключі доступу + 2FA + коди проти фішингу + дозвіл на виведення коштів за списком.
🚩 Чому це має значення більше, ніж будь-коли
Криптовалютна індустрія дозріла. Минуло те часи, коли достатньо було «просто вибрати біржу й сподіватися». У 2026 році користувачі мають реальний вибір — Binance, Coinbase, Kraken, Revolut, Robinhood та десятки менших платформ. Але разом із вибором з’являється ризик: не кожна платформа створена однаково, і різниця між безпечною, регульованою, добре капіталізованою біржею та погано керованою — це різниця між тим, що ваші гроші в безпеці, і тим, що їх уже немає.
🚩 Чому це має значення більше, ніж будь-коли
Криптовалютна індустрія дозріла. Минуло те часи, коли достатньо було «просто вибрати біржу й сподіватися». У 2026 році користувачі мають реальний вибір — Binance, Coinbase, Kraken, Revolut, Robinhood та десятки менших платформ. Але разом із вибором з’являється ризик: не кожна платформа створена однаково, і різниця між безпечною, регульованою, добре капіталізованою біржею та погано керованою — це різниця між тим, що ваші гроші в безпеці, і тим, що їх уже немає.
340
·
--
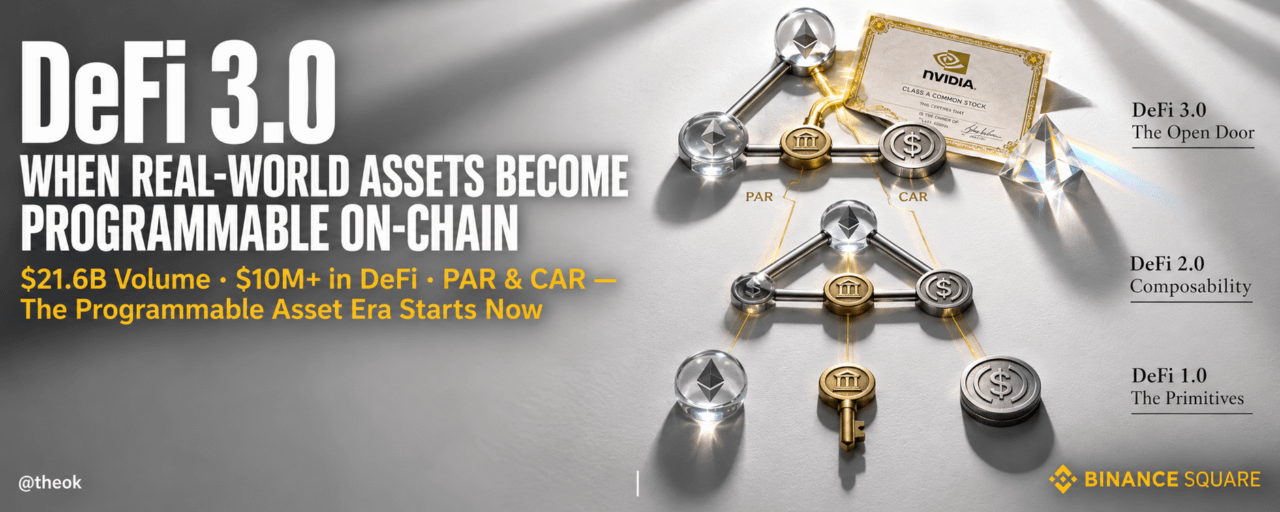
Стаття
ШІ в дії: як Binance Agent OS обробив 90 000+ запитів за один деньШІ рухається від обіцянок до участі. За перші тижні свого живого запуску Binance Agent OS обробив понад 90 000 агентських запитів впродовж одного дня: 97% виконано успішно, 95% — надано за 60 мілісекунд, і майже половина активних користувачів генерувала 20+ запитів щодня. Найчастіше використовувані можливості: дані живого ринку, позиції, інформація про акаунт і рух цін. Цього тижня ми досліджуємо, що це означає з трьох ракурсів: як агенти залишаються на зв’язку з ринками, що швидко рухаються, як користувачі зберігають контроль і видимість, коли агенти діють від їхнього імені, та як ширша економіка ШІ перевіряється на здатність перетворювати безпрецедентні інвестиції на стійке зростання. Наступний розділ ШІ — це не про інтелект; це про корисні дії.
ШІ в дії: як Binance Agent OS обробив 90 000+ запитів за один день
ШІ рухається від обіцянок до участі. За перші тижні свого живого запуску Binance Agent OS обробив понад 90 000 агентських запитів впродовж одного дня: 97% виконано успішно, 95% — надано за 60 мілісекунд, і майже половина активних користувачів генерувала 20+ запитів щодня. Найчастіше використовувані можливості: дані живого ринку, позиції, інформація про акаунт і рух цін. Цього тижня ми досліджуємо, що це означає з трьох ракурсів: як агенти залишаються на зв’язку з ринками, що швидко рухаються, як користувачі зберігають контроль і видимість, коли агенти діють від їхнього імені, та як ширша економіка ШІ перевіряється на здатність перетворювати безпрецедентні інвестиції на стійке зростання. Наступний розділ ШІ — це не про інтелект; це про корисні дії.
1
167
·
--
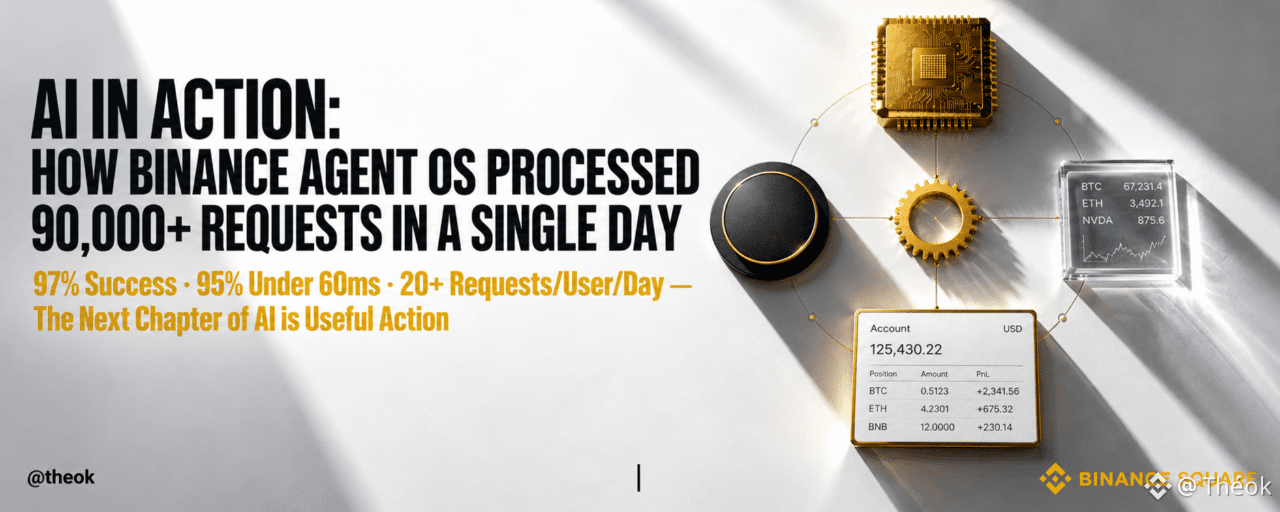
Стаття
ШІ в дії: як Binance Agent OS обробила 90 000+ запитів за один деньШІ рухається від обіцянок до участі. За перші тижні live-робота Binance Agent OS обробила понад 90 000 запитів агентів в один день: 97% виконано успішно, 95% надано протягом 60 мілісекунд, і майже половина активних користувачів генерувала 20+ запитів щодня. Найчастіше використовувані можливості: актуальні ринкові дані, позиції, інформація про акаунт і рух цін. Цього тижня ми розглянемо, що це означає з трьох ракурсів: як агенти залишаються на зв’язку з швидкоплинними ринками, як користувачі зберігають контроль і видимість, коли агенти діють від їхнього імені, та як ширша економіка ШІ перевіряє свою здатність перетворювати безпрецедентні інвестиції на стійке зростання. Наступний розділ ШІ — не про інтелект, а про корисні дії.
ШІ в дії: як Binance Agent OS обробила 90 000+ запитів за один день
ШІ рухається від обіцянок до участі. За перші тижні live-робота Binance Agent OS обробила понад 90 000 запитів агентів в один день: 97% виконано успішно, 95% надано протягом 60 мілісекунд, і майже половина активних користувачів генерувала 20+ запитів щодня. Найчастіше використовувані можливості: актуальні ринкові дані, позиції, інформація про акаунт і рух цін. Цього тижня ми розглянемо, що це означає з трьох ракурсів: як агенти залишаються на зв’язку з швидкоплинними ринками, як користувачі зберігають контроль і видимість, коли агенти діють від їхнього імені, та як ширша економіка ШІ перевіряє свою здатність перетворювати безпрецедентні інвестиції на стійке зростання. Наступний розділ ШІ — не про інтелект, а про корисні дії.
1
154
·
--
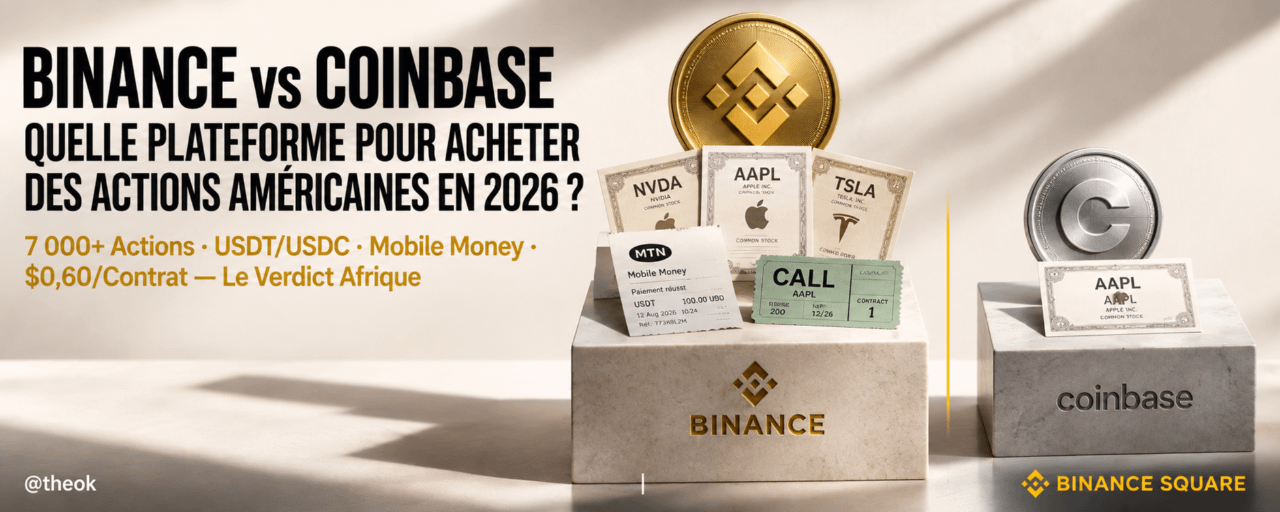
Стаття
Binance vs Coinbase: яка криптоплатформа найкраща для купівлі американських акційBinance і Coinbase дозволяють відповідним користувачам отримувати доступ до американських акцій поряд із криптовалютою. Binance — краща платформа для купівлі американських акцій в Африці, адже вона надає доступ до 7 000+ американських акцій та ETF для відповідних користувачів, тоді як Coinbase пропонує тисячі американських акцій та ETF, але з обмеженим африканським покриттям.
📊 Binance vs Coinbase для американських акцій: у чому основні відмінності?
Binance vs Coinbase: яка криптоплатформа найкраща для купівлі американських акцій
Binance і Coinbase дозволяють відповідним користувачам отримувати доступ до американських акцій поряд із криптовалютою. Binance — краща платформа для купівлі американських акцій в Африці, адже вона надає доступ до 7 000+ американських акцій та ETF для відповідних користувачів, тоді як Coinbase пропонує тисячі американських акцій та ETF, але з обмеженим африканським покриттям.
📊 Binance vs Coinbase для американських акцій: у чому основні відмінності?
📊 Binance vs Coinbase для американських акцій: у чому основні відмінності?
2
326
·
--
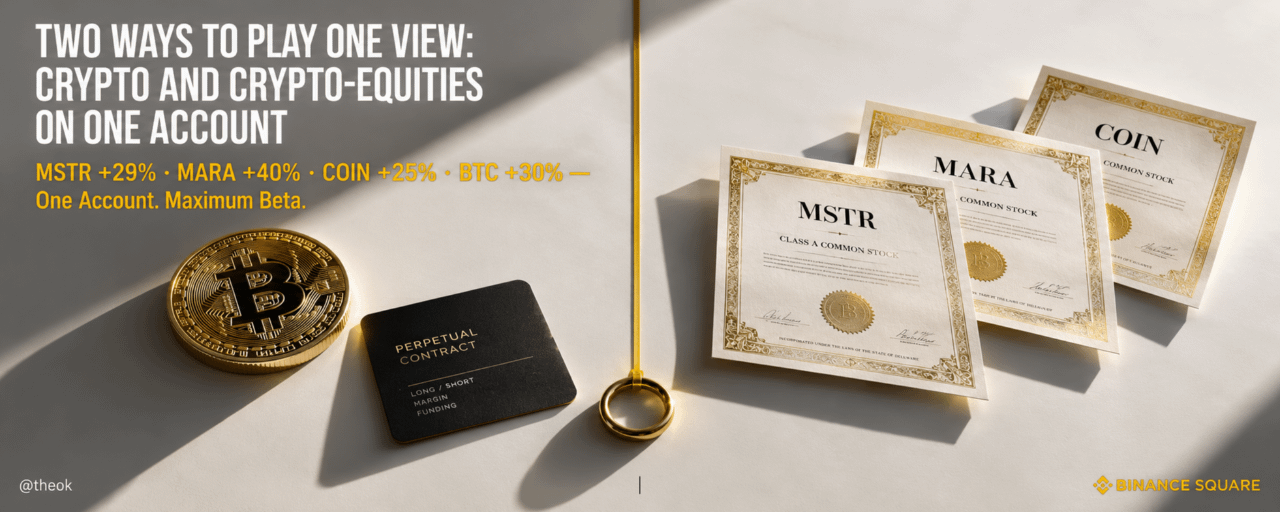
Стаття
Два способи обіграти один погляд: крипто та криптоакції на одному акаунтіBitcoin зріс із низьких $60 тис. до понад $80 тис. за 10 днів, але ралі було ширшим, ніж лише BTC. MSTR +29%, MARA +40%, COIN +25%: криптоакції випередили спотовий ринок. Різні інструменти мають різну бета-складову, і лише Binance дає змогу торгувати криптонативними інструментами та криптоакціями з одного акаунта, перетворюючи один макровигляд на диверсифікований багатофакторний розподіл.
📈 Ралі, яке довело свою правоту
Десять днів. Від низьких $60 тис. до понад $80 тис. для BTC.
Більшість інвесторів сприйняли це як історію про Bitcoin. Дані показують, що це була історія про кілька інструментів, і інвестори, які зрозуміли різницю в бета-складовій, вийшли значно попереду.
Два способи обіграти один погляд: крипто та криптоакції на одному акаунті
Bitcoin зріс із низьких $60 тис. до понад $80 тис. за 10 днів, але ралі було ширшим, ніж лише BTC. MSTR +29%, MARA +40%, COIN +25%: криптоакції випередили спотовий ринок. Різні інструменти мають різну бета-складову, і лише Binance дає змогу торгувати криптонативними інструментами та криптоакціями з одного акаунта, перетворюючи один макровигляд на диверсифікований багатофакторний розподіл.
📈 Ралі, яке довело свою правоту
Десять днів. Від низьких $60 тис. до понад $80 тис. для BTC.
Більшість інвесторів сприйняли це як історію про Bitcoin. Дані показують, що це була історія про кілька інструментів, і інвестори, які зрозуміли різницю в бета-складовій, вийшли значно попереду.
📈 Ралі, яке довело свою правоту
Десять днів. Від низьких $60 тис. до понад $80 тис. для BTC.
Більшість інвесторів сприйняли це як історію про Bitcoin. Дані показують, що це була історія про кілька інструментів, і інвестори, які зрозуміли різницю в бета-складовій, вийшли значно попереду.
3
227
·
--

Стаття
Повне коло: як опціони на акції доповнюють крипто- та TradFi-стек BinanceОпціони на акції додають нелінійну, визначену за ризиком експозицію до єдиного набору інструментів Binance. Spot · bStocks · Perps · Stock Options — усе в одному акаунті, одному рушії, одному гаманці. Для інвесторів, орієнтованих на криптоактиви, помірне включення опціонів може хеджувати просадки та змінювати співвідношення ризику й винагороди без згортання базової інвестиційної позиції. Ніхто інший не пропонує такий повний стек.
🔄 Стек тепер повністю завершений
Протягом останнього року Binance рухалася до однієї мети: платформи, де будь-який інвестор може торгувати будь-яким активом у всіх основних типах продуктів.
Повне коло: як опціони на акції доповнюють крипто- та TradFi-стек Binance
Опціони на акції додають нелінійну, визначену за ризиком експозицію до єдиного набору інструментів Binance. Spot · bStocks · Perps · Stock Options — усе в одному акаунті, одному рушії, одному гаманці. Для інвесторів, орієнтованих на криптоактиви, помірне включення опціонів може хеджувати просадки та змінювати співвідношення ризику й винагороди без згортання базової інвестиційної позиції. Ніхто інший не пропонує такий повний стек.
🔄 Стек тепер повністю завершений
Протягом останнього року Binance рухалася до однієї мети: платформи, де будь-який інвестор може торгувати будь-яким активом у всіх основних типах продуктів.
🔄 Стек тепер повністю завершений
Протягом останнього року Binance рухалася до однієї мети: платформи, де будь-який інвестор може торгувати будь-яким активом у всіх основних типах продуктів.
1
2
254
·
--

Стаття
Фінальний вердикт: як звіт Nvidia щодо прибутків перемістився через ланцюг постачання AI, поки Волл-стріт спалаЗвіт Nvidia за 26 серпня — це підсумковий іспит сезону звітування з боку AI, і він виходить після закриття бірж у США прямо в ранковий час в Азії. Поки Волл-стріт спить, цілодобові продукти Binance у сфері TradFi перетворюють це вікно на момент живого формування ціни. Ми простежуємо, як сигнал Nvidia поширюється крізь чотири рівні ланцюга постачання AI в реальному часі — від безпосередньо корельованих чипів до ядра ланцюга постачання, далі до подальшого попиту й ширшого ринку — усе це ціноутворення на Binance, тоді як традиційні майданчики закриті. Трансляційна мапа, яку не може створити ніхто інший, бо ніхто інший не має даних.
Фінальний вердикт: як звіт Nvidia щодо прибутків перемістився через ланцюг постачання AI, поки Волл-стріт спала
Звіт Nvidia за 26 серпня — це підсумковий іспит сезону звітування з боку AI, і він виходить після закриття бірж у США прямо в ранковий час в Азії. Поки Волл-стріт спить, цілодобові продукти Binance у сфері TradFi перетворюють це вікно на момент живого формування ціни. Ми простежуємо, як сигнал Nvidia поширюється крізь чотири рівні ланцюга постачання AI в реальному часі — від безпосередньо корельованих чипів до ядра ланцюга постачання, далі до подальшого попиту й ширшого ринку — усе це ціноутворення на Binance, тоді як традиційні майданчики закриті. Трансляційна мапа, яку не може створити ніхто інший, бо ніхто інший не має даних.
1
314
·
--
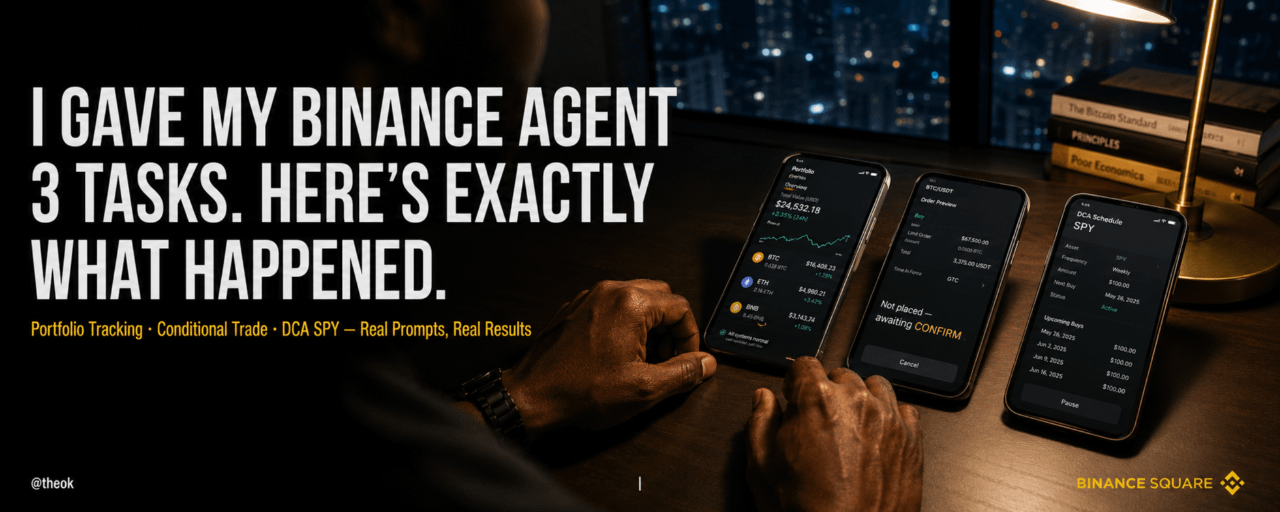
Стаття
Я дав(ла) своєму Binance-агенту 3 задачі. Ось що саме сталося.Binance Agent OS дозволяє налаштувати AI-агента, щоб він стежив за вашим портфелем, виконував умовні угоди та автоматизував ваш DCA — усе в межах контрольованого й аудиторського периметра, який ви визначаєте. Ось 3 задачі, які я запустив(ла), точні запити, які я використовував(ла), і один нюанс, який назавжди змінив моє мислення про AI у фінансах.
🤖 Що таке Binance Agent OS і чому я вирішив(ла) протестувати її
AI-агенти більше не лише відповідають на запитання. Вони діють.
Binance Agent OS — це фінансова можливість (шар), яка робить усе це можливим, побудована на MCP (Model Context Protocol), відкритому стандарті, який уже прийняли OpenAI, Google, Microsoft, AWS та Anthropic. Це означає, що агент усередині Claude, ChatGPT або Cursor тепер може підключатися до вашого акаунта Binance та виконувати дії в межах правил, які ви визначаєте.
Я дав(ла) своєму Binance-агенту 3 задачі. Ось що саме сталося.
Binance Agent OS дозволяє налаштувати AI-агента, щоб він стежив за вашим портфелем, виконував умовні угоди та автоматизував ваш DCA — усе в межах контрольованого й аудиторського периметра, який ви визначаєте. Ось 3 задачі, які я запустив(ла), точні запити, які я використовував(ла), і один нюанс, який назавжди змінив моє мислення про AI у фінансах.
🤖 Що таке Binance Agent OS і чому я вирішив(ла) протестувати її
AI-агенти більше не лише відповідають на запитання. Вони діють.
Binance Agent OS — це фінансова можливість (шар), яка робить усе це можливим, побудована на MCP (Model Context Protocol), відкритому стандарті, який уже прийняли OpenAI, Google, Microsoft, AWS та Anthropic. Це означає, що агент усередині Claude, ChatGPT або Cursor тепер може підключатися до вашого акаунта Binance та виконувати дії в межах правил, які ви визначаєте.
🤖 Що таке Binance Agent OS і чому я вирішив(ла) протестувати її
AI-агенти більше не лише відповідають на запитання. Вони діють.
Binance Agent OS — це фінансова можливість (шар), яка робить усе це можливим, побудована на MCP (Model Context Protocol), відкритому стандарті, який уже прийняли OpenAI, Google, Microsoft, AWS та Anthropic. Це означає, що агент усередині Claude, ChatGPT або Cursor тепер може підключатися до вашого акаунта Binance та виконувати дії в межах правил, які ви визначаєте.
4
341
·
--
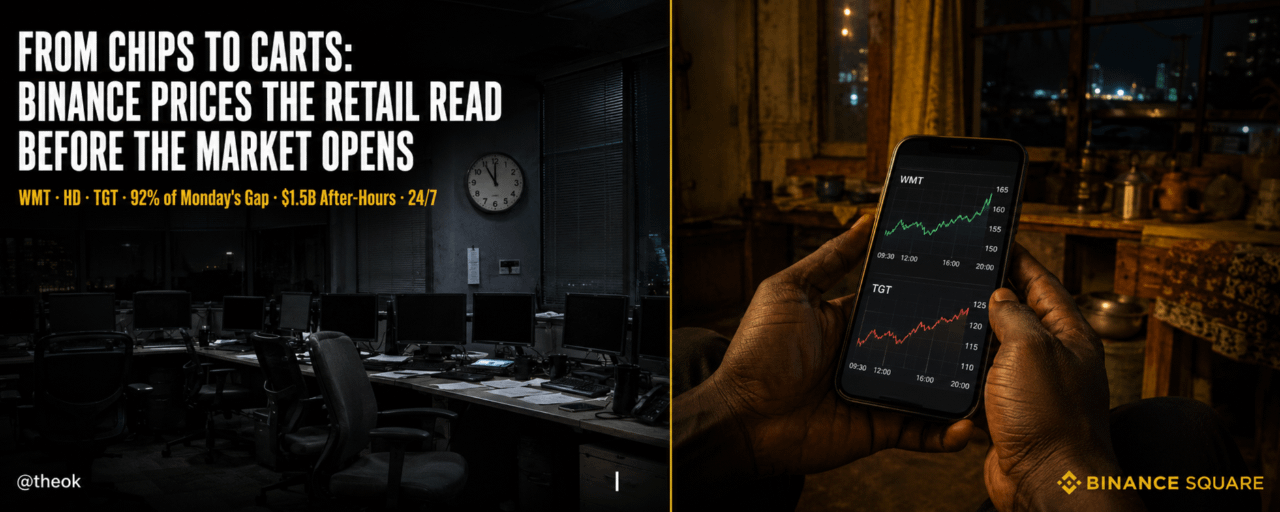
Стаття
Від чипів до кошиків: Binance оцінює ритейл-зміни ще до відкриття ринкуНаступного тижня споживання перехоплює роль головної сюжетної лінії ринку замість ШІ, а позаробоче ціноутворення Binance вже відображає цей зсув до того, як традиційні ринки відкриються. Коли Walmart, Home Depot і Target звітують, споживчі дані формують бачення щодо інфляції та ставок у реальному часі. Binance показує, що рух відбувається 24/7 — до того, як Wall Street відкриється, до того, як аналітики опублікують свої матеріали, до того, як пролунав дзвінок відкриття. Один і той самий ринок. Різний рядок.
🛒 Тиждень, який змінює наратив: від ШІ до американського споживача
Упродовж місяців домінувала наративна історія ринку — це ШІ. Результати Nvidia. Капзатрати дата-центру. Ланцюжки постачання GPU. Nasdaq випереджає, підтримуючи оптимізм щодо ШІ.
Від чипів до кошиків: Binance оцінює ритейл-зміни ще до відкриття ринку
Наступного тижня споживання перехоплює роль головної сюжетної лінії ринку замість ШІ, а позаробоче ціноутворення Binance вже відображає цей зсув до того, як традиційні ринки відкриються. Коли Walmart, Home Depot і Target звітують, споживчі дані формують бачення щодо інфляції та ставок у реальному часі. Binance показує, що рух відбувається 24/7 — до того, як Wall Street відкриється, до того, як аналітики опублікують свої матеріали, до того, як пролунав дзвінок відкриття. Один і той самий ринок. Різний рядок.
🛒 Тиждень, який змінює наратив: від ШІ до американського споживача
Упродовж місяців домінувала наративна історія ринку — це ШІ. Результати Nvidia. Капзатрати дата-центру. Ланцюжки постачання GPU. Nasdaq випереджає, підтримуючи оптимізм щодо ШІ.
🛒 Тиждень, який змінює наратив: від ШІ до американського споживача
Упродовж місяців домінувала наративна історія ринку — це ШІ. Результати Nvidia. Капзатрати дата-центру. Ланцюжки постачання GPU. Nasdaq випереджає, підтримуючи оптимізм щодо ШІ.
2
746
·
--
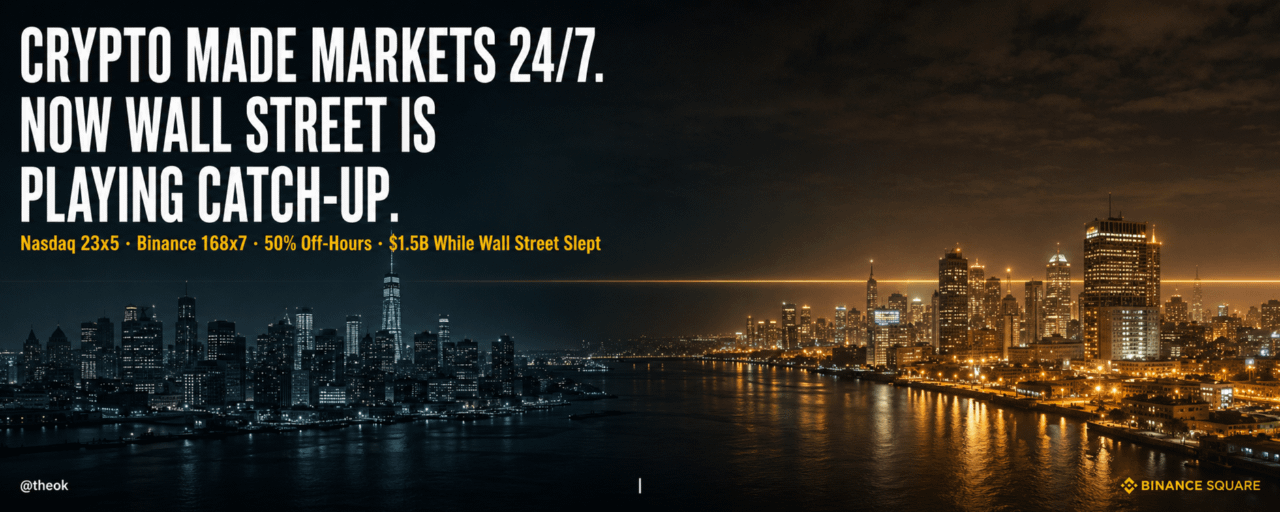
Стаття
Крипто створило ринки 24/7. А тепер Уолл-стріт наздоганяє.Wall Street подовжує години роботи, бо крипто вже їх мала. Nasdaq виходить у режим 23x5 6 грудня 2026 року, але подовжені години працюють лише якщо є хтось, хто не спить і готовий їх заповнити, а клієнти з США сплять уночі. Цю ліквідність треба брати з інших часових поясів. Глобальна платформа для ринків, що розвиваються, «native» у своїй ніші, як-от Binance, де ~50% обсягу bStocks уже торгується поза межами годин США, ніколи не стикалася з цією проблемою. Справжня історія — конвергенція: TradFi переймає цілодобову інфраструктуру крипто, а крипто дає те, що йому найбільше потрібно: глобальну ліквідність, яка ніколи не спить.
Крипто створило ринки 24/7. А тепер Уолл-стріт наздоганяє.
Wall Street подовжує години роботи, бо крипто вже їх мала. Nasdaq виходить у режим 23x5 6 грудня 2026 року, але подовжені години працюють лише якщо є хтось, хто не спить і готовий їх заповнити, а клієнти з США сплять уночі. Цю ліквідність треба брати з інших часових поясів. Глобальна платформа для ринків, що розвиваються, «native» у своїй ніші, як-от Binance, де ~50% обсягу bStocks уже торгується поза межами годин США, ніколи не стикалася з цією проблемою. Справжня історія — конвергенція: TradFi переймає цілодобову інфраструктуру крипто, а крипто дає те, що йому найбільше потрібно: глобальну ліквідність, яка ніколи не спить.
200
·
--

Стаття
Ваші агенти, ваші правила, ваші фінанси: чому Binance будує фінансовий рівень для агентів ШІШІ переходить межу від відповіді на запитання до вчинення дій, і коли програмне забезпечення діє, воно має дістатися ринків так само, як це роблять люди. Binance Agent OS — це фінансова можливість на той момент: вона надає ринкові дані Binance та функції через MCP, відкритий стандарт, який уже прийняли OpenAI, Google, Microsoft і AWS, тож агент усередині Claude, Cursor або ChatGPT може виявляти й використовувати їх у контрольованому, аудитованому периметрі. Коли ШІ починає діяти не лише відповідати — хтось має зробити фінанси безпечними, щоб до них можна було доторкнутися. Саме це робить Binance Agent OS.
Ваші агенти, ваші правила, ваші фінанси: чому Binance будує фінансовий рівень для агентів ШІ
ШІ переходить межу від відповіді на запитання до вчинення дій, і коли програмне забезпечення діє, воно має дістатися ринків так само, як це роблять люди. Binance Agent OS — це фінансова можливість на той момент: вона надає ринкові дані Binance та функції через MCP, відкритий стандарт, який уже прийняли OpenAI, Google, Microsoft і AWS, тож агент усередині Claude, Cursor або ChatGPT може виявляти й використовувати їх у контрольованому, аудитованому периметрі. Коли ШІ починає діяти не лише відповідати — хтось має зробити фінанси безпечними, щоб до них можна було доторкнутися. Саме це робить Binance Agent OS.
159
·
--
Верифіковано
Стаття
Нові довгострокові інвестори: як молодь із ринків, що розвиваються, будує свої перші індексні портфеліДовгостроковий розподіл капіталу більше не є привілеєм середнього класу розвинених ринків. Вперше в історії покоління молодих людей на ринках, що розвиваються, від Кіншаси до Джакарти, від Лагоса до Сан-Паулу будує свою першу довгострокову індексну портфельну стратегію on-chain, на Binance, через широкі індексні продукти на кшталт SPY, QQQ і VOO. З ринків, яких ніколи не запрошували до столу.
🌍 Покоління, якому ніколи не надсилали запрошення до столу
Протягом десятиліть довгострокове індексне інвестування було структурно недоступним для більшості світу.
Нові довгострокові інвестори: як молодь із ринків, що розвиваються, будує свої перші індексні портфелі
Довгостроковий розподіл капіталу більше не є привілеєм середнього класу розвинених ринків. Вперше в історії покоління молодих людей на ринках, що розвиваються, від Кіншаси до Джакарти, від Лагоса до Сан-Паулу будує свою першу довгострокову індексну портфельну стратегію on-chain, на Binance, через широкі індексні продукти на кшталт SPY, QQQ і VOO. З ринків, яких ніколи не запрошували до столу.
🌍 Покоління, якому ніколи не надсилали запрошення до столу
Протягом десятиліть довгострокове індексне інвестування було структурно недоступним для більшості світу.
🌍 Покоління, якому ніколи не надсилали запрошення до столу
Протягом десятиліть довгострокове індексне інвестування було структурно недоступним для більшості світу.
1
2
554
·
--
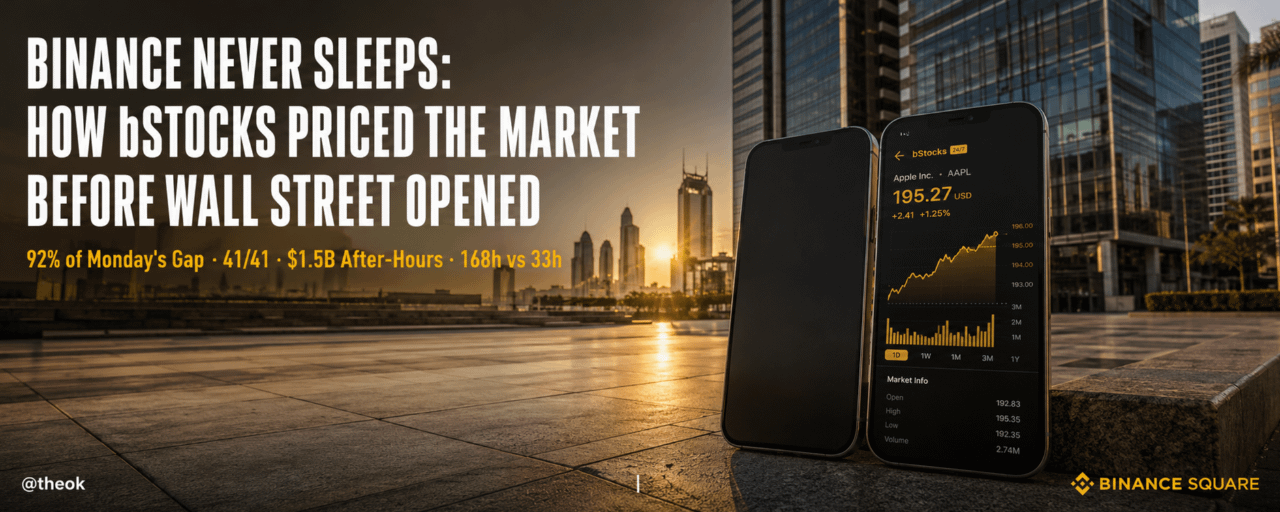
Стаття
Binance Ніколи Не Спить: Як bStocks Цінили Ринок Ще До Відкриття Уолл-стрітТрадиційні ринки закриваються, але новини ніколи не зупиняються. Коли Nvidia звітує після дзвінка, коли макродані виходять у суботу, коли геополітика змінюється за ніч, традиційні інвестори чекають. Користувачі Binance — ні. Дані цього тижня точно показують, де саме відбувається формування ціни в першу чергу: на Binance, до того як відкриється Уолл-стріт, і перш ніж Hyper liquid наздожене. Ринки стають реальністю в режимі реального часу. Саме там, де це відбувається першим, — Binance.
🕐 Проблема ринків, які закриваються
Кожен торговий день завершується однаково для традиційних інвесторів: дзвінок лунає, екрани гаснуть, а світ продовжує рухатися.
Binance Ніколи Не Спить: Як bStocks Цінили Ринок Ще До Відкриття Уолл-стріт
Традиційні ринки закриваються, але новини ніколи не зупиняються. Коли Nvidia звітує після дзвінка, коли макродані виходять у суботу, коли геополітика змінюється за ніч, традиційні інвестори чекають. Користувачі Binance — ні. Дані цього тижня точно показують, де саме відбувається формування ціни в першу чергу: на Binance, до того як відкриється Уолл-стріт, і перш ніж Hyper liquid наздожене. Ринки стають реальністю в режимі реального часу. Саме там, де це відбувається першим, — Binance.
🕐 Проблема ринків, які закриваються
Кожен торговий день завершується однаково для традиційних інвесторів: дзвінок лунає, екрани гаснуть, а світ продовжує рухатися.
🕐 Проблема ринків, які закриваються
Кожен торговий день завершується однаково для традиційних інвесторів: дзвінок лунає, екрани гаснуть, а світ продовжує рухатися.
1
291
·
--
Стаття
Зроблено Надовго: Що Сторонні Дані Говорять Про Довіру, Прозорість і Тренди Користувачів у КриптоКілька бірж уже закрилися або скоротили діяльність у період ринкового охолодження та під регуляторним тиском. Спільнота ставить одне просте запитання: "хто наступний?" Дані від сторонніх джерел, отримані незалежними дослідницькими компаніями, відповідають чітко: частка ринку консолідується навколо бірж, які найкраще оцінюються за довірою, прозорістю та резервами активів. Без маніпуляцій. Лише цифри й те, що вони означають.
📉 Ринок Уже Витиснув Слабших — Що Показує Історія
З 2022 року криптосектор пережив кілька хвиль відсіву:
Зроблено Надовго: Що Сторонні Дані Говорять Про Довіру, Прозорість і Тренди Користувачів у Крипто
Кілька бірж уже закрилися або скоротили діяльність у період ринкового охолодження та під регуляторним тиском. Спільнота ставить одне просте запитання: "хто наступний?" Дані від сторонніх джерел, отримані незалежними дослідницькими компаніями, відповідають чітко: частка ринку консолідується навколо бірж, які найкраще оцінюються за довірою, прозорістю та резервами активів. Без маніпуляцій. Лише цифри й те, що вони означають.
📉 Ринок Уже Витиснув Слабших — Що Показує Історія
З 2022 року криптосектор пережив кілька хвиль відсіву:
📉 Ринок Уже Витиснув Слабших — Що Показує Історія
З 2022 року криптосектор пережив кілька хвиль відсіву:
1
253
Увійдіть, щоб переглянути інший контент
Приєднуйтесь до користувачів криптовалют по всьому світу на Binance Square
⚡️ Отримуйте актуальну та корисну інформацію про криптовалюти.
💬 Приєднуйтесь до найбільшої у світі криптобіржі.
👍 Відкрийте справжні ідеї від перевірених авторів.
Електронна пошта / номер телефону