

CryptoFrontNews
17.8k Публікації

CryptoFrontNews
 Верифіковано+ на Binance Square
Поскаржитись
Заблокувати користувача
CryptoFrontNews (CFN) delivers the latest in cryptocurrency with real-time updates, expert analyses, and in-depth articles on digital currencies and blockchain.
4 Підписки
12.7K+ Підписники
19.1K+ Вподобань
Публікації

Стаття
Ціна Chainlink під тиском поблизу $11.50LINK ризикує продовжити зниження, оскільки низхідні трендові лінії залишаються незмінними. Трейдери стежать за підтримкою на рівні $11.80 і нижчими ціновими зонами.
Два можливі сценарії корекції роблять 5 листопада важливою датою: трейдери оцінюють, чи може LINK опуститися до нижчих рівнів підтримки.
Binance лідирує за відкритим інтересом і обсягом торгів LINK, тоді як BingX має найбільшу кількість ф’ючерсних угод серед наведених показників.
Ціна Chainlink залишається під тиском після недавнього падіння, а технічні прогнози вказують на можливість ще одного корекційного руху. Трейдери стежать за найближчим рівнем підтримки, низхідним опором і 5 листопада, щоб визначити подальший напрямок.
Ціна Chainlink під тиском поблизу $11.50
LINK ризикує продовжити зниження, оскільки низхідні трендові лінії залишаються незмінними. Трейдери стежать за підтримкою на рівні $11.80 і нижчими ціновими зонами.
Два можливі сценарії корекції роблять 5 листопада важливою датою: трейдери оцінюють, чи може LINK опуститися до нижчих рівнів підтримки.
Binance лідирує за відкритим інтересом і обсягом торгів LINK, тоді як BingX має найбільшу кількість ф’ючерсних угод серед наведених показників.
Ціна Chainlink залишається під тиском після недавнього падіння, а технічні прогнози вказують на можливість ще одного корекційного руху. Трейдери стежать за найближчим рівнем підтримки, низхідним опором і 5 листопада, щоб визначити подальший напрямок.
Два можливі сценарії корекції роблять 5 листопада важливою датою: трейдери оцінюють, чи може LINK опуститися до нижчих рівнів підтримки.
Binance лідирує за відкритим інтересом і обсягом торгів LINK, тоді як BingX має найбільшу кількість ф’ючерсних угод серед наведених показників.
Ціна Chainlink залишається під тиском після недавнього падіння, а технічні прогнози вказують на можливість ще одного корекційного руху. Трейдери стежать за найближчим рівнем підтримки, низхідним опором і 5 листопада, щоб визначити подальший напрямок.
38
Стаття
Центральний банк Ізраїлю відхилив криптоплан Нетаньягу з обходу санкційБанк Ізраїлю заявив, що криптовалюта не може допомогти обійти міжнародні санкції, і закликав Ізраїль захищати економічні зв’язки з основними торговельними партнерами.
Понад 100 економістів, зокрема колишній голова центрального банку Яаков Френкель, попередили, що санкції можуть зашкодити інвестиціям і рівню життя.
Ґаді Айзенкот і Яїр Лапід розкритикували пропозицію Нетаньягу, попередивши, що вона може послабити національну безпеку та змусити компанії виїхати за кордон.
Банк Ізраїлю відхилив пропозицію прем’єр-міністра Біньяміна Нетаньягу розглянути криптовалюту як спосіб обійти можливі міжнародні фінансові санкції. У заяві від 24 жовтня центральний банк закликав Ізраїль захищати економічні зв’язки з основними торговельними партнерами. Нетаньягу висунув цю пропозицію під час телевізійного інтерв’ю 23 жовтня, пославшись на можливі обмеження щодо ізраїльських банків.
Центральний банк Ізраїлю відхилив криптоплан Нетаньягу з обходу санкцій
Банк Ізраїлю заявив, що криптовалюта не може допомогти обійти міжнародні санкції, і закликав Ізраїль захищати економічні зв’язки з основними торговельними партнерами.
Понад 100 економістів, зокрема колишній голова центрального банку Яаков Френкель, попередили, що санкції можуть зашкодити інвестиціям і рівню життя.
Ґаді Айзенкот і Яїр Лапід розкритикували пропозицію Нетаньягу, попередивши, що вона може послабити національну безпеку та змусити компанії виїхати за кордон.
Банк Ізраїлю відхилив пропозицію прем’єр-міністра Біньяміна Нетаньягу розглянути криптовалюту як спосіб обійти можливі міжнародні фінансові санкції. У заяві від 24 жовтня центральний банк закликав Ізраїль захищати економічні зв’язки з основними торговельними партнерами. Нетаньягу висунув цю пропозицію під час телевізійного інтерв’ю 23 жовтня, пославшись на можливі обмеження щодо ізраїльських банків.
Понад 100 економістів, зокрема колишній голова центрального банку Яаков Френкель, попередили, що санкції можуть зашкодити інвестиціям і рівню життя.
Ґаді Айзенкот і Яїр Лапід розкритикували пропозицію Нетаньягу, попередивши, що вона може послабити національну безпеку та змусити компанії виїхати за кордон.
Банк Ізраїлю відхилив пропозицію прем’єр-міністра Біньяміна Нетаньягу розглянути криптовалюту як спосіб обійти можливі міжнародні фінансові санкції. У заяві від 24 жовтня центральний банк закликав Ізраїль захищати економічні зв’язки з основними торговельними партнерами. Нетаньягу висунув цю пропозицію під час телевізійного інтерв’ю 23 жовтня, пославшись на можливі обмеження щодо ізраїльських банків.
64

Стаття
Ritual запускає блокчейн першого рівня, створений для агентів ШІНью-Йорк, США, 26 жовтня 2026 року, Chainwire
Ritual Chain перетворює агентів ШІ на постійних економічних учасників, які самостійно керують власними гаманцями, ончейн-ідентичністю та приватним станом.
Ritual — лабораторія автономного інтелекту, заснована колишніми партнерами Polychain Capital Ніраджем Пантом та Акілешем Потті, — запустила Ritual Chain, блокчейн першого рівня, сумісний з EVM. На відміну від традиційних блокчейнів, створених переважно для виконання фінансових транзакцій, Ritual Chain призначений для підтримки програмного забезпечення, яке може самостійно використовувати інтелект, керувати капіталом, взаємодіяти із зовнішніми сервісами та продовжувати роботу без постійного втручання людини. Мережа забезпечує вбудовану підтримку доступу до моделей ШІ, приватних обчислень та автономного планування для застосунків EVM.
Ritual запускає блокчейн першого рівня, створений для агентів ШІ
Нью-Йорк, США, 26 жовтня 2026 року, Chainwire
Ritual Chain перетворює агентів ШІ на постійних економічних учасників, які самостійно керують власними гаманцями, ончейн-ідентичністю та приватним станом.
Ritual — лабораторія автономного інтелекту, заснована колишніми партнерами Polychain Capital Ніраджем Пантом та Акілешем Потті, — запустила Ritual Chain, блокчейн першого рівня, сумісний з EVM. На відміну від традиційних блокчейнів, створених переважно для виконання фінансових транзакцій, Ritual Chain призначений для підтримки програмного забезпечення, яке може самостійно використовувати інтелект, керувати капіталом, взаємодіяти із зовнішніми сервісами та продовжувати роботу без постійного втручання людини. Мережа забезпечує вбудовану підтримку доступу до моделей ШІ, приватних обчислень та автономного планування для застосунків EVM.
Ritual Chain перетворює агентів ШІ на постійних економічних учасників, які самостійно керують власними гаманцями, ончейн-ідентичністю та приватним станом.
Ritual — лабораторія автономного інтелекту, заснована колишніми партнерами Polychain Capital Ніраджем Пантом та Акілешем Потті, — запустила Ritual Chain, блокчейн першого рівня, сумісний з EVM. На відміну від традиційних блокчейнів, створених переважно для виконання фінансових транзакцій, Ritual Chain призначений для підтримки програмного забезпечення, яке може самостійно використовувати інтелект, керувати капіталом, взаємодіяти із зовнішніми сервісами та продовжувати роботу без постійного втручання людини. Мережа забезпечує вбудовану підтримку доступу до моделей ШІ, приватних обчислень та автономного планування для застосунків EVM.
17
Стаття
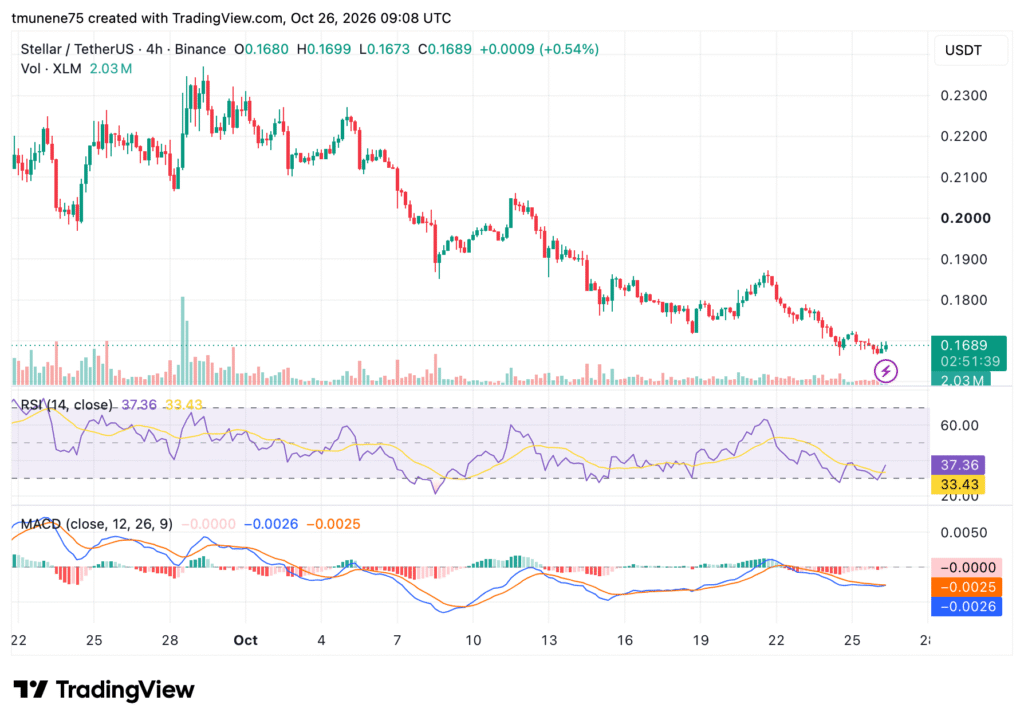
Ціна Stellar націлилася на $0.80, а XLM зіткнувся з двома важливими рівнями опоруXLM торгується поблизу $0.1689 після падіння з вересневих максимумів вище $0.23; найближча підтримка розташована в діапазоні 0.167–0.165.
Аналітик визначає $0.2254 як перший рівень опору, за яким іде важлива зона $0.45–$0.50 на потенційному шляху до $0.80.
RSI залишається нижче 50, а MACD демонструє незначний ведмежий сигнал; пробиття рівня $0.165 може призвести до подальших втрат, тоді як повернення вище $0.180 може поліпшити імпульс.
Токен XLM компанії Stellar тестує рівень підтримки поблизу $0.17, а аналітик Янніс Андреу окреслює два рівні опору перед потенційним рухом до $0.80. Андреу визначив $0.2254 як першу перешкоду, за якою йде макроекономічний рівень опору в діапазоні від $0.45 до $0.50. Тим часом чотиригодинний графік свідчить про тривалий тиск продавців після падіння XLM із вересневих максимумів вище $0.23.
Ціна Stellar націлилася на $0.80, а XLM зіткнувся з двома важливими рівнями опору
XLM торгується поблизу $0.1689 після падіння з вересневих максимумів вище $0.23; найближча підтримка розташована в діапазоні 0.167–0.165.
Аналітик визначає $0.2254 як перший рівень опору, за яким іде важлива зона $0.45–$0.50 на потенційному шляху до $0.80.
RSI залишається нижче 50, а MACD демонструє незначний ведмежий сигнал; пробиття рівня $0.165 може призвести до подальших втрат, тоді як повернення вище $0.180 може поліпшити імпульс.
Токен XLM компанії Stellar тестує рівень підтримки поблизу $0.17, а аналітик Янніс Андреу окреслює два рівні опору перед потенційним рухом до $0.80. Андреу визначив $0.2254 як першу перешкоду, за якою йде макроекономічний рівень опору в діапазоні від $0.45 до $0.50. Тим часом чотиригодинний графік свідчить про тривалий тиск продавців після падіння XLM із вересневих максимумів вище $0.23.
Аналітик визначає $0.2254 як перший рівень опору, за яким іде важлива зона $0.45–$0.50 на потенційному шляху до $0.80.
RSI залишається нижче 50, а MACD демонструє незначний ведмежий сигнал; пробиття рівня $0.165 може призвести до подальших втрат, тоді як повернення вище $0.180 може поліпшити імпульс.
Токен XLM компанії Stellar тестує рівень підтримки поблизу $0.17, а аналітик Янніс Андреу окреслює два рівні опору перед потенційним рухом до $0.80. Андреу визначив $0.2254 як першу перешкоду, за якою йде макроекономічний рівень опору в діапазоні від $0.45 до $0.50. Тим часом чотиригодинний графік свідчить про тривалий тиск продавців після падіння XLM із вересневих максимумів вище $0.23.
90

Стаття
Стрімке зростання ринку токенізованих активів до 40 млрд доларів СШАЯк показано на графіку, загальна вартість токенізованих активів зросла з 0,7 млрд доларів США у 2021 році до 38,8 млрд доларів США з початку 2026 року.
Ondo переносить традиційні фінансові продукти, як-от казначейські облігації та акції, у сферу токенізованих активів.
Сама лише ринкова вартість не дає змоги визначити торговельну активність, доступ інвесторів або частку Ondo на зростаючому ринку токенізованих активів.
Загальна вартість токенізованих активів зросла у 500 000 разів — із 0,7 млрд доларів США у 2021 році до 38,8 млрд доларів США у 2026 році.
Ринок токенізованих активів демонструє стрімке зростання
Стрімке зростання ринку токенізованих активів до 40 млрд доларів США
Як показано на графіку, загальна вартість токенізованих активів зросла з 0,7 млрд доларів США у 2021 році до 38,8 млрд доларів США з початку 2026 року.
Ondo переносить традиційні фінансові продукти, як-от казначейські облігації та акції, у сферу токенізованих активів.
Сама лише ринкова вартість не дає змоги визначити торговельну активність, доступ інвесторів або частку Ondo на зростаючому ринку токенізованих активів.
Загальна вартість токенізованих активів зросла у 500 000 разів — із 0,7 млрд доларів США у 2021 році до 38,8 млрд доларів США у 2026 році.
Ринок токенізованих активів демонструє стрімке зростання
Ondo переносить традиційні фінансові продукти, як-от казначейські облігації та акції, у сферу токенізованих активів.
Сама лише ринкова вартість не дає змоги визначити торговельну активність, доступ інвесторів або частку Ondo на зростаючому ринку токенізованих активів.
Загальна вартість токенізованих активів зросла у 500 000 разів — із 0,7 млрд доларів США у 2021 році до 38,8 млрд доларів США у 2026 році.
Ринок токенізованих активів демонструє стрімке зростання
1
196
Стаття
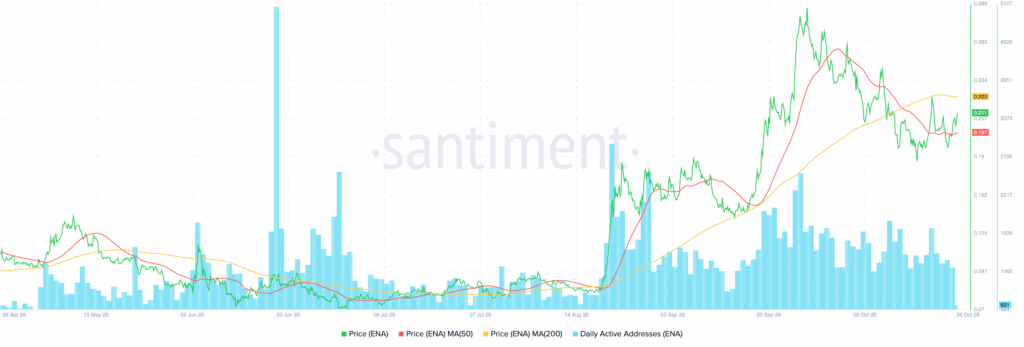
Ethena (ENA) відновився на 8.8%: аналітики стежать за ціллю $0.25ENA відновився на 8.8% після того, як Arthur Hayes продав 14 мільйонів токенів на суму близько $2.7 мільйона, але токен і далі торгується нижче своєї 200-денної ковзної середньої.
CryptoBullet очікує тривалої корекції та визначає діапазон 0.122–0.172 як потенційну зону для купівлі перед наступним тривалим проривом.
Crypto Patel спочатку прогнозує ціну $0.25, а в довгостроковій перспективі — до $3; прорив вище $0.223 може посилити оптимістичні очікування щодо відновлення.
Токен ENA компанії Ethena відновився на 8.8% після того, як Arthur Hayes продав 14 мільйонів токенів на суму приблизно $2.7 мільйона. Аналітики CryptoBullet і Crypto Patel окреслили різні сценарії для токена, і обидва відстежують потенціал зростання. Водночас CryptoBullet очікує тривалої корекції, а ENA торгується поблизу $0.211 — нижче своєї 200-денної ковзної середньої.
Ethena (ENA) відновився на 8.8%: аналітики стежать за ціллю $0.25
ENA відновився на 8.8% після того, як Arthur Hayes продав 14 мільйонів токенів на суму близько $2.7 мільйона, але токен і далі торгується нижче своєї 200-денної ковзної середньої.
CryptoBullet очікує тривалої корекції та визначає діапазон 0.122–0.172 як потенційну зону для купівлі перед наступним тривалим проривом.
Crypto Patel спочатку прогнозує ціну $0.25, а в довгостроковій перспективі — до $3; прорив вище $0.223 може посилити оптимістичні очікування щодо відновлення.
Токен ENA компанії Ethena відновився на 8.8% після того, як Arthur Hayes продав 14 мільйонів токенів на суму приблизно $2.7 мільйона. Аналітики CryptoBullet і Crypto Patel окреслили різні сценарії для токена, і обидва відстежують потенціал зростання. Водночас CryptoBullet очікує тривалої корекції, а ENA торгується поблизу $0.211 — нижче своєї 200-денної ковзної середньої.
CryptoBullet очікує тривалої корекції та визначає діапазон 0.122–0.172 як потенційну зону для купівлі перед наступним тривалим проривом.
Crypto Patel спочатку прогнозує ціну $0.25, а в довгостроковій перспективі — до $3; прорив вище $0.223 може посилити оптимістичні очікування щодо відновлення.
Токен ENA компанії Ethena відновився на 8.8% після того, як Arthur Hayes продав 14 мільйонів токенів на суму приблизно $2.7 мільйона. Аналітики CryptoBullet і Crypto Patel окреслили різні сценарії для токена, і обидва відстежують потенціал зростання. Водночас CryptoBullet очікує тривалої корекції, а ENA торгується поблизу $0.211 — нижче своєї 200-денної ковзної середньої.
130
Стаття
XRP може впасти на 22%, якщо кити продовжать продавати, попереджає аналітикКількість гаманців із балансом від 10 до 100 мільйонів токенів XRP скоротилася з 351 до 339, а залишки XRP на біржах зросли приблизно на 50 мільйонів.
Ali Charts попереджає, що падіння нижче $1.26 може відкрити шлях до цілей на рівні $1.11 і $0.98.
XRP торгується нижче своїх 50-денного та 200-денного ковзних середніх, тоді як кількість активних адрес скоротилася приблизно до 23 800, попри те, що число власників зросло до 8,25 мільйона.
За словами аналітика Ali Charts, XRP може впасти до $0.98, якщо великі власники продовжать продавати, а ціна опуститься нижче $1.26. Аналітик повідомив про зменшення кількості гаманців із балансом від 10 до 100 мільйонів XRP, а також про зростання залишків на біржах. Тим часом 26 жовтня XRP торгувався по $1.276 — нижче своєї 50-денної ковзної середньої.
XRP може впасти на 22%, якщо кити продовжать продавати, попереджає аналітик
Кількість гаманців із балансом від 10 до 100 мільйонів токенів XRP скоротилася з 351 до 339, а залишки XRP на біржах зросли приблизно на 50 мільйонів.
Ali Charts попереджає, що падіння нижче $1.26 може відкрити шлях до цілей на рівні $1.11 і $0.98.
XRP торгується нижче своїх 50-денного та 200-денного ковзних середніх, тоді як кількість активних адрес скоротилася приблизно до 23 800, попри те, що число власників зросло до 8,25 мільйона.
За словами аналітика Ali Charts, XRP може впасти до $0.98, якщо великі власники продовжать продавати, а ціна опуститься нижче $1.26. Аналітик повідомив про зменшення кількості гаманців із балансом від 10 до 100 мільйонів XRP, а також про зростання залишків на біржах. Тим часом 26 жовтня XRP торгувався по $1.276 — нижче своєї 50-денної ковзної середньої.
Ali Charts попереджає, що падіння нижче $1.26 може відкрити шлях до цілей на рівні $1.11 і $0.98.
XRP торгується нижче своїх 50-денного та 200-денного ковзних середніх, тоді як кількість активних адрес скоротилася приблизно до 23 800, попри те, що число власників зросло до 8,25 мільйона.
За словами аналітика Ali Charts, XRP може впасти до $0.98, якщо великі власники продовжать продавати, а ціна опуститься нижче $1.26. Аналітик повідомив про зменшення кількості гаманців із балансом від 10 до 100 мільйонів XRP, а також про зростання залишків на біржах. Тим часом 26 жовтня XRP торгувався по $1.276 — нижче своєї 50-денної ковзної середньої.
1
1.4k
Стаття
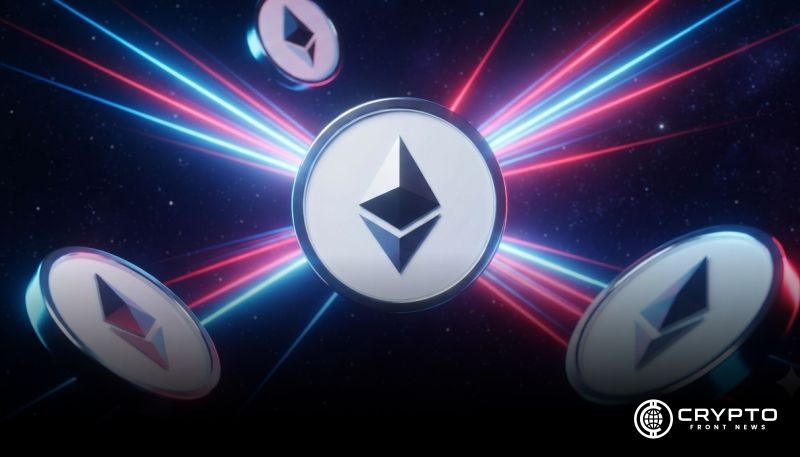
Ринкова капіталізація Ethereum скоротилася на $54 млрд: ETH тестує рівень $2 300За три тижні ринкова капіталізація Ethereum скоротилася на 54 мільярди доларів, а загальний відкритий інтерес на біржах знизився до 11,5 мільярда доларів.
Відкритий інтерес на Binance скоротився на 1,3 мільярда доларів — до 5,7 мільярда доларів, тоді як на Gate, HTX і Bybit також зафіксували значне місячне зниження.
ETH торгується поблизу позначки $2 304, а індикатори RSI та MACD сигналізують про спадний тренд; падіння нижче $2 300 може відкрити шлях до рівнів підтримки $2 250 і $2 200.
За три тижні ринкова капіталізація Ethereum скоротилася на 54 мільярди доларів, оскільки ETH упав приблизно на 15%, а трейдери деривативами зменшили свої позиції. Аналітик Darkfost повідомив, що загальний відкритий інтерес до Ethereum на біржах знизився до 11,5 мільярда доларів. Тим часом 26 жовтня ETH торгувався поблизу $2 304,53, а технічні індикатори вказували на збереження тиску продавців.
Ринкова капіталізація Ethereum скоротилася на $54 млрд: ETH тестує рівень $2 300
За три тижні ринкова капіталізація Ethereum скоротилася на 54 мільярди доларів, а загальний відкритий інтерес на біржах знизився до 11,5 мільярда доларів.
Відкритий інтерес на Binance скоротився на 1,3 мільярда доларів — до 5,7 мільярда доларів, тоді як на Gate, HTX і Bybit також зафіксували значне місячне зниження.
ETH торгується поблизу позначки $2 304, а індикатори RSI та MACD сигналізують про спадний тренд; падіння нижче $2 300 може відкрити шлях до рівнів підтримки $2 250 і $2 200.
За три тижні ринкова капіталізація Ethereum скоротилася на 54 мільярди доларів, оскільки ETH упав приблизно на 15%, а трейдери деривативами зменшили свої позиції. Аналітик Darkfost повідомив, що загальний відкритий інтерес до Ethereum на біржах знизився до 11,5 мільярда доларів. Тим часом 26 жовтня ETH торгувався поблизу $2 304,53, а технічні індикатори вказували на збереження тиску продавців.
Відкритий інтерес на Binance скоротився на 1,3 мільярда доларів — до 5,7 мільярда доларів, тоді як на Gate, HTX і Bybit також зафіксували значне місячне зниження.
ETH торгується поблизу позначки $2 304, а індикатори RSI та MACD сигналізують про спадний тренд; падіння нижче $2 300 може відкрити шлях до рівнів підтримки $2 250 і $2 200.
За три тижні ринкова капіталізація Ethereum скоротилася на 54 мільярди доларів, оскільки ETH упав приблизно на 15%, а трейдери деривативами зменшили свої позиції. Аналітик Darkfost повідомив, що загальний відкритий інтерес до Ethereum на біржах знизився до 11,5 мільярда доларів. Тим часом 26 жовтня ETH торгувався поблизу $2 304,53, а технічні індикатори вказували на збереження тиску продавців.
1
100
Стаття
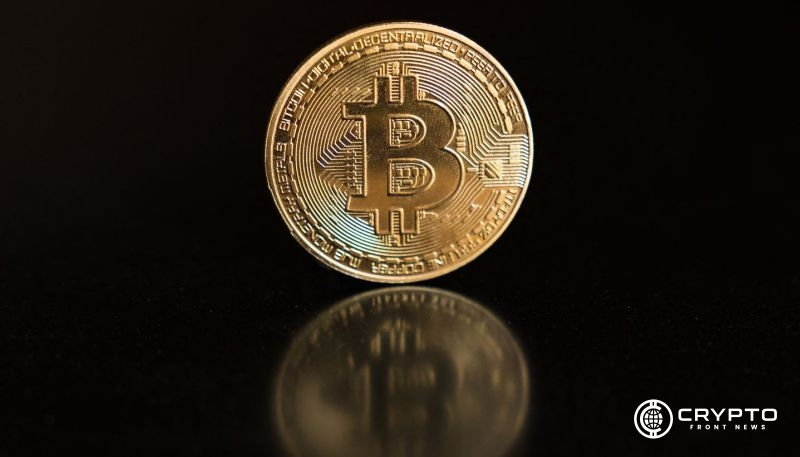
Кити Bitcoin стримують активність, тоді як депозити від роздрібних інвесторів майже подвоїлисяЗа 30 днів приплив Bitcoin від роздрібних інвесторів на Binance майже подвоївся — до $10.75 мільярда, тоді як депозити китів скоротилися з $5.9 мільярда до $3.8 мільярда.
Ali Charts визначає $82,000 як рівень опору, а $72,500 — як потенційний рівень для купівлі, якщо корекція Bitcoin продовжиться.
Найглибше просідання Bitcoin у поточному циклі сягнуло 7% порівняно зі зниженням на 28% або більше в попередніх завершених циклах.
Bitcoin може скоригуватися до $72,500, оскільки аналітик Ali Charts відстежує пробій нижче висхідного каналу. Тим часом дані Darkfost свідчать, що приплив Bitcoin від роздрібних інвесторів на Binance досяг шестимісячного максимуму, тоді як депозити китів продовжують скорочуватися. Ці протилежні тенденції спостерігаються на тлі того, що BTC утримується вище $80,000, а аналітики оцінюють просідання в поточному ринковому циклі.
Кити Bitcoin стримують активність, тоді як депозити від роздрібних інвесторів майже подвоїлися
За 30 днів приплив Bitcoin від роздрібних інвесторів на Binance майже подвоївся — до $10.75 мільярда, тоді як депозити китів скоротилися з $5.9 мільярда до $3.8 мільярда.
Ali Charts визначає $82,000 як рівень опору, а $72,500 — як потенційний рівень для купівлі, якщо корекція Bitcoin продовжиться.
Найглибше просідання Bitcoin у поточному циклі сягнуло 7% порівняно зі зниженням на 28% або більше в попередніх завершених циклах.
Bitcoin може скоригуватися до $72,500, оскільки аналітик Ali Charts відстежує пробій нижче висхідного каналу. Тим часом дані Darkfost свідчать, що приплив Bitcoin від роздрібних інвесторів на Binance досяг шестимісячного максимуму, тоді як депозити китів продовжують скорочуватися. Ці протилежні тенденції спостерігаються на тлі того, що BTC утримується вище $80,000, а аналітики оцінюють просідання в поточному ринковому циклі.
Ali Charts визначає $82,000 як рівень опору, а $72,500 — як потенційний рівень для купівлі, якщо корекція Bitcoin продовжиться.
Найглибше просідання Bitcoin у поточному циклі сягнуло 7% порівняно зі зниженням на 28% або більше в попередніх завершених циклах.
Bitcoin може скоригуватися до $72,500, оскільки аналітик Ali Charts відстежує пробій нижче висхідного каналу. Тим часом дані Darkfost свідчать, що приплив Bitcoin від роздрібних інвесторів на Binance досяг шестимісячного максимуму, тоді як депозити китів продовжують скорочуватися. Ці протилежні тенденції спостерігаються на тлі того, що BTC утримується вище $80,000, а аналітики оцінюють просідання в поточному ринковому циклі.
1
242
Стаття
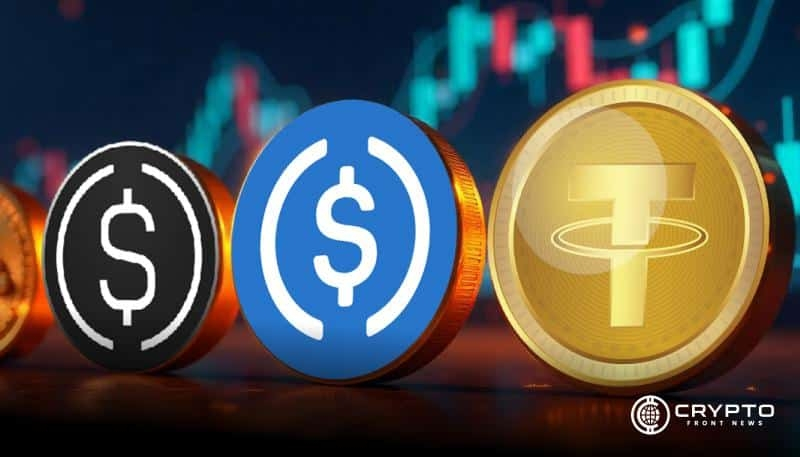
Сінгапур, Малайзія та Таїланд розширюють використання цифрових грошейУправління грошово-кредитної політики Сінгапуру, Банк Негара Малайзії та Банк Таїланду співпрацюватимуть із представниками галузі над транскордонними розрахунками цифровими грошима.
BLOOM охоплюватиме приймання цифрових грошей, транскордонні розрахунки, сумісність мереж і програмовані механізми контролю, зокрема перевірки особи та санкцій.
Ripple, Visa, Mastercard і Група Світового банку — серед учасників, які вивчають можливості застосування цифрових грошей у сфері платежів, казначейських операцій і торговельного фінансування.
Сінгапур, Малайзія та Таїланд співпрацюватимуть із фінансовими компаніями над транскордонними розрахунками цифровими грошима. Управління грошово-кредитної політики Сінгапуру оголосило про запуск BLOOM 23 жовтня. Банк Негара Малайзії та Банк Таїланду приєдналися як учасники від органів, що формують політику. Вони допомагатимуть розробляти підходи до регульованих стейблкоїнів і токенізованих депозитів у різних установах і юрисдикціях.
Сінгапур, Малайзія та Таїланд розширюють використання цифрових грошей
Управління грошово-кредитної політики Сінгапуру, Банк Негара Малайзії та Банк Таїланду співпрацюватимуть із представниками галузі над транскордонними розрахунками цифровими грошима.
BLOOM охоплюватиме приймання цифрових грошей, транскордонні розрахунки, сумісність мереж і програмовані механізми контролю, зокрема перевірки особи та санкцій.
Ripple, Visa, Mastercard і Група Світового банку — серед учасників, які вивчають можливості застосування цифрових грошей у сфері платежів, казначейських операцій і торговельного фінансування.
Сінгапур, Малайзія та Таїланд співпрацюватимуть із фінансовими компаніями над транскордонними розрахунками цифровими грошима. Управління грошово-кредитної політики Сінгапуру оголосило про запуск BLOOM 23 жовтня. Банк Негара Малайзії та Банк Таїланду приєдналися як учасники від органів, що формують політику. Вони допомагатимуть розробляти підходи до регульованих стейблкоїнів і токенізованих депозитів у різних установах і юрисдикціях.
BLOOM охоплюватиме приймання цифрових грошей, транскордонні розрахунки, сумісність мереж і програмовані механізми контролю, зокрема перевірки особи та санкцій.
Ripple, Visa, Mastercard і Група Світового банку — серед учасників, які вивчають можливості застосування цифрових грошей у сфері платежів, казначейських операцій і торговельного фінансування.
Сінгапур, Малайзія та Таїланд співпрацюватимуть із фінансовими компаніями над транскордонними розрахунками цифровими грошима. Управління грошово-кредитної політики Сінгапуру оголосило про запуск BLOOM 23 жовтня. Банк Негара Малайзії та Банк Таїланду приєдналися як учасники від органів, що формують політику. Вони допомагатимуть розробляти підходи до регульованих стейблкоїнів і токенізованих депозитів у різних установах і юрисдикціях.
320

Стаття
HTX внесла Росію до переліку юрисдикцій з обмеженнями після Bitget і MEXCHTX внесла Росію до переліку юрисдикцій з обмеженнями, що може обмежити доступ до рахунків і можливість виведення коштів для відповідних фізичних осіб і компаній.
У жовтні Bitget і MEXC також обмежили доступ до російського ринку, посилаючись на заборонені юрисдикції та вимоги дотримання нормативних актів.
Аналітики вказують на зростання регуляторних ризиків і ризиків, пов’язаних із санкціями, хоча доказів скоординованих дій бірж немає.
HTX внесла Росію до переліку юрисдикцій з обмеженнями, що дає змогу криптовалютній біржі обмежувати послуги для російських користувачів. За даними російського ділового видання РБК, обмеження поширюються на фізичних осіб, які проживають у Росії або перебувають там, а також на компанії, зареєстровані в Росії або ті, що ведуть там основну діяльність. Це рішення ухвалено після аналогічних кроків Bitget і MEXC у жовтні, хоча дата набуття чинності обмеженнями HTX поки не визначена.
HTX внесла Росію до переліку юрисдикцій з обмеженнями після Bitget і MEXC
HTX внесла Росію до переліку юрисдикцій з обмеженнями, що може обмежити доступ до рахунків і можливість виведення коштів для відповідних фізичних осіб і компаній.
У жовтні Bitget і MEXC також обмежили доступ до російського ринку, посилаючись на заборонені юрисдикції та вимоги дотримання нормативних актів.
Аналітики вказують на зростання регуляторних ризиків і ризиків, пов’язаних із санкціями, хоча доказів скоординованих дій бірж немає.
HTX внесла Росію до переліку юрисдикцій з обмеженнями, що дає змогу криптовалютній біржі обмежувати послуги для російських користувачів. За даними російського ділового видання РБК, обмеження поширюються на фізичних осіб, які проживають у Росії або перебувають там, а також на компанії, зареєстровані в Росії або ті, що ведуть там основну діяльність. Це рішення ухвалено після аналогічних кроків Bitget і MEXC у жовтні, хоча дата набуття чинності обмеженнями HTX поки не визначена.
У жовтні Bitget і MEXC також обмежили доступ до російського ринку, посилаючись на заборонені юрисдикції та вимоги дотримання нормативних актів.
Аналітики вказують на зростання регуляторних ризиків і ризиків, пов’язаних із санкціями, хоча доказів скоординованих дій бірж немає.
HTX внесла Росію до переліку юрисдикцій з обмеженнями, що дає змогу криптовалютній біржі обмежувати послуги для російських користувачів. За даними російського ділового видання РБК, обмеження поширюються на фізичних осіб, які проживають у Росії або перебувають там, а також на компанії, зареєстровані в Росії або ті, що ведуть там основну діяльність. Це рішення ухвалено після аналогічних кроків Bitget і MEXC у жовтні, хоча дата набуття чинності обмеженнями HTX поки не визначена.
74
Стаття
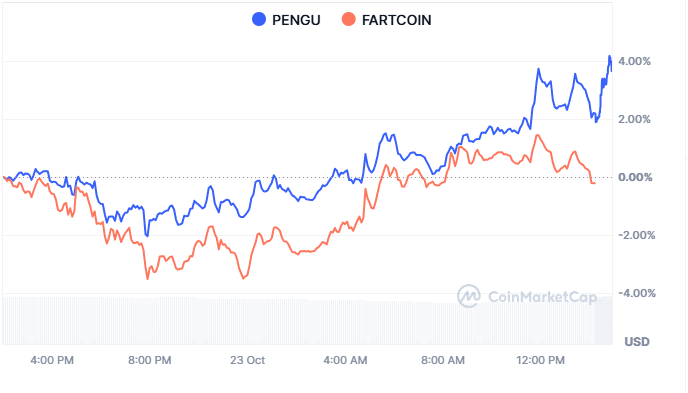
Графік PENGU демонструє ознаки можливого розворотуPENGU двічі відскакував поблизу діапазону $0.0067–$0.0070, що свідчить про можливе формування бази після кількох місяців низхідного тиску.
PENGU краще відіграв нічні втрати й продемонстрував вищу денну динаміку, ніж FARTCOIN, за підсумками останньої торгової сесії.
Тривале зростання вище найближчого рівня опору може посилити аргументи на користь розвороту, тоді як поновлення продажів нижче рівня підтримки послабить поточну картину.
Після кількох місяців продажів PENGU демонструє ознаки можливого розвороту: ціна неодноразово відскакувала від рівня підтримки, а короткострокова динаміка посилилася.
Графік PENGU демонструє ознаки можливого розвороту
PENGU двічі відскакував поблизу діапазону $0.0067–$0.0070, що свідчить про можливе формування бази після кількох місяців низхідного тиску.
PENGU краще відіграв нічні втрати й продемонстрував вищу денну динаміку, ніж FARTCOIN, за підсумками останньої торгової сесії.
Тривале зростання вище найближчого рівня опору може посилити аргументи на користь розвороту, тоді як поновлення продажів нижче рівня підтримки послабить поточну картину.
Після кількох місяців продажів PENGU демонструє ознаки можливого розвороту: ціна неодноразово відскакувала від рівня підтримки, а короткострокова динаміка посилилася.
PENGU краще відіграв нічні втрати й продемонстрував вищу денну динаміку, ніж FARTCOIN, за підсумками останньої торгової сесії.
Тривале зростання вище найближчого рівня опору може посилити аргументи на користь розвороту, тоді як поновлення продажів нижче рівня підтримки послабить поточну картину.
Після кількох місяців продажів PENGU демонструє ознаки можливого розвороту: ціна неодноразово відскакувала від рівня підтримки, а короткострокова динаміка посилилася.
486
Стаття
Ethereum випробовує рівень $2,300, а Glamsterdam наближається до запуску тестової мережіETH торгується поблизу $2,335; RSI становить 38.93, а гістограма MACD має від’ємне значення. Рівень підтримки — близько 2,300–2,330.
Майкл ван де Поппе визначає $2,320 і $2,230 як потенційні рівні для відкриття довгих позицій, якщо Ethereum продовжить падати.
Crypto Patel зазначає, що комісії за газ становлять $0.004, а Glamsterdam наближається до важливої віхи в тестовій мережі Hoodi; питання безпеки та сумісності все ще розглядаються.
Ethereum торгується поблизу $2,335, а ведмежий імпульс штовхає ETH до рівня підтримки $2,300. Аналітики стежать за потенційними рівнями для входу в ринок і розвитком мережі. Майкл ван де Поппе назвав $2,320 і $2,230 можливими рівнями для відкриття довгих позицій на тлі слабкості ринку. Тим часом Crypto Patel зазначив, що комісії за газ становлять $0.004, а розробники наближаються до важливої віхи в тестовій мережі Glamsterdam.
Ethereum випробовує рівень $2,300, а Glamsterdam наближається до запуску тестової мережі
ETH торгується поблизу $2,335; RSI становить 38.93, а гістограма MACD має від’ємне значення. Рівень підтримки — близько 2,300–2,330.
Майкл ван де Поппе визначає $2,320 і $2,230 як потенційні рівні для відкриття довгих позицій, якщо Ethereum продовжить падати.
Crypto Patel зазначає, що комісії за газ становлять $0.004, а Glamsterdam наближається до важливої віхи в тестовій мережі Hoodi; питання безпеки та сумісності все ще розглядаються.
Ethereum торгується поблизу $2,335, а ведмежий імпульс штовхає ETH до рівня підтримки $2,300. Аналітики стежать за потенційними рівнями для входу в ринок і розвитком мережі. Майкл ван де Поппе назвав $2,320 і $2,230 можливими рівнями для відкриття довгих позицій на тлі слабкості ринку. Тим часом Crypto Patel зазначив, що комісії за газ становлять $0.004, а розробники наближаються до важливої віхи в тестовій мережі Glamsterdam.
Майкл ван де Поппе визначає $2,320 і $2,230 як потенційні рівні для відкриття довгих позицій, якщо Ethereum продовжить падати.
Crypto Patel зазначає, що комісії за газ становлять $0.004, а Glamsterdam наближається до важливої віхи в тестовій мережі Hoodi; питання безпеки та сумісності все ще розглядаються.
Ethereum торгується поблизу $2,335, а ведмежий імпульс штовхає ETH до рівня підтримки $2,300. Аналітики стежать за потенційними рівнями для входу в ринок і розвитком мережі. Майкл ван де Поппе назвав $2,320 і $2,230 можливими рівнями для відкриття довгих позицій на тлі слабкості ринку. Тим часом Crypto Patel зазначив, що комісії за газ становлять $0.004, а розробники наближаються до важливої віхи в тестовій мережі Glamsterdam.
167
Стаття
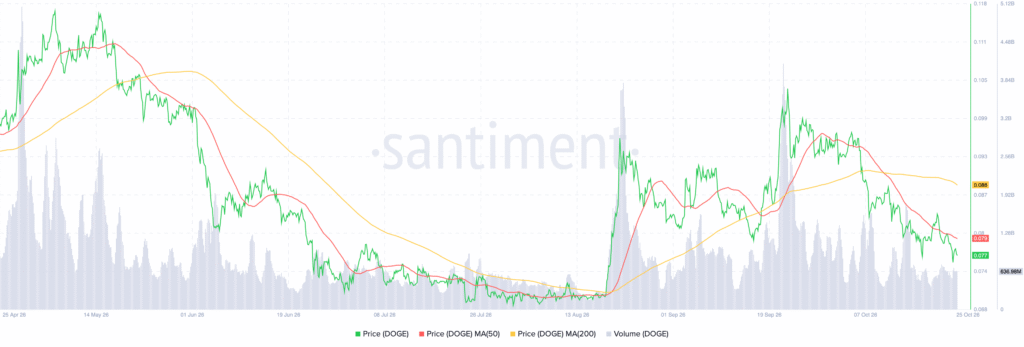
Dogecoin націлився на $0,70: аналітики стежать за моделями прориву та ключовим опоромDOGE торгується поблизу $0,077, нижче своїх 50-денної та 200-денної ковзних середніх; найближча зона підтримки — від $0,075 до $0,077.
Джанніс Андреу бачить потенційний шлях до $0,70, якщо DOGE втримується на рівні 0,07–0,08 і пробиває послідовні рівні опору.
Трейдер Tardigrade порівнює місячний графік Dogecoin зі структурою 2015–2017 років, припускаючи можливий прорив, але не називаючи його дату.
Dogecoin торгується поблизу $0,077 після жовтневих втрат, які нівелювали значну частину відновлення в серпні та вересні, тоді як аналітики стежать за потенційними довгостроковими моделями прориву. Джанніс Андреу окреслив можливий шлях до $0,70, якщо DOGE подолає кілька рівнів опору. Тим часом трейдер Tardigrade порівняв місячну структуру Dogecoin із ціновою моделлю 2015–2017 років.
Dogecoin націлився на $0,70: аналітики стежать за моделями прориву та ключовим опором
DOGE торгується поблизу $0,077, нижче своїх 50-денної та 200-денної ковзних середніх; найближча зона підтримки — від $0,075 до $0,077.
Джанніс Андреу бачить потенційний шлях до $0,70, якщо DOGE втримується на рівні 0,07–0,08 і пробиває послідовні рівні опору.
Трейдер Tardigrade порівнює місячний графік Dogecoin зі структурою 2015–2017 років, припускаючи можливий прорив, але не називаючи його дату.
Dogecoin торгується поблизу $0,077 після жовтневих втрат, які нівелювали значну частину відновлення в серпні та вересні, тоді як аналітики стежать за потенційними довгостроковими моделями прориву. Джанніс Андреу окреслив можливий шлях до $0,70, якщо DOGE подолає кілька рівнів опору. Тим часом трейдер Tardigrade порівняв місячну структуру Dogecoin із ціновою моделлю 2015–2017 років.
Джанніс Андреу бачить потенційний шлях до $0,70, якщо DOGE втримується на рівні 0,07–0,08 і пробиває послідовні рівні опору.
Трейдер Tardigrade порівнює місячний графік Dogecoin зі структурою 2015–2017 років, припускаючи можливий прорив, але не називаючи його дату.
Dogecoin торгується поблизу $0,077 після жовтневих втрат, які нівелювали значну частину відновлення в серпні та вересні, тоді як аналітики стежать за потенційними довгостроковими моделями прориву. Джанніс Андреу окреслив можливий шлях до $0,70, якщо DOGE подолає кілька рівнів опору. Тим часом трейдер Tardigrade порівняв місячну структуру Dogecoin із ціновою моделлю 2015–2017 років.
2
435
Стаття
Довгострокові власники Bitcoin продають, поки BTC тестує підтримку на рівні $80KЗ серпня пропозиція Bitcoin у довгострокових власників скоротилася на 300,000 BTC, а її середня зміна за 30 днів сягнула мінус 195,000 BTC.
BTC торгується поблизу $80,535, тоді як RSI залишається нижче 50, а MACD — у негативній зоні, що свідчить про слабкий імпульс і подальший тиск з боку продавців.
Bitcoin знаходить підтримку на рівнях $80,000 і $79,000, а повернення вище $82,000 може відкрити шлях до відновлення в напрямку 83,000–84,000.
Bitcoin наближається до $80,000, оскільки довгострокові власники скорочують свої запаси, посилюючи тиск з боку продавців на ринку, який і без того слабшає. Аналітик Darkfost повідомив, що з серпня пропозиція Bitcoin у довгострокових власників скоротилася на 300,000 BTC, а її середня зміна за 30 днів становить мінус 195,000 BTC. Тим часом чотиригодинний графік Bitcoin свідчить про неодноразові відхилення від рівня опору та слабкий імпульс.
Довгострокові власники Bitcoin продають, поки BTC тестує підтримку на рівні $80K
З серпня пропозиція Bitcoin у довгострокових власників скоротилася на 300,000 BTC, а її середня зміна за 30 днів сягнула мінус 195,000 BTC.
BTC торгується поблизу $80,535, тоді як RSI залишається нижче 50, а MACD — у негативній зоні, що свідчить про слабкий імпульс і подальший тиск з боку продавців.
Bitcoin знаходить підтримку на рівнях $80,000 і $79,000, а повернення вище $82,000 може відкрити шлях до відновлення в напрямку 83,000–84,000.
Bitcoin наближається до $80,000, оскільки довгострокові власники скорочують свої запаси, посилюючи тиск з боку продавців на ринку, який і без того слабшає. Аналітик Darkfost повідомив, що з серпня пропозиція Bitcoin у довгострокових власників скоротилася на 300,000 BTC, а її середня зміна за 30 днів становить мінус 195,000 BTC. Тим часом чотиригодинний графік Bitcoin свідчить про неодноразові відхилення від рівня опору та слабкий імпульс.
BTC торгується поблизу $80,535, тоді як RSI залишається нижче 50, а MACD — у негативній зоні, що свідчить про слабкий імпульс і подальший тиск з боку продавців.
Bitcoin знаходить підтримку на рівнях $80,000 і $79,000, а повернення вище $82,000 може відкрити шлях до відновлення в напрямку 83,000–84,000.
Bitcoin наближається до $80,000, оскільки довгострокові власники скорочують свої запаси, посилюючи тиск з боку продавців на ринку, який і без того слабшає. Аналітик Darkfost повідомив, що з серпня пропозиція Bitcoin у довгострокових власників скоротилася на 300,000 BTC, а її середня зміна за 30 днів становить мінус 195,000 BTC. Тим часом чотиригодинний графік Bitcoin свідчить про неодноразові відхилення від рівня опору та слабкий імпульс.
582
Стаття
Cardano загрожує падіння на 20% після пробиття ключового рівня підтримки ADA — аналітикАналітик попереджає: ADA може впасти на 20% — до $0,166, якщо опір на рівні $0,220 втримається після пробиття нижньої межі висхідного цінового каналу.
RSI Cardano становить 34,77, а MACD залишається негативним, що свідчить про тривалий тиск продавців, оскільки ADA торгується поблизу $0,2056.
Німецький DZ BANK додав Cardano до платформи meinKrypto поряд із Bitcoin, Ethereum і Litecoin; рішення про впровадження ухвалюватимуть банки-учасники.
Cardano може впасти на 20% — до $0,166 — після того, як аналітик Ali Charts повідомив про пробиття нижньої межі висхідного цінового каналу. ADA також продовжує торгуватися поблизу $0,20, а на чотиригодинному графіку спостерігається ведмежий імпульс. Тим часом німецький DZ BANK додав Cardano до переліку чотирьох криптовалют, доступних через платформу meinKrypto.
Cardano загрожує падіння на 20% після пробиття ключового рівня підтримки ADA — аналітик
Аналітик попереджає: ADA може впасти на 20% — до $0,166, якщо опір на рівні $0,220 втримається після пробиття нижньої межі висхідного цінового каналу.
RSI Cardano становить 34,77, а MACD залишається негативним, що свідчить про тривалий тиск продавців, оскільки ADA торгується поблизу $0,2056.
Німецький DZ BANK додав Cardano до платформи meinKrypto поряд із Bitcoin, Ethereum і Litecoin; рішення про впровадження ухвалюватимуть банки-учасники.
Cardano може впасти на 20% — до $0,166 — після того, як аналітик Ali Charts повідомив про пробиття нижньої межі висхідного цінового каналу. ADA також продовжує торгуватися поблизу $0,20, а на чотиригодинному графіку спостерігається ведмежий імпульс. Тим часом німецький DZ BANK додав Cardano до переліку чотирьох криптовалют, доступних через платформу meinKrypto.
RSI Cardano становить 34,77, а MACD залишається негативним, що свідчить про тривалий тиск продавців, оскільки ADA торгується поблизу $0,2056.
Німецький DZ BANK додав Cardano до платформи meinKrypto поряд із Bitcoin, Ethereum і Litecoin; рішення про впровадження ухвалюватимуть банки-учасники.
Cardano може впасти на 20% — до $0,166 — після того, як аналітик Ali Charts повідомив про пробиття нижньої межі висхідного цінового каналу. ADA також продовжує торгуватися поблизу $0,20, а на чотиригодинному графіку спостерігається ведмежий імпульс. Тим часом німецький DZ BANK додав Cardano до переліку чотирьох криптовалют, доступних через платформу meinKrypto.
2
367
Стаття
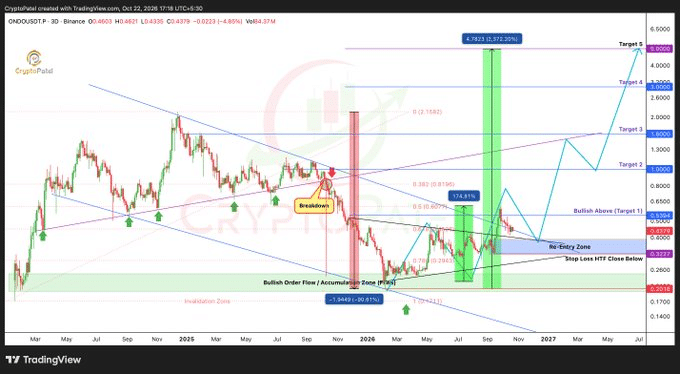
ONDO стикається з опором, а відновлення сповільнюєтьсяONDO торгується поблизу $0.433 після зниження, а рівень $0.435 виступає короткостроковим бар’єром для покупців, які прагнуть відновлення ціни.
Потоки на біржах демонструють різкі припливи та відпливи під час нещодавніх ралі, тож напрямок руху ONDO на ринку залишається невизначеним, оскільки ціна відступає від свого піку.
Зона повторного входу $0.39–$0.33 залишається важливою, тоді як закриття свічки на старшому таймфреймі нижче $0.32 скасує описаний сценарій.
Динаміка ціни ONDO залишається ведмежою: після відскоку від максимуму ціна не змогла втриматися на цьому рівні, а трейдери торгують, орієнтуючись на найближчі рівні підтримки та опору.
ONDO стикається з опором, а відновлення сповільнюється
ONDO торгується поблизу $0.433 після зниження, а рівень $0.435 виступає короткостроковим бар’єром для покупців, які прагнуть відновлення ціни.
Потоки на біржах демонструють різкі припливи та відпливи під час нещодавніх ралі, тож напрямок руху ONDO на ринку залишається невизначеним, оскільки ціна відступає від свого піку.
Зона повторного входу $0.39–$0.33 залишається важливою, тоді як закриття свічки на старшому таймфреймі нижче $0.32 скасує описаний сценарій.
Динаміка ціни ONDO залишається ведмежою: після відскоку від максимуму ціна не змогла втриматися на цьому рівні, а трейдери торгують, орієнтуючись на найближчі рівні підтримки та опору.
Потоки на біржах демонструють різкі припливи та відпливи під час нещодавніх ралі, тож напрямок руху ONDO на ринку залишається невизначеним, оскільки ціна відступає від свого піку.
Зона повторного входу $0.39–$0.33 залишається важливою, тоді як закриття свічки на старшому таймфреймі нижче $0.32 скасує описаний сценарій.
Динаміка ціни ONDO залишається ведмежою: після відскоку від максимуму ціна не змогла втриматися на цьому рівні, а трейдери торгують, орієнтуючись на найближчі рівні підтримки та опору.
400
Верифіковано
Стаття
Arf і Ripple забезпечують XRPL ліквідністю для розрахунків у RLUSDArf і Ripple планують використовувати RLUSD у мережі XRPL, щоб надавати компаніям, які мають ліцензію на здійснення транскордонних платежів, короткострокову ліквідність для розрахунків.
За даними Arf, річний обсяг розрахунків становить приблизно 10 мільярдів доларів, а ліквідність зазвичай повертається протягом одного-п’яти днів.
Майбутня інтеграція з нативним протоколом кредитування XRPL залежить від схвалення поправок XLS-65 і XLS-66 до активації основної мережі.
Arf і Ripple об’єднують зусилля, щоб надавати компаніям, які мають ліцензію на здійснення транскордонних платежів у мережі XRP Ledger (XRPL), ліквідність для розрахунків у RLUSD. Ця домовленість забезпечить короткостроковий оборотний капітал на час проведення міжнародних платежів, задовольняючи потреби у фінансуванні на різних ринках. За даними Arf, річний обсяг розрахунків становить близько 10 мільярдів доларів, а капітал обертається чотири рази на місяць.
Arf і Ripple забезпечують XRPL ліквідністю для розрахунків у RLUSD
Arf і Ripple планують використовувати RLUSD у мережі XRPL, щоб надавати компаніям, які мають ліцензію на здійснення транскордонних платежів, короткострокову ліквідність для розрахунків.
За даними Arf, річний обсяг розрахунків становить приблизно 10 мільярдів доларів, а ліквідність зазвичай повертається протягом одного-п’яти днів.
Майбутня інтеграція з нативним протоколом кредитування XRPL залежить від схвалення поправок XLS-65 і XLS-66 до активації основної мережі.
Arf і Ripple об’єднують зусилля, щоб надавати компаніям, які мають ліцензію на здійснення транскордонних платежів у мережі XRP Ledger (XRPL), ліквідність для розрахунків у RLUSD. Ця домовленість забезпечить короткостроковий оборотний капітал на час проведення міжнародних платежів, задовольняючи потреби у фінансуванні на різних ринках. За даними Arf, річний обсяг розрахунків становить близько 10 мільярдів доларів, а капітал обертається чотири рази на місяць.
За даними Arf, річний обсяг розрахунків становить приблизно 10 мільярдів доларів, а ліквідність зазвичай повертається протягом одного-п’яти днів.
Майбутня інтеграція з нативним протоколом кредитування XRPL залежить від схвалення поправок XLS-65 і XLS-66 до активації основної мережі.
Arf і Ripple об’єднують зусилля, щоб надавати компаніям, які мають ліцензію на здійснення транскордонних платежів у мережі XRP Ledger (XRPL), ліквідність для розрахунків у RLUSD. Ця домовленість забезпечить короткостроковий оборотний капітал на час проведення міжнародних платежів, задовольняючи потреби у фінансуванні на різних ринках. За даними Arf, річний обсяг розрахунків становить близько 10 мільярдів доларів, а капітал обертається чотири рази на місяць.
110
Частково правда

Стаття
NEAR зіткнувся з критикою конфіденційності з боку засновника ICP, а TVL сягнув 244 млн доларівЗа даними звіту, загальна заблокована вартість у NEAR становить 244 мільйони доларів, тоді як у ICP — 12 мільйонів, а на Confidential Intents припадає 171 мільйон доларів.
Засновник ICP Дом розкритикував модель конфіденційності NEAR і висловив занепокоєння щодо vetKeys, хоча ці звинувачення залишаються спірними.
NEAR відійшов до рівня підтримки після того, як не зміг закріпити жовтневе зростання: рівень 29%–30% виступає підтримкою, а 45%–50% і далі залишаються опором.
Загальна заблокована вартість (TVL) у мережі NEAR становить 244 мільйони доларів, порівняно з 12 мільйонами доларів у ICP, тоді як дискусії про технології приватності загострюються. У програмі Our Crypto Talk звернули увагу на цю різницю та на критику з боку засновника ICP Дома, який поставив під сумнів Confidential Intents від NEAR і висловив занепокоєння щодо vetKeys. Водночас графік NEAR свідчить про послаблення імпульсу після корекції від жовтневих максимумів.
NEAR зіткнувся з критикою конфіденційності з боку засновника ICP, а TVL сягнув 244 млн доларів
За даними звіту, загальна заблокована вартість у NEAR становить 244 мільйони доларів, тоді як у ICP — 12 мільйонів, а на Confidential Intents припадає 171 мільйон доларів.
Засновник ICP Дом розкритикував модель конфіденційності NEAR і висловив занепокоєння щодо vetKeys, хоча ці звинувачення залишаються спірними.
NEAR відійшов до рівня підтримки після того, як не зміг закріпити жовтневе зростання: рівень 29%–30% виступає підтримкою, а 45%–50% і далі залишаються опором.
Загальна заблокована вартість (TVL) у мережі NEAR становить 244 мільйони доларів, порівняно з 12 мільйонами доларів у ICP, тоді як дискусії про технології приватності загострюються. У програмі Our Crypto Talk звернули увагу на цю різницю та на критику з боку засновника ICP Дома, який поставив під сумнів Confidential Intents від NEAR і висловив занепокоєння щодо vetKeys. Водночас графік NEAR свідчить про послаблення імпульсу після корекції від жовтневих максимумів.
Засновник ICP Дом розкритикував модель конфіденційності NEAR і висловив занепокоєння щодо vetKeys, хоча ці звинувачення залишаються спірними.
NEAR відійшов до рівня підтримки після того, як не зміг закріпити жовтневе зростання: рівень 29%–30% виступає підтримкою, а 45%–50% і далі залишаються опором.
Загальна заблокована вартість (TVL) у мережі NEAR становить 244 мільйони доларів, порівняно з 12 мільйонами доларів у ICP, тоді як дискусії про технології приватності загострюються. У програмі Our Crypto Talk звернули увагу на цю різницю та на критику з боку засновника ICP Дома, який поставив під сумнів Confidential Intents від NEAR і висловив занепокоєння щодо vetKeys. Водночас графік NEAR свідчить про послаблення імпульсу після корекції від жовтневих максимумів.
1
915
Стаття
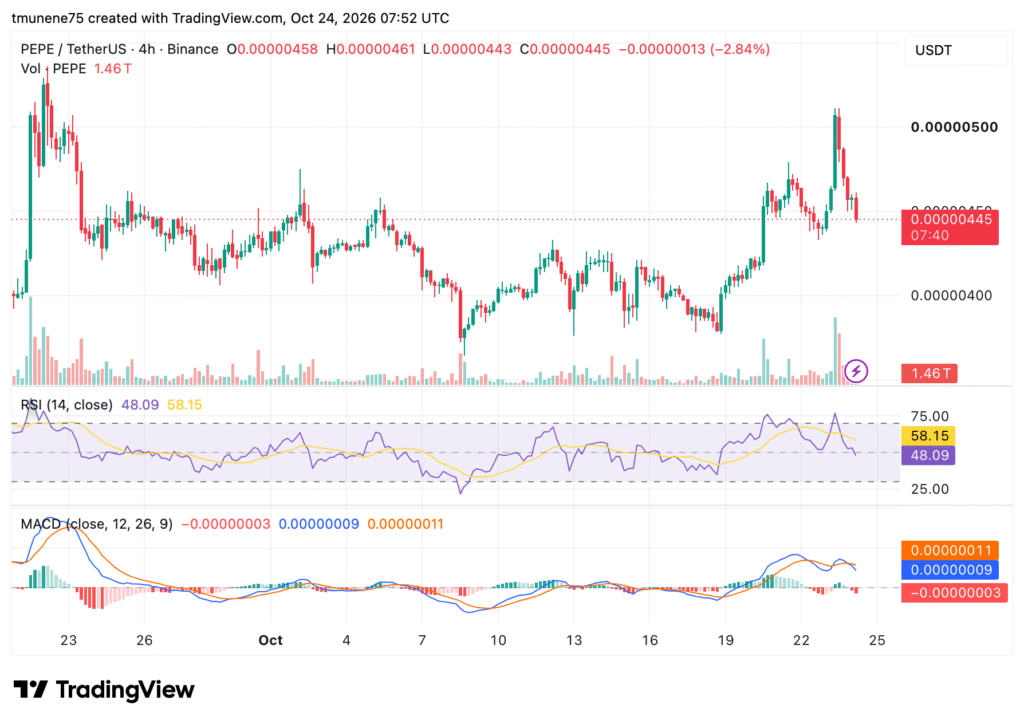
Ралі PEPE випробовує рівень $0.00000440 на тлі зміни біржових потоківЗ 17 до 22 жовтня PEPE зріс приблизно на 13%, але на біржі повернулося 2.11 трильйона токенів, нівелювавши понад 40% виведень від 16 жовтня.
PEPE відступив від $0.00000510 до $0.00000445, оскільки RSI знизився до 48.09, а MACD став від’ємним, сигналізуючи про ослаблення імпульсу.
Аналітик Янніс Андреу вважає $0.00000500 рівнем прориву, а $0.00000727 — можливим орієнтиром, якщо опір буде подолано й ціна втриматиметься вище під час повторного тестування.
У період з 17 до 22 жовтня PEPE зріс приблизно на 13%, але поновлення припливу токенів на біржі та ослаблення технічного імпульсу тепер ставлять під сумнів це ралі. Santiment Intelligence повідомила, що на біржі повернулося понад 40% із 4.77 трильйона токенів, виведених 16 жовтня. Тим часом аналітик Янніс Андреу виявив симетричний трикутник, а PEPE відступив від $0.00000510 до найближчого рівня підтримки.
Ралі PEPE випробовує рівень $0.00000440 на тлі зміни біржових потоків
З 17 до 22 жовтня PEPE зріс приблизно на 13%, але на біржі повернулося 2.11 трильйона токенів, нівелювавши понад 40% виведень від 16 жовтня.
PEPE відступив від $0.00000510 до $0.00000445, оскільки RSI знизився до 48.09, а MACD став від’ємним, сигналізуючи про ослаблення імпульсу.
Аналітик Янніс Андреу вважає $0.00000500 рівнем прориву, а $0.00000727 — можливим орієнтиром, якщо опір буде подолано й ціна втриматиметься вище під час повторного тестування.
У період з 17 до 22 жовтня PEPE зріс приблизно на 13%, але поновлення припливу токенів на біржі та ослаблення технічного імпульсу тепер ставлять під сумнів це ралі. Santiment Intelligence повідомила, що на біржі повернулося понад 40% із 4.77 трильйона токенів, виведених 16 жовтня. Тим часом аналітик Янніс Андреу виявив симетричний трикутник, а PEPE відступив від $0.00000510 до найближчого рівня підтримки.
PEPE відступив від $0.00000510 до $0.00000445, оскільки RSI знизився до 48.09, а MACD став від’ємним, сигналізуючи про ослаблення імпульсу.
Аналітик Янніс Андреу вважає $0.00000500 рівнем прориву, а $0.00000727 — можливим орієнтиром, якщо опір буде подолано й ціна втриматиметься вище під час повторного тестування.
У період з 17 до 22 жовтня PEPE зріс приблизно на 13%, але поновлення припливу токенів на біржі та ослаблення технічного імпульсу тепер ставлять під сумнів це ралі. Santiment Intelligence повідомила, що на біржі повернулося понад 40% із 4.77 трильйона токенів, виведених 16 жовтня. Тим часом аналітик Янніс Андреу виявив симетричний трикутник, а PEPE відступив від $0.00000510 до найближчого рівня підтримки.
300
Увійдіть, щоб переглянути інший контент
Приєднуйтесь до користувачів криптовалют по всьому світу на Binance Square
⚡️ Отримуйте актуальну та корисну інформацію про криптовалюти.
💬 Приєднуйтесь до найбільшої у світі криптобіржі.
👍 Відкрийте справжні ідеї від перевірених авторів.
Електронна пошта / номер телефону
Трендові теми
BinancePick
3.1M переглядів
152,925 обговорюють
Приєднуйтеся до #СезонуЗвітності: прогнозуйте результати на Binance Pick і діліться своєю думкою на Binance Square!
Binance Square Official
·411 вподобань
·343.2k переглядів
EarningsSeason
5.3M переглядів
26,011 обговорюють
fomcвідстеження
87,346 переглядів
444 обговорюють