
Muhamamd Adeel
524 Публікації

Muhamamd Adeel
Поскаржитись
Заблокувати користувача
Daily provide Latest News.
10 Підписки
52 Підписники
59 Вподобань
Публікації
Усі
Цитування
Стаття
Переглянути переклад
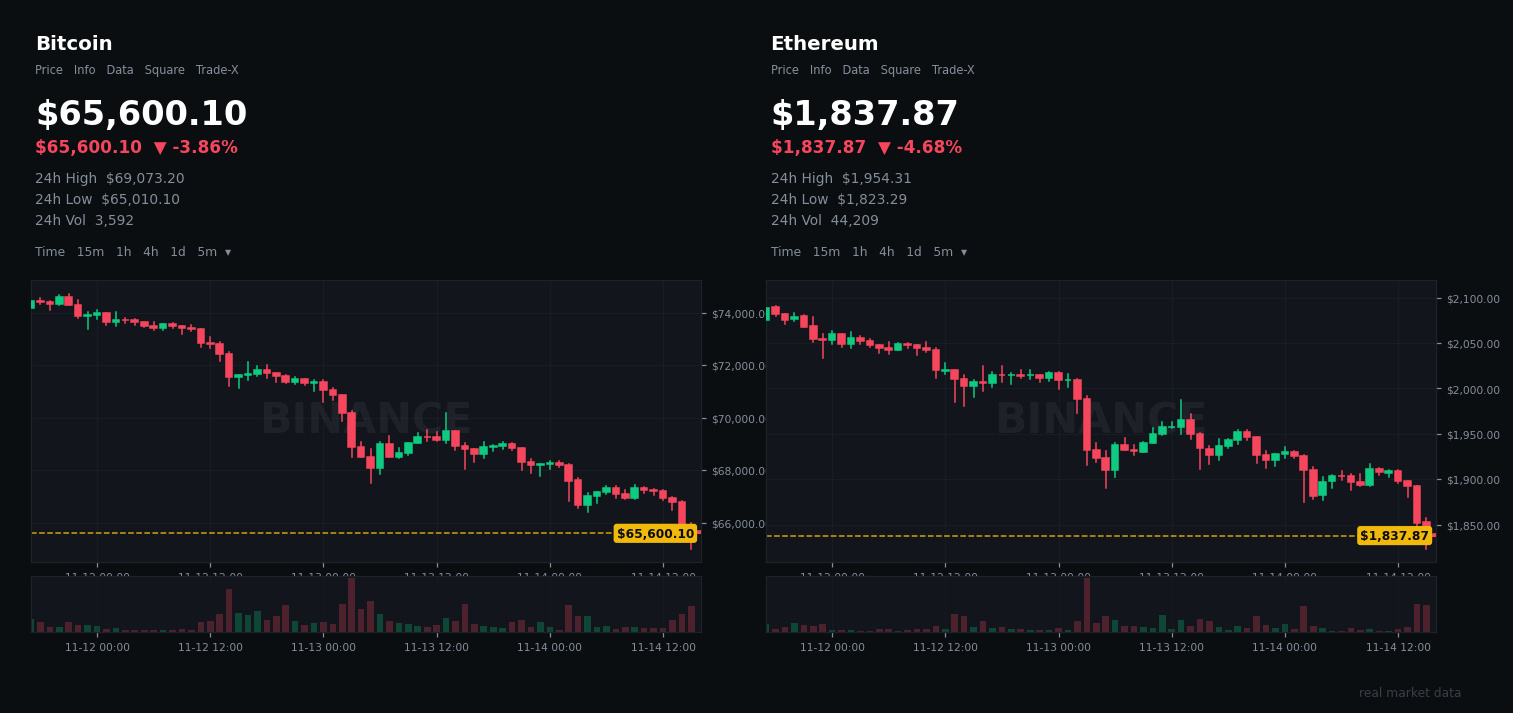
Bitcoin Crashed to $66K — Whales Are Buying While You're PanickingBitcoin just crashed to $66,000 — and the Fear & Greed Index is sitting at 13. Extreme Fear.
But look at what the chain is actually saying, because the biggest wallets are NOT doing what you'd expect.
Here's the split nobody is talking about.
THE CASH LEFT FIRST
The money to buy the dip walked out before this crash even started. Stablecoin supply shrank $14.2 billion in 30 days — the biggest drain since the Terra collapse in June 2022. Glassnode put it bluntly: the market now has "less fuel for a rally."
The ETF money agrees. US spot Bitcoin ETFs have bled for 7 straight days — $1.91 billion gone, with BlackRock's IBIT doing most of the damage. And $1.23 billion in leveraged positions got liquidated in 24 hours, over 80% of them longs.
Now the other side.
THE WHALES AREN'T SELLING — THEY'RE WITHDRAWING
Today a whale pulled another 441 BTC (~$29M) off Binance. That wallet now holds 1,735 BTC (~$115M) built up over five months. And exchanges saw a NET OUTFLOW of nearly 5,700 BTC in 24 hours — coins are leaving, not flooding in.
So who IS selling? The recent buyers. CryptoQuant data shows 47,300 BTC hit exchanges at a loss in a single day, versus just 1,100 BTC at a profit. Over 85% of the realized selling came from people who bought near $80,000. Long-term holders barely moved — coins held a year or more actually GREW to almost 65% of supply.
Weak hands capitulating at a loss. Strong hands quietly accumulating underneath.
CryptoQuant's Bull Score just hit 0. And yet Willy Woo's take is worth hearing: "We've NEVER seen fear in a bear market unless new lows are being made."
LEVELS THAT DECIDE IT
Whale buy orders cluster in two zones: $68,000–$72,500 above, and $62,000–$66,000 below. That lower zone is the line in the sand. Lose $64,000 and the flush deepens. Reclaim $68,000, then $70,000, and the tone changes — but $75,600 is the real ceiling, where short-term holders bought in.
Check the $BTC chart — the next few closes around $66K will tell you which side of this split wins.
WHAT HISTORY SAYS ABOUT FEAR AT 13
Extreme fear marked some of the best entries of the last six years — March 2020, March 2023, November 2022. But almost never on day one. June 2022 printed single-digit fear too, and Bitcoin kept falling for five more months.
My honest take: the sellers are exhausted retail, not institutions. The buyers' cash is gone, but supply is tightening and whales are buying the fear. The bottom isn't necessarily in today — but the setup is forming. Watch for stablecoin supply growing again, and ETF flows turning green on Monday.
$ETH just lost $2,000 for the first time since August, yet its ETFs quietly printed their first inflow in a week. And $SOL will move hardest in either direction when the fear breaks.
The crowd is terrified. The chain is telling a different story. Which one do you trust?
Not financial advice. DYOR.
Bitcoin Crashed to $66K — Whales Are Buying While You're Panicking
Bitcoin just crashed to $66,000 — and the Fear & Greed Index is sitting at 13. Extreme Fear.
But look at what the chain is actually saying, because the biggest wallets are NOT doing what you'd expect.
Here's the split nobody is talking about.
THE CASH LEFT FIRST
The money to buy the dip walked out before this crash even started. Stablecoin supply shrank $14.2 billion in 30 days — the biggest drain since the Terra collapse in June 2022. Glassnode put it bluntly: the market now has "less fuel for a rally."
The ETF money agrees. US spot Bitcoin ETFs have bled for 7 straight days — $1.91 billion gone, with BlackRock's IBIT doing most of the damage. And $1.23 billion in leveraged positions got liquidated in 24 hours, over 80% of them longs.
Now the other side.
THE WHALES AREN'T SELLING — THEY'RE WITHDRAWING
Today a whale pulled another 441 BTC (~$29M) off Binance. That wallet now holds 1,735 BTC (~$115M) built up over five months. And exchanges saw a NET OUTFLOW of nearly 5,700 BTC in 24 hours — coins are leaving, not flooding in.
So who IS selling? The recent buyers. CryptoQuant data shows 47,300 BTC hit exchanges at a loss in a single day, versus just 1,100 BTC at a profit. Over 85% of the realized selling came from people who bought near $80,000. Long-term holders barely moved — coins held a year or more actually GREW to almost 65% of supply.
Weak hands capitulating at a loss. Strong hands quietly accumulating underneath.
CryptoQuant's Bull Score just hit 0. And yet Willy Woo's take is worth hearing: "We've NEVER seen fear in a bear market unless new lows are being made."
LEVELS THAT DECIDE IT
Whale buy orders cluster in two zones: $68,000–$72,500 above, and $62,000–$66,000 below. That lower zone is the line in the sand. Lose $64,000 and the flush deepens. Reclaim $68,000, then $70,000, and the tone changes — but $75,600 is the real ceiling, where short-term holders bought in.
Check the $BTC chart — the next few closes around $66K will tell you which side of this split wins.
WHAT HISTORY SAYS ABOUT FEAR AT 13
Extreme fear marked some of the best entries of the last six years — March 2020, March 2023, November 2022. But almost never on day one. June 2022 printed single-digit fear too, and Bitcoin kept falling for five more months.
My honest take: the sellers are exhausted retail, not institutions. The buyers' cash is gone, but supply is tightening and whales are buying the fear. The bottom isn't necessarily in today — but the setup is forming. Watch for stablecoin supply growing again, and ETF flows turning green on Monday.
$ETH just lost $2,000 for the first time since August, yet its ETFs quietly printed their first inflow in a week. And $SOL will move hardest in either direction when the fear breaks.
The crowd is terrified. The chain is telling a different story. Which one do you trust?
Not financial advice. DYOR.
But look at what the chain is actually saying, because the biggest wallets are NOT doing what you'd expect.
Here's the split nobody is talking about.
THE CASH LEFT FIRST
The money to buy the dip walked out before this crash even started. Stablecoin supply shrank $14.2 billion in 30 days — the biggest drain since the Terra collapse in June 2022. Glassnode put it bluntly: the market now has "less fuel for a rally."
The ETF money agrees. US spot Bitcoin ETFs have bled for 7 straight days — $1.91 billion gone, with BlackRock's IBIT doing most of the damage. And $1.23 billion in leveraged positions got liquidated in 24 hours, over 80% of them longs.
Now the other side.
THE WHALES AREN'T SELLING — THEY'RE WITHDRAWING
Today a whale pulled another 441 BTC (~$29M) off Binance. That wallet now holds 1,735 BTC (~$115M) built up over five months. And exchanges saw a NET OUTFLOW of nearly 5,700 BTC in 24 hours — coins are leaving, not flooding in.
So who IS selling? The recent buyers. CryptoQuant data shows 47,300 BTC hit exchanges at a loss in a single day, versus just 1,100 BTC at a profit. Over 85% of the realized selling came from people who bought near $80,000. Long-term holders barely moved — coins held a year or more actually GREW to almost 65% of supply.
Weak hands capitulating at a loss. Strong hands quietly accumulating underneath.
CryptoQuant's Bull Score just hit 0. And yet Willy Woo's take is worth hearing: "We've NEVER seen fear in a bear market unless new lows are being made."
LEVELS THAT DECIDE IT
Whale buy orders cluster in two zones: $68,000–$72,500 above, and $62,000–$66,000 below. That lower zone is the line in the sand. Lose $64,000 and the flush deepens. Reclaim $68,000, then $70,000, and the tone changes — but $75,600 is the real ceiling, where short-term holders bought in.
Check the $BTC chart — the next few closes around $66K will tell you which side of this split wins.
WHAT HISTORY SAYS ABOUT FEAR AT 13
Extreme fear marked some of the best entries of the last six years — March 2020, March 2023, November 2022. But almost never on day one. June 2022 printed single-digit fear too, and Bitcoin kept falling for five more months.
My honest take: the sellers are exhausted retail, not institutions. The buyers' cash is gone, but supply is tightening and whales are buying the fear. The bottom isn't necessarily in today — but the setup is forming. Watch for stablecoin supply growing again, and ETF flows turning green on Monday.
$ETH just lost $2,000 for the first time since August, yet its ETFs quietly printed their first inflow in a week. And $SOL will move hardest in either direction when the fear breaks.
The crowd is terrified. The chain is telling a different story. Which one do you trust?
Not financial advice. DYOR.
4
Стаття
Переглянути переклад
$70K Is Gone. The Fed Is Hiking in December — BTC Got the MemoBitcoin just lost $70K — and the "good news" didn't save it.
PPI came in cooler than expected on Friday. Bitcoin fell anyway. Here's the part nobody's talking about: the Fed isn't cutting in December. It's hiking.
THE NUMBER THAT ACTUALLY MATTERS
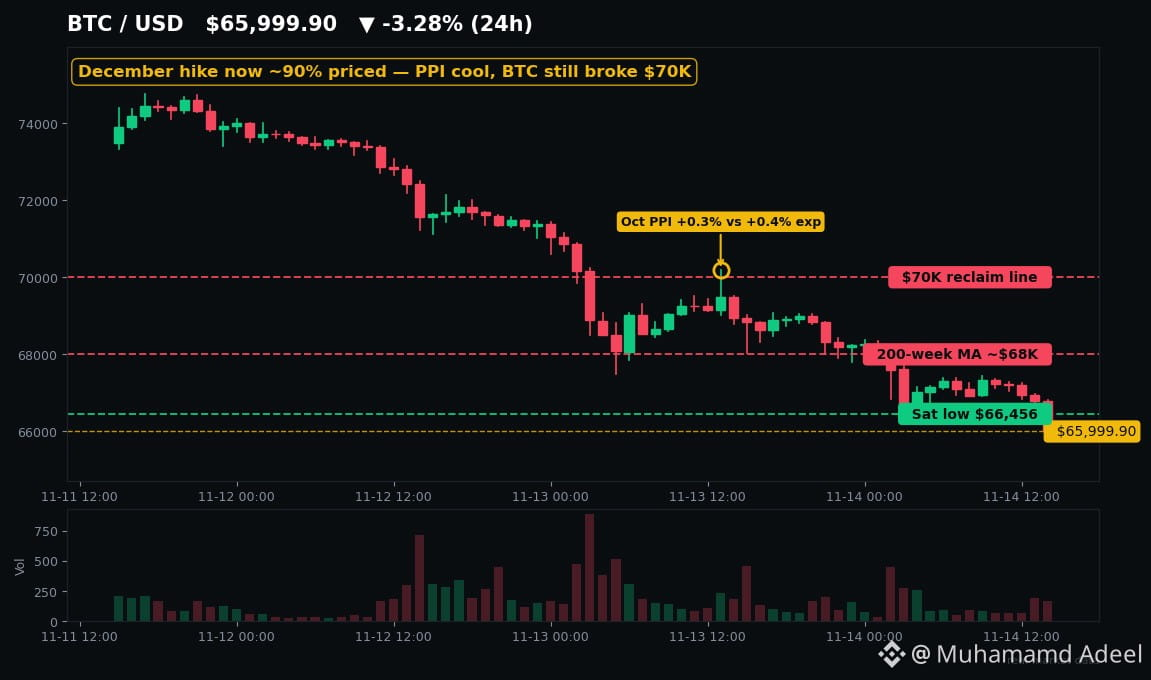
October PPI rose 0.3% vs 0.4% expected — a "cool" headline. But year-on-year it's 6.5%, the hottest since November 2022. And October CPI, released days earlier, also beat expectations.
The market heard it loud and clear. CME FedWatch odds of a 25bp December hike jumped from 85.4% to 89.7% after the PPI print. Prediction markets put a hike at roughly 99%. Cut odds? About 1%.
Fed officials aren't hiding it either. Boston Fed's Collins says "additional firming" is appropriate. San Francisco's Daly: "we're going to need to raise rates." Chicago's Goolsbee says progress on inflation has "stalled, and in some cases reversed." Bank of America now expects hikes in December, January AND March — terminal rate 4.5–4.75%.
This is the flip nobody priced in. For months the market traded on cuts. In one week, it flipped to pricing hikes.
WHY $BTC BROKE
Check $BTC's chart and you'll see the damage: a Saturday low of $66,456, the lowest since August, below the 200-week moving average near $68,000, and roughly 46% under the $126,000 all-time high.
And it wasn't just the Fed. $1.64 billion in leveraged positions got liquidated in 24 hours. US spot Bitcoin ETFs just logged a seventh straight day of outflows — about $1.91 billion in a week. Stablecoin supply shrank $14.2 billion in 30 days, the fastest drain since June 2022. The dollar is at a 19-month high above 103. The 10-year yield closed at 5.15%.
Translation: there's no dry powder left to buy the dip, and the macro tape is working against every bounce.
THE LEVELS THAT DECIDE IT
$70,000 is the line. Reclaim it and the picture changes fast. Below it, the Saturday low at $66,456 is first support, then $65,000. And here's the stat that should worry bulls: the last two times Bitcoin closed a week below $73,000, price drifted toward $60,000 next.
$ETH is telling the same story — under $2,000 for the first time since August, near $1,880, following Bitcoin's macro tape step for step.
WHAT TO WATCH NEXT
Retail sales and FOMC minutes land next week, PCE on 25 November, and the Fed decides on 8–9 December — without November CPI in hand, because the 43-day shutdown wiped out parts of the data. Oh, and MSCI drops Strategy from its indexes on 30 November, with an estimated $2.8 billion in forced selling behind it.
The market spent months pricing cuts. In one week it flipped to pricing hikes. That's the story — everything else is noise.
Not financial advice. DYOR.
$70K Is Gone. The Fed Is Hiking in December — BTC Got the Memo
Bitcoin just lost $70K — and the "good news" didn't save it.
PPI came in cooler than expected on Friday. Bitcoin fell anyway. Here's the part nobody's talking about: the Fed isn't cutting in December. It's hiking.
THE NUMBER THAT ACTUALLY MATTERS
October PPI rose 0.3% vs 0.4% expected — a "cool" headline. But year-on-year it's 6.5%, the hottest since November 2022. And October CPI, released days earlier, also beat expectations.
The market heard it loud and clear. CME FedWatch odds of a 25bp December hike jumped from 85.4% to 89.7% after the PPI print. Prediction markets put a hike at roughly 99%. Cut odds? About 1%.
Fed officials aren't hiding it either. Boston Fed's Collins says "additional firming" is appropriate. San Francisco's Daly: "we're going to need to raise rates." Chicago's Goolsbee says progress on inflation has "stalled, and in some cases reversed." Bank of America now expects hikes in December, January AND March — terminal rate 4.5–4.75%.
This is the flip nobody priced in. For months the market traded on cuts. In one week, it flipped to pricing hikes.
WHY $BTC BROKE
Check $BTC 's chart and you'll see the damage: a Saturday low of $66,456, the lowest since August, below the 200-week moving average near $68,000, and roughly 46% under the $126,000 all-time high.
And it wasn't just the Fed. $1.64 billion in leveraged positions got liquidated in 24 hours. US spot Bitcoin ETFs just logged a seventh straight day of outflows — about $1.91 billion in a week. Stablecoin supply shrank $14.2 billion in 30 days, the fastest drain since June 2022. The dollar is at a 19-month high above 103. The 10-year yield closed at 5.15%.
Translation: there's no dry powder left to buy the dip, and the macro tape is working against every bounce.
THE LEVELS THAT DECIDE IT
$70,000 is the line. Reclaim it and the picture changes fast. Below it, the Saturday low at $66,456 is first support, then $65,000. And here's the stat that should worry bulls: the last two times Bitcoin closed a week below $73,000, price drifted toward $60,000 next.
$ETH is telling the same story — under $2,000 for the first time since August, near $1,880, following Bitcoin's macro tape step for step.
WHAT TO WATCH NEXT
Retail sales and FOMC minutes land next week, PCE on 25 November, and the Fed decides on 8–9 December — without November CPI in hand, because the 43-day shutdown wiped out parts of the data. Oh, and MSCI drops Strategy from its indexes on 30 November, with an estimated $2.8 billion in forced selling behind it.
The market spent months pricing cuts. In one week it flipped to pricing hikes. That's the story — everything else is noise.
Not financial advice. DYOR.
PPI came in cooler than expected on Friday. Bitcoin fell anyway. Here's the part nobody's talking about: the Fed isn't cutting in December. It's hiking.
THE NUMBER THAT ACTUALLY MATTERS
October PPI rose 0.3% vs 0.4% expected — a "cool" headline. But year-on-year it's 6.5%, the hottest since November 2022. And October CPI, released days earlier, also beat expectations.
The market heard it loud and clear. CME FedWatch odds of a 25bp December hike jumped from 85.4% to 89.7% after the PPI print. Prediction markets put a hike at roughly 99%. Cut odds? About 1%.
Fed officials aren't hiding it either. Boston Fed's Collins says "additional firming" is appropriate. San Francisco's Daly: "we're going to need to raise rates." Chicago's Goolsbee says progress on inflation has "stalled, and in some cases reversed." Bank of America now expects hikes in December, January AND March — terminal rate 4.5–4.75%.
This is the flip nobody priced in. For months the market traded on cuts. In one week, it flipped to pricing hikes.
WHY $BTC BROKE
Check $BTC 's chart and you'll see the damage: a Saturday low of $66,456, the lowest since August, below the 200-week moving average near $68,000, and roughly 46% under the $126,000 all-time high.
And it wasn't just the Fed. $1.64 billion in leveraged positions got liquidated in 24 hours. US spot Bitcoin ETFs just logged a seventh straight day of outflows — about $1.91 billion in a week. Stablecoin supply shrank $14.2 billion in 30 days, the fastest drain since June 2022. The dollar is at a 19-month high above 103. The 10-year yield closed at 5.15%.
Translation: there's no dry powder left to buy the dip, and the macro tape is working against every bounce.
THE LEVELS THAT DECIDE IT
$70,000 is the line. Reclaim it and the picture changes fast. Below it, the Saturday low at $66,456 is first support, then $65,000. And here's the stat that should worry bulls: the last two times Bitcoin closed a week below $73,000, price drifted toward $60,000 next.
$ETH is telling the same story — under $2,000 for the first time since August, near $1,880, following Bitcoin's macro tape step for step.
WHAT TO WATCH NEXT
Retail sales and FOMC minutes land next week, PCE on 25 November, and the Fed decides on 8–9 December — without November CPI in hand, because the 43-day shutdown wiped out parts of the data. Oh, and MSCI drops Strategy from its indexes on 30 November, with an estimated $2.8 billion in forced selling behind it.
The market spent months pricing cuts. In one week it flipped to pricing hikes. That's the story — everything else is noise.
Not financial advice. DYOR.
Стаття
Переглянути переклад
While BTC Crashed Below $70K, Tokenized Gold Just Got Its First Big Four AuditBitcoin just broke $70K. Fear & Greed is sitting at 13.
But one crypto asset barely moved — and it just got its first Big Four audit.
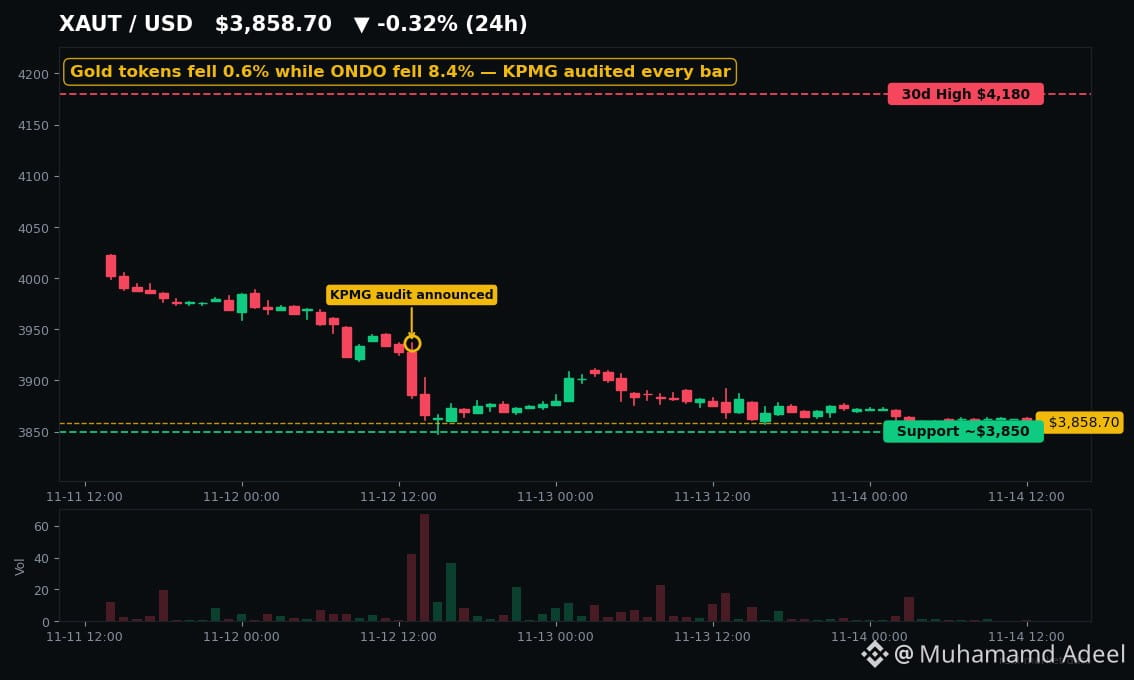
That asset is tokenized gold. Tether Gold ($XAUT) is trading around $3,859, down just 0.3% in the last 24 hours on Kraken. In the same 24 hours, ONDO fell 8.4% and LINK dropped 6.4%, below $10. Read that again: while the market bled, the gold token moved less than a third of a percent.
Here's why this week is different. On 12 November, Tether announced that KPMG U.S. issued an unqualified — clean — audit opinion on TG Commodities, the issuer of Tether Gold, covering its 2025 financial statements. It's Tether's second Big Four audit, after USDT's in August. KPMG physically counted and inspected every single gold bar — no taking a custodian's word for it. The count: 520,089.350 ounces, worth $2.246 billion, backing 520,089.300 tokens.
Now the honest part, because an audit is not a price guarantee. Gold itself is about 30% below its January peak near $5,589 an ounce, and the token sits roughly 30% under its own all-time high of $5,504.62. The opinion covers 31 December 2025 — since then the backing has grown 59% to about 827,418 ounces, which the audit doesn't cover. Physical redemption needs roughly 430 tokens — about $1.8 million — so for most of us, "redemption" just means selling on an exchange.
But the direction of travel is what matters. Tokenized gold is now a $4.85 billion market — XAUT at ~$3.1B and PAXG at ~$1.7B — and XAUT is the single largest tokenized asset on-chain, per rwa.xyz. Total tokenized real-world assets sit at $39.66 billion, down 1.5% in a month, yet holders keep climbing: 5.74 million, up 6.6% in a month. The value wobbles; the user base doesn't.
The rotation shows up elsewhere too. XDC Network — the trade-finance chain — jumped about 7% this week to lead the CoinDesk 100 after Robinhood listed it for US retail in October. Stablecoin supply on XDC is up 77% in a week to over $100 million. Small numbers, loud signal: in a crash, money rotates toward things with a real-world anchor.
History says this pattern repeats. In the $19 billion liquidation flush of October 2025, PAXG fell 0.23% and XAUT actually rose 0.2% while Bitcoin dropped 8.5% and ETH lost 12.75%. Gold tokens hold. RWA tokens don't — ONDO fell 45% in the August 2024 crash before bouncing 25% in a day. That's the split: the assets are a haven, the tokens are high-beta crypto.
Watch the levels. XAUT holds just above $3,850 support, with its 30-day high at $4,180. $BTC needs to reclaim $70K or $65K comes into play. $ONDO sits exactly on its 30-day low near $0.32 — lose that on a daily close and there's air underneath. Check $XAUT's chart — right now it's trading like a haven, not a memecoin.
The crash is sorting the sector into two buckets: tokens that track real assets, and tokens that just track the market.
Not financial advice. DYOR.
While BTC Crashed Below $70K, Tokenized Gold Just Got Its First Big Four Audit
Bitcoin just broke $70K. Fear & Greed is sitting at 13.
But one crypto asset barely moved — and it just got its first Big Four audit.
That asset is tokenized gold. Tether Gold ($XAUT ) is trading around $3,859, down just 0.3% in the last 24 hours on Kraken. In the same 24 hours, ONDO fell 8.4% and LINK dropped 6.4%, below $10. Read that again: while the market bled, the gold token moved less than a third of a percent.
Here's why this week is different. On 12 November, Tether announced that KPMG U.S. issued an unqualified — clean — audit opinion on TG Commodities, the issuer of Tether Gold, covering its 2025 financial statements. It's Tether's second Big Four audit, after USDT's in August. KPMG physically counted and inspected every single gold bar — no taking a custodian's word for it. The count: 520,089.350 ounces, worth $2.246 billion, backing 520,089.300 tokens.
Now the honest part, because an audit is not a price guarantee. Gold itself is about 30% below its January peak near $5,589 an ounce, and the token sits roughly 30% under its own all-time high of $5,504.62. The opinion covers 31 December 2025 — since then the backing has grown 59% to about 827,418 ounces, which the audit doesn't cover. Physical redemption needs roughly 430 tokens — about $1.8 million — so for most of us, "redemption" just means selling on an exchange.
But the direction of travel is what matters. Tokenized gold is now a $4.85 billion market — XAUT at ~$3.1B and PAXG at ~$1.7B — and XAUT is the single largest tokenized asset on-chain, per rwa.xyz. Total tokenized real-world assets sit at $39.66 billion, down 1.5% in a month, yet holders keep climbing: 5.74 million, up 6.6% in a month. The value wobbles; the user base doesn't.
The rotation shows up elsewhere too. XDC Network — the trade-finance chain — jumped about 7% this week to lead the CoinDesk 100 after Robinhood listed it for US retail in October. Stablecoin supply on XDC is up 77% in a week to over $100 million. Small numbers, loud signal: in a crash, money rotates toward things with a real-world anchor.
History says this pattern repeats. In the $19 billion liquidation flush of October 2025, PAXG fell 0.23% and XAUT actually rose 0.2% while Bitcoin dropped 8.5% and ETH lost 12.75%. Gold tokens hold. RWA tokens don't — ONDO fell 45% in the August 2024 crash before bouncing 25% in a day. That's the split: the assets are a haven, the tokens are high-beta crypto.
Watch the levels. XAUT holds just above $3,850 support, with its 30-day high at $4,180. $BTC needs to reclaim $70K or $65K comes into play. $ONDO sits exactly on its 30-day low near $0.32 — lose that on a daily close and there's air underneath. Check $XAUT 's chart — right now it's trading like a haven, not a memecoin.
The crash is sorting the sector into two buckets: tokens that track real assets, and tokens that just track the market.
Not financial advice. DYOR.
But one crypto asset barely moved — and it just got its first Big Four audit.
That asset is tokenized gold. Tether Gold ($XAUT ) is trading around $3,859, down just 0.3% in the last 24 hours on Kraken. In the same 24 hours, ONDO fell 8.4% and LINK dropped 6.4%, below $10. Read that again: while the market bled, the gold token moved less than a third of a percent.
Here's why this week is different. On 12 November, Tether announced that KPMG U.S. issued an unqualified — clean — audit opinion on TG Commodities, the issuer of Tether Gold, covering its 2025 financial statements. It's Tether's second Big Four audit, after USDT's in August. KPMG physically counted and inspected every single gold bar — no taking a custodian's word for it. The count: 520,089.350 ounces, worth $2.246 billion, backing 520,089.300 tokens.
Now the honest part, because an audit is not a price guarantee. Gold itself is about 30% below its January peak near $5,589 an ounce, and the token sits roughly 30% under its own all-time high of $5,504.62. The opinion covers 31 December 2025 — since then the backing has grown 59% to about 827,418 ounces, which the audit doesn't cover. Physical redemption needs roughly 430 tokens — about $1.8 million — so for most of us, "redemption" just means selling on an exchange.
But the direction of travel is what matters. Tokenized gold is now a $4.85 billion market — XAUT at ~$3.1B and PAXG at ~$1.7B — and XAUT is the single largest tokenized asset on-chain, per rwa.xyz. Total tokenized real-world assets sit at $39.66 billion, down 1.5% in a month, yet holders keep climbing: 5.74 million, up 6.6% in a month. The value wobbles; the user base doesn't.
The rotation shows up elsewhere too. XDC Network — the trade-finance chain — jumped about 7% this week to lead the CoinDesk 100 after Robinhood listed it for US retail in October. Stablecoin supply on XDC is up 77% in a week to over $100 million. Small numbers, loud signal: in a crash, money rotates toward things with a real-world anchor.
History says this pattern repeats. In the $19 billion liquidation flush of October 2025, PAXG fell 0.23% and XAUT actually rose 0.2% while Bitcoin dropped 8.5% and ETH lost 12.75%. Gold tokens hold. RWA tokens don't — ONDO fell 45% in the August 2024 crash before bouncing 25% in a day. That's the split: the assets are a haven, the tokens are high-beta crypto.
Watch the levels. XAUT holds just above $3,850 support, with its 30-day high at $4,180. $BTC needs to reclaim $70K or $65K comes into play. $ONDO sits exactly on its 30-day low near $0.32 — lose that on a daily close and there's air underneath. Check $XAUT 's chart — right now it's trading like a haven, not a memecoin.
The crash is sorting the sector into two buckets: tokens that track real assets, and tokens that just track the market.
Not financial advice. DYOR.
4
Стаття
Переглянути переклад
SIGN Pumped 60% on Its Upbit Listing — Now It's 93% Below ItIn April 2025, $SIGN did what every new listing dreams of.
It was Binance Alpha's first-ever pick. It traded flat at $0.06–$0.08 — then Upbit listed it and it ripped 60% in a day to $0.129, with volume more than doubling to $898M.
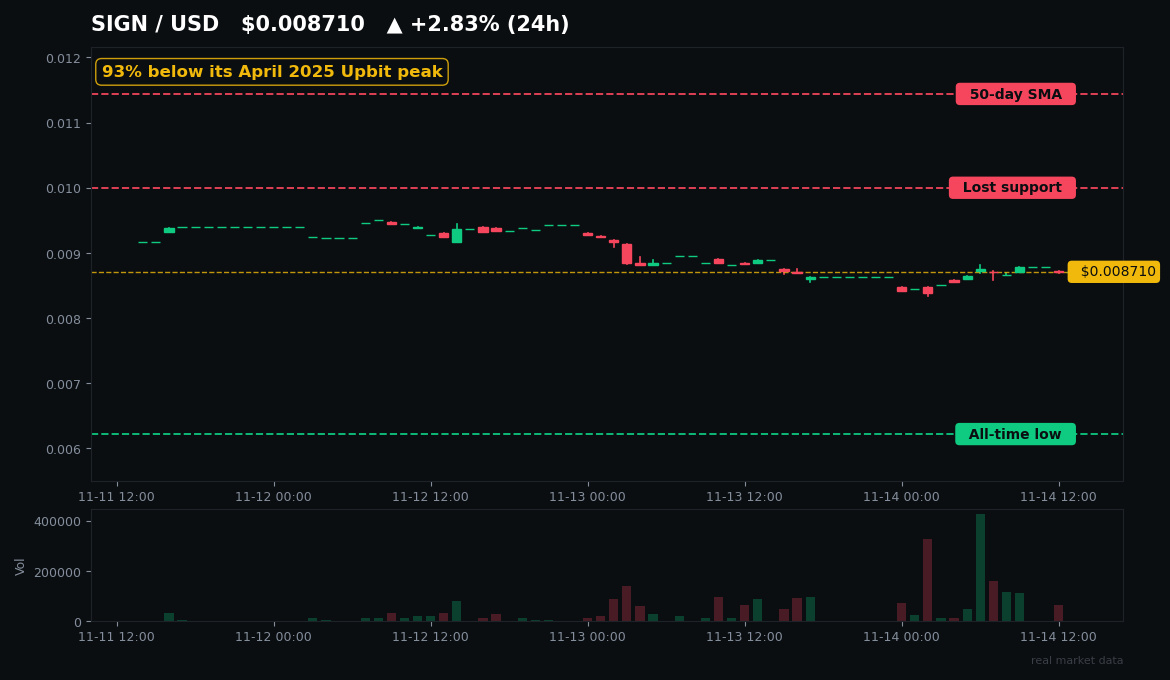
Nineteen months later, it's $0.0087. That's 93% below the peak. And that's exactly why this story matters.
THE FADE
Listing pumps almost never hold, and SIGN is the textbook case. It's down 26% in the last month and 77% this year. Volume has collapsed from $898M on the Upbit day to barely $2–3M now. The token sits just 40% above its all-time low of $0.00622.
Only 28% of the 10 billion supply circulates. Nearly 68% is still locked — and the unlock calendar is the real story. A small 50M unlock lands 28 November. Then 15 January 2027: 750 million tokens unlock in a single day — 500M to backers, 250M to the early team. That's roughly a quarter of everything circulating today. The last time a chunk unlocked, in October, the token dropped double digits in a day.
THE PART NOBODY'S WATCHING
Here's the twist. While the price bled out, the project underneath quietly became government infrastructure. In August, Sign and BNB Chain unveiled a sovereign stablecoin framework — a blueprint for governments to issue regulated national stablecoins. Kyrgyzstan's KGST is already live, pegged 1:1 to the som, with engagements reported in the UAE, Pakistan, Uzbekistan, Kazakhstan and Sierra Leone. Its TokenTable product has processed over $4B in token distributions.
Price technicians are bearish — every model forecast is flat to down into year-end, and the token trades below its 50-day average near $0.0114. But the fundamentals crowd sees something else entirely: an attestation layer that nation-states are actually using.
LEVELS TO WATCH
$0.01 is the line that just gave way — it was support for weeks and now it's resistance overhead, along with $0.0125. Below, the last real floor is the all-time low at $0.00622. Check the $SIGN chart and you'll see it: a token hugging its lows while its use case quietly goes sovereign.
The market around it is brutal — $BTC is under $67K and Fear & Greed reads 13, extreme fear. In that tape, a listing pump is the last thing to chase. But a project building real rails while its token trades near its low? That's a different question entirely.
Is SIGN a dead listing pump — or the cheapest government-infra bet in crypto? Watch the January unlock first. It'll tell you everything.
Not financial advice. DYOR.
SIGN Pumped 60% on Its Upbit Listing — Now It's 93% Below It
In April 2025, $SIGN did what every new listing dreams of.
It was Binance Alpha's first-ever pick. It traded flat at $0.06–$0.08 — then Upbit listed it and it ripped 60% in a day to $0.129, with volume more than doubling to $898M.
Nineteen months later, it's $0.0087. That's 93% below the peak. And that's exactly why this story matters.
THE FADE
Listing pumps almost never hold, and SIGN is the textbook case. It's down 26% in the last month and 77% this year. Volume has collapsed from $898M on the Upbit day to barely $2–3M now. The token sits just 40% above its all-time low of $0.00622.
Only 28% of the 10 billion supply circulates. Nearly 68% is still locked — and the unlock calendar is the real story. A small 50M unlock lands 28 November. Then 15 January 2027: 750 million tokens unlock in a single day — 500M to backers, 250M to the early team. That's roughly a quarter of everything circulating today. The last time a chunk unlocked, in October, the token dropped double digits in a day.
THE PART NOBODY'S WATCHING
Here's the twist. While the price bled out, the project underneath quietly became government infrastructure. In August, Sign and BNB Chain unveiled a sovereign stablecoin framework — a blueprint for governments to issue regulated national stablecoins. Kyrgyzstan's KGST is already live, pegged 1:1 to the som, with engagements reported in the UAE, Pakistan, Uzbekistan, Kazakhstan and Sierra Leone. Its TokenTable product has processed over $4B in token distributions.
Price technicians are bearish — every model forecast is flat to down into year-end, and the token trades below its 50-day average near $0.0114. But the fundamentals crowd sees something else entirely: an attestation layer that nation-states are actually using.
LEVELS TO WATCH
$0.01 is the line that just gave way — it was support for weeks and now it's resistance overhead, along with $0.0125. Below, the last real floor is the all-time low at $0.00622. Check the $SIGN chart and you'll see it: a token hugging its lows while its use case quietly goes sovereign.
The market around it is brutal — $BTC is under $67K and Fear & Greed reads 13, extreme fear. In that tape, a listing pump is the last thing to chase. But a project building real rails while its token trades near its low? That's a different question entirely.
Is SIGN a dead listing pump — or the cheapest government-infra bet in crypto? Watch the January unlock first. It'll tell you everything.
Not financial advice. DYOR.
It was Binance Alpha's first-ever pick. It traded flat at $0.06–$0.08 — then Upbit listed it and it ripped 60% in a day to $0.129, with volume more than doubling to $898M.
Nineteen months later, it's $0.0087. That's 93% below the peak. And that's exactly why this story matters.
THE FADE
Listing pumps almost never hold, and SIGN is the textbook case. It's down 26% in the last month and 77% this year. Volume has collapsed from $898M on the Upbit day to barely $2–3M now. The token sits just 40% above its all-time low of $0.00622.
Only 28% of the 10 billion supply circulates. Nearly 68% is still locked — and the unlock calendar is the real story. A small 50M unlock lands 28 November. Then 15 January 2027: 750 million tokens unlock in a single day — 500M to backers, 250M to the early team. That's roughly a quarter of everything circulating today. The last time a chunk unlocked, in October, the token dropped double digits in a day.
THE PART NOBODY'S WATCHING
Here's the twist. While the price bled out, the project underneath quietly became government infrastructure. In August, Sign and BNB Chain unveiled a sovereign stablecoin framework — a blueprint for governments to issue regulated national stablecoins. Kyrgyzstan's KGST is already live, pegged 1:1 to the som, with engagements reported in the UAE, Pakistan, Uzbekistan, Kazakhstan and Sierra Leone. Its TokenTable product has processed over $4B in token distributions.
Price technicians are bearish — every model forecast is flat to down into year-end, and the token trades below its 50-day average near $0.0114. But the fundamentals crowd sees something else entirely: an attestation layer that nation-states are actually using.
LEVELS TO WATCH
$0.01 is the line that just gave way — it was support for weeks and now it's resistance overhead, along with $0.0125. Below, the last real floor is the all-time low at $0.00622. Check the $SIGN chart and you'll see it: a token hugging its lows while its use case quietly goes sovereign.
The market around it is brutal — $BTC is under $67K and Fear & Greed reads 13, extreme fear. In that tape, a listing pump is the last thing to chase. But a project building real rails while its token trades near its low? That's a different question entirely.
Is SIGN a dead listing pump — or the cheapest government-infra bet in crypto? Watch the January unlock first. It'll tell you everything.
Not financial advice. DYOR.
Стаття
Переглянути переклад
ETH Lost $2,000 — But Stakers Just Locked a Record 44.6M ETHETH just closed below $2,000 for the first time since August.
And while the market panic-sold, stakers locked up a record amount of $ETH. Somebody is wrong — and the queue tells you who.
**What just happened**
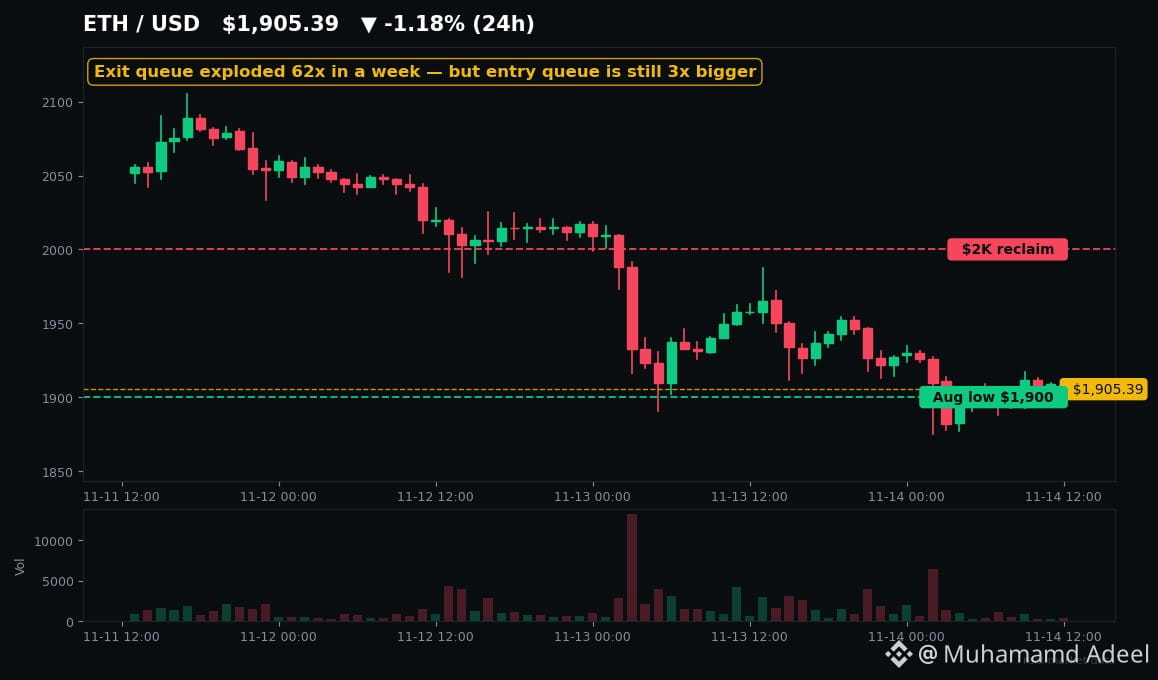
Thursday's candle closed at $1,929.88 after dipping to $1,895.95: -20% in 30 days, RSI 23 (deeply oversold), $287M liquidated in a day — 90% longs. Fear & Greed: 13. Extreme fear.
Institutions are still the sellers. US spot ETH ETFs have bled about $696M in November, with BlackRock's ETHA leading the exodus. But 13 November printed a tiny +$2.3M inflow — the first green day after six straight red ones.
**The staking split nobody's talking about**
Total staked ETH just hit a record: ~44.6 million ETH, 36.5% of all supply. Stakers added ~200,000 ETH in six days — while the price fell.
But the queue is telling two stories at once. The exit queue exploded from 4,320 ETH on 6 November to roughly 270,000 ETH by 13 November — a 62x jump in a week. That's ~$520M of ETH that becomes sellable once it clears the ~12-day exit.
Yet the entry queue is still three times bigger: ~912,000 ETH waiting to stake, with a 16-day wait. More ETH still wants in than out.
Whales are split the same way. "7 Siblings" bought 20,558 ETH (~$41M) across three days into the break. A Foundation-linked wallet sold 2,000 ETH (~$3.87M) on the same day. $LDO is where the liquid-staking trade lives — watch it.
**History says the queue isn't the crash**
Last time the exit queue spiked like this — August 2025, a record 910,000 ETH queued to leave — ETH hit its all-time high of $4,955 days later. In April 2025, sub-$2,000 ETH marked the bottom before a 3.5x rally. The queue is a throttle, not a floodgate: exits take days to weeks, and much of it rotates and re-stakes instead of selling.
The honest caveat: April 2025 only turned because a catalyst arrived (Pectra plus ETF inflows). A level alone doesn't bounce anything.
**The levels that decide it**
$2,000 is now resistance — reclaim it on a daily close and the break looks like a trap. Above that: $2,035, then $2,115. Below, support sits at $1,900, then $1,859 and $1,800. Check the $ETH chart at $2,000: that's the line that decides whether this is capitulation or the dip stakers are buying.
Meanwhile $BTC keeps winning the rotation — ETH/BTC is 0.0283, near multi-year lows. ETH is down 32% this year vs Bitcoin's 19%.
The risks are real: a December Fed hike is now the base case, the 10-year yields 5.15%, and Glamsterdam's testnet fork is paused. If the exit queue keeps climbing and ETF flows stay red, $1,800 comes into play fast.
Record staking, an exit queue that just went vertical, and the most oversold RSI in months — all at once. That's a market about to pick a direction.
Watch the exit queue and the ETF flows, not just the price — they'll tell you first.
Not financial advice. DYOR.
ETH Lost $2,000 — But Stakers Just Locked a Record 44.6M ETH
ETH just closed below $2,000 for the first time since August.
And while the market panic-sold, stakers locked up a record amount of $ETH . Somebody is wrong — and the queue tells you who.
**What just happened**
Thursday's candle closed at $1,929.88 after dipping to $1,895.95: -20% in 30 days, RSI 23 (deeply oversold), $287M liquidated in a day — 90% longs. Fear & Greed: 13. Extreme fear.
Institutions are still the sellers. US spot ETH ETFs have bled about $696M in November, with BlackRock's ETHA leading the exodus. But 13 November printed a tiny +$2.3M inflow — the first green day after six straight red ones.
**The staking split nobody's talking about**
Total staked ETH just hit a record: ~44.6 million ETH, 36.5% of all supply. Stakers added ~200,000 ETH in six days — while the price fell.
But the queue is telling two stories at once. The exit queue exploded from 4,320 ETH on 6 November to roughly 270,000 ETH by 13 November — a 62x jump in a week. That's ~$520M of ETH that becomes sellable once it clears the ~12-day exit.
Yet the entry queue is still three times bigger: ~912,000 ETH waiting to stake, with a 16-day wait. More ETH still wants in than out.
Whales are split the same way. "7 Siblings" bought 20,558 ETH (~$41M) across three days into the break. A Foundation-linked wallet sold 2,000 ETH (~$3.87M) on the same day. $LDO is where the liquid-staking trade lives — watch it.
**History says the queue isn't the crash**
Last time the exit queue spiked like this — August 2025, a record 910,000 ETH queued to leave — ETH hit its all-time high of $4,955 days later. In April 2025, sub-$2,000 ETH marked the bottom before a 3.5x rally. The queue is a throttle, not a floodgate: exits take days to weeks, and much of it rotates and re-stakes instead of selling.
The honest caveat: April 2025 only turned because a catalyst arrived (Pectra plus ETF inflows). A level alone doesn't bounce anything.
**The levels that decide it**
$2,000 is now resistance — reclaim it on a daily close and the break looks like a trap. Above that: $2,035, then $2,115. Below, support sits at $1,900, then $1,859 and $1,800. Check the $ETH chart at $2,000: that's the line that decides whether this is capitulation or the dip stakers are buying.
Meanwhile $BTC keeps winning the rotation — ETH/BTC is 0.0283, near multi-year lows. ETH is down 32% this year vs Bitcoin's 19%.
The risks are real: a December Fed hike is now the base case, the 10-year yields 5.15%, and Glamsterdam's testnet fork is paused. If the exit queue keeps climbing and ETF flows stay red, $1,800 comes into play fast.
Record staking, an exit queue that just went vertical, and the most oversold RSI in months — all at once. That's a market about to pick a direction.
Watch the exit queue and the ETF flows, not just the price — they'll tell you first.
Not financial advice. DYOR.
And while the market panic-sold, stakers locked up a record amount of $ETH . Somebody is wrong — and the queue tells you who.
**What just happened**
Thursday's candle closed at $1,929.88 after dipping to $1,895.95: -20% in 30 days, RSI 23 (deeply oversold), $287M liquidated in a day — 90% longs. Fear & Greed: 13. Extreme fear.
Institutions are still the sellers. US spot ETH ETFs have bled about $696M in November, with BlackRock's ETHA leading the exodus. But 13 November printed a tiny +$2.3M inflow — the first green day after six straight red ones.
**The staking split nobody's talking about**
Total staked ETH just hit a record: ~44.6 million ETH, 36.5% of all supply. Stakers added ~200,000 ETH in six days — while the price fell.
But the queue is telling two stories at once. The exit queue exploded from 4,320 ETH on 6 November to roughly 270,000 ETH by 13 November — a 62x jump in a week. That's ~$520M of ETH that becomes sellable once it clears the ~12-day exit.
Yet the entry queue is still three times bigger: ~912,000 ETH waiting to stake, with a 16-day wait. More ETH still wants in than out.
Whales are split the same way. "7 Siblings" bought 20,558 ETH (~$41M) across three days into the break. A Foundation-linked wallet sold 2,000 ETH (~$3.87M) on the same day. $LDO is where the liquid-staking trade lives — watch it.
**History says the queue isn't the crash**
Last time the exit queue spiked like this — August 2025, a record 910,000 ETH queued to leave — ETH hit its all-time high of $4,955 days later. In April 2025, sub-$2,000 ETH marked the bottom before a 3.5x rally. The queue is a throttle, not a floodgate: exits take days to weeks, and much of it rotates and re-stakes instead of selling.
The honest caveat: April 2025 only turned because a catalyst arrived (Pectra plus ETF inflows). A level alone doesn't bounce anything.
**The levels that decide it**
$2,000 is now resistance — reclaim it on a daily close and the break looks like a trap. Above that: $2,035, then $2,115. Below, support sits at $1,900, then $1,859 and $1,800. Check the $ETH chart at $2,000: that's the line that decides whether this is capitulation or the dip stakers are buying.
Meanwhile $BTC keeps winning the rotation — ETH/BTC is 0.0283, near multi-year lows. ETH is down 32% this year vs Bitcoin's 19%.
The risks are real: a December Fed hike is now the base case, the 10-year yields 5.15%, and Glamsterdam's testnet fork is paused. If the exit queue keeps climbing and ETF flows stay red, $1,800 comes into play fast.
Record staking, an exit queue that just went vertical, and the most oversold RSI in months — all at once. That's a market about to pick a direction.
Watch the exit queue and the ETF flows, not just the price — they'll tell you first.
Not financial advice. DYOR.
Стаття
Переглянути переклад
BTC Broke $70K. Now Shorts Are Piling In — Squeeze Next?Longs just got wiped out. Now the shorts are the ones paying.
Bitcoin broke $70,000 this week and kept falling — $66,456 on Saturday, its lowest since August. In the 24 hours to Friday, more than $1.6 billion in leveraged positions were liquidated, about 90% of them longs. Ethereum fell under $2,000 for the first time since August too.
Third liquidation wave this week. And here's the twist: the crowd has flipped sides.
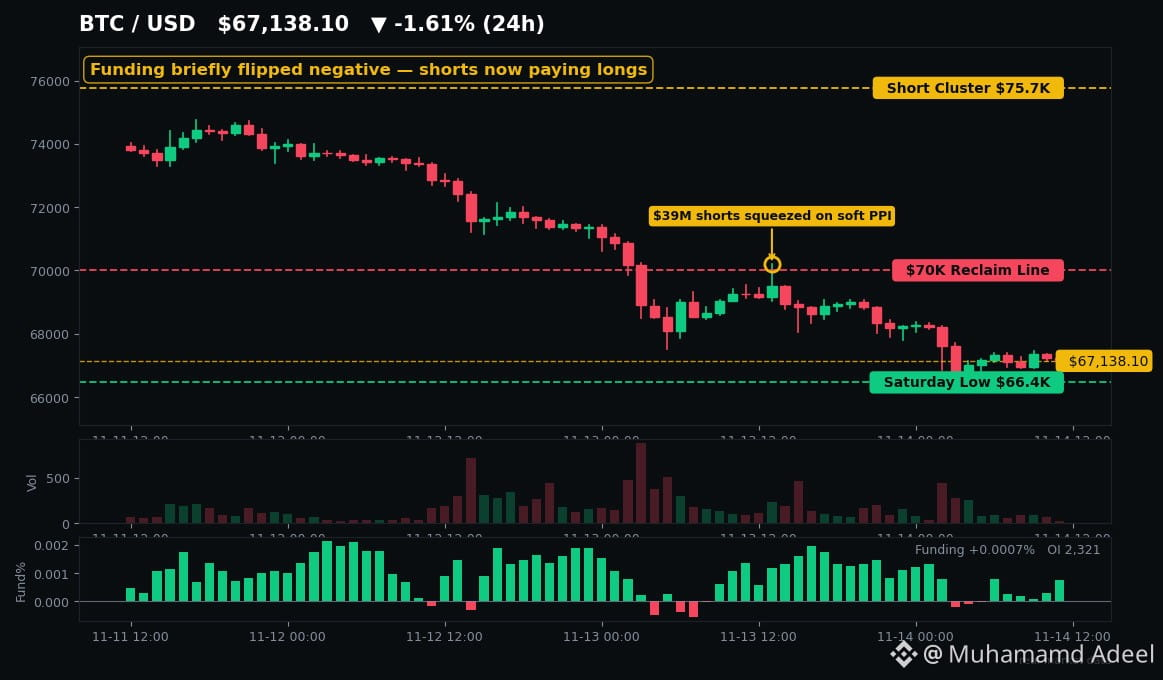
On Friday morning, funding on OKX and Bybit briefly turned negative — shorts were paying longs to hold their bets. By the afternoon, it was positive again. But the message was clear. A market that spent a month piling into longs is now piling into shorts. On Hyperliquid, traders are sitting 94% short. Altcoin funding is deeply negative across the board.
So is a short squeeze next? History says this exact setup has fired before — and fast.
In April 2025, funding went negative after a flush — then Bitcoin ripped from $88,000 past $94,000 in a day, wiping out $530 million in shorts. In August 2024, deeply negative funding marked the bottom of a 24% crash — Bitcoin rallied 32% within weeks.
We already saw a preview. A softer-than-expected PPI print on Friday pushed Bitcoin briefly back above $70,200, and $39 million in shorts were liquidated within the hour. The catch? It faded within minutes, and Bitcoin made a new low overnight. A squeeze can fire — but Friday proved it can fail just as fast.
Here's what matters now. The fuel sits above price: liquidation clusters at $72,000–$73,000, then around $75,700, with bigger pockets near $82,000. A daily close back above $70,000 is the first line shorts have to defend — check $BTC's chart there, because that's where any squeeze would start. Below, $66,400 is the line in the sand; lose it and the next pool of long liquidations sits near $64,000.
But a setup is not a guarantee. The headwinds are real. Spot Bitcoin ETFs have now bled for seven straight sessions, nearly $1.9 billion in total. Stablecoin supply just shrank $14.2 billion in a month — the fastest drain since June 2022 — so there's less dry powder to buy any dip. Markets price a December Fed hike as a near-certainty. And 76% of Binance accounts are still long, so another leg down would flush longs all over again, not shorts.
The honest read? The sellers are exhausted. Leverage has been forcibly reset, open interest is down 6% in a day, and fear is at 13 on the index. But a squeeze needs buyers, not just trapped shorts. Watch $70,000. If Bitcoin reclaims it and holds, the shorts start paying in a very different way. Until then, this is a setup — not a signal.
$ETH tells the same story: $289 million liquidated Friday, funding flickering around zero, $2,000 the level to watch. If Bitcoin squeezes, Ethereum follows — check its chart too.
Not financial advice. DYOR.
BTC Broke $70K. Now Shorts Are Piling In — Squeeze Next?
Longs just got wiped out. Now the shorts are the ones paying.
Bitcoin broke $70,000 this week and kept falling — $66,456 on Saturday, its lowest since August. In the 24 hours to Friday, more than $1.6 billion in leveraged positions were liquidated, about 90% of them longs. Ethereum fell under $2,000 for the first time since August too.
Third liquidation wave this week. And here's the twist: the crowd has flipped sides.
On Friday morning, funding on OKX and Bybit briefly turned negative — shorts were paying longs to hold their bets. By the afternoon, it was positive again. But the message was clear. A market that spent a month piling into longs is now piling into shorts. On Hyperliquid, traders are sitting 94% short. Altcoin funding is deeply negative across the board.
So is a short squeeze next? History says this exact setup has fired before — and fast.
In April 2025, funding went negative after a flush — then Bitcoin ripped from $88,000 past $94,000 in a day, wiping out $530 million in shorts. In August 2024, deeply negative funding marked the bottom of a 24% crash — Bitcoin rallied 32% within weeks.
We already saw a preview. A softer-than-expected PPI print on Friday pushed Bitcoin briefly back above $70,200, and $39 million in shorts were liquidated within the hour. The catch? It faded within minutes, and Bitcoin made a new low overnight. A squeeze can fire — but Friday proved it can fail just as fast.
Here's what matters now. The fuel sits above price: liquidation clusters at $72,000–$73,000, then around $75,700, with bigger pockets near $82,000. A daily close back above $70,000 is the first line shorts have to defend — check $BTC 's chart there, because that's where any squeeze would start. Below, $66,400 is the line in the sand; lose it and the next pool of long liquidations sits near $64,000.
But a setup is not a guarantee. The headwinds are real. Spot Bitcoin ETFs have now bled for seven straight sessions, nearly $1.9 billion in total. Stablecoin supply just shrank $14.2 billion in a month — the fastest drain since June 2022 — so there's less dry powder to buy any dip. Markets price a December Fed hike as a near-certainty. And 76% of Binance accounts are still long, so another leg down would flush longs all over again, not shorts.
The honest read? The sellers are exhausted. Leverage has been forcibly reset, open interest is down 6% in a day, and fear is at 13 on the index. But a squeeze needs buyers, not just trapped shorts. Watch $70,000. If Bitcoin reclaims it and holds, the shorts start paying in a very different way. Until then, this is a setup — not a signal.
$ETH tells the same story: $289 million liquidated Friday, funding flickering around zero, $2,000 the level to watch. If Bitcoin squeezes, Ethereum follows — check its chart too.
Not financial advice. DYOR.
Bitcoin broke $70,000 this week and kept falling — $66,456 on Saturday, its lowest since August. In the 24 hours to Friday, more than $1.6 billion in leveraged positions were liquidated, about 90% of them longs. Ethereum fell under $2,000 for the first time since August too.
Third liquidation wave this week. And here's the twist: the crowd has flipped sides.
On Friday morning, funding on OKX and Bybit briefly turned negative — shorts were paying longs to hold their bets. By the afternoon, it was positive again. But the message was clear. A market that spent a month piling into longs is now piling into shorts. On Hyperliquid, traders are sitting 94% short. Altcoin funding is deeply negative across the board.
So is a short squeeze next? History says this exact setup has fired before — and fast.
In April 2025, funding went negative after a flush — then Bitcoin ripped from $88,000 past $94,000 in a day, wiping out $530 million in shorts. In August 2024, deeply negative funding marked the bottom of a 24% crash — Bitcoin rallied 32% within weeks.
We already saw a preview. A softer-than-expected PPI print on Friday pushed Bitcoin briefly back above $70,200, and $39 million in shorts were liquidated within the hour. The catch? It faded within minutes, and Bitcoin made a new low overnight. A squeeze can fire — but Friday proved it can fail just as fast.
Here's what matters now. The fuel sits above price: liquidation clusters at $72,000–$73,000, then around $75,700, with bigger pockets near $82,000. A daily close back above $70,000 is the first line shorts have to defend — check $BTC 's chart there, because that's where any squeeze would start. Below, $66,400 is the line in the sand; lose it and the next pool of long liquidations sits near $64,000.
But a setup is not a guarantee. The headwinds are real. Spot Bitcoin ETFs have now bled for seven straight sessions, nearly $1.9 billion in total. Stablecoin supply just shrank $14.2 billion in a month — the fastest drain since June 2022 — so there's less dry powder to buy any dip. Markets price a December Fed hike as a near-certainty. And 76% of Binance accounts are still long, so another leg down would flush longs all over again, not shorts.
The honest read? The sellers are exhausted. Leverage has been forcibly reset, open interest is down 6% in a day, and fear is at 13 on the index. But a squeeze needs buyers, not just trapped shorts. Watch $70,000. If Bitcoin reclaims it and holds, the shorts start paying in a very different way. Until then, this is a setup — not a signal.
$ETH tells the same story: $289 million liquidated Friday, funding flickering around zero, $2,000 the level to watch. If Bitcoin squeezes, Ethereum follows — check its chart too.
Not financial advice. DYOR.
2
Стаття
Переглянути переклад
BNB at $619: Binance Is Healing While the Market PanicsEveryone's panicking. Fear is at 13. And BNB is sitting at $619 — its lowest since August.
But here's the thing nobody's talking about: while the market bled, Binance quietly started healing.
Let me explain why that tension matters.
**The price is ugly. The ecosystem isn't.**
$BNB is down about 11% this week and 54% off its $1,370 all-time high. $BTC is at ~$67K, $ETH under $1,900, and the Fear & Greed Index is deep in Extreme Fear. Nobody's pretending this is a good-looking chart.
But look underneath the price. This week Binance reopened withdrawals on 87 networks, with full restoration targeted by the end of next week. On 13 November it said it had replaced all customer assets hit by the $6.34B October hack — from its SAFU fund, insurance funds and treasury. That's the exchange visibly putting itself back together, in public, while the market screams.
And BNB Chain never actually stopped. It logged 4.86 million active addresses in a single day on 9 November — more than any other public chain. Daily DEX volume is still ~$1.26B, stablecoins on chain sit at ~$12.9B, and TVL is ~$4.75B. The chain is being used. The price just isn't reflecting it yet.
**The relative-strength story — told honestly**
From 9 October to 7 November, BNB fell just 5.6% — the smallest drop of the big five. BTC fell 7.3%, ETH 9.7%, SOL 18.5%. BNB was the steadiest major in the room.
Then Friday happened. Hot CPI pushed December hike odds toward 90%, and BNB fell ~6% in a day to ~$632. The edge evaporated in one session. That's the honest version: BNB's resilience was real, but it wasn't a shield.
History says the same thing. In October 2025, BNB dipped just 2–3% in the $19B liquidation crash, then ripped 16% to a new all-time high in two days — and gave back 14% within days. When BNB leads, the lead is usually measured in days, not weeks.
**The levels that actually matter**
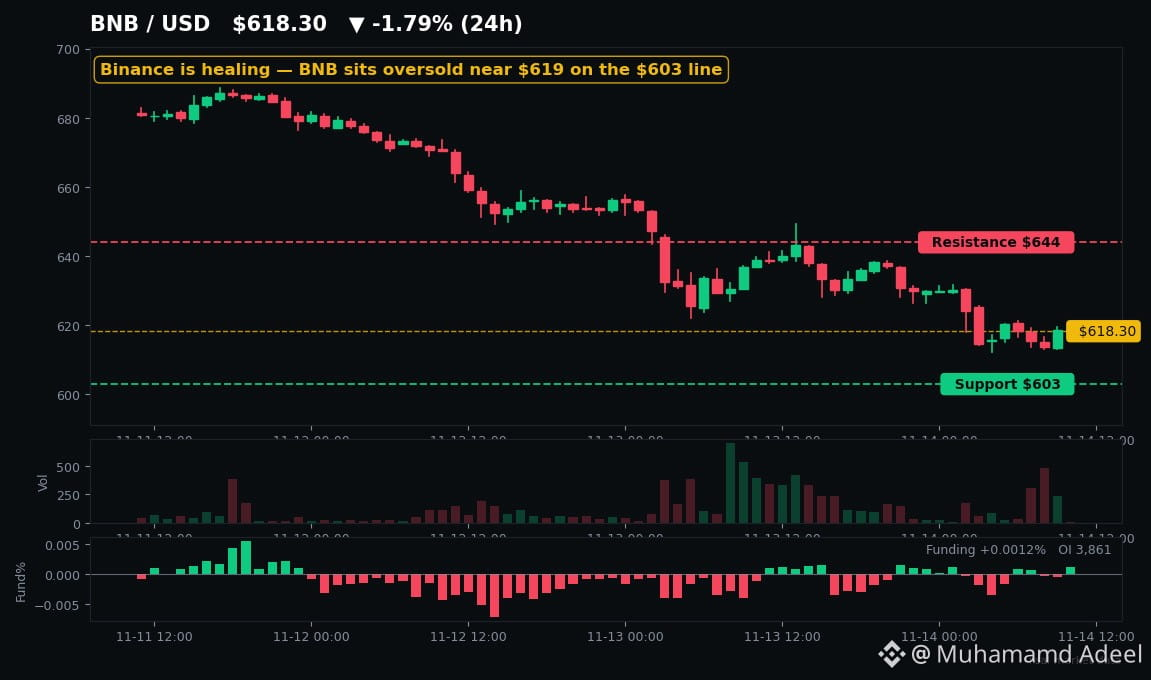
BNB is sitting right on its support band. $603–$606 is the line in the sand, with $589–$600 below it. Overhead: $636 first, then the $644 pivot it just lost, then the 200-day average at ~$658. Reclaim $644 and the conversation changes. Lose $603 and $580 comes into view fast.
One more thing: the daily RSI is around 25 — deeply oversold. Oversold doesn't mean "buy now." It means the selling has been relentless, and crowded longs (71% of Binance accounts are still long) are the fuel for one more flush if $603 breaks.
So here's my take. The Binance recovery story is real — 87 networks back, customers made whole, the chain still leading on users. But in a market pricing a December hike, fundamentals don't set the price today. Fear does.
Watch $BNB at $603. That's where this story gets decided.
Not financial advice. DYOR.
BNB at $619: Binance Is Healing While the Market Panics
Everyone's panicking. Fear is at 13. And BNB is sitting at $619 — its lowest since August.
But here's the thing nobody's talking about: while the market bled, Binance quietly started healing.
Let me explain why that tension matters.
**The price is ugly. The ecosystem isn't.**
$BNB is down about 11% this week and 54% off its $1,370 all-time high. $BTC is at ~$67K, $ETH under $1,900, and the Fear & Greed Index is deep in Extreme Fear. Nobody's pretending this is a good-looking chart.
But look underneath the price. This week Binance reopened withdrawals on 87 networks, with full restoration targeted by the end of next week. On 13 November it said it had replaced all customer assets hit by the $6.34B October hack — from its SAFU fund, insurance funds and treasury. That's the exchange visibly putting itself back together, in public, while the market screams.
And BNB Chain never actually stopped. It logged 4.86 million active addresses in a single day on 9 November — more than any other public chain. Daily DEX volume is still ~$1.26B, stablecoins on chain sit at ~$12.9B, and TVL is ~$4.75B. The chain is being used. The price just isn't reflecting it yet.
**The relative-strength story — told honestly**
From 9 October to 7 November, BNB fell just 5.6% — the smallest drop of the big five. BTC fell 7.3%, ETH 9.7%, SOL 18.5%. BNB was the steadiest major in the room.
Then Friday happened. Hot CPI pushed December hike odds toward 90%, and BNB fell ~6% in a day to ~$632. The edge evaporated in one session. That's the honest version: BNB's resilience was real, but it wasn't a shield.
History says the same thing. In October 2025, BNB dipped just 2–3% in the $19B liquidation crash, then ripped 16% to a new all-time high in two days — and gave back 14% within days. When BNB leads, the lead is usually measured in days, not weeks.
**The levels that actually matter**
BNB is sitting right on its support band. $603–$606 is the line in the sand, with $589–$600 below it. Overhead: $636 first, then the $644 pivot it just lost, then the 200-day average at ~$658. Reclaim $644 and the conversation changes. Lose $603 and $580 comes into view fast.
One more thing: the daily RSI is around 25 — deeply oversold. Oversold doesn't mean "buy now." It means the selling has been relentless, and crowded longs (71% of Binance accounts are still long) are the fuel for one more flush if $603 breaks.
So here's my take. The Binance recovery story is real — 87 networks back, customers made whole, the chain still leading on users. But in a market pricing a December hike, fundamentals don't set the price today. Fear does.
Watch $BNB at $603. That's where this story gets decided.
Not financial advice. DYOR.
But here's the thing nobody's talking about: while the market bled, Binance quietly started healing.
Let me explain why that tension matters.
**The price is ugly. The ecosystem isn't.**
$BNB is down about 11% this week and 54% off its $1,370 all-time high. $BTC is at ~$67K, $ETH under $1,900, and the Fear & Greed Index is deep in Extreme Fear. Nobody's pretending this is a good-looking chart.
But look underneath the price. This week Binance reopened withdrawals on 87 networks, with full restoration targeted by the end of next week. On 13 November it said it had replaced all customer assets hit by the $6.34B October hack — from its SAFU fund, insurance funds and treasury. That's the exchange visibly putting itself back together, in public, while the market screams.
And BNB Chain never actually stopped. It logged 4.86 million active addresses in a single day on 9 November — more than any other public chain. Daily DEX volume is still ~$1.26B, stablecoins on chain sit at ~$12.9B, and TVL is ~$4.75B. The chain is being used. The price just isn't reflecting it yet.
**The relative-strength story — told honestly**
From 9 October to 7 November, BNB fell just 5.6% — the smallest drop of the big five. BTC fell 7.3%, ETH 9.7%, SOL 18.5%. BNB was the steadiest major in the room.
Then Friday happened. Hot CPI pushed December hike odds toward 90%, and BNB fell ~6% in a day to ~$632. The edge evaporated in one session. That's the honest version: BNB's resilience was real, but it wasn't a shield.
History says the same thing. In October 2025, BNB dipped just 2–3% in the $19B liquidation crash, then ripped 16% to a new all-time high in two days — and gave back 14% within days. When BNB leads, the lead is usually measured in days, not weeks.
**The levels that actually matter**
BNB is sitting right on its support band. $603–$606 is the line in the sand, with $589–$600 below it. Overhead: $636 first, then the $644 pivot it just lost, then the 200-day average at ~$658. Reclaim $644 and the conversation changes. Lose $603 and $580 comes into view fast.
One more thing: the daily RSI is around 25 — deeply oversold. Oversold doesn't mean "buy now." It means the selling has been relentless, and crowded longs (71% of Binance accounts are still long) are the fuel for one more flush if $603 breaks.
So here's my take. The Binance recovery story is real — 87 networks back, customers made whole, the chain still leading on users. But in a market pricing a December hike, fundamentals don't set the price today. Fear does.
Watch $BNB at $603. That's where this story gets decided.
Not financial advice. DYOR.
2
Стаття
Переглянути переклад
TAO Is 72% Below Its Peak — But Its Subnets Just Hit $70M RevenueTAO is down 72% from its peak and nobody's talking about it. Meanwhile its subnets are quietly doing ~$70M a year in real revenue.
So which one is lying — the price, or the fundamentals?
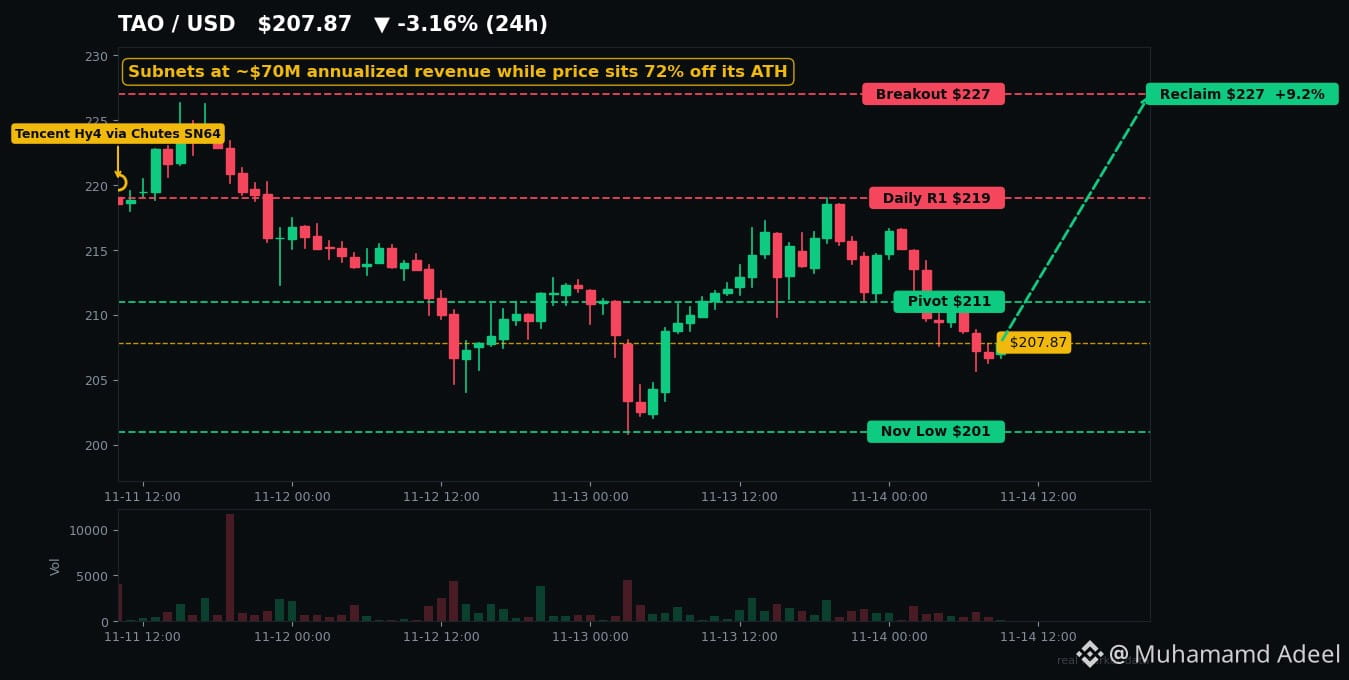
Let's start with the ugly part, because you deserve it straight. $TAO trades around $208 right now, down ~21% in 30 days and ~72% below its $757.60 all-time high from March 2024. It's sitting below every major daily moving average, RSI is 34–37 — weak, but not washed out yet. And the tape just rejected the $219 level again.
The line that matters is $211. That's the daily pivot — dips were bought there six times, most recently on 13 November. Lose it on a daily close and $201 is next, then $188. Reclaim $219, then $227, and the whole downtrend leg starts to crack. Tap $TAO and look at the chart yourself — those two levels are doing all the talking this week.
Now the part nobody's pricing in.
Bittensor's subnets are now generating an estimated ~$70M in annualised revenue — roughly double where they were in August, according to SubConnect's 4 November estimate. Lium, one GPU-rental subnet, reportedly did $2.7M of customer spend in 31 days. And on 4 November, Tencent launched its giant Hy4 AI model with Chutes — a Bittensor subnet — as a launch partner, undercutting Tencent's own pricing by roughly 37%. TAO bounced 3% that day. Then the market forgot about it.
That's the tension. Real customers are paying real money for compute on this network, while the token trades like the whole AI story is dead.
But — and this is important — don't let the revenue number fool you either. Independent estimates put real external revenue at only ~5–12% of the roughly $290M a year in new TAO issuance. The rest is subsidy, not sales. Exchange balances have been creeping up — over 330,000 TAO in a month — and dTAO liquidity just hit an all-time low of ~$375M on 13 November. Stakers quietly left subnets for seven straight days earlier this month. The honest read: the network is building, but the token is still mostly paying for itself with fresh supply.
History says this setup cuts both ways. In April 2025, TAO capitulated to ~$168 — then ripped more than 80% in weeks. But the last two big catalysts did nothing on arrival: the dTAO launch in February 2025 was followed by a ~50% slide, and the first halving in December 2025 by a 24% down-month. Upgrades don't save price. Demand does.
Here's the broader context. The whole AI-token sector is bleeding with the market — $FET is down on the week too, and the AI basket is down ~23% in 30 days. $BTC is stuck near $67K with Fear & Greed at 13, Extreme Fear. In that tape, no AI token gets a free pass. Analysts are split on the same line: Ali Martinez flagged a TD Sequential buy signal near $200, while Michaël van de Poppe says a weekly close above $220 is what would actually change the picture.
So watch two numbers and ignore the noise. A daily close above $227 breaks the downtrend leg. A daily close below $201 opens the door to $188 — and to the April 2025 playbook, where the deepest fear marked the turn.
The price says AI crypto is finished. The subnets say customers are still paying. One of them is wrong — and $211 is where we'll find out which.
Not financial advice. DYOR.
TAO Is 72% Below Its Peak — But Its Subnets Just Hit $70M Revenue
TAO is down 72% from its peak and nobody's talking about it. Meanwhile its subnets are quietly doing ~$70M a year in real revenue.
So which one is lying — the price, or the fundamentals?
Let's start with the ugly part, because you deserve it straight. $TAO trades around $208 right now, down ~21% in 30 days and ~72% below its $757.60 all-time high from March 2024. It's sitting below every major daily moving average, RSI is 34–37 — weak, but not washed out yet. And the tape just rejected the $219 level again.
The line that matters is $211. That's the daily pivot — dips were bought there six times, most recently on 13 November. Lose it on a daily close and $201 is next, then $188. Reclaim $219, then $227, and the whole downtrend leg starts to crack. Tap $TAO and look at the chart yourself — those two levels are doing all the talking this week.
Now the part nobody's pricing in.
Bittensor's subnets are now generating an estimated ~$70M in annualised revenue — roughly double where they were in August, according to SubConnect's 4 November estimate. Lium, one GPU-rental subnet, reportedly did $2.7M of customer spend in 31 days. And on 4 November, Tencent launched its giant Hy4 AI model with Chutes — a Bittensor subnet — as a launch partner, undercutting Tencent's own pricing by roughly 37%. TAO bounced 3% that day. Then the market forgot about it.
That's the tension. Real customers are paying real money for compute on this network, while the token trades like the whole AI story is dead.
But — and this is important — don't let the revenue number fool you either. Independent estimates put real external revenue at only ~5–12% of the roughly $290M a year in new TAO issuance. The rest is subsidy, not sales. Exchange balances have been creeping up — over 330,000 TAO in a month — and dTAO liquidity just hit an all-time low of ~$375M on 13 November. Stakers quietly left subnets for seven straight days earlier this month. The honest read: the network is building, but the token is still mostly paying for itself with fresh supply.
History says this setup cuts both ways. In April 2025, TAO capitulated to ~$168 — then ripped more than 80% in weeks. But the last two big catalysts did nothing on arrival: the dTAO launch in February 2025 was followed by a ~50% slide, and the first halving in December 2025 by a 24% down-month. Upgrades don't save price. Demand does.
Here's the broader context. The whole AI-token sector is bleeding with the market — $FET is down on the week too, and the AI basket is down ~23% in 30 days. $BTC is stuck near $67K with Fear & Greed at 13, Extreme Fear. In that tape, no AI token gets a free pass. Analysts are split on the same line: Ali Martinez flagged a TD Sequential buy signal near $200, while Michaël van de Poppe says a weekly close above $220 is what would actually change the picture.
So watch two numbers and ignore the noise. A daily close above $227 breaks the downtrend leg. A daily close below $201 opens the door to $188 — and to the April 2025 playbook, where the deepest fear marked the turn.
The price says AI crypto is finished. The subnets say customers are still paying. One of them is wrong — and $211 is where we'll find out which.
Not financial advice. DYOR.
So which one is lying — the price, or the fundamentals?
Let's start with the ugly part, because you deserve it straight. $TAO trades around $208 right now, down ~21% in 30 days and ~72% below its $757.60 all-time high from March 2024. It's sitting below every major daily moving average, RSI is 34–37 — weak, but not washed out yet. And the tape just rejected the $219 level again.
The line that matters is $211. That's the daily pivot — dips were bought there six times, most recently on 13 November. Lose it on a daily close and $201 is next, then $188. Reclaim $219, then $227, and the whole downtrend leg starts to crack. Tap $TAO and look at the chart yourself — those two levels are doing all the talking this week.
Now the part nobody's pricing in.
Bittensor's subnets are now generating an estimated ~$70M in annualised revenue — roughly double where they were in August, according to SubConnect's 4 November estimate. Lium, one GPU-rental subnet, reportedly did $2.7M of customer spend in 31 days. And on 4 November, Tencent launched its giant Hy4 AI model with Chutes — a Bittensor subnet — as a launch partner, undercutting Tencent's own pricing by roughly 37%. TAO bounced 3% that day. Then the market forgot about it.
That's the tension. Real customers are paying real money for compute on this network, while the token trades like the whole AI story is dead.
But — and this is important — don't let the revenue number fool you either. Independent estimates put real external revenue at only ~5–12% of the roughly $290M a year in new TAO issuance. The rest is subsidy, not sales. Exchange balances have been creeping up — over 330,000 TAO in a month — and dTAO liquidity just hit an all-time low of ~$375M on 13 November. Stakers quietly left subnets for seven straight days earlier this month. The honest read: the network is building, but the token is still mostly paying for itself with fresh supply.
History says this setup cuts both ways. In April 2025, TAO capitulated to ~$168 — then ripped more than 80% in weeks. But the last two big catalysts did nothing on arrival: the dTAO launch in February 2025 was followed by a ~50% slide, and the first halving in December 2025 by a 24% down-month. Upgrades don't save price. Demand does.
Here's the broader context. The whole AI-token sector is bleeding with the market — $FET is down on the week too, and the AI basket is down ~23% in 30 days. $BTC is stuck near $67K with Fear & Greed at 13, Extreme Fear. In that tape, no AI token gets a free pass. Analysts are split on the same line: Ali Martinez flagged a TD Sequential buy signal near $200, while Michaël van de Poppe says a weekly close above $220 is what would actually change the picture.
So watch two numbers and ignore the noise. A daily close above $227 breaks the downtrend leg. A daily close below $201 opens the door to $188 — and to the April 2025 playbook, where the deepest fear marked the turn.
The price says AI crypto is finished. The subnets say customers are still paying. One of them is wrong — and $211 is where we'll find out which.
Not financial advice. DYOR.
5
Стаття
Переглянути переклад
Fear is at 13. BTC is at $67K. Here's what nobody's telling you.Fear is at 13. Bitcoin just printed $66,456 — its lowest since August.
And yet the loudest voices on my timeline aren't the bears. They're the buyers. So who's actually right?
**1. Bitcoin's new leg down — and the longs who paid for it**
Saturday brought a fresh low, not a bounce: BTC slid to $66,456, down almost 12% on the week, while $1.26 billion in leveraged positions got wiped out in 24 hours — 86% longs, 173,000 traders liquidated. Spot ETFs bled for a seventh straight day, another $185.4 million out on Friday, almost all of it from BlackRock's IBIT.
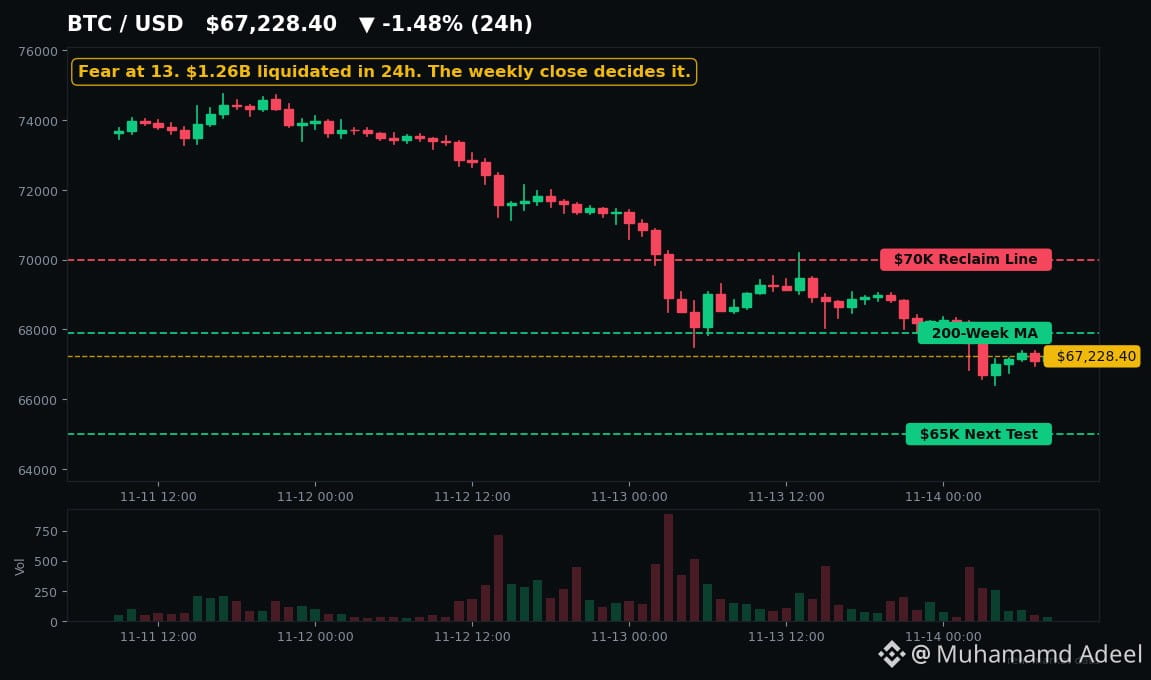
The $70K break was Thursday's story — this is the market failing to bounce off it. $BTC sits right on its 200-week average near $67,900 — hold that into the weekly close and the dip-buyers have a real case. Lose it, and $65,000 is next.
**2. MSCI just kicked Strategy out of its indexes**
MSCI confirmed on 11 November that Strategy — the biggest corporate Bitcoin holder, with 850,364 BTC — gets removed from the MSCI USA Index after the close on 30 November. JPMorgan puts the forced passive selling at roughly $2.8 billion.
The nuance matters: trader Scott Melker points out the exclusion hits MSTR shares, not Bitcoin itself — nobody is forced to sell BTC. The real risk is the precedent. The treasury-company model just lost its index bid, and if other providers follow, that $2.8 billion becomes $8.8 billion.
**3. The biggest heist in crypto history is turning into a recovery story**
On 12 November, the US Department of Justice got court authorization to seize or restrain over $1.2 billion stolen in the $6.3 billion Binance theft from 29 October. More than $2.7 billion has now been frozen, and Binance says it has fully covered affected assets.
Trust is the one thing this market can't print. Law enforcement clawing back billions from a North Korea-linked theft is the kind of thing that rebuilds confidence one headline at a time.
**4. Louisiana just declared war on prediction markets**
Louisiana's attorney general sued ten prediction-market platforms on 12 November — Kalshi, Polymarket, Robinhood, Coinbase, Crypto.com and more — calling their event contracts illegal gambling. A judge signed a temporary restraining order the same day, expiring 22 November, with an injunction hearing on 30 November.
Prediction markets were crypto's hottest growth story of 2026 — and PREDICT's token event resumes 18 November, right into this headwind.
**What I'm watching**
The weekly close is everything. $BTC above the 200-week average keeps the bounce case alive; below it, the $62K–$64K zone is the next real support. A December Fed hike is roughly 89% priced in — the surprise would be 50bp or hawkish dots. $ETH is fighting to hold $1,900 and $SOL is clinging to $75.
One flicker of light: Hyperliquid whales flipped back to net long after two weeks short. Not a bottom call — February's Fear reading of 5 marked a zone, then weeks of chop. Check the $BTC chart — the next candle decides the story.
Not financial advice. DYOR.
Fear is at 13. BTC is at $67K. Here's what nobody's telling you.
Fear is at 13. Bitcoin just printed $66,456 — its lowest since August.
And yet the loudest voices on my timeline aren't the bears. They're the buyers. So who's actually right?
**1. Bitcoin's new leg down — and the longs who paid for it**
Saturday brought a fresh low, not a bounce: BTC slid to $66,456, down almost 12% on the week, while $1.26 billion in leveraged positions got wiped out in 24 hours — 86% longs, 173,000 traders liquidated. Spot ETFs bled for a seventh straight day, another $185.4 million out on Friday, almost all of it from BlackRock's IBIT.
The $70K break was Thursday's story — this is the market failing to bounce off it. $BTC sits right on its 200-week average near $67,900 — hold that into the weekly close and the dip-buyers have a real case. Lose it, and $65,000 is next.
**2. MSCI just kicked Strategy out of its indexes**
MSCI confirmed on 11 November that Strategy — the biggest corporate Bitcoin holder, with 850,364 BTC — gets removed from the MSCI USA Index after the close on 30 November. JPMorgan puts the forced passive selling at roughly $2.8 billion.
The nuance matters: trader Scott Melker points out the exclusion hits MSTR shares, not Bitcoin itself — nobody is forced to sell BTC. The real risk is the precedent. The treasury-company model just lost its index bid, and if other providers follow, that $2.8 billion becomes $8.8 billion.
**3. The biggest heist in crypto history is turning into a recovery story**
On 12 November, the US Department of Justice got court authorization to seize or restrain over $1.2 billion stolen in the $6.3 billion Binance theft from 29 October. More than $2.7 billion has now been frozen, and Binance says it has fully covered affected assets.
Trust is the one thing this market can't print. Law enforcement clawing back billions from a North Korea-linked theft is the kind of thing that rebuilds confidence one headline at a time.
**4. Louisiana just declared war on prediction markets**
Louisiana's attorney general sued ten prediction-market platforms on 12 November — Kalshi, Polymarket, Robinhood, Coinbase, Crypto.com and more — calling their event contracts illegal gambling. A judge signed a temporary restraining order the same day, expiring 22 November, with an injunction hearing on 30 November.
Prediction markets were crypto's hottest growth story of 2026 — and PREDICT's token event resumes 18 November, right into this headwind.
**What I'm watching**
The weekly close is everything. $BTC above the 200-week average keeps the bounce case alive; below it, the $62K–$64K zone is the next real support. A December Fed hike is roughly 89% priced in — the surprise would be 50bp or hawkish dots. $ETH is fighting to hold $1,900 and $SOL is clinging to $75.
One flicker of light: Hyperliquid whales flipped back to net long after two weeks short. Not a bottom call — February's Fear reading of 5 marked a zone, then weeks of chop. Check the $BTC chart — the next candle decides the story.
Not financial advice. DYOR.
And yet the loudest voices on my timeline aren't the bears. They're the buyers. So who's actually right?
**1. Bitcoin's new leg down — and the longs who paid for it**
Saturday brought a fresh low, not a bounce: BTC slid to $66,456, down almost 12% on the week, while $1.26 billion in leveraged positions got wiped out in 24 hours — 86% longs, 173,000 traders liquidated. Spot ETFs bled for a seventh straight day, another $185.4 million out on Friday, almost all of it from BlackRock's IBIT.
The $70K break was Thursday's story — this is the market failing to bounce off it. $BTC sits right on its 200-week average near $67,900 — hold that into the weekly close and the dip-buyers have a real case. Lose it, and $65,000 is next.
**2. MSCI just kicked Strategy out of its indexes**
MSCI confirmed on 11 November that Strategy — the biggest corporate Bitcoin holder, with 850,364 BTC — gets removed from the MSCI USA Index after the close on 30 November. JPMorgan puts the forced passive selling at roughly $2.8 billion.
The nuance matters: trader Scott Melker points out the exclusion hits MSTR shares, not Bitcoin itself — nobody is forced to sell BTC. The real risk is the precedent. The treasury-company model just lost its index bid, and if other providers follow, that $2.8 billion becomes $8.8 billion.
**3. The biggest heist in crypto history is turning into a recovery story**
On 12 November, the US Department of Justice got court authorization to seize or restrain over $1.2 billion stolen in the $6.3 billion Binance theft from 29 October. More than $2.7 billion has now been frozen, and Binance says it has fully covered affected assets.
Trust is the one thing this market can't print. Law enforcement clawing back billions from a North Korea-linked theft is the kind of thing that rebuilds confidence one headline at a time.
**4. Louisiana just declared war on prediction markets**
Louisiana's attorney general sued ten prediction-market platforms on 12 November — Kalshi, Polymarket, Robinhood, Coinbase, Crypto.com and more — calling their event contracts illegal gambling. A judge signed a temporary restraining order the same day, expiring 22 November, with an injunction hearing on 30 November.
Prediction markets were crypto's hottest growth story of 2026 — and PREDICT's token event resumes 18 November, right into this headwind.
**What I'm watching**
The weekly close is everything. $BTC above the 200-week average keeps the bounce case alive; below it, the $62K–$64K zone is the next real support. A December Fed hike is roughly 89% priced in — the surprise would be 50bp or hawkish dots. $ETH is fighting to hold $1,900 and $SOL is clinging to $75.
One flicker of light: Hyperliquid whales flipped back to net long after two weeks short. Not a bottom call — February's Fear reading of 5 marked a zone, then weeks of chop. Check the $BTC chart — the next candle decides the story.
Not financial advice. DYOR.
2
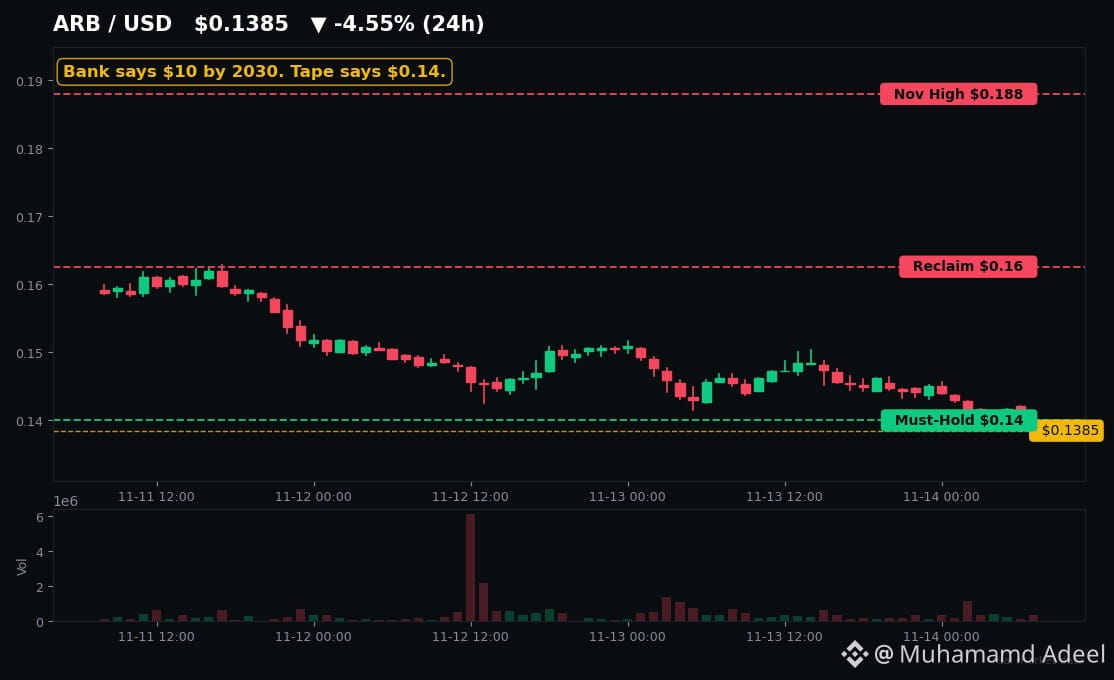
Стаття
Переглянути переклад
Standard Chartered Says $10. ARB Trades at $0.14. Who's Wrong?A major bank says $ARB hits $10 by 2030. Right now it trades at $0.14 — 94% below its peak.
One of them is about to look very wrong. And the next 48 hours might decide which one.
The bull case comes from Standard Chartered. Geoff Kendrick's team set ARB targets of $0.50 by end of this year, $1.50 in 2027, $3.50 in 2028 — all the way to $10 by 2030. That's a 70x from here. Their thesis: tokenized stocks and real-world assets are coming on-chain, and Arbitrum is where much of that business lands. Robinhood is building its chain on Arbitrum's tech.
And the network is not the problem. Arbitrum just pulled the largest net bridge inflow of any chain — $194.5M in a single week. It holds $3.68B in stablecoins, $1.34B in DeFi TVL, and processes around 1.6 million transactions a day. Stripe added USDC payouts on Arbitrum this month.
So why is the token dying? Because the token and the chain have decoupled.
ARB is a governance token. No fee share, no buyback, no dividend. Fees are paid in ETH, and the revenue flows to the DAO treasury, not to holders. Even Standard Chartered admits the $10 call depends on value accrual actually happening — something that doesn't exist today. Meanwhile Base now does 60%+ of all L2 transactions, and Arbitrum's DeFi TVL has roughly halved this year.
Then there's Monday. A 92.65M ARB unlock — about $13.7M worth — hits on 16 November, split between investors and the team. Only ~1% of supply, but it lands into a market where the crowd is already shorting ARB hard and the Fear & Greed Index sits at Extreme Fear.
History says don't count ARB out completely. After the October 2025 flash crash it wicked to ~$0.10 and tripled within days. September 2026 was its best month ever — up 86%. This token bounces violently when everyone writes it off. But every one of those bounces faded, because the higher-timeframe trend never flipped.
So here's the setup. $0.14 is the line in the sand — today's low and the support everyone is staring at. Lose it into the unlock and the next stop is the 200-day average near $0.125, then thin air toward the June low of $0.07. Reclaim $0.16 and the short crowd starts sweating — $0.188 is where the last rally died. Tap $ARB and check where that $0.14 line stands right now, because the chart will tell you before the headlines do.
My take? The chain is a buy. The token is a question mark — a bank's 70x dream on one side, a supply event in 48 hours on the other. $ETH holders should care too: Arbitrum is still Ethereum's biggest L2, and whatever happens here sets the tone for the whole L2 trade, $OP included.
The gap between a thriving network and a bleeding token is the whole story. One of them closes. Which side are you on?
Not financial advice. DYOR.
Standard Chartered Says $10. ARB Trades at $0.14. Who's Wrong?
A major bank says $ARB hits $10 by 2030. Right now it trades at $0.14 — 94% below its peak.
One of them is about to look very wrong. And the next 48 hours might decide which one.
The bull case comes from Standard Chartered. Geoff Kendrick's team set ARB targets of $0.50 by end of this year, $1.50 in 2027, $3.50 in 2028 — all the way to $10 by 2030. That's a 70x from here. Their thesis: tokenized stocks and real-world assets are coming on-chain, and Arbitrum is where much of that business lands. Robinhood is building its chain on Arbitrum's tech.
And the network is not the problem. Arbitrum just pulled the largest net bridge inflow of any chain — $194.5M in a single week. It holds $3.68B in stablecoins, $1.34B in DeFi TVL, and processes around 1.6 million transactions a day. Stripe added USDC payouts on Arbitrum this month.
So why is the token dying? Because the token and the chain have decoupled.
ARB is a governance token. No fee share, no buyback, no dividend. Fees are paid in ETH, and the revenue flows to the DAO treasury, not to holders. Even Standard Chartered admits the $10 call depends on value accrual actually happening — something that doesn't exist today. Meanwhile Base now does 60%+ of all L2 transactions, and Arbitrum's DeFi TVL has roughly halved this year.
Then there's Monday. A 92.65M ARB unlock — about $13.7M worth — hits on 16 November, split between investors and the team. Only ~1% of supply, but it lands into a market where the crowd is already shorting ARB hard and the Fear & Greed Index sits at Extreme Fear.
History says don't count ARB out completely. After the October 2025 flash crash it wicked to ~$0.10 and tripled within days. September 2026 was its best month ever — up 86%. This token bounces violently when everyone writes it off. But every one of those bounces faded, because the higher-timeframe trend never flipped.
So here's the setup. $0.14 is the line in the sand — today's low and the support everyone is staring at. Lose it into the unlock and the next stop is the 200-day average near $0.125, then thin air toward the June low of $0.07. Reclaim $0.16 and the short crowd starts sweating — $0.188 is where the last rally died. Tap $ARB and check where that $0.14 line stands right now, because the chart will tell you before the headlines do.
My take? The chain is a buy. The token is a question mark — a bank's 70x dream on one side, a supply event in 48 hours on the other. $ETH holders should care too: Arbitrum is still Ethereum's biggest L2, and whatever happens here sets the tone for the whole L2 trade, $OP included.
The gap between a thriving network and a bleeding token is the whole story. One of them closes. Which side are you on?
Not financial advice. DYOR.
One of them is about to look very wrong. And the next 48 hours might decide which one.
The bull case comes from Standard Chartered. Geoff Kendrick's team set ARB targets of $0.50 by end of this year, $1.50 in 2027, $3.50 in 2028 — all the way to $10 by 2030. That's a 70x from here. Their thesis: tokenized stocks and real-world assets are coming on-chain, and Arbitrum is where much of that business lands. Robinhood is building its chain on Arbitrum's tech.
And the network is not the problem. Arbitrum just pulled the largest net bridge inflow of any chain — $194.5M in a single week. It holds $3.68B in stablecoins, $1.34B in DeFi TVL, and processes around 1.6 million transactions a day. Stripe added USDC payouts on Arbitrum this month.
So why is the token dying? Because the token and the chain have decoupled.
ARB is a governance token. No fee share, no buyback, no dividend. Fees are paid in ETH, and the revenue flows to the DAO treasury, not to holders. Even Standard Chartered admits the $10 call depends on value accrual actually happening — something that doesn't exist today. Meanwhile Base now does 60%+ of all L2 transactions, and Arbitrum's DeFi TVL has roughly halved this year.
Then there's Monday. A 92.65M ARB unlock — about $13.7M worth — hits on 16 November, split between investors and the team. Only ~1% of supply, but it lands into a market where the crowd is already shorting ARB hard and the Fear & Greed Index sits at Extreme Fear.
History says don't count ARB out completely. After the October 2025 flash crash it wicked to ~$0.10 and tripled within days. September 2026 was its best month ever — up 86%. This token bounces violently when everyone writes it off. But every one of those bounces faded, because the higher-timeframe trend never flipped.
So here's the setup. $0.14 is the line in the sand — today's low and the support everyone is staring at. Lose it into the unlock and the next stop is the 200-day average near $0.125, then thin air toward the June low of $0.07. Reclaim $0.16 and the short crowd starts sweating — $0.188 is where the last rally died. Tap $ARB and check where that $0.14 line stands right now, because the chart will tell you before the headlines do.
My take? The chain is a buy. The token is a question mark — a bank's 70x dream on one side, a supply event in 48 hours on the other. $ETH holders should care too: Arbitrum is still Ethereum's biggest L2, and whatever happens here sets the tone for the whole L2 trade, $OP included.
The gap between a thriving network and a bleeding token is the whole story. One of them closes. Which side are you on?
Not financial advice. DYOR.
19
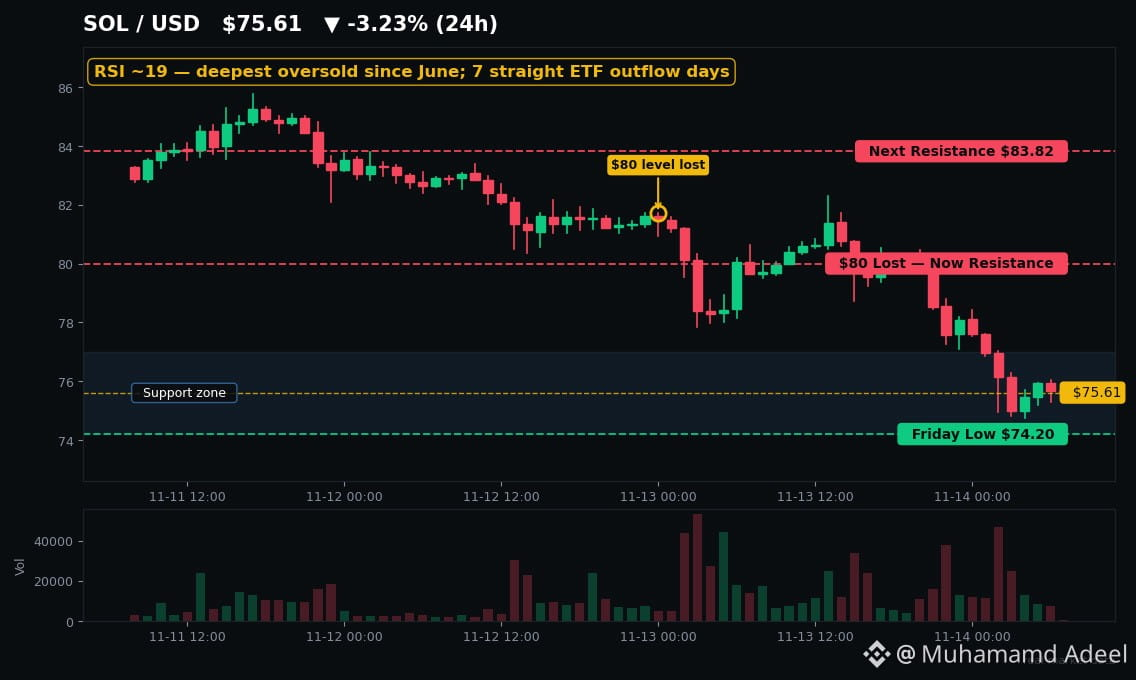
Стаття
Переглянути переклад
SOL just lost $80 with RSI at 19 — history says the next move is violentSolana just lost $80 — and its daily RSI is sitting at 19.
That's not a normal dip anymore. $SOL is down 26% in a month, 74% below its January 2025 high near $294, and the fear gauge reads 13 — Extreme Fear. This is the kind of oversold reading SOL has only flashed a handful of times. And every single time, the snap-back was violent.
$BTC is stuck under $70K near $67,400 and $ETH is under $2,000 — the whole market is in the same flush. But SOL is where the tension is sharpest right now.
Here's what the chart is actually saying.
SOL is trading around $75.60 after closing Friday at $80.72 — the $80 line is now resistance, not support. Below, the next real floor is the $74 area, this morning's low. Lose that on a daily close and analysts point to $70–$75, then $67–$70. Reclaim $80 and the bounce-watchers get their shot: $83.82 first, then the $88–$90 zone where short-term traders are watching for a relief rally. The 200-day average sits near $89 — SOL is 15% under it, below every major moving average. Nothing about the trend is fixed yet.
So why is everyone still watching this coin so closely? Because the story underneath the price is split in two.
On one side, the selling is real and documented. Spot SOL ETFs have now bled for seven straight sessions — $57 million out in the last week alone, $128.6 million since late October. On-chain, supply keeps hitting exchanges: Pump.fun sent 64,666 SOL (about $5.2 million) to Kraken, and an Alameda-linked wallet moved 93,200 SOL to Coinbase after unstaking 204,000 SOL. Hyperliquid's biggest SOL whales are net short $44.8 million. And roughly three-quarters of Binance SOL accounts are still long — the classic fuel for another liquidation cascade if $74 breaks.
On the other side, the fundamentals didn't stop moving. Solana launched Confidential Compute for private AI on Thursday. DTCC plans to connect its tokenization service to Solana in the second half of 2027. Solana's big Breakpoint conference in London starts tomorrow, 15 November. And around 68% of all SOL is staked — with no major cliff unlock ahead.
History is the part that makes this interesting. The last time SOL lost $80, in January 2024, it reclaimed $100 within weeks and ran to $200 by March. In June this year it bottomed near $60 and doubled to $124 in three months. But here's the honest caveat: oversold can get more oversold first. In late 2022 SOL was already oversold near $30 — then fell another 70% before bottoming. And that June bounce? SOL has already given back about 40% of it.
So the read is simple. $SOL at $75 with RSI at 19 is a coiled spring — but springs snap both ways until $80 is reclaimed. Watch the $74 floor and the $80 line: that's where this story gets decided. Check $SOL's chart and tell me — bounce or breakdown?
Not financial advice. DYOR.
SOL just lost $80 with RSI at 19 — history says the next move is violent
Solana just lost $80 — and its daily RSI is sitting at 19.
That's not a normal dip anymore. $SOL is down 26% in a month, 74% below its January 2025 high near $294, and the fear gauge reads 13 — Extreme Fear. This is the kind of oversold reading SOL has only flashed a handful of times. And every single time, the snap-back was violent.
$BTC is stuck under $70K near $67,400 and $ETH is under $2,000 — the whole market is in the same flush. But SOL is where the tension is sharpest right now.
Here's what the chart is actually saying.
SOL is trading around $75.60 after closing Friday at $80.72 — the $80 line is now resistance, not support. Below, the next real floor is the $74 area, this morning's low. Lose that on a daily close and analysts point to $70–$75, then $67–$70. Reclaim $80 and the bounce-watchers get their shot: $83.82 first, then the $88–$90 zone where short-term traders are watching for a relief rally. The 200-day average sits near $89 — SOL is 15% under it, below every major moving average. Nothing about the trend is fixed yet.
So why is everyone still watching this coin so closely? Because the story underneath the price is split in two.
On one side, the selling is real and documented. Spot SOL ETFs have now bled for seven straight sessions — $57 million out in the last week alone, $128.6 million since late October. On-chain, supply keeps hitting exchanges: Pump.fun sent 64,666 SOL (about $5.2 million) to Kraken, and an Alameda-linked wallet moved 93,200 SOL to Coinbase after unstaking 204,000 SOL. Hyperliquid's biggest SOL whales are net short $44.8 million. And roughly three-quarters of Binance SOL accounts are still long — the classic fuel for another liquidation cascade if $74 breaks.
On the other side, the fundamentals didn't stop moving. Solana launched Confidential Compute for private AI on Thursday. DTCC plans to connect its tokenization service to Solana in the second half of 2027. Solana's big Breakpoint conference in London starts tomorrow, 15 November. And around 68% of all SOL is staked — with no major cliff unlock ahead.
History is the part that makes this interesting. The last time SOL lost $80, in January 2024, it reclaimed $100 within weeks and ran to $200 by March. In June this year it bottomed near $60 and doubled to $124 in three months. But here's the honest caveat: oversold can get more oversold first. In late 2022 SOL was already oversold near $30 — then fell another 70% before bottoming. And that June bounce? SOL has already given back about 40% of it.
So the read is simple. $SOL at $75 with RSI at 19 is a coiled spring — but springs snap both ways until $80 is reclaimed. Watch the $74 floor and the $80 line: that's where this story gets decided. Check $SOL 's chart and tell me — bounce or breakdown?
Not financial advice. DYOR.
That's not a normal dip anymore. $SOL is down 26% in a month, 74% below its January 2025 high near $294, and the fear gauge reads 13 — Extreme Fear. This is the kind of oversold reading SOL has only flashed a handful of times. And every single time, the snap-back was violent.
$BTC is stuck under $70K near $67,400 and $ETH is under $2,000 — the whole market is in the same flush. But SOL is where the tension is sharpest right now.
Here's what the chart is actually saying.
SOL is trading around $75.60 after closing Friday at $80.72 — the $80 line is now resistance, not support. Below, the next real floor is the $74 area, this morning's low. Lose that on a daily close and analysts point to $70–$75, then $67–$70. Reclaim $80 and the bounce-watchers get their shot: $83.82 first, then the $88–$90 zone where short-term traders are watching for a relief rally. The 200-day average sits near $89 — SOL is 15% under it, below every major moving average. Nothing about the trend is fixed yet.
So why is everyone still watching this coin so closely? Because the story underneath the price is split in two.
On one side, the selling is real and documented. Spot SOL ETFs have now bled for seven straight sessions — $57 million out in the last week alone, $128.6 million since late October. On-chain, supply keeps hitting exchanges: Pump.fun sent 64,666 SOL (about $5.2 million) to Kraken, and an Alameda-linked wallet moved 93,200 SOL to Coinbase after unstaking 204,000 SOL. Hyperliquid's biggest SOL whales are net short $44.8 million. And roughly three-quarters of Binance SOL accounts are still long — the classic fuel for another liquidation cascade if $74 breaks.
On the other side, the fundamentals didn't stop moving. Solana launched Confidential Compute for private AI on Thursday. DTCC plans to connect its tokenization service to Solana in the second half of 2027. Solana's big Breakpoint conference in London starts tomorrow, 15 November. And around 68% of all SOL is staked — with no major cliff unlock ahead.
History is the part that makes this interesting. The last time SOL lost $80, in January 2024, it reclaimed $100 within weeks and ran to $200 by March. In June this year it bottomed near $60 and doubled to $124 in three months. But here's the honest caveat: oversold can get more oversold first. In late 2022 SOL was already oversold near $30 — then fell another 70% before bottoming. And that June bounce? SOL has already given back about 40% of it.
So the read is simple. $SOL at $75 with RSI at 19 is a coiled spring — but springs snap both ways until $80 is reclaimed. Watch the $74 floor and the $80 line: that's where this story gets decided. Check $SOL 's chart and tell me — bounce or breakdown?
Not financial advice. DYOR.
28
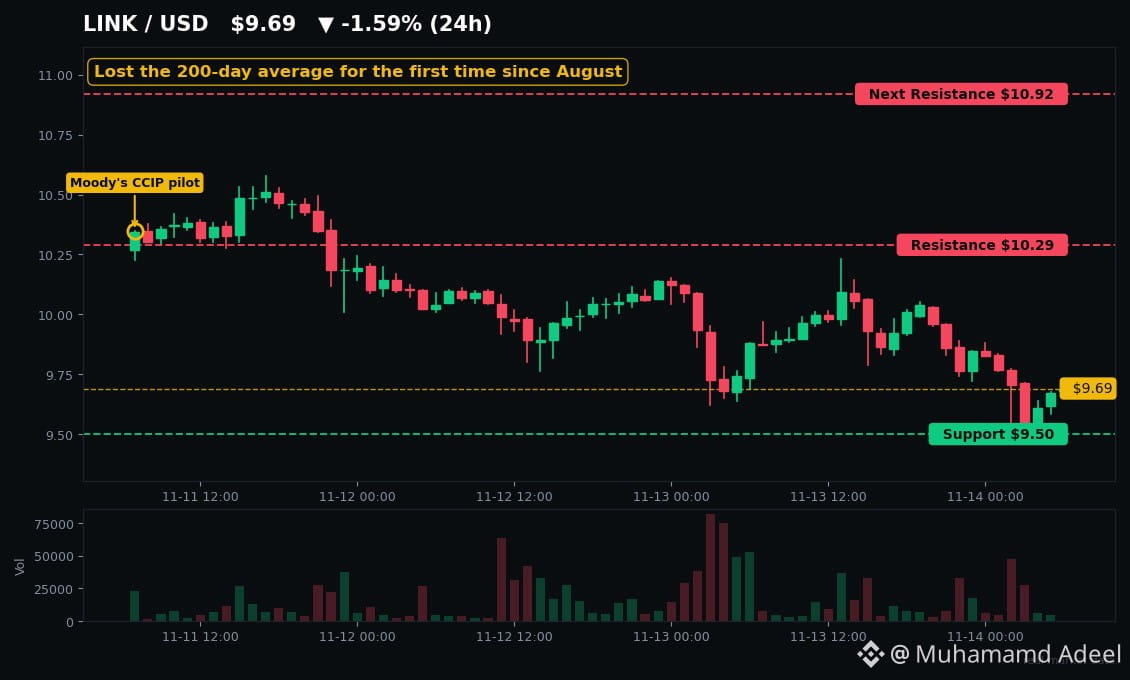
Стаття
Переглянути переклад
Everyone's Panicking. Moody's Just Tested Chainlink's Rails.Everyone's panicking. Moody's just tested Chainlink's rails.
$LINK is sitting at $9.69 — down 21% in a month, 82% below its $52.88 all-time high from May 2021. The Fear & Greed Index is at 13. Extreme fear. The timeline is full of people laughing at LINK holders again.
And right in the middle of that noise, something happened this week that barely moved the price. That's exactly why it's worth your attention.
On 10 November, Moody's Ratings and Chainlink completed a testnet pilot using CCIP to distribute credit-rating data across permissioned and public blockchains at the same time. Testnet only, sample data, no live launch date — I'm not going to oversell it. But stop and think about what it actually is: one of the world's biggest ratings agencies testing whether its data can live on-chain, on Chainlink's rails.
Here's the tension nobody wants to say out loud: the institutions keep building on Chainlink while the token keeps bleeding.
The numbers tell the same two-sided story. LINK lost its 200-day average on 13 November — the first daily close below it since August. RSI is around 31–33, near oversold. Support sits at $9.81, then $9.50. Resistance is $10.29, then $10.59 and $10.92. Reclaim $10.29 and the chart starts breathing again; lose $9.50 and the next stop traders are watching is much lower.
But look underneath the price. Chainlink still secures about $31.8 billion of value across DeFi — roughly 61% of all oracle-secured value — and $AAVE alone, the biggest lending protocol, runs on its feeds. The Chainlink Reserve just added another 106,300 LINK on 12 November, taking it to 6.68 million LINK — 67 straight weeks of revenue-funded buying, no withdrawals. And one whale reportedly bought around 1.4 million LINK, roughly $15 million, into this week's dip.
Even the sceptics have a point worth hearing. Analyst Michaël van de Poppe still sees $20 in the coming months, but only if LINK closes a week above $10.60. The technical desk is blunter: bearish below $11.01. And history is honest about what comes next — LINK fell about 90% from its 2021 top, spent over a year basing, then ran 165% in 2023. Extreme fear like this has marked a zone before, not the day of the bottom.
So here's what this really means. The oracle business is fine. The token is not — yet. $ETH DeFi TVL is down about 7.7% on the week to roughly $74 billion, BTC is stuck under $70,000, and every altcoin is guilty until proven innocent. If BTC rolls over again, LINK falls faster than BTC, not slower. That's the risk, and you should respect it.
But if you're watching one level this weekend, watch the $LINK chart around $9.81 and $10.29. Hold the first and reclaim the second, and the "institutions are building while price bleeds" story stops being a cope — it becomes the setup.
Not financial advice. DYOR.
Everyone's Panicking. Moody's Just Tested Chainlink's Rails.
Everyone's panicking. Moody's just tested Chainlink's rails.
$LINK is sitting at $9.69 — down 21% in a month, 82% below its $52.88 all-time high from May 2021. The Fear & Greed Index is at 13. Extreme fear. The timeline is full of people laughing at LINK holders again.
And right in the middle of that noise, something happened this week that barely moved the price. That's exactly why it's worth your attention.
On 10 November, Moody's Ratings and Chainlink completed a testnet pilot using CCIP to distribute credit-rating data across permissioned and public blockchains at the same time. Testnet only, sample data, no live launch date — I'm not going to oversell it. But stop and think about what it actually is: one of the world's biggest ratings agencies testing whether its data can live on-chain, on Chainlink's rails.
Here's the tension nobody wants to say out loud: the institutions keep building on Chainlink while the token keeps bleeding.
The numbers tell the same two-sided story. LINK lost its 200-day average on 13 November — the first daily close below it since August. RSI is around 31–33, near oversold. Support sits at $9.81, then $9.50. Resistance is $10.29, then $10.59 and $10.92. Reclaim $10.29 and the chart starts breathing again; lose $9.50 and the next stop traders are watching is much lower.
But look underneath the price. Chainlink still secures about $31.8 billion of value across DeFi — roughly 61% of all oracle-secured value — and $AAVE alone, the biggest lending protocol, runs on its feeds. The Chainlink Reserve just added another 106,300 LINK on 12 November, taking it to 6.68 million LINK — 67 straight weeks of revenue-funded buying, no withdrawals. And one whale reportedly bought around 1.4 million LINK, roughly $15 million, into this week's dip.
Even the sceptics have a point worth hearing. Analyst Michaël van de Poppe still sees $20 in the coming months, but only if LINK closes a week above $10.60. The technical desk is blunter: bearish below $11.01. And history is honest about what comes next — LINK fell about 90% from its 2021 top, spent over a year basing, then ran 165% in 2023. Extreme fear like this has marked a zone before, not the day of the bottom.
So here's what this really means. The oracle business is fine. The token is not — yet. $ETH DeFi TVL is down about 7.7% on the week to roughly $74 billion, BTC is stuck under $70,000, and every altcoin is guilty until proven innocent. If BTC rolls over again, LINK falls faster than BTC, not slower. That's the risk, and you should respect it.
But if you're watching one level this weekend, watch the $LINK chart around $9.81 and $10.29. Hold the first and reclaim the second, and the "institutions are building while price bleeds" story stops being a cope — it becomes the setup.
Not financial advice. DYOR.
$LINK is sitting at $9.69 — down 21% in a month, 82% below its $52.88 all-time high from May 2021. The Fear & Greed Index is at 13. Extreme fear. The timeline is full of people laughing at LINK holders again.
And right in the middle of that noise, something happened this week that barely moved the price. That's exactly why it's worth your attention.
On 10 November, Moody's Ratings and Chainlink completed a testnet pilot using CCIP to distribute credit-rating data across permissioned and public blockchains at the same time. Testnet only, sample data, no live launch date — I'm not going to oversell it. But stop and think about what it actually is: one of the world's biggest ratings agencies testing whether its data can live on-chain, on Chainlink's rails.
Here's the tension nobody wants to say out loud: the institutions keep building on Chainlink while the token keeps bleeding.
The numbers tell the same two-sided story. LINK lost its 200-day average on 13 November — the first daily close below it since August. RSI is around 31–33, near oversold. Support sits at $9.81, then $9.50. Resistance is $10.29, then $10.59 and $10.92. Reclaim $10.29 and the chart starts breathing again; lose $9.50 and the next stop traders are watching is much lower.
But look underneath the price. Chainlink still secures about $31.8 billion of value across DeFi — roughly 61% of all oracle-secured value — and $AAVE alone, the biggest lending protocol, runs on its feeds. The Chainlink Reserve just added another 106,300 LINK on 12 November, taking it to 6.68 million LINK — 67 straight weeks of revenue-funded buying, no withdrawals. And one whale reportedly bought around 1.4 million LINK, roughly $15 million, into this week's dip.
Even the sceptics have a point worth hearing. Analyst Michaël van de Poppe still sees $20 in the coming months, but only if LINK closes a week above $10.60. The technical desk is blunter: bearish below $11.01. And history is honest about what comes next — LINK fell about 90% from its 2021 top, spent over a year basing, then ran 165% in 2023. Extreme fear like this has marked a zone before, not the day of the bottom.
So here's what this really means. The oracle business is fine. The token is not — yet. $ETH DeFi TVL is down about 7.7% on the week to roughly $74 billion, BTC is stuck under $70,000, and every altcoin is guilty until proven innocent. If BTC rolls over again, LINK falls faster than BTC, not slower. That's the risk, and you should respect it.
But if you're watching one level this weekend, watch the $LINK chart around $9.81 and $10.29. Hold the first and reclaim the second, and the "institutions are building while price bleeds" story stops being a cope — it becomes the setup.
Not financial advice. DYOR.
34
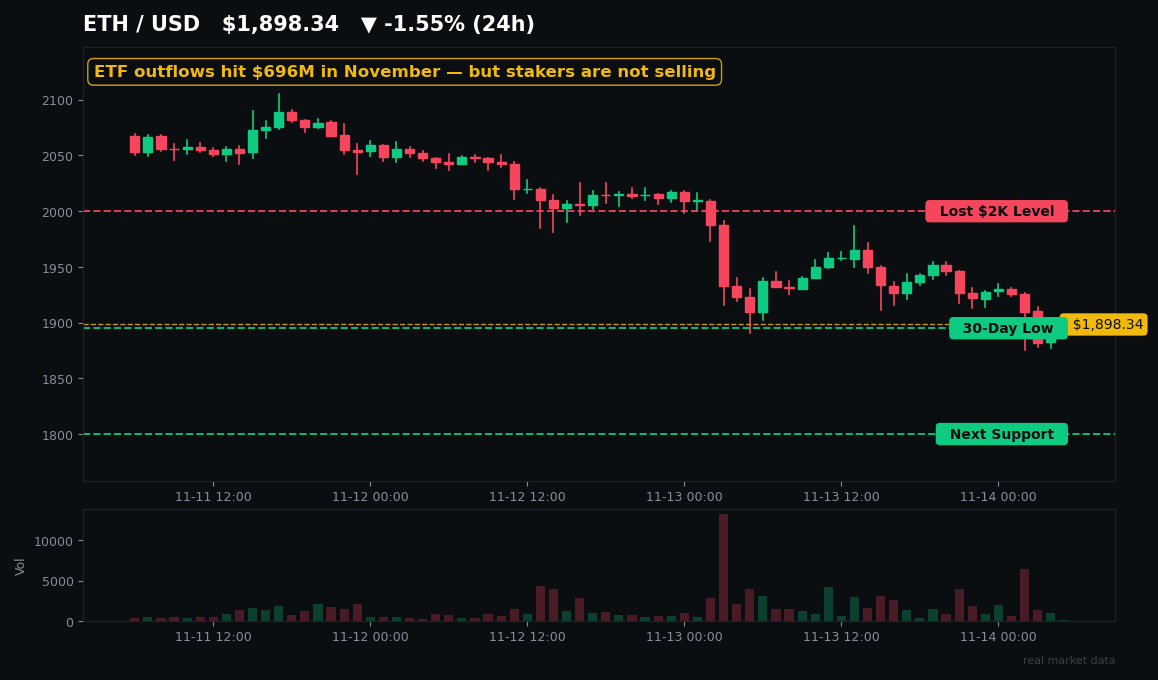
Стаття
Переглянути переклад
ETH Just Lost $2,000 — Here's the Level That Decides What's NextEthereum just lost the $2,000 level — for the first time since August.
It's trading around $1,900 this morning, down 14% in a week. And the question on every timeline is simple: is this the bottom, or the next leg down?
Here's what actually happened.
Friday was brutal. ETH slid to $1,896, its lowest in a month, and nearly $288 million in ETH positions got liquidated — 90% of them longs. The trigger was a one-two punch: October PPI came in at +6.5% year-on-year, the hottest since November 2022, and a December Fed hike went from a maybe to almost fully priced in overnight. AI stocks sold off after Nvidia's CEO exit — and crypto followed.
The institutional bid has vanished too. Spot ETH ETFs have now seen six straight days of outflows — $144.8 million on 11 November alone, $70.6 million more on 12 November, and $696 million out in November so far. That's the real selling. The Ethereum Foundation wallet selling 2,000 ETH made the headlines, but it's pocket change next to those flows.
Now the levels that decide everything.
$2,000 is no longer support — it's resistance. Bulls have to reclaim it with a daily close; $2,115 sits above it. Below, the line in the sand is $1,895, Friday's low. Lose that and $1,827 comes fast, then $1,800. A daily close under $1,800 opens the door to $1,500 — the level analysts keep circling.
Check the $ETH chart — $2,000 is now the line to reclaim.
But here's the twist: not everyone is selling.
Stakers are holding. A record 36.4% of all ETH is now staked, and the validator exit queue has collapsed from its October peak. One whale bought 10,380 ETH — nearly $20 million — straight into the drop, even while sitting on an $11 million loss. And the Fear & Greed Index is at 13. Extreme fear.
ETH's RSI is 24. Deeply oversold. Sounds like a buy signal — except history disagrees. The last ten times ETH's daily RSI dropped under 30, the price was lower a month later in seven of them. Oversold is not a bottom. It's a warning that the flush can keep going.
And the majors? They're not diverging — they're falling with ETH, some faster. $SOL lost $80 and is the weakest major, down 36% this year with an RSI near 19. $XRP slipped under $1.00 after nine straight red days. Only BNB holds up better, around $620 with $600 as its next test. ETH is now worth just 0.028 BTC — near a multi-year low against Bitcoin.
The last time ETH lost $2,000 — April 2025 — it bottomed near $1,386, then ran 175% in three months. That doesn't mean it happens again — the setup exists, but the levels above have to confirm it.
So watch $1,895 today. Hold it, and the bounce trade stays alive. Lose it with a daily close under $1,800, and $1,500 enters the conversation. Bounce or breakdown — which side are you on?
Not financial advice. DYOR.
ETH Just Lost $2,000 — Here's the Level That Decides What's Next
Ethereum just lost the $2,000 level — for the first time since August.
It's trading around $1,900 this morning, down 14% in a week. And the question on every timeline is simple: is this the bottom, or the next leg down?
Here's what actually happened.
Friday was brutal. ETH slid to $1,896, its lowest in a month, and nearly $288 million in ETH positions got liquidated — 90% of them longs. The trigger was a one-two punch: October PPI came in at +6.5% year-on-year, the hottest since November 2022, and a December Fed hike went from a maybe to almost fully priced in overnight. AI stocks sold off after Nvidia's CEO exit — and crypto followed.
The institutional bid has vanished too. Spot ETH ETFs have now seen six straight days of outflows — $144.8 million on 11 November alone, $70.6 million more on 12 November, and $696 million out in November so far. That's the real selling. The Ethereum Foundation wallet selling 2,000 ETH made the headlines, but it's pocket change next to those flows.
Now the levels that decide everything.
$2,000 is no longer support — it's resistance. Bulls have to reclaim it with a daily close; $2,115 sits above it. Below, the line in the sand is $1,895, Friday's low. Lose that and $1,827 comes fast, then $1,800. A daily close under $1,800 opens the door to $1,500 — the level analysts keep circling.
Check the $ETH chart — $2,000 is now the line to reclaim.
But here's the twist: not everyone is selling.
Stakers are holding. A record 36.4% of all ETH is now staked, and the validator exit queue has collapsed from its October peak. One whale bought 10,380 ETH — nearly $20 million — straight into the drop, even while sitting on an $11 million loss. And the Fear & Greed Index is at 13. Extreme fear.
ETH's RSI is 24. Deeply oversold. Sounds like a buy signal — except history disagrees. The last ten times ETH's daily RSI dropped under 30, the price was lower a month later in seven of them. Oversold is not a bottom. It's a warning that the flush can keep going.
And the majors? They're not diverging — they're falling with ETH, some faster. $SOL lost $80 and is the weakest major, down 36% this year with an RSI near 19. $XRP slipped under $1.00 after nine straight red days. Only BNB holds up better, around $620 with $600 as its next test. ETH is now worth just 0.028 BTC — near a multi-year low against Bitcoin.
The last time ETH lost $2,000 — April 2025 — it bottomed near $1,386, then ran 175% in three months. That doesn't mean it happens again — the setup exists, but the levels above have to confirm it.
So watch $1,895 today. Hold it, and the bounce trade stays alive. Lose it with a daily close under $1,800, and $1,500 enters the conversation. Bounce or breakdown — which side are you on?
Not financial advice. DYOR.
It's trading around $1,900 this morning, down 14% in a week. And the question on every timeline is simple: is this the bottom, or the next leg down?
Here's what actually happened.
Friday was brutal. ETH slid to $1,896, its lowest in a month, and nearly $288 million in ETH positions got liquidated — 90% of them longs. The trigger was a one-two punch: October PPI came in at +6.5% year-on-year, the hottest since November 2022, and a December Fed hike went from a maybe to almost fully priced in overnight. AI stocks sold off after Nvidia's CEO exit — and crypto followed.
The institutional bid has vanished too. Spot ETH ETFs have now seen six straight days of outflows — $144.8 million on 11 November alone, $70.6 million more on 12 November, and $696 million out in November so far. That's the real selling. The Ethereum Foundation wallet selling 2,000 ETH made the headlines, but it's pocket change next to those flows.
Now the levels that decide everything.
$2,000 is no longer support — it's resistance. Bulls have to reclaim it with a daily close; $2,115 sits above it. Below, the line in the sand is $1,895, Friday's low. Lose that and $1,827 comes fast, then $1,800. A daily close under $1,800 opens the door to $1,500 — the level analysts keep circling.
Check the $ETH chart — $2,000 is now the line to reclaim.
But here's the twist: not everyone is selling.
Stakers are holding. A record 36.4% of all ETH is now staked, and the validator exit queue has collapsed from its October peak. One whale bought 10,380 ETH — nearly $20 million — straight into the drop, even while sitting on an $11 million loss. And the Fear & Greed Index is at 13. Extreme fear.
ETH's RSI is 24. Deeply oversold. Sounds like a buy signal — except history disagrees. The last ten times ETH's daily RSI dropped under 30, the price was lower a month later in seven of them. Oversold is not a bottom. It's a warning that the flush can keep going.
And the majors? They're not diverging — they're falling with ETH, some faster. $SOL lost $80 and is the weakest major, down 36% this year with an RSI near 19. $XRP slipped under $1.00 after nine straight red days. Only BNB holds up better, around $620 with $600 as its next test. ETH is now worth just 0.028 BTC — near a multi-year low against Bitcoin.
The last time ETH lost $2,000 — April 2025 — it bottomed near $1,386, then ran 175% in three months. That doesn't mean it happens again — the setup exists, but the levels above have to confirm it.
So watch $1,895 today. Hold it, and the bounce trade stays alive. Lose it with a daily close under $1,800, and $1,500 enters the conversation. Bounce or breakdown — which side are you on?
Not financial advice. DYOR.
41
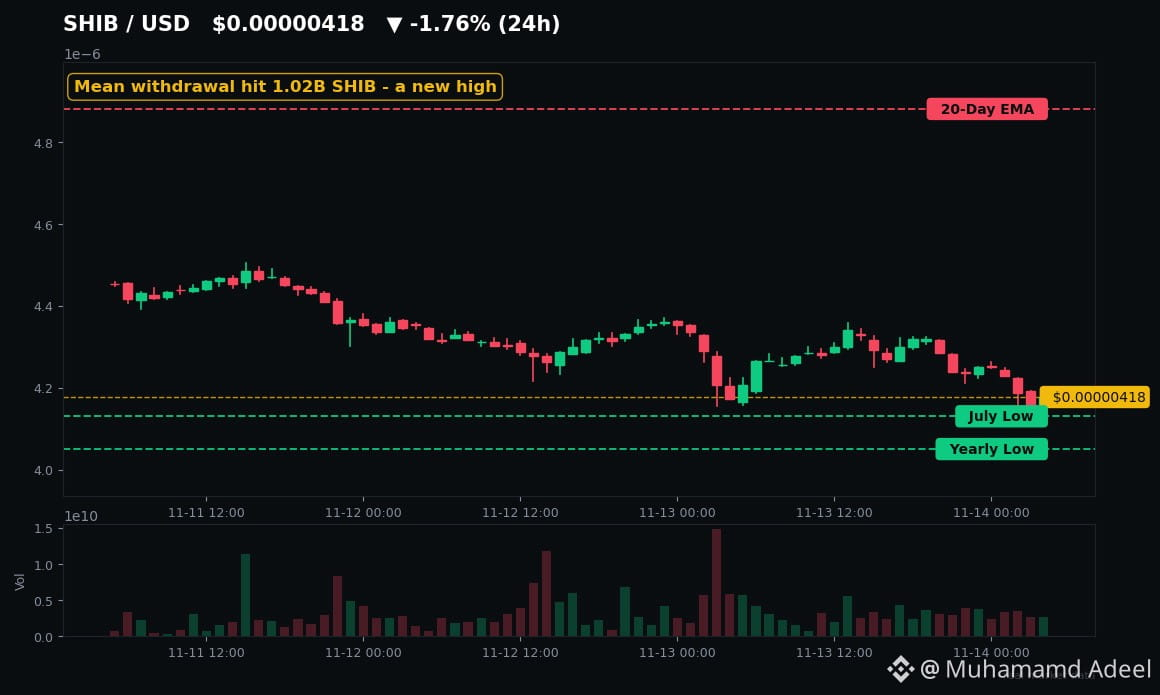
Стаття
Переглянути переклад
SHIB at $0.0000042 — Record Withdrawals While Price Hugs Its July LowLook at $SHIB right now and tell me this isn't weird.
The price is sitting at $0.0000042 — on its July low, down 95% from its all-time high, down 15% in a month. The whole market is in Extreme Fear. And yet this morning, CryptoQuant data showed the average SHIB withdrawal from exchanges just hit 1.02 billion tokens per transaction — a new high, up 30%.
That's the paradox: the chart looks dead, but the on-chain plumbing is moving like something is stirring.
**The numbers behind the noise**
On 8 November, a net 20 billion SHIB left exchanges in 24 hours. On 10 November, it was 114.6 billion. Holders are pulling coins off exchanges in bigger chunks than ever — the classic behaviour of people who don't plan to sell tomorrow.
But scale matters. Those 20 billion SHIB were worth about $89,000, against roughly 86 trillion SHIB still sitting on exchanges. The flows flip-flop daily too, and the report behind today's number is blunt: the surge looks retail-driven, with the biggest holders on the sidelines.
**The one thing SHIB is actually doing right**
Here's what caught my eye. While $BTC bled 3.5% on Friday and lost $70K, SHIB fell just 0.5%. Over the last week SHIB is down 5.3% against Bitcoin's 9.1%. The SHIB/BTC ratio just hit a four-week high — 6,238 satoshis per million SHIB, its best since mid-October.
Don't over-read it. Over 12 months SHIB is still down 38% against Bitcoin, and this kind of relative strength lasted about a week in March 2024 before fading. But for a coin everyone has written off, it's the first sign of a pulse in weeks — and even $DOGE hasn't shown this kind of resilience in the sell-off.
**The levels that decide everything**
$SHIB is now testing the zone that matters most: support around $0.0000041, the July low, with the yearly low at $0.00000405 just underneath. Lose that and the next floor is $0.00000388. Hold it, and the first real test is $0.0000044–$0.0000045, then the 20-day average at $0.00000488. A break above that level changes the conversation; a break below the yearly low confirms the downtrend is still in charge. Check the $SHIB chart and watch that $0.0000041 line — it's the whole story this weekend.
**The honest risk**
Let's be straight. Shibarium is a ghost town — daily transactions around 1,000, TVL down 99% from its peak. Burns are worth about $1,600 a month. And the macro tape is brutal: hot inflation, a December rate hike now priced at roughly 90%, Bitcoin under $70K. If BTC keeps sliding, no amount of exchange outflows saves SHIB.
But here's my take: at $0.0000042, with Binance reporting 100.04% SHIB reserves, a four-week high against BTC, and the biggest withdrawals per transaction ever recorded, SHIB is where the quiet money is moving while everyone else looks away. That doesn't mean a rally is coming. It means this is the coin to watch when the market finally turns.
Not financial advice. DYOR.
SHIB at $0.0000042 — Record Withdrawals While Price Hugs Its July Low
Look at $SHIB right now and tell me this isn't weird.
The price is sitting at $0.0000042 — on its July low, down 95% from its all-time high, down 15% in a month. The whole market is in Extreme Fear. And yet this morning, CryptoQuant data showed the average SHIB withdrawal from exchanges just hit 1.02 billion tokens per transaction — a new high, up 30%.
That's the paradox: the chart looks dead, but the on-chain plumbing is moving like something is stirring.
**The numbers behind the noise**
On 8 November, a net 20 billion SHIB left exchanges in 24 hours. On 10 November, it was 114.6 billion. Holders are pulling coins off exchanges in bigger chunks than ever — the classic behaviour of people who don't plan to sell tomorrow.
But scale matters. Those 20 billion SHIB were worth about $89,000, against roughly 86 trillion SHIB still sitting on exchanges. The flows flip-flop daily too, and the report behind today's number is blunt: the surge looks retail-driven, with the biggest holders on the sidelines.
**The one thing SHIB is actually doing right**
Here's what caught my eye. While $BTC bled 3.5% on Friday and lost $70K, SHIB fell just 0.5%. Over the last week SHIB is down 5.3% against Bitcoin's 9.1%. The SHIB/BTC ratio just hit a four-week high — 6,238 satoshis per million SHIB, its best since mid-October.
Don't over-read it. Over 12 months SHIB is still down 38% against Bitcoin, and this kind of relative strength lasted about a week in March 2024 before fading. But for a coin everyone has written off, it's the first sign of a pulse in weeks — and even $DOGE hasn't shown this kind of resilience in the sell-off.
**The levels that decide everything**
$SHIB is now testing the zone that matters most: support around $0.0000041, the July low, with the yearly low at $0.00000405 just underneath. Lose that and the next floor is $0.00000388. Hold it, and the first real test is $0.0000044–$0.0000045, then the 20-day average at $0.00000488. A break above that level changes the conversation; a break below the yearly low confirms the downtrend is still in charge. Check the $SHIB chart and watch that $0.0000041 line — it's the whole story this weekend.
**The honest risk**
Let's be straight. Shibarium is a ghost town — daily transactions around 1,000, TVL down 99% from its peak. Burns are worth about $1,600 a month. And the macro tape is brutal: hot inflation, a December rate hike now priced at roughly 90%, Bitcoin under $70K. If BTC keeps sliding, no amount of exchange outflows saves SHIB.
But here's my take: at $0.0000042, with Binance reporting 100.04% SHIB reserves, a four-week high against BTC, and the biggest withdrawals per transaction ever recorded, SHIB is where the quiet money is moving while everyone else looks away. That doesn't mean a rally is coming. It means this is the coin to watch when the market finally turns.
Not financial advice. DYOR.
The price is sitting at $0.0000042 — on its July low, down 95% from its all-time high, down 15% in a month. The whole market is in Extreme Fear. And yet this morning, CryptoQuant data showed the average SHIB withdrawal from exchanges just hit 1.02 billion tokens per transaction — a new high, up 30%.
That's the paradox: the chart looks dead, but the on-chain plumbing is moving like something is stirring.
**The numbers behind the noise**
On 8 November, a net 20 billion SHIB left exchanges in 24 hours. On 10 November, it was 114.6 billion. Holders are pulling coins off exchanges in bigger chunks than ever — the classic behaviour of people who don't plan to sell tomorrow.
But scale matters. Those 20 billion SHIB were worth about $89,000, against roughly 86 trillion SHIB still sitting on exchanges. The flows flip-flop daily too, and the report behind today's number is blunt: the surge looks retail-driven, with the biggest holders on the sidelines.
**The one thing SHIB is actually doing right**
Here's what caught my eye. While $BTC bled 3.5% on Friday and lost $70K, SHIB fell just 0.5%. Over the last week SHIB is down 5.3% against Bitcoin's 9.1%. The SHIB/BTC ratio just hit a four-week high — 6,238 satoshis per million SHIB, its best since mid-October.
Don't over-read it. Over 12 months SHIB is still down 38% against Bitcoin, and this kind of relative strength lasted about a week in March 2024 before fading. But for a coin everyone has written off, it's the first sign of a pulse in weeks — and even $DOGE hasn't shown this kind of resilience in the sell-off.
**The levels that decide everything**
$SHIB is now testing the zone that matters most: support around $0.0000041, the July low, with the yearly low at $0.00000405 just underneath. Lose that and the next floor is $0.00000388. Hold it, and the first real test is $0.0000044–$0.0000045, then the 20-day average at $0.00000488. A break above that level changes the conversation; a break below the yearly low confirms the downtrend is still in charge. Check the $SHIB chart and watch that $0.0000041 line — it's the whole story this weekend.
**The honest risk**
Let's be straight. Shibarium is a ghost town — daily transactions around 1,000, TVL down 99% from its peak. Burns are worth about $1,600 a month. And the macro tape is brutal: hot inflation, a December rate hike now priced at roughly 90%, Bitcoin under $70K. If BTC keeps sliding, no amount of exchange outflows saves SHIB.
But here's my take: at $0.0000042, with Binance reporting 100.04% SHIB reserves, a four-week high against BTC, and the biggest withdrawals per transaction ever recorded, SHIB is where the quiet money is moving while everyone else looks away. That doesn't mean a rally is coming. It means this is the coin to watch when the market finally turns.
Not financial advice. DYOR.
52
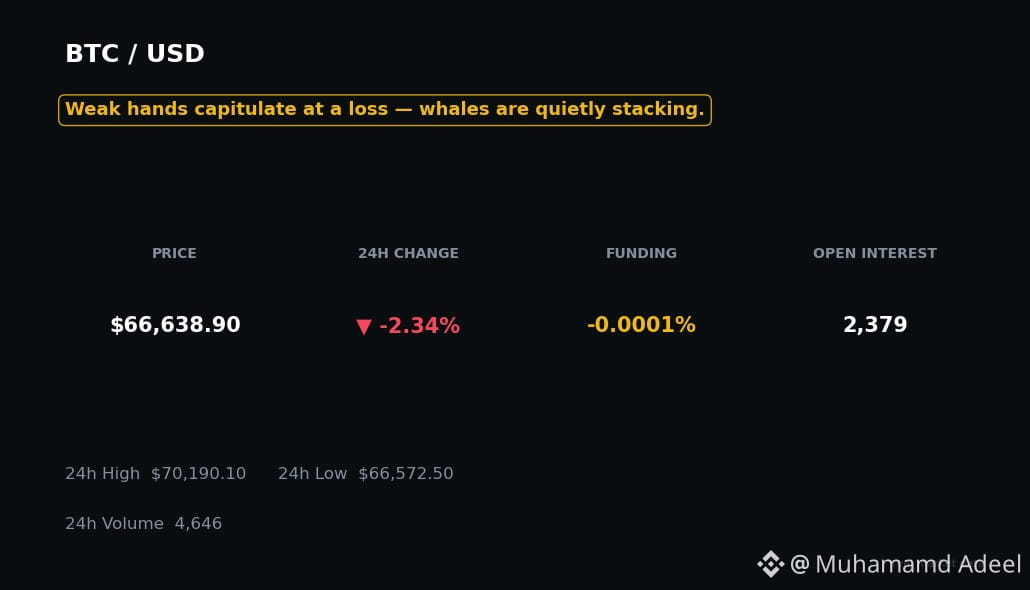
Стаття
Переглянути переклад
BTC at $68K: Weak Hands Capitulate, Whales Accumulate — Who's Right?Bitcoin just lost $70K — and the market is splitting in two.
Weak hands are dumping at a loss. Whales are quietly stacking. One side is about to be very wrong.
$BTC is trading around $66,700 this morning, down 46% from its $126,080 all-time high last October. Yesterday it broke $70K for the first time since August, then slid to $67,568. The Fear & Greed Index just printed 13 — Extreme Fear, the lowest reading since July.
So is this the bottom, or the trap?
**The sellers: capitulation, in hard numbers**
Short-term holders — people who bought in the last five months — just sent roughly 47,300 BTC to exchanges at a loss in a single day, the third-biggest underwater inflow since July (CryptoQuant data via Decrypt). Their average cost basis sits near $75,700. That means about 65% of recent buyers are underwater, selling coins for less than they paid.
Add $1.41 billion in liquidations in 24 hours — 89% of them longs — and about $1.44 billion in spot ETF outflows over five sessions (per SoSoValue). This wasn't a quiet drift down. It was a flush.
**The buyers: the quiet side of the trade**
While that panic was hitting the tape, Glassnode's data showed wallets holding 100 to 10,000 BTC flipping to accumulation in the week through November 9 — after spending most of October distributing. The biggest wallets above 10,000 BTC are still selling, so this isn't a unanimous whale vote. But the mid-size money is buying what the tourists are throwing away.
Doctor Profit called $68K the bottom, pointing at the 200-week moving average — the line that has marked every bear-market bottom in Bitcoin's history. Michaël van de Poppe bought the dip and sees a possible rebound toward $72K–$74K.
The other side isn't quiet either. Peter Schiff says Bitcoin is in a long-term bear market. Blockware's base case is a $60K–$70K range into year-end. And history warns against rushing: in 2022, extreme fear persisted for 62 straight days, and the real low came five months after the first capitulation.
**The line that decides it**
Watch the 200-week moving average near $68K. $BTC is sitting right on it — actually just below it this morning. Reclaim $70K and the bulls have a case. Lose $67K and the next shelf is the mid-$60Ks, with $60K the level analysts keep circling.
$ETH fell below $2,000 in the same flush, so this isn't a Bitcoin-only story — the whole market is testing who actually believes in it.
Here's the honest take: capitulation is a process, not a single candle. The fear is real, the selling is real, and the accumulation is real — but the confirmation signal history actually trusts is short-term holders' SOPR climbing back above 1.0. That hasn't happened yet.
Until it does, pull up $BTC's chart — and $ETH and $BNB too — before you decide which side you're on.
Not financial advice. DYOR.
BTC at $68K: Weak Hands Capitulate, Whales Accumulate — Who's Right?
Bitcoin just lost $70K — and the market is splitting in two.
Weak hands are dumping at a loss. Whales are quietly stacking. One side is about to be very wrong.
$BTC is trading around $66,700 this morning, down 46% from its $126,080 all-time high last October. Yesterday it broke $70K for the first time since August, then slid to $67,568. The Fear & Greed Index just printed 13 — Extreme Fear, the lowest reading since July.
So is this the bottom, or the trap?
**The sellers: capitulation, in hard numbers**
Short-term holders — people who bought in the last five months — just sent roughly 47,300 BTC to exchanges at a loss in a single day, the third-biggest underwater inflow since July (CryptoQuant data via Decrypt). Their average cost basis sits near $75,700. That means about 65% of recent buyers are underwater, selling coins for less than they paid.
Add $1.41 billion in liquidations in 24 hours — 89% of them longs — and about $1.44 billion in spot ETF outflows over five sessions (per SoSoValue). This wasn't a quiet drift down. It was a flush.
**The buyers: the quiet side of the trade**
While that panic was hitting the tape, Glassnode's data showed wallets holding 100 to 10,000 BTC flipping to accumulation in the week through November 9 — after spending most of October distributing. The biggest wallets above 10,000 BTC are still selling, so this isn't a unanimous whale vote. But the mid-size money is buying what the tourists are throwing away.
Doctor Profit called $68K the bottom, pointing at the 200-week moving average — the line that has marked every bear-market bottom in Bitcoin's history. Michaël van de Poppe bought the dip and sees a possible rebound toward $72K–$74K.
The other side isn't quiet either. Peter Schiff says Bitcoin is in a long-term bear market. Blockware's base case is a $60K–$70K range into year-end. And history warns against rushing: in 2022, extreme fear persisted for 62 straight days, and the real low came five months after the first capitulation.
**The line that decides it**
Watch the 200-week moving average near $68K. $BTC is sitting right on it — actually just below it this morning. Reclaim $70K and the bulls have a case. Lose $67K and the next shelf is the mid-$60Ks, with $60K the level analysts keep circling.
$ETH fell below $2,000 in the same flush, so this isn't a Bitcoin-only story — the whole market is testing who actually believes in it.
Here's the honest take: capitulation is a process, not a single candle. The fear is real, the selling is real, and the accumulation is real — but the confirmation signal history actually trusts is short-term holders' SOPR climbing back above 1.0. That hasn't happened yet.
Until it does, pull up $BTC 's chart — and $ETH and $BNB too — before you decide which side you're on.
Not financial advice. DYOR.
Weak hands are dumping at a loss. Whales are quietly stacking. One side is about to be very wrong.
$BTC is trading around $66,700 this morning, down 46% from its $126,080 all-time high last October. Yesterday it broke $70K for the first time since August, then slid to $67,568. The Fear & Greed Index just printed 13 — Extreme Fear, the lowest reading since July.
So is this the bottom, or the trap?
**The sellers: capitulation, in hard numbers**
Short-term holders — people who bought in the last five months — just sent roughly 47,300 BTC to exchanges at a loss in a single day, the third-biggest underwater inflow since July (CryptoQuant data via Decrypt). Their average cost basis sits near $75,700. That means about 65% of recent buyers are underwater, selling coins for less than they paid.
Add $1.41 billion in liquidations in 24 hours — 89% of them longs — and about $1.44 billion in spot ETF outflows over five sessions (per SoSoValue). This wasn't a quiet drift down. It was a flush.
**The buyers: the quiet side of the trade**
While that panic was hitting the tape, Glassnode's data showed wallets holding 100 to 10,000 BTC flipping to accumulation in the week through November 9 — after spending most of October distributing. The biggest wallets above 10,000 BTC are still selling, so this isn't a unanimous whale vote. But the mid-size money is buying what the tourists are throwing away.
Doctor Profit called $68K the bottom, pointing at the 200-week moving average — the line that has marked every bear-market bottom in Bitcoin's history. Michaël van de Poppe bought the dip and sees a possible rebound toward $72K–$74K.
The other side isn't quiet either. Peter Schiff says Bitcoin is in a long-term bear market. Blockware's base case is a $60K–$70K range into year-end. And history warns against rushing: in 2022, extreme fear persisted for 62 straight days, and the real low came five months after the first capitulation.
**The line that decides it**
Watch the 200-week moving average near $68K. $BTC is sitting right on it — actually just below it this morning. Reclaim $70K and the bulls have a case. Lose $67K and the next shelf is the mid-$60Ks, with $60K the level analysts keep circling.
$ETH fell below $2,000 in the same flush, so this isn't a Bitcoin-only story — the whole market is testing who actually believes in it.
Here's the honest take: capitulation is a process, not a single candle. The fear is real, the selling is real, and the accumulation is real — but the confirmation signal history actually trusts is short-term holders' SOPR climbing back above 1.0. That hasn't happened yet.
Until it does, pull up $BTC 's chart — and $ETH and $BNB too — before you decide which side you're on.
Not financial advice. DYOR.
65
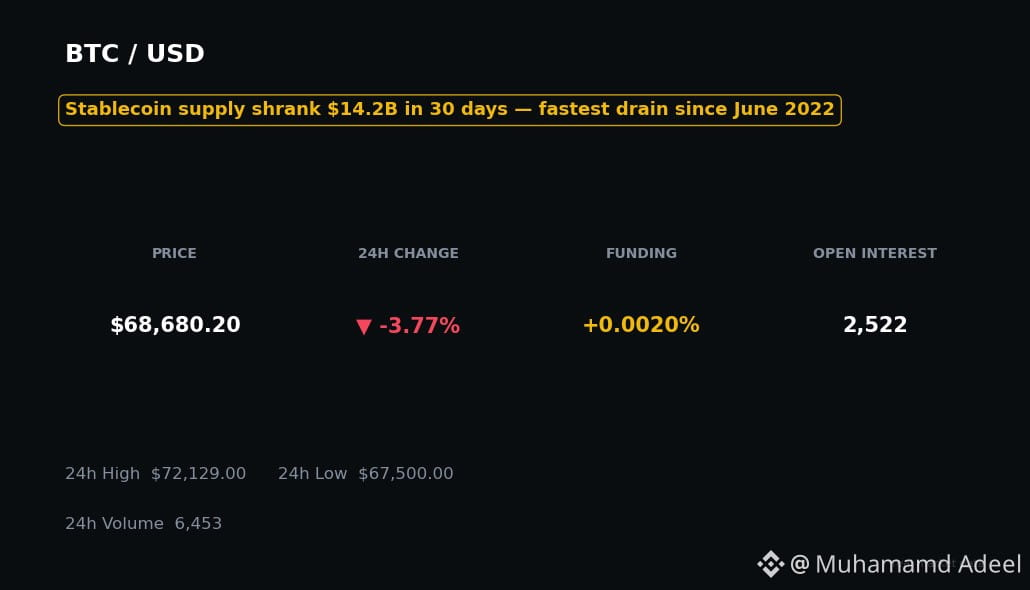
Стаття
Переглянути переклад
The Dip-Buying Cash Is Leaving Crypto — Fastest Drain Since 2022The Dip-Buying Cash Is Leaving Crypto — Fastest Drain Since 2022
Everyone's watching the price. You should be watching the fuel tank.
$BTC just lost $70K, tagging around $67,500 intraday — its lowest since late August. $ETH is back under $2,000. Fear & Greed crashed to 20, Extreme Fear, for the first time in four months.
But here's the number that actually matters: stablecoin supply just shrank $14.2 billion in 30 days. That's the fastest drain since June 2022.
THE PANIC IS REAL — AND IT'S LOSING MONEY
Short-term holders sent roughly 47,300 BTC to exchanges at a loss in one 24-hour window — against only about 1,100 BTC at a profit. That's a 27-to-1 loss ratio, one of the worst since July.
Bitcoin is now sitting below the short-term holder cost basis of around $75,600. Roughly two-thirds of short-term holder coins are underwater. This is textbook capitulation behaviour — people selling because it hurts, not because they planned to.
WHALES ARE SPLIT — AND THAT'S THE TELL
Don't believe the simple "whales are dumping" story. The chain is messier than that.
Two dormant wallets moved 1,929.5 BTC — about $143.6 million — onto Binance and Kraken this week. But a deposit is not a sale, and no sale has been seen.
Meanwhile, mid-sized wallets holding 100 to 10,000 BTC have started accumulating again, per Glassnode — while the very biggest wallets are still distributing. And one whale quietly pulled 1,042.5 BTC, around $72.9 million, OFF Binance. Some big money is buying this fear. Some is still heading for the exit.
THE LEVERAGE FLUSH ALREADY HAPPENED
Over $1.4 billion got liquidated in 24 hours, about 89% of it longs. Funding flipped negative on OKX for the first time since 7 November. The crowded long trade got punished.
But a leverage flush only helps if fresh money steps in after it — and it isn't there. Spot BTC ETFs have now bled about $1.44 billion over five straight sessions. Even Binance's stablecoin reserves fell from roughly $42 billion to $32 billion in about two weeks — though some of that is post-hack wallet reshuffling, not pure exits.
WHAT THIS REALLY MEANS
Extreme fear has marked great bottoms before — December 2018, November 2022. But the honest history check: the median Bitcoin return 90 days after an Extreme Fear day is actually negative. Fear tells you sellers are exhausted. It doesn't tell you when they stop.
The number to watch now isn't the price — it's the stablecoin supply. Glassnode's own test: when that 30-day change turns positive again, that's the first sign new money is coming back.
Until then, the levels are simple. Hold $67,500 and the bounce has a base. Lose it and the next real structure is much lower. Reclaim $70K, then $73,100 — the 200-day average — and the story changes fast. Check $BTC's chart before you pick a side, because this market is running on fumes, not fuel.
Not financial advice. DYOR.
The Dip-Buying Cash Is Leaving Crypto — Fastest Drain Since 2022
The Dip-Buying Cash Is Leaving Crypto — Fastest Drain Since 2022
Everyone's watching the price. You should be watching the fuel tank.
$BTC just lost $70K, tagging around $67,500 intraday — its lowest since late August. $ETH is back under $2,000. Fear & Greed crashed to 20, Extreme Fear, for the first time in four months.
But here's the number that actually matters: stablecoin supply just shrank $14.2 billion in 30 days. That's the fastest drain since June 2022.
THE PANIC IS REAL — AND IT'S LOSING MONEY
Short-term holders sent roughly 47,300 BTC to exchanges at a loss in one 24-hour window — against only about 1,100 BTC at a profit. That's a 27-to-1 loss ratio, one of the worst since July.
Bitcoin is now sitting below the short-term holder cost basis of around $75,600. Roughly two-thirds of short-term holder coins are underwater. This is textbook capitulation behaviour — people selling because it hurts, not because they planned to.
WHALES ARE SPLIT — AND THAT'S THE TELL
Don't believe the simple "whales are dumping" story. The chain is messier than that.
Two dormant wallets moved 1,929.5 BTC — about $143.6 million — onto Binance and Kraken this week. But a deposit is not a sale, and no sale has been seen.
Meanwhile, mid-sized wallets holding 100 to 10,000 BTC have started accumulating again, per Glassnode — while the very biggest wallets are still distributing. And one whale quietly pulled 1,042.5 BTC, around $72.9 million, OFF Binance. Some big money is buying this fear. Some is still heading for the exit.
THE LEVERAGE FLUSH ALREADY HAPPENED
Over $1.4 billion got liquidated in 24 hours, about 89% of it longs. Funding flipped negative on OKX for the first time since 7 November. The crowded long trade got punished.
But a leverage flush only helps if fresh money steps in after it — and it isn't there. Spot BTC ETFs have now bled about $1.44 billion over five straight sessions. Even Binance's stablecoin reserves fell from roughly $42 billion to $32 billion in about two weeks — though some of that is post-hack wallet reshuffling, not pure exits.
WHAT THIS REALLY MEANS
Extreme fear has marked great bottoms before — December 2018, November 2022. But the honest history check: the median Bitcoin return 90 days after an Extreme Fear day is actually negative. Fear tells you sellers are exhausted. It doesn't tell you when they stop.
The number to watch now isn't the price — it's the stablecoin supply. Glassnode's own test: when that 30-day change turns positive again, that's the first sign new money is coming back.
Until then, the levels are simple. Hold $67,500 and the bounce has a base. Lose it and the next real structure is much lower. Reclaim $70K, then $73,100 — the 200-day average — and the story changes fast. Check $BTC 's chart before you pick a side, because this market is running on fumes, not fuel.
Not financial advice. DYOR.
Everyone's watching the price. You should be watching the fuel tank.
$BTC just lost $70K, tagging around $67,500 intraday — its lowest since late August. $ETH is back under $2,000. Fear & Greed crashed to 20, Extreme Fear, for the first time in four months.
But here's the number that actually matters: stablecoin supply just shrank $14.2 billion in 30 days. That's the fastest drain since June 2022.
THE PANIC IS REAL — AND IT'S LOSING MONEY
Short-term holders sent roughly 47,300 BTC to exchanges at a loss in one 24-hour window — against only about 1,100 BTC at a profit. That's a 27-to-1 loss ratio, one of the worst since July.
Bitcoin is now sitting below the short-term holder cost basis of around $75,600. Roughly two-thirds of short-term holder coins are underwater. This is textbook capitulation behaviour — people selling because it hurts, not because they planned to.
WHALES ARE SPLIT — AND THAT'S THE TELL
Don't believe the simple "whales are dumping" story. The chain is messier than that.
Two dormant wallets moved 1,929.5 BTC — about $143.6 million — onto Binance and Kraken this week. But a deposit is not a sale, and no sale has been seen.
Meanwhile, mid-sized wallets holding 100 to 10,000 BTC have started accumulating again, per Glassnode — while the very biggest wallets are still distributing. And one whale quietly pulled 1,042.5 BTC, around $72.9 million, OFF Binance. Some big money is buying this fear. Some is still heading for the exit.
THE LEVERAGE FLUSH ALREADY HAPPENED
Over $1.4 billion got liquidated in 24 hours, about 89% of it longs. Funding flipped negative on OKX for the first time since 7 November. The crowded long trade got punished.
But a leverage flush only helps if fresh money steps in after it — and it isn't there. Spot BTC ETFs have now bled about $1.44 billion over five straight sessions. Even Binance's stablecoin reserves fell from roughly $42 billion to $32 billion in about two weeks — though some of that is post-hack wallet reshuffling, not pure exits.
WHAT THIS REALLY MEANS
Extreme fear has marked great bottoms before — December 2018, November 2022. But the honest history check: the median Bitcoin return 90 days after an Extreme Fear day is actually negative. Fear tells you sellers are exhausted. It doesn't tell you when they stop.
The number to watch now isn't the price — it's the stablecoin supply. Glassnode's own test: when that 30-day change turns positive again, that's the first sign new money is coming back.
Until then, the levels are simple. Hold $67,500 and the bounce has a base. Lose it and the next real structure is much lower. Reclaim $70K, then $73,100 — the 200-day average — and the story changes fast. Check $BTC 's chart before you pick a side, because this market is running on fumes, not fuel.
Not financial advice. DYOR.
2
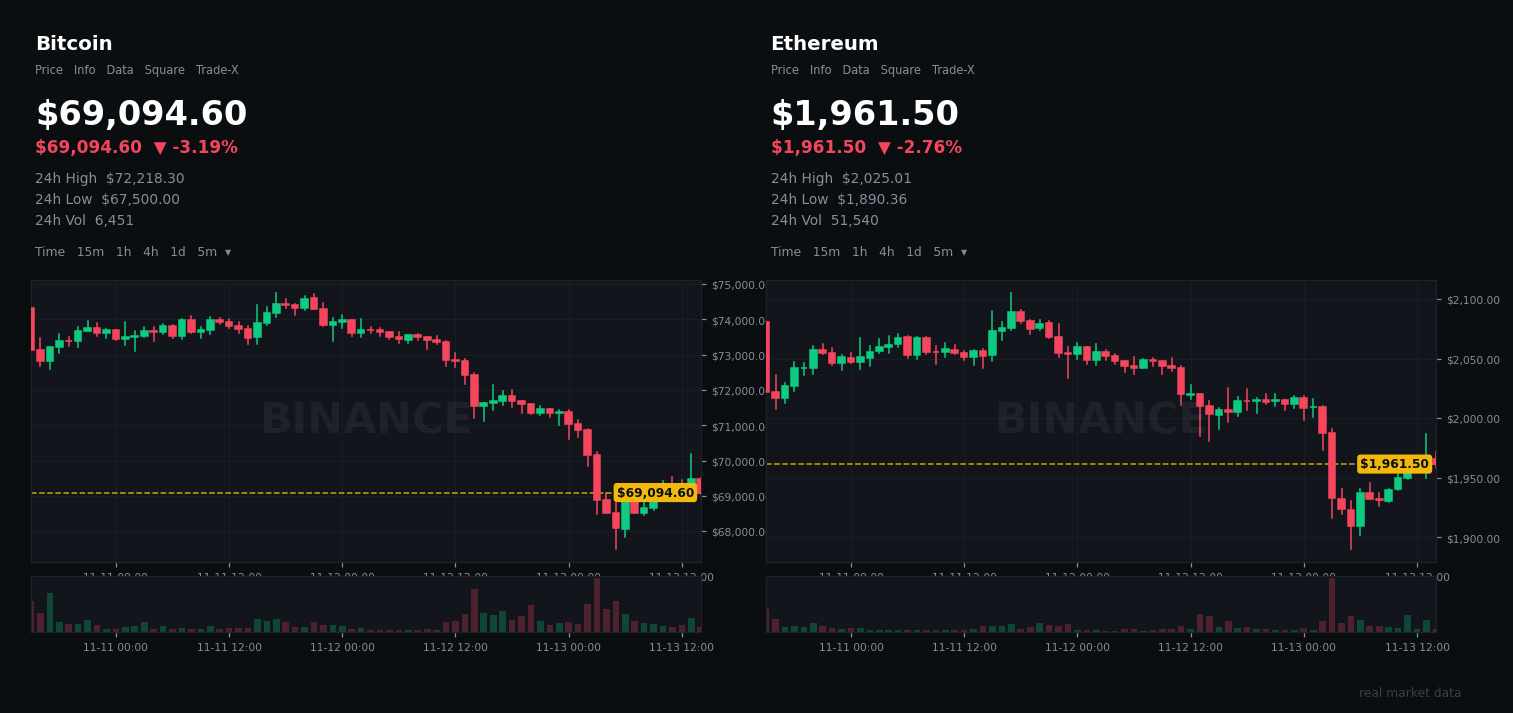
Стаття
Переглянути переклад
PPI Came In Cool — So Why Is Bitcoin Still Under $70K?PPI came in cooler than expected today. So why is $BTC still sitting under $70K?
That's the question everyone on the timeline is asking — and the answer tells you everything about where this market actually is.
Here's what just happened. October PPI printed +0.3% month-on-month, below the +0.4% consensus. Core PPI matched forecasts at +0.3%. On paper, that's a soft print.
But the annual rate hit +6.5% — the highest since November 2022. And the part of PPI the Fed watches closest, ex-food, energy and trade services, rose +0.5%, above estimates. The monthly pace cooled. The underlying pressure didn't.
Bitcoin had already broken before the data even landed. $BTC fell to around $67,600 in the early hours — its lowest since August — then spiked back toward $70,000 within minutes of the release before settling near $69,000. Over $1.3 billion in leveraged positions got wiped out in 24 hours, almost 90% of them longs. Fear & Greed sits at 20 — extreme fear.
So here's what this really means.
The December hike is no longer a debate — it's priced in. Markets put roughly 90% odds on a 25bp hike at the Dec 8–9 FOMC, around 10% on 50bp. Waller already said 50bp should be on the table if core CPI hit 0.3%. It printed exactly 0.3%.
But here's the twist: a 25bp hike everyone expects is not what kills markets. September proved it — the Fed hiked, fully priced in, and Bitcoin rallied 13.7% in five days. Markets don't fear the expected hike. They fear the surprise.
The surprise to watch isn't December — it's the 2027 path. Bank of America now expects 25bp hikes at each of the next three meetings, and Goldman added a March hike. If the December dot plot signals more tightening ahead, that's the real test.
Meanwhile the plumbing is drained. Stablecoin supply has shrunk $14.2 billion in 30 days — the fastest drain since June 2022. Spot BTC ETFs bled about $1.44 billion across five straight outflow sessions through Wednesday. Short-term holders sent roughly 47,000 BTC to exchanges at a loss in a single day. Add a Nvidia CEO shock on the same tape, and this market walked into PPI day with no liquidity cushion. That's why a soft print couldn't save it.
What to watch next:
• $BTC $67,600 is the line — Friday's low, right around the 200-week average. Lose it and the next level traders are watching is $65,000–$66,000.
• Reclaim $70,000 and $72,000–$74,000 is first resistance.
• $ETH under $2,000 tells the same story: it bounced off ~$1,896, but $2,000 is now resistance, not support.
• Watch $SOL — the highest-beta major. If it outperforms, risk appetite is back. If it keeps bleeding harder than BTC, the flush isn't over.
The PPI didn't rescue Bitcoin because the market's problem was never just today's number — it was the leverage, the outflows, and a Fed with every excuse to keep hiking.
Check $BTC's chart — the next 24 hours decide whether $67,000 holds or this becomes something bigger.
Not financial advice. DYOR.
PPI Came In Cool — So Why Is Bitcoin Still Under $70K?
PPI came in cooler than expected today. So why is $BTC still sitting under $70K?
That's the question everyone on the timeline is asking — and the answer tells you everything about where this market actually is.
Here's what just happened. October PPI printed +0.3% month-on-month, below the +0.4% consensus. Core PPI matched forecasts at +0.3%. On paper, that's a soft print.
But the annual rate hit +6.5% — the highest since November 2022. And the part of PPI the Fed watches closest, ex-food, energy and trade services, rose +0.5%, above estimates. The monthly pace cooled. The underlying pressure didn't.
Bitcoin had already broken before the data even landed. $BTC fell to around $67,600 in the early hours — its lowest since August — then spiked back toward $70,000 within minutes of the release before settling near $69,000. Over $1.3 billion in leveraged positions got wiped out in 24 hours, almost 90% of them longs. Fear & Greed sits at 20 — extreme fear.
So here's what this really means.
The December hike is no longer a debate — it's priced in. Markets put roughly 90% odds on a 25bp hike at the Dec 8–9 FOMC, around 10% on 50bp. Waller already said 50bp should be on the table if core CPI hit 0.3%. It printed exactly 0.3%.
But here's the twist: a 25bp hike everyone expects is not what kills markets. September proved it — the Fed hiked, fully priced in, and Bitcoin rallied 13.7% in five days. Markets don't fear the expected hike. They fear the surprise.
The surprise to watch isn't December — it's the 2027 path. Bank of America now expects 25bp hikes at each of the next three meetings, and Goldman added a March hike. If the December dot plot signals more tightening ahead, that's the real test.
Meanwhile the plumbing is drained. Stablecoin supply has shrunk $14.2 billion in 30 days — the fastest drain since June 2022. Spot BTC ETFs bled about $1.44 billion across five straight outflow sessions through Wednesday. Short-term holders sent roughly 47,000 BTC to exchanges at a loss in a single day. Add a Nvidia CEO shock on the same tape, and this market walked into PPI day with no liquidity cushion. That's why a soft print couldn't save it.
What to watch next:
• $BTC $67,600 is the line — Friday's low, right around the 200-week average. Lose it and the next level traders are watching is $65,000–$66,000.
• Reclaim $70,000 and $72,000–$74,000 is first resistance.
• $ETH under $2,000 tells the same story: it bounced off ~$1,896, but $2,000 is now resistance, not support.
• Watch $SOL — the highest-beta major. If it outperforms, risk appetite is back. If it keeps bleeding harder than BTC, the flush isn't over.
The PPI didn't rescue Bitcoin because the market's problem was never just today's number — it was the leverage, the outflows, and a Fed with every excuse to keep hiking.
Check $BTC 's chart — the next 24 hours decide whether $67,000 holds or this becomes something bigger.
Not financial advice. DYOR.
That's the question everyone on the timeline is asking — and the answer tells you everything about where this market actually is.
Here's what just happened. October PPI printed +0.3% month-on-month, below the +0.4% consensus. Core PPI matched forecasts at +0.3%. On paper, that's a soft print.
But the annual rate hit +6.5% — the highest since November 2022. And the part of PPI the Fed watches closest, ex-food, energy and trade services, rose +0.5%, above estimates. The monthly pace cooled. The underlying pressure didn't.
Bitcoin had already broken before the data even landed. $BTC fell to around $67,600 in the early hours — its lowest since August — then spiked back toward $70,000 within minutes of the release before settling near $69,000. Over $1.3 billion in leveraged positions got wiped out in 24 hours, almost 90% of them longs. Fear & Greed sits at 20 — extreme fear.
So here's what this really means.
The December hike is no longer a debate — it's priced in. Markets put roughly 90% odds on a 25bp hike at the Dec 8–9 FOMC, around 10% on 50bp. Waller already said 50bp should be on the table if core CPI hit 0.3%. It printed exactly 0.3%.
But here's the twist: a 25bp hike everyone expects is not what kills markets. September proved it — the Fed hiked, fully priced in, and Bitcoin rallied 13.7% in five days. Markets don't fear the expected hike. They fear the surprise.
The surprise to watch isn't December — it's the 2027 path. Bank of America now expects 25bp hikes at each of the next three meetings, and Goldman added a March hike. If the December dot plot signals more tightening ahead, that's the real test.
Meanwhile the plumbing is drained. Stablecoin supply has shrunk $14.2 billion in 30 days — the fastest drain since June 2022. Spot BTC ETFs bled about $1.44 billion across five straight outflow sessions through Wednesday. Short-term holders sent roughly 47,000 BTC to exchanges at a loss in a single day. Add a Nvidia CEO shock on the same tape, and this market walked into PPI day with no liquidity cushion. That's why a soft print couldn't save it.
What to watch next:
• $BTC $67,600 is the line — Friday's low, right around the 200-week average. Lose it and the next level traders are watching is $65,000–$66,000.
• Reclaim $70,000 and $72,000–$74,000 is first resistance.
• $ETH under $2,000 tells the same story: it bounced off ~$1,896, but $2,000 is now resistance, not support.
• Watch $SOL — the highest-beta major. If it outperforms, risk appetite is back. If it keeps bleeding harder than BTC, the flush isn't over.
The PPI didn't rescue Bitcoin because the market's problem was never just today's number — it was the leverage, the outflows, and a Fed with every excuse to keep hiking.
Check $BTC 's chart — the next 24 hours decide whether $67,000 holds or this becomes something bigger.
Not financial advice. DYOR.
4
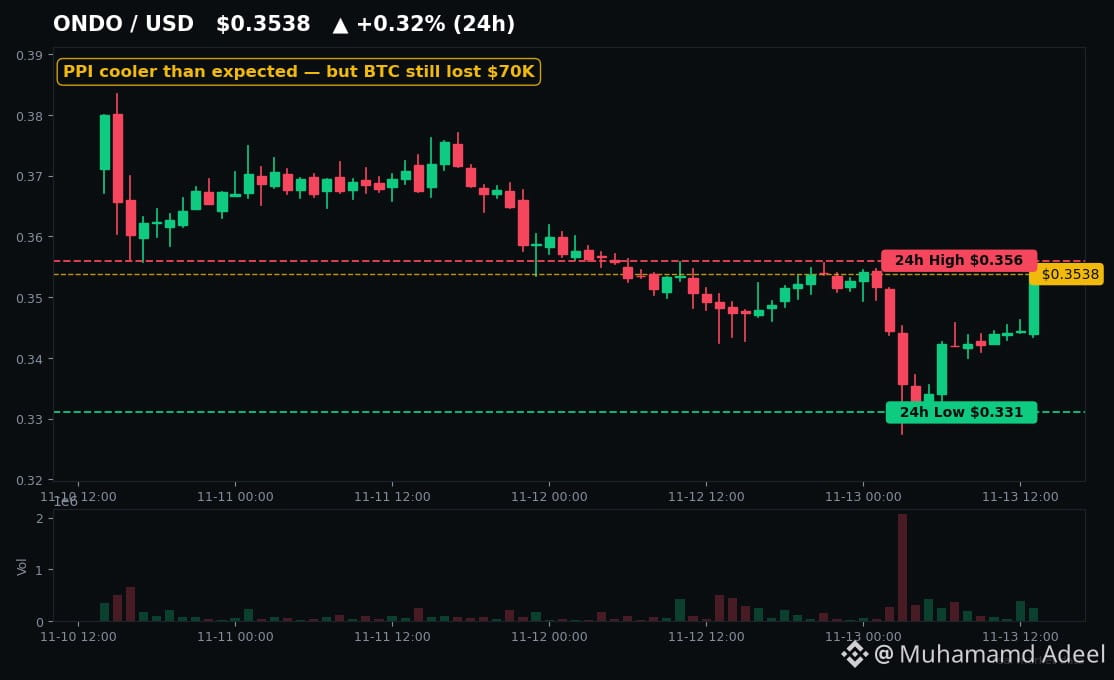
Стаття
Переглянути переклад
BTC Lost $70K — But Tokenized Treasuries Just Went 24/7Bitcoin just lost $70,000. Gold fell too.
And right in the middle of the panic, the quietest corner of crypto did something loud: tokenized Treasuries went 24/7.
Here's what happened today — and why it matters more than the red candles.
The PPI print landed cooler than expected: +0.3% month-on-month versus +0.4% forecast, +6.5% year-on-year versus +6.6%. The market sold off anyway. Bitcoin slid below $70,000 to an intraday low near $68,000, its lowest since August, with roughly $1.5 billion in liquidations in 24 hours and the Fear & Greed Index sitting at 20 — extreme fear.
But look at what didn't break.
Tokenized real-world assets now sit at roughly $39.9 billion — up 52% year-on-year. Tokenized US Treasuries alone are about $14 billion, paying around 3.7% a year while everything else bleeds. Ondo's USDY, at ~$2.4 billion, has now overtaken BlackRock's BUIDL as the biggest single tokenized Treasury product. Ondo's platform crossed $4 billion across 484 assets and 565,000+ holders — the largest tokenization platform on the planet.
And yesterday, the plumbing got a serious upgrade. Securitize and Ethena opened a 24/7 liquidity facility for BUIDL — up to $100 million, $50 million funded at launch — so institutions can swap BUIDL for USDC outside market hours and on weekends. The NYSE will settle tokenized stocks on Avalanche. Kraken's xStocks is adding 200+ UK and European stocks for 24/7 trading.
Wall Street isn't debating tokenization anymore. It's building the rails — while crypto panics.
Now the honest part, because this is where most posts lie to you.
The assets are a haven. The tokens are not — yet. $ONDO trades around $0.35, down roughly 26% in a month and in a daily downtrend. An Ondo-linked wallet moved 7.5 million ONDO to Coinbase in the last 24 hours. And a ~918M-token unlock lands in mid-January. ONDO is a governance token — it pays holders nothing from Ondo's fees.
$LINK is the one showing real relative strength: holding around $10, roughly flat while $BTC fell 7%. Chainlink's oracles are the plumbing under all of this — and Moody's just ran a CCIP pilot for on-chain credit ratings.
So what do you watch? Check the $ONDO chart. Support sits at $0.331, the 24-hour low. Resistance is $0.356, then $0.367. A break above $0.356 with volume says buyers are stepping back into the RWA trade. Lose $0.331 and the token keeps bleeding even as the sector grows.
That's the gap — and the trade. The infrastructure is winning. The tokens are still proving it.
Not financial advice. DYOR.
BTC Lost $70K — But Tokenized Treasuries Just Went 24/7
Bitcoin just lost $70,000. Gold fell too.
And right in the middle of the panic, the quietest corner of crypto did something loud: tokenized Treasuries went 24/7.
Here's what happened today — and why it matters more than the red candles.
The PPI print landed cooler than expected: +0.3% month-on-month versus +0.4% forecast, +6.5% year-on-year versus +6.6%. The market sold off anyway. Bitcoin slid below $70,000 to an intraday low near $68,000, its lowest since August, with roughly $1.5 billion in liquidations in 24 hours and the Fear & Greed Index sitting at 20 — extreme fear.
But look at what didn't break.
Tokenized real-world assets now sit at roughly $39.9 billion — up 52% year-on-year. Tokenized US Treasuries alone are about $14 billion, paying around 3.7% a year while everything else bleeds. Ondo's USDY, at ~$2.4 billion, has now overtaken BlackRock's BUIDL as the biggest single tokenized Treasury product. Ondo's platform crossed $4 billion across 484 assets and 565,000+ holders — the largest tokenization platform on the planet.
And yesterday, the plumbing got a serious upgrade. Securitize and Ethena opened a 24/7 liquidity facility for BUIDL — up to $100 million, $50 million funded at launch — so institutions can swap BUIDL for USDC outside market hours and on weekends. The NYSE will settle tokenized stocks on Avalanche. Kraken's xStocks is adding 200+ UK and European stocks for 24/7 trading.
Wall Street isn't debating tokenization anymore. It's building the rails — while crypto panics.
Now the honest part, because this is where most posts lie to you.
The assets are a haven. The tokens are not — yet. $ONDO trades around $0.35, down roughly 26% in a month and in a daily downtrend. An Ondo-linked wallet moved 7.5 million ONDO to Coinbase in the last 24 hours. And a ~918M-token unlock lands in mid-January. ONDO is a governance token — it pays holders nothing from Ondo's fees.
$LINK is the one showing real relative strength: holding around $10, roughly flat while $BTC fell 7%. Chainlink's oracles are the plumbing under all of this — and Moody's just ran a CCIP pilot for on-chain credit ratings.
So what do you watch? Check the $ONDO chart. Support sits at $0.331, the 24-hour low. Resistance is $0.356, then $0.367. A break above $0.356 with volume says buyers are stepping back into the RWA trade. Lose $0.331 and the token keeps bleeding even as the sector grows.
That's the gap — and the trade. The infrastructure is winning. The tokens are still proving it.
Not financial advice. DYOR.
And right in the middle of the panic, the quietest corner of crypto did something loud: tokenized Treasuries went 24/7.
Here's what happened today — and why it matters more than the red candles.
The PPI print landed cooler than expected: +0.3% month-on-month versus +0.4% forecast, +6.5% year-on-year versus +6.6%. The market sold off anyway. Bitcoin slid below $70,000 to an intraday low near $68,000, its lowest since August, with roughly $1.5 billion in liquidations in 24 hours and the Fear & Greed Index sitting at 20 — extreme fear.
But look at what didn't break.
Tokenized real-world assets now sit at roughly $39.9 billion — up 52% year-on-year. Tokenized US Treasuries alone are about $14 billion, paying around 3.7% a year while everything else bleeds. Ondo's USDY, at ~$2.4 billion, has now overtaken BlackRock's BUIDL as the biggest single tokenized Treasury product. Ondo's platform crossed $4 billion across 484 assets and 565,000+ holders — the largest tokenization platform on the planet.
And yesterday, the plumbing got a serious upgrade. Securitize and Ethena opened a 24/7 liquidity facility for BUIDL — up to $100 million, $50 million funded at launch — so institutions can swap BUIDL for USDC outside market hours and on weekends. The NYSE will settle tokenized stocks on Avalanche. Kraken's xStocks is adding 200+ UK and European stocks for 24/7 trading.
Wall Street isn't debating tokenization anymore. It's building the rails — while crypto panics.
Now the honest part, because this is where most posts lie to you.
The assets are a haven. The tokens are not — yet. $ONDO trades around $0.35, down roughly 26% in a month and in a daily downtrend. An Ondo-linked wallet moved 7.5 million ONDO to Coinbase in the last 24 hours. And a ~918M-token unlock lands in mid-January. ONDO is a governance token — it pays holders nothing from Ondo's fees.
$LINK is the one showing real relative strength: holding around $10, roughly flat while $BTC fell 7%. Chainlink's oracles are the plumbing under all of this — and Moody's just ran a CCIP pilot for on-chain credit ratings.
So what do you watch? Check the $ONDO chart. Support sits at $0.331, the 24-hour low. Resistance is $0.356, then $0.367. A break above $0.356 with volume says buyers are stepping back into the RWA trade. Lose $0.331 and the token keeps bleeding even as the sector grows.
That's the gap — and the trade. The infrastructure is winning. The tokens are still proving it.
Not financial advice. DYOR.
3
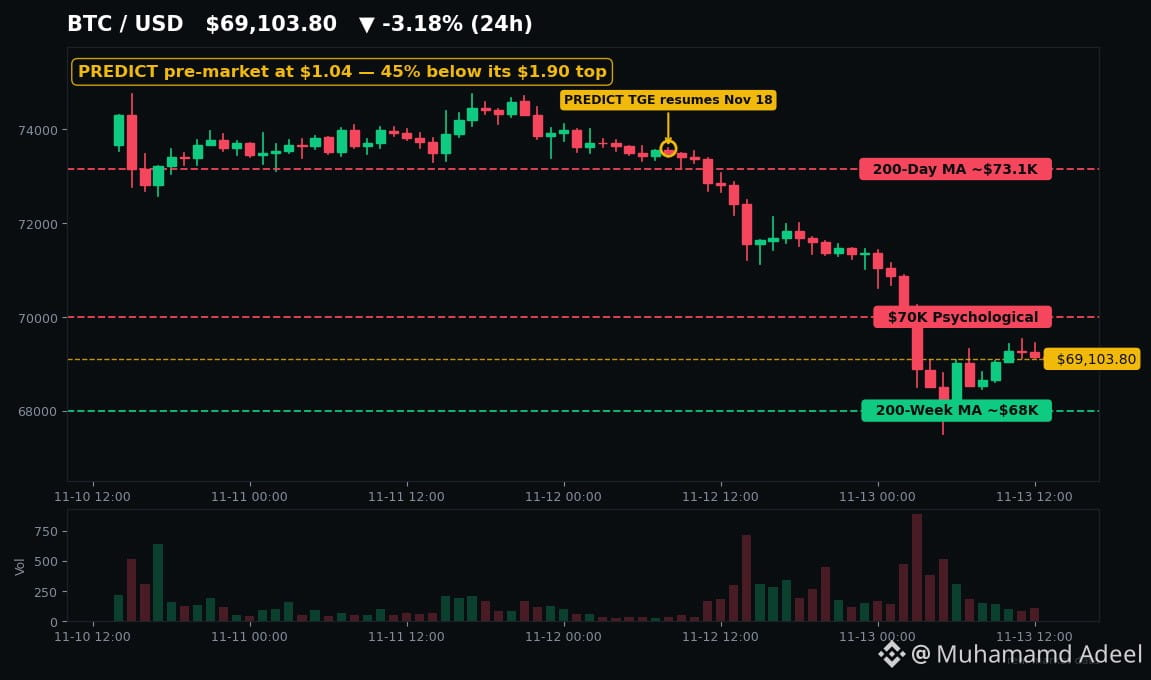
Стаття
PREDICT повертається: TGE 18 листопада — на передринку ціна вже на 45% нижча за пікBinance уже раз відклала запуск. Тепер $PREDICT повертається — а ціна на передринку вже впала майже вдвічі.
18 листопада, 09:00 UTC. Саме тоді токен predict.fun нарешті з’явиться на Binance Alpha — за п’ять днів. Власники Prime Sale Key зможуть торгувати з відкриття; також розпочнеться отримання аірдропу Season 1.
Це перший новий токен, запуск якого Binance спробувала організувати після зламу, — і цифри вже свідчать про те, як ажіотаж стикається з реальністю.
**Передумови**
Predict.fun — це ринок прогнозів на BNB Chain: криптовалюти, політика, спорт і фінанси. Проєкт підтримує YZi Labs, а інтегрований він на головний сайт Binance. Під час Prime Sale 29 жовтня продали 20 мільйонів токенів по $0,29, зібравши $5,8 мільйона; попит перевищив пропозицію приблизно у 25 разів.
PREDICT повертається: TGE 18 листопада — на передринку ціна вже на 45% нижча за пік
Binance уже раз відклала запуск. Тепер $PREDICT повертається — а ціна на передринку вже впала майже вдвічі.
18 листопада, 09:00 UTC. Саме тоді токен predict.fun нарешті з’явиться на Binance Alpha — за п’ять днів. Власники Prime Sale Key зможуть торгувати з відкриття; також розпочнеться отримання аірдропу Season 1.
Це перший новий токен, запуск якого Binance спробувала організувати після зламу, — і цифри вже свідчать про те, як ажіотаж стикається з реальністю.
**Передумови**
Predict.fun — це ринок прогнозів на BNB Chain: криптовалюти, політика, спорт і фінанси. Проєкт підтримує YZi Labs, а інтегрований він на головний сайт Binance. Під час Prime Sale 29 жовтня продали 20 мільйонів токенів по $0,29, зібравши $5,8 мільйона; попит перевищив пропозицію приблизно у 25 разів.
18 листопада, 09:00 UTC. Саме тоді токен predict.fun нарешті з’явиться на Binance Alpha — за п’ять днів. Власники Prime Sale Key зможуть торгувати з відкриття; також розпочнеться отримання аірдропу Season 1.
Це перший новий токен, запуск якого Binance спробувала організувати після зламу, — і цифри вже свідчать про те, як ажіотаж стикається з реальністю.
**Передумови**
Predict.fun — це ринок прогнозів на BNB Chain: криптовалюти, політика, спорт і фінанси. Проєкт підтримує YZi Labs, а інтегрований він на головний сайт Binance. Під час Prime Sale 29 жовтня продали 20 мільйонів токенів по $0,29, зібравши $5,8 мільйона; попит перевищив пропозицію приблизно у 25 разів.
23
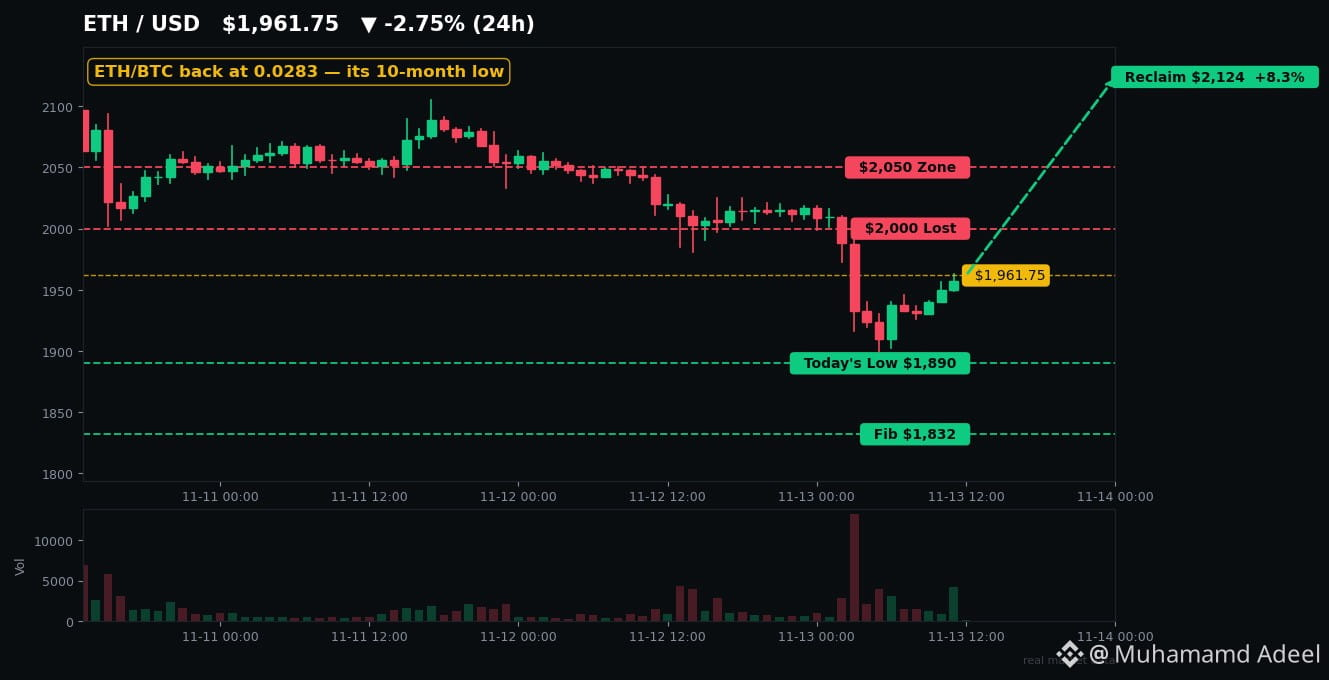
Стаття
Переглянути переклад
ETH/BTC Back at Its 10-Month Low — Dead Money or the Setup of the Year?The ETH/BTC ratio just fell back to 0.0283 — its 10-month low.
$ETH is under $2,000 for the first time since August. $BTC is bouncing around $69K. Same market, same week — and ETH is losing the race by a mile. So is this dead money… or the setup?
**The ratio tells the real story**
Forget the dollar price for a second. The ratio is the scoreboard. ETH/BTC peaked at 0.0432 in August. Today it's 0.0283 — down about 35% in three months, sitting right on its July low.
ETH is down 21.8% in 30 days. BTC is down 16.9%. Over the last week: ETH -12.4%, BTC -8.9%. Every bounce, ETH gives back more.
**Why the money keeps leaving**
Wall Street is the seller. US spot ETH ETFs have bled for 6 straight sessions — about $532M gone, and nearly $696M out in November alone. BlackRock's ETHA alone lost $129.8M in a single day.
On-chain, it's the same tape. An ICO whale dumped 16,700 ETH (about $31M) at a loss. A Foundation-linked wallet sold 2,000 ETH (about $3.87M). And Glamsterdam — ETH's big upgrade — just got delayed on testnet, with no new date.
Base settles around 8M transactions a day but pays Ethereum only about $700 a day to do it. The burn that was supposed to make ETH "ultrasound money" has switched off — ETH is net-inflationary again, and Vitalik himself said last week that fee-burning never really supported its valuation.
There's nowhere to rotate to — even $SOL is bleeding, about $81 now versus around $86 three days ago. In risk-off, the only winner is BTC.
**But here's the twist**
While the price bleeds, the staking queue is screaming the opposite. A record 44.5M ETH — 36.3% of all supply — is now staked. 912,000 ETH are waiting to stake. Only about 264,000 want out. Holders are locking up, not selling.
BitMine keeps buying — 6.07M ETH, nearly 5% of supply. One whale just bought 10,380 ETH (about $19.9M) into the drop, already down $11M on paper.
History says this spot has paid before: the last two times the ratio hit this low — April 2025 and June 2026 — ETH snapped back +202% in four months and +72% by October. Both bounces faded. The setup is real, but so is the warning.
**What flips it**
PPI lands today at 18:30 PKT, forecast +0.4% month-on-month. A cool print eases the dollar and gives risk a reason to rally. A hot one, and Waller's half-point December hike talk gets louder.
The line in the sand is the ratio itself: reclaim 0.0298 and the turn is on. Lose 0.0283 and the bleed continues.
For $ETH: $1,900 is the floor being tested right now (today's low: $1,890). Lose it and $1,832, then $1,800, come fast. Win back $2,000 and $2,050 and the shorts start sweating. Check the $ETH chart — the next 48 hours decide it.
Nobody's calling a bottom. But at a 10-month-low ratio, record staking, and Extreme Fear — this is exactly where ETH has surprised people before.
Not financial advice. DYOR.
ETH/BTC Back at Its 10-Month Low — Dead Money or the Setup of the Year?
The ETH/BTC ratio just fell back to 0.0283 — its 10-month low.
$ETH is under $2,000 for the first time since August. $BTC is bouncing around $69K. Same market, same week — and ETH is losing the race by a mile. So is this dead money… or the setup?
**The ratio tells the real story**
Forget the dollar price for a second. The ratio is the scoreboard. ETH/BTC peaked at 0.0432 in August. Today it's 0.0283 — down about 35% in three months, sitting right on its July low.
ETH is down 21.8% in 30 days. BTC is down 16.9%. Over the last week: ETH -12.4%, BTC -8.9%. Every bounce, ETH gives back more.
**Why the money keeps leaving**
Wall Street is the seller. US spot ETH ETFs have bled for 6 straight sessions — about $532M gone, and nearly $696M out in November alone. BlackRock's ETHA alone lost $129.8M in a single day.
On-chain, it's the same tape. An ICO whale dumped 16,700 ETH (about $31M) at a loss. A Foundation-linked wallet sold 2,000 ETH (about $3.87M). And Glamsterdam — ETH's big upgrade — just got delayed on testnet, with no new date.
Base settles around 8M transactions a day but pays Ethereum only about $700 a day to do it. The burn that was supposed to make ETH "ultrasound money" has switched off — ETH is net-inflationary again, and Vitalik himself said last week that fee-burning never really supported its valuation.
There's nowhere to rotate to — even $SOL is bleeding, about $81 now versus around $86 three days ago. In risk-off, the only winner is BTC.
**But here's the twist**
While the price bleeds, the staking queue is screaming the opposite. A record 44.5M ETH — 36.3% of all supply — is now staked. 912,000 ETH are waiting to stake. Only about 264,000 want out. Holders are locking up, not selling.
BitMine keeps buying — 6.07M ETH, nearly 5% of supply. One whale just bought 10,380 ETH (about $19.9M) into the drop, already down $11M on paper.
History says this spot has paid before: the last two times the ratio hit this low — April 2025 and June 2026 — ETH snapped back +202% in four months and +72% by October. Both bounces faded. The setup is real, but so is the warning.
**What flips it**
PPI lands today at 18:30 PKT, forecast +0.4% month-on-month. A cool print eases the dollar and gives risk a reason to rally. A hot one, and Waller's half-point December hike talk gets louder.
The line in the sand is the ratio itself: reclaim 0.0298 and the turn is on. Lose 0.0283 and the bleed continues.
For $ETH : $1,900 is the floor being tested right now (today's low: $1,890). Lose it and $1,832, then $1,800, come fast. Win back $2,000 and $2,050 and the shorts start sweating. Check the $ETH chart — the next 48 hours decide it.
Nobody's calling a bottom. But at a 10-month-low ratio, record staking, and Extreme Fear — this is exactly where ETH has surprised people before.
Not financial advice. DYOR.
$ETH is under $2,000 for the first time since August. $BTC is bouncing around $69K. Same market, same week — and ETH is losing the race by a mile. So is this dead money… or the setup?
**The ratio tells the real story**
Forget the dollar price for a second. The ratio is the scoreboard. ETH/BTC peaked at 0.0432 in August. Today it's 0.0283 — down about 35% in three months, sitting right on its July low.
ETH is down 21.8% in 30 days. BTC is down 16.9%. Over the last week: ETH -12.4%, BTC -8.9%. Every bounce, ETH gives back more.
**Why the money keeps leaving**
Wall Street is the seller. US spot ETH ETFs have bled for 6 straight sessions — about $532M gone, and nearly $696M out in November alone. BlackRock's ETHA alone lost $129.8M in a single day.
On-chain, it's the same tape. An ICO whale dumped 16,700 ETH (about $31M) at a loss. A Foundation-linked wallet sold 2,000 ETH (about $3.87M). And Glamsterdam — ETH's big upgrade — just got delayed on testnet, with no new date.
Base settles around 8M transactions a day but pays Ethereum only about $700 a day to do it. The burn that was supposed to make ETH "ultrasound money" has switched off — ETH is net-inflationary again, and Vitalik himself said last week that fee-burning never really supported its valuation.
There's nowhere to rotate to — even $SOL is bleeding, about $81 now versus around $86 three days ago. In risk-off, the only winner is BTC.
**But here's the twist**
While the price bleeds, the staking queue is screaming the opposite. A record 44.5M ETH — 36.3% of all supply — is now staked. 912,000 ETH are waiting to stake. Only about 264,000 want out. Holders are locking up, not selling.
BitMine keeps buying — 6.07M ETH, nearly 5% of supply. One whale just bought 10,380 ETH (about $19.9M) into the drop, already down $11M on paper.
History says this spot has paid before: the last two times the ratio hit this low — April 2025 and June 2026 — ETH snapped back +202% in four months and +72% by October. Both bounces faded. The setup is real, but so is the warning.
**What flips it**
PPI lands today at 18:30 PKT, forecast +0.4% month-on-month. A cool print eases the dollar and gives risk a reason to rally. A hot one, and Waller's half-point December hike talk gets louder.
The line in the sand is the ratio itself: reclaim 0.0298 and the turn is on. Lose 0.0283 and the bleed continues.
For $ETH : $1,900 is the floor being tested right now (today's low: $1,890). Lose it and $1,832, then $1,800, come fast. Win back $2,000 and $2,050 and the shorts start sweating. Check the $ETH chart — the next 48 hours decide it.
Nobody's calling a bottom. But at a 10-month-low ratio, record staking, and Extreme Fear — this is exactly where ETH has surprised people before.
Not financial advice. DYOR.
1
Увійдіть, щоб переглянути інший контент
Приєднуйтесь до користувачів криптовалют по всьому світу на Binance Square
⚡️ Отримуйте актуальну та корисну інформацію про криптовалюти.
💬 Приєднуйтесь до найбільшої у світі криптобіржі.
👍 Відкрийте справжні ідеї від перевірених авторів.
Електронна пошта / номер телефону
Трендові теми
fomcвідстеження
120,163 переглядів
538 обговорюють
#fomcвідстеження Жовтневий ІСЦ США у центрі уваги: ринки оцінюють перспективи підвищення ставок у грудні
Дані щодо інфляції у США, які мають оприлюднити наступного тижня, будуть під пильною увагою інвесторів, які оцінюватимуть, чи можуть стійкі цінові чинники спонукати Федеральну резервну систему знову підвищити процентні ставки у грудні. Водночас дедалі більші побоювання щодо інвестиційного буму у сфері ШІ та його потенційного впливу на економічне зростання додають невизначеності прогнозам щодо монетарної політики.$AAPLB
SergioDiaz
·1 вподобань
·123 переглядів
WhoWillSucceedJensenHuangatNvidia?
112,360 переглядів
1,362 обговорюють
WhatWillDriveCryptoandStocks’NextRebound?
490,348 переглядів
3,250 обговорюють