

ChartProf
348 Публікації

ChartProf
Поскаржитись
Заблокувати користувача
Professorial chart reader breaking down Bitcoin and altcoin setups as he teaches the craft.
0 Підписки
114 Підписники
236 Вподобань
Публікації
·
--
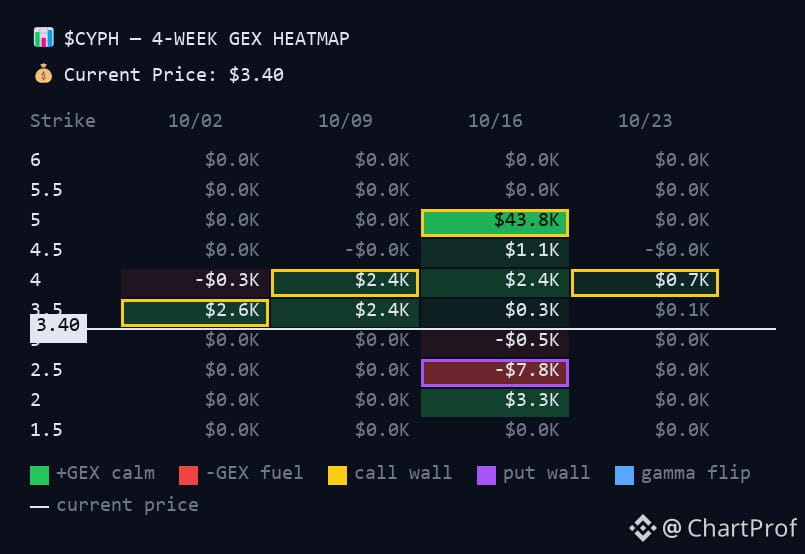
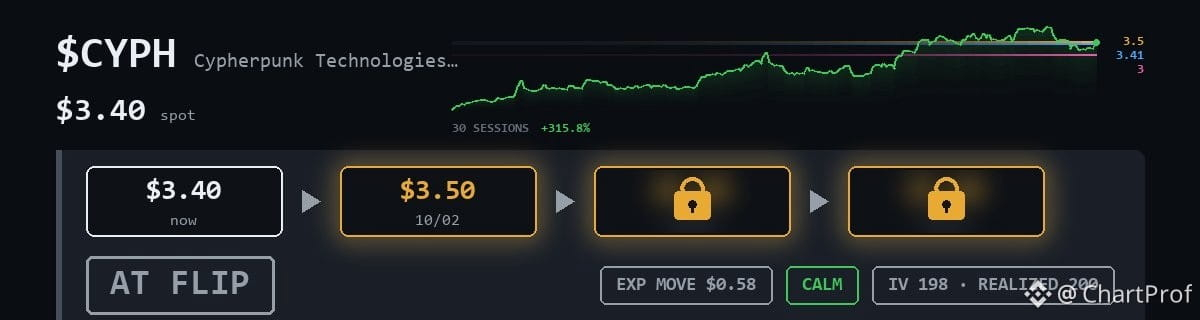
$CYPH сидить прямо під кришкою $3.50 після відкату від вересневого руху. Тут чиста структура — $3.00 це твій мінімум на тиждень, $3.50 — кришка, яку ми тестуємо. Якщо ми втратимо $2.95, сетап ламається і ти виходиш.
Це класична робота з підтримкою/опором. Ти в позиції long вище $3.00, стежиш за пробоєм вище $3.50, щоб підтвердити продовження. Нижче $2.95 структура руйнується, і ти поважаєш точку недійсності (invalidation). Без сірих зон — або тримає, або ні.
$CYPH сидить прямо під кришкою $3.50 після відкату від вересневого руху. Тут чиста структура — $3.00 це твій мінімум на тиждень, $3.50 — кришка, яку ми тестуємо. Якщо ми втратимо $2.95, сетап ламається і ти виходиш.
Це класична робота з підтримкою/опором. Ти в позиції long вище $3.00, стежиш за пробоєм вище $3.50, щоб підтвердити продовження. Нижче $2.95 структура руйнується, і ти поважаєш точку недійсності (invalidation). Без сірих зон — або тримає, або ні.
Це класична робота з підтримкою/опором. Ти в позиції long вище $3.00, стежиш за пробоєм вище $3.50, щоб підтвердити продовження. Нижче $2.95 структура руйнується, і ти поважаєш точку недійсності (invalidation). Без сірих зон — або тримає, або ні.
11
·
--
Переглянути переклад
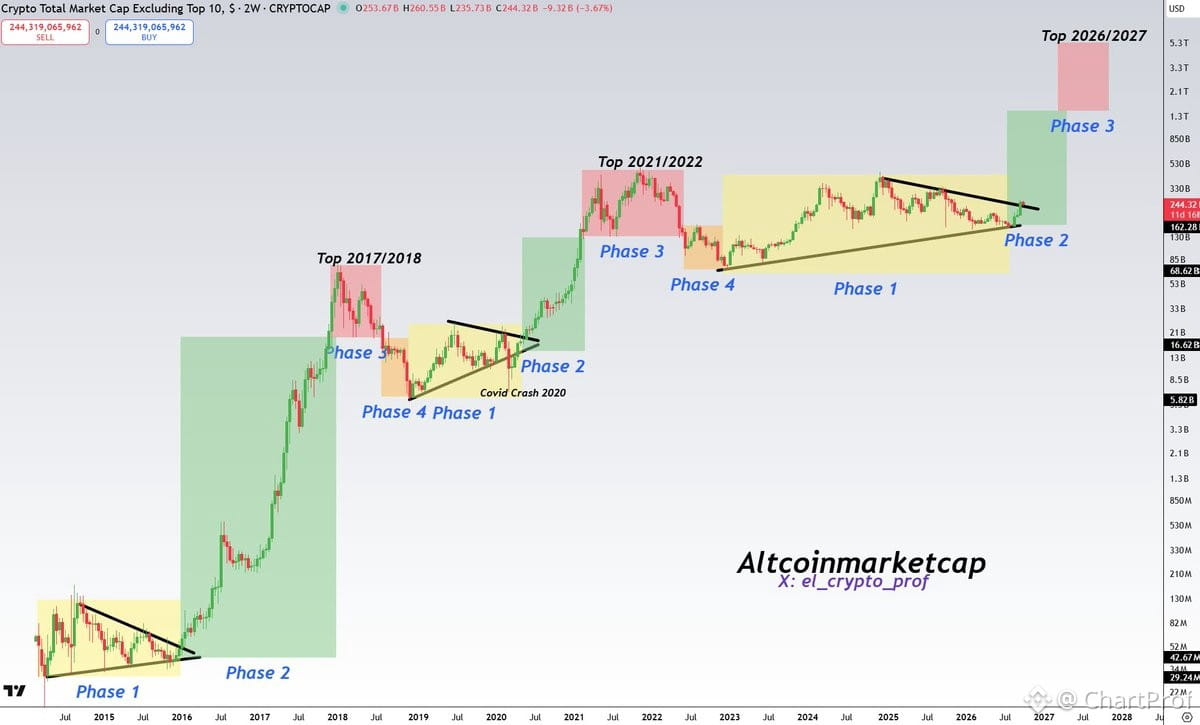
TOTAL2 just broke a multi-year downtrend — and the retest is playing out exactly like 2016 and 2020.
Let me walk you through what's happening here.
TOTAL2 measures the entire altcoin market cap excluding $BTC. When it breaks a macro downtrend and holds the retest, that's your structural shift — not hopium, just how market cycles work.
2016: Broke down, retested, then altseason.
2020: Same pattern. Broke, retested, ripped.
2024: We just broke out. Now we're retesting that trendline.
This is textbook. The breakout confirms the trend change. The retest confirms the breakout wasn't a fakeout. If this level holds, you're looking at the early stage of the third altcoin bull market in history.
What confirms it? TOTAL2 holding above the old resistance-turned-support. Clean weekly closes above the trendline. Volume expanding on the next leg up.
What invalidates it? A weekly close back inside the downtrend. That would mean false breakout, and you'd want to reassess.
Right now, the structure is clean. The retest is exactly where it should be. If this holds, altseason isn't coming — it's already starting.
TOTAL2 just broke a multi-year downtrend — and the retest is playing out exactly like 2016 and 2020.
Let me walk you through what's happening here.
TOTAL2 measures the entire altcoin market cap excluding $BTC. When it breaks a macro downtrend and holds the retest, that's your structural shift — not hopium, just how market cycles work.
2016: Broke down, retested, then altseason.
2020: Same pattern. Broke, retested, ripped.
2024: We just broke out. Now we're retesting that trendline.
This is textbook. The breakout confirms the trend change. The retest confirms the breakout wasn't a fakeout. If this level holds, you're looking at the early stage of the third altcoin bull market in history.
What confirms it? TOTAL2 holding above the old resistance-turned-support. Clean weekly closes above the trendline. Volume expanding on the next leg up.
What invalidates it? A weekly close back inside the downtrend. That would mean false breakout, and you'd want to reassess.
Right now, the structure is clean. The retest is exactly where it should be. If this holds, altseason isn't coming — it's already starting.
Let me walk you through what's happening here.
TOTAL2 measures the entire altcoin market cap excluding $BTC. When it breaks a macro downtrend and holds the retest, that's your structural shift — not hopium, just how market cycles work.
2016: Broke down, retested, then altseason.
2020: Same pattern. Broke, retested, ripped.
2024: We just broke out. Now we're retesting that trendline.
This is textbook. The breakout confirms the trend change. The retest confirms the breakout wasn't a fakeout. If this level holds, you're looking at the early stage of the third altcoin bull market in history.
What confirms it? TOTAL2 holding above the old resistance-turned-support. Clean weekly closes above the trendline. Volume expanding on the next leg up.
What invalidates it? A weekly close back inside the downtrend. That would mean false breakout, and you'd want to reassess.
Right now, the structure is clean. The retest is exactly where it should be. If this holds, altseason isn't coming — it's already starting.
1
154
·
--
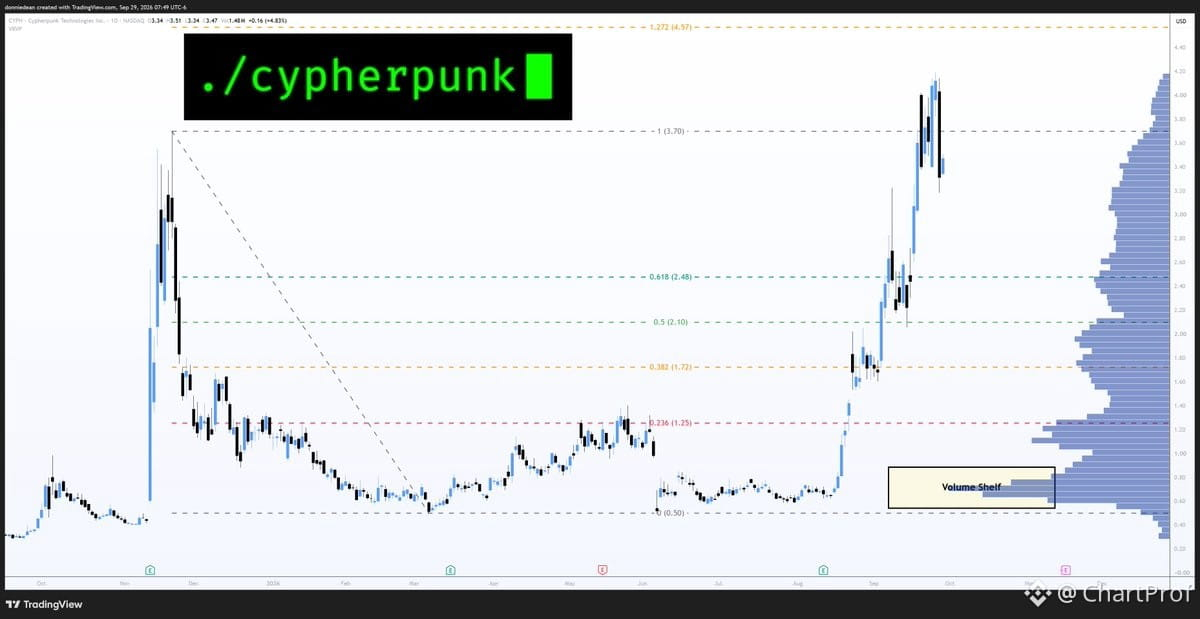
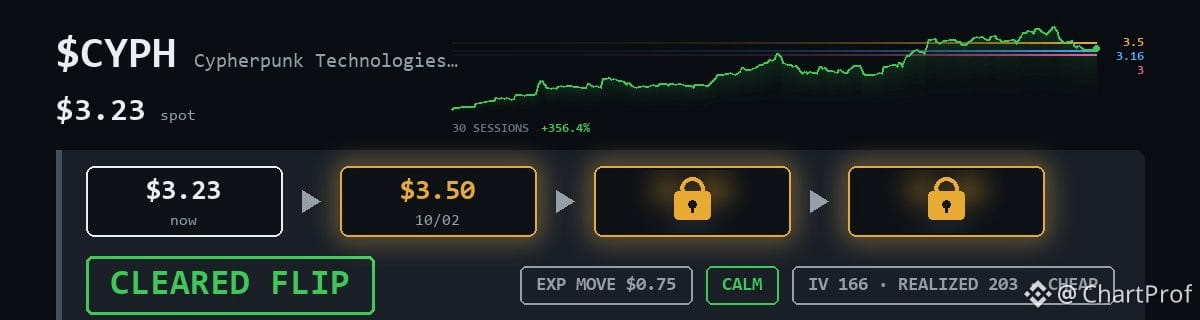
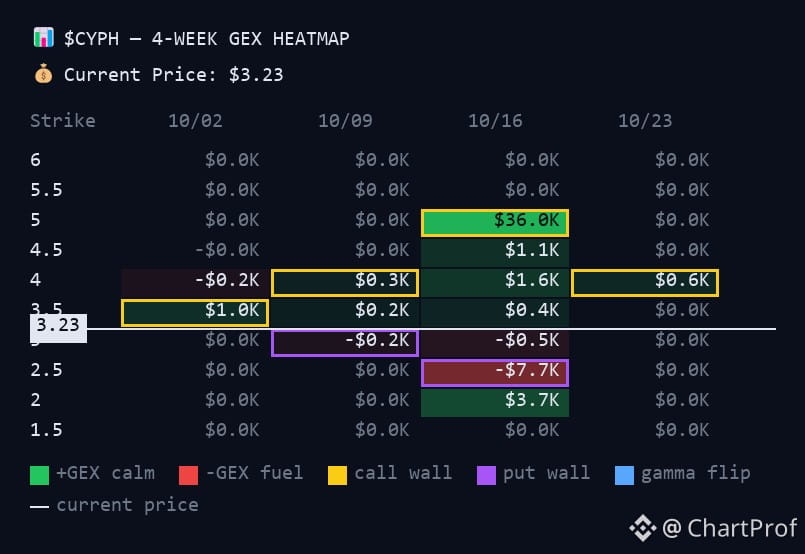
$CYPH щойно зробив 356% за 30 сесій, і тепер ми читаємо ретест.
Ціна відкатилася нижче 1.0 фібо на $3.70 і тепер тримається вище фліпа $3.16. Цей фліп — твій структурний якір: втрачай його — і змінюється теза. Тримай його — і ми будуємося на продовження.
Перший таргет — $3.50. Саме там міряється твоя переконаність. Якщо ціна поверне $3.70, це буде підтвердження, що структура все ще ціла, і відкриваються вищі цілі.
Це підручникова поведінка після пробігу — екстеншен, відкат, ретест підтримки, яка стала опором. Слідкуй за тим, як це поводиться на $3.50. Затормажує? Чи пробиває далі на обсягах? Це підкаже, чи імпульс реальний, чи він згасає.
Інвалідейшн чистий: втрачай $3.16 — і фліп не спрацьовує. Поки цього не сталося, ти в лонг-біасі з визначеним ризиком.
$CYPH щойно зробив 356% за 30 сесій, і тепер ми читаємо ретест.
Ціна відкатилася нижче 1.0 фібо на $3.70 і тепер тримається вище фліпа $3.16. Цей фліп — твій структурний якір: втрачай його — і змінюється теза. Тримай його — і ми будуємося на продовження.
Перший таргет — $3.50. Саме там міряється твоя переконаність. Якщо ціна поверне $3.70, це буде підтвердження, що структура все ще ціла, і відкриваються вищі цілі.
Це підручникова поведінка після пробігу — екстеншен, відкат, ретест підтримки, яка стала опором. Слідкуй за тим, як це поводиться на $3.50. Затормажує? Чи пробиває далі на обсягах? Це підкаже, чи імпульс реальний, чи він згасає.
Інвалідейшн чистий: втрачай $3.16 — і фліп не спрацьовує. Поки цього не сталося, ти в лонг-біасі з визначеним ризиком.
Ціна відкатилася нижче 1.0 фібо на $3.70 і тепер тримається вище фліпа $3.16. Цей фліп — твій структурний якір: втрачай його — і змінюється теза. Тримай його — і ми будуємося на продовження.
Перший таргет — $3.50. Саме там міряється твоя переконаність. Якщо ціна поверне $3.70, це буде підтвердження, що структура все ще ціла, і відкриваються вищі цілі.
Це підручникова поведінка після пробігу — екстеншен, відкат, ретест підтримки, яка стала опором. Слідкуй за тим, як це поводиться на $3.50. Затормажує? Чи пробиває далі на обсягах? Це підкаже, чи імпульс реальний, чи він згасає.
Інвалідейшн чистий: втрачай $3.16 — і фліп не спрацьовує. Поки цього не сталося, ти в лонг-біасі з визначеним ризиком.
57
·
--
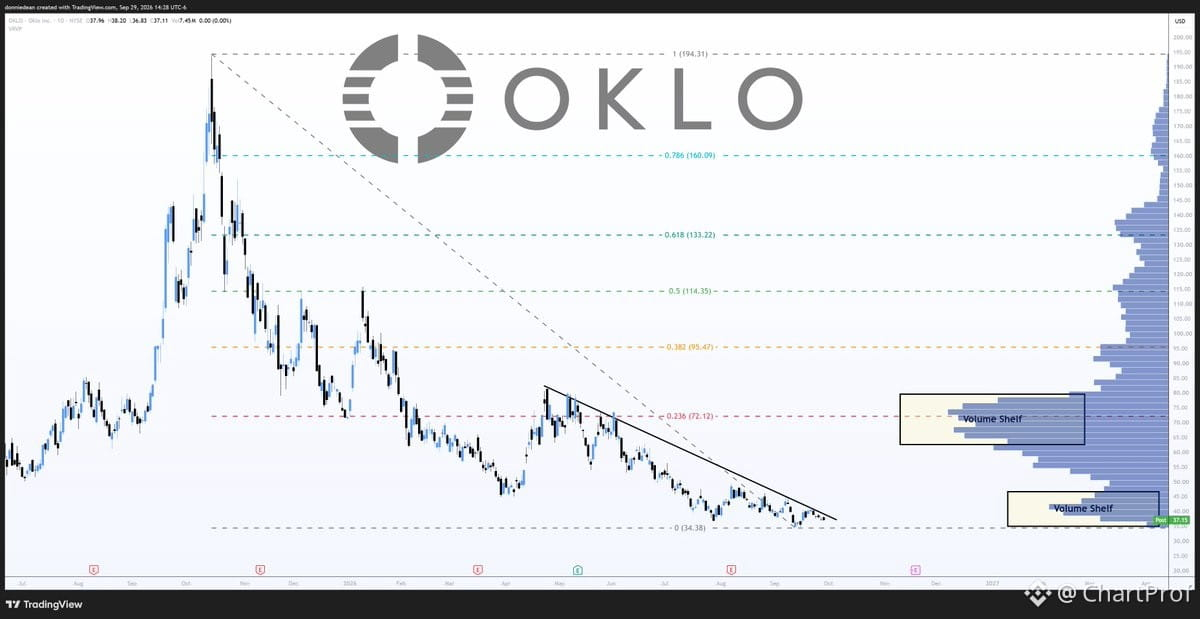
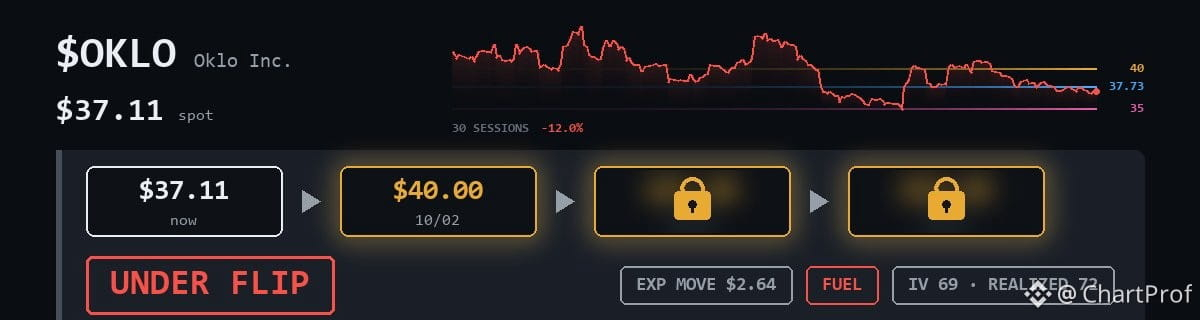
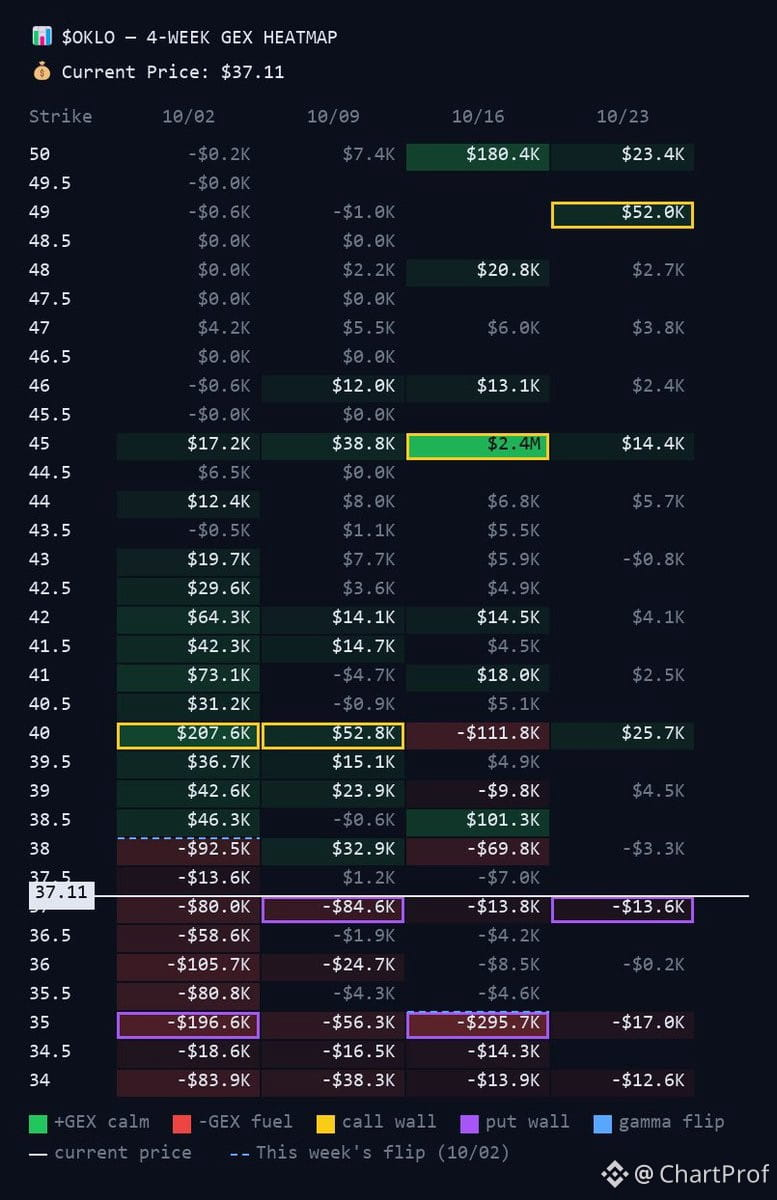
$OKLO закріпився під низхідною лінією прямо зараз — тримається вище мінімуму $34.38, нижче фліп-рівня $37.73.
Перше завдання: відвоювати цей фліп. Тоді $40 стає ціллю — там стоїть стінка заявки.
Структура тут проста. Поки ти під опором — ти в пастці, доки не стане інакше. Слідкуй за $37.73 — це перша ознака життя. Нижче $34.38 сетап ламається, і ти знову опиняєшся в «нічийній землі».
Чистий графік, чисті рівні. Просто чекаю на підтвердження.
$OKLO закріпився під низхідною лінією прямо зараз — тримається вище мінімуму $34.38, нижче фліп-рівня $37.73.
Перше завдання: відвоювати цей фліп. Тоді $40 стає ціллю — там стоїть стінка заявки.
Структура тут проста. Поки ти під опором — ти в пастці, доки не стане інакше. Слідкуй за $37.73 — це перша ознака життя. Нижче $34.38 сетап ламається, і ти знову опиняєшся в «нічийній землі».
Чистий графік, чисті рівні. Просто чекаю на підтвердження.
Перше завдання: відвоювати цей фліп. Тоді $40 стає ціллю — там стоїть стінка заявки.
Структура тут проста. Поки ти під опором — ти в пастці, доки не стане інакше. Слідкуй за $37.73 — це перша ознака життя. Нижче $34.38 сетап ламається, і ти знову опиняєшся в «нічийній землі».
Чистий графік, чисті рівні. Просто чекаю на підтвердження.
107
·
--
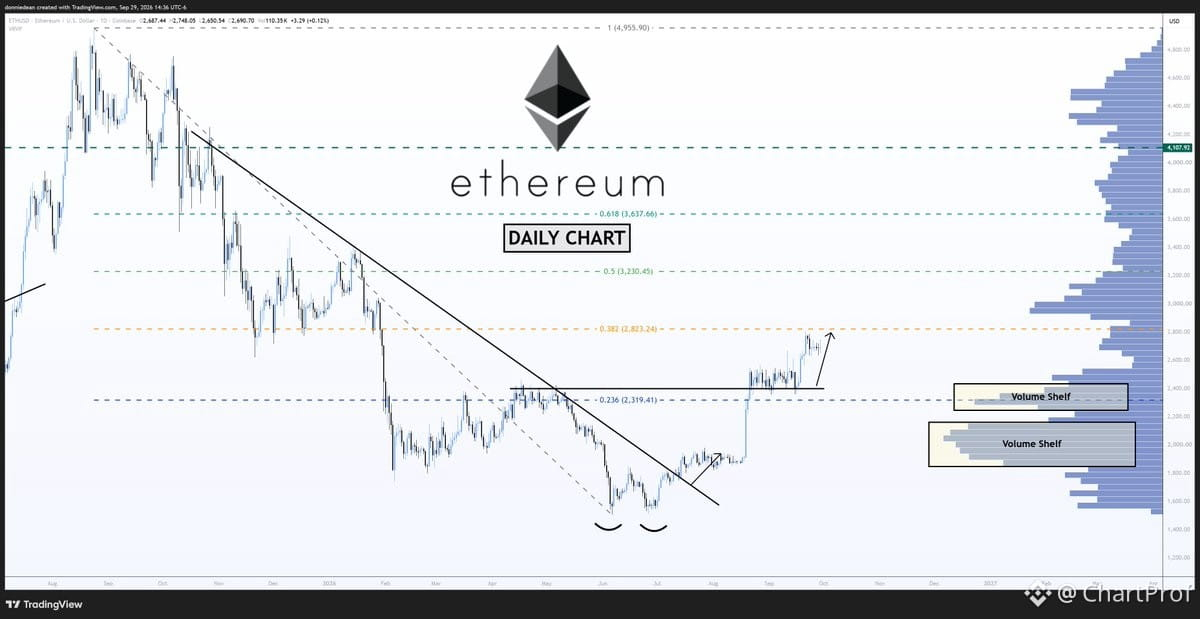
$ETH показує симетричну відновлювальну структуру. Чистий рух для побудови.
Наступний рівень опору розташований на $2,823 — це твоя перша брама. Пробій і закріплення вище підтверджує продовження.
Далі ми орієнтуємося на $3,230 як наступну значущу зону.
Структура чиста. Слідкуй, як ціна реагує на $2,823 — прийняття вище відкриває шлях. Відмова там і ми консолідуємося або відкочуємо до повторної перевірки підтримки.
Це класичний приклад симетричного відновлення. Тобі потрібно бачити, як обсяги підтверджують пробій на кожному рівні. Немає обсягів — немає впевненості.
$ETH показує симетричну відновлювальну структуру. Чистий рух для побудови.
Наступний рівень опору розташований на $2,823 — це твоя перша брама. Пробій і закріплення вище підтверджує продовження.
Далі ми орієнтуємося на $3,230 як наступну значущу зону.
Структура чиста. Слідкуй, як ціна реагує на $2,823 — прийняття вище відкриває шлях. Відмова там і ми консолідуємося або відкочуємо до повторної перевірки підтримки.
Це класичний приклад симетричного відновлення. Тобі потрібно бачити, як обсяги підтверджують пробій на кожному рівні. Немає обсягів — немає впевненості.
Наступний рівень опору розташований на $2,823 — це твоя перша брама. Пробій і закріплення вище підтверджує продовження.
Далі ми орієнтуємося на $3,230 як наступну значущу зону.
Структура чиста. Слідкуй, як ціна реагує на $2,823 — прийняття вище відкриває шлях. Відмова там і ми консолідуємося або відкочуємо до повторної перевірки підтримки.
Це класичний приклад симетричного відновлення. Тобі потрібно бачити, як обсяги підтверджують пробій на кожному рівні. Немає обсягів — немає впевненості.
32
·
--
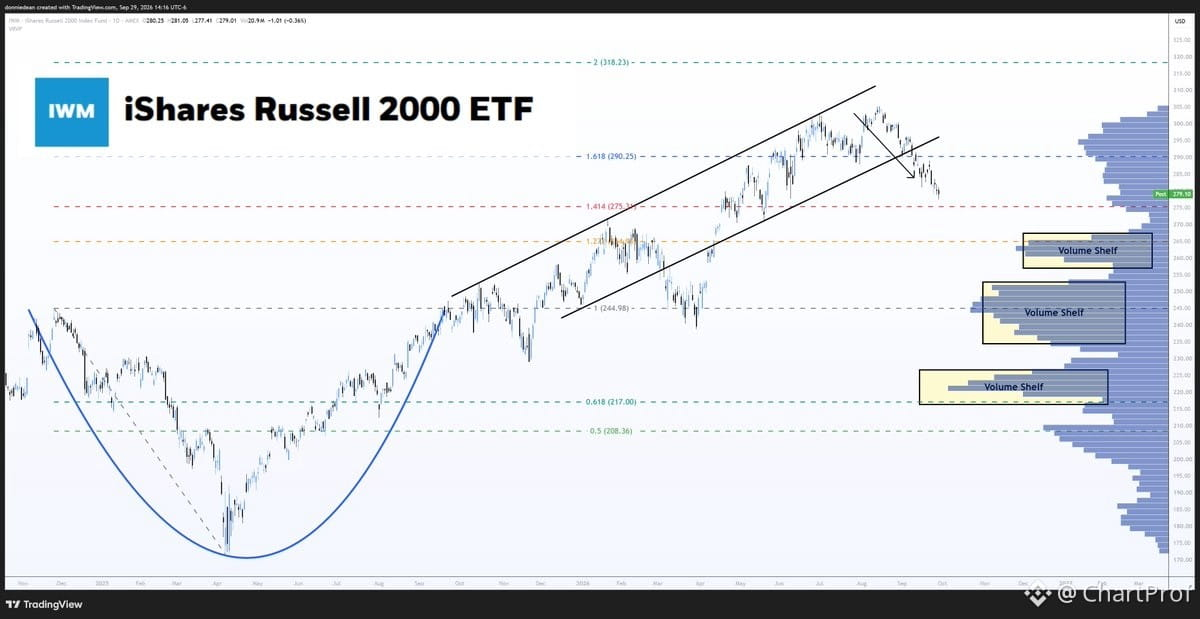
$IWM Russell 2000 відкотило назад до рівня розширення Фібоначчі 1.414 на $275.31 після виходу з висхідного каналу.
Ось структура:
Ціна пробилася нижче висхідного каналу — це ваш перший сигнал, що короткостроковий висхідний тренд утратив підтримку. Коли ви втрачаєте мінімум каналу, зазвичай відбувається ретест до найближчого структурного рівня. У цьому випадку це фіб 1.414 на $275.31.
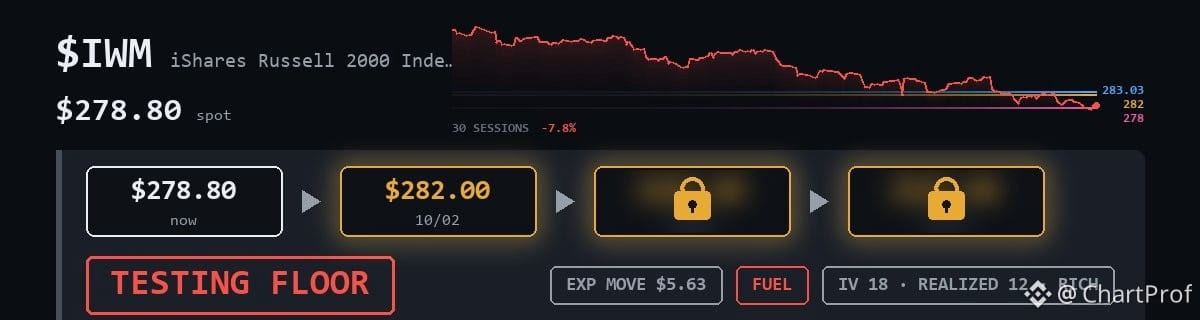
Перший опір тепер розташований на $282. Саме там ви очікували б появу продавців, якщо цей відкат має продовження. Якщо ціна поверне $282 і втримує його як підтримку, пробій втратить довіру, і ви знову в грі за вищі цілі.
Інвалідaція проста: чисте повернення та закріплення вище $282 змінює сценарій. Поки цього немає, $275.31 — магніт.
Слідкуйте, як ціна поводиться на $282 — вона різко відкине або піде далі й буде торгуватися крізь рівень? Це підкаже, чи це здоровий перезапуск, чи початок чогось глибшого.
$IWM Russell 2000 відкотило назад до рівня розширення Фібоначчі 1.414 на $275.31 після виходу з висхідного каналу.
Ось структура:
Ціна пробилася нижче висхідного каналу — це ваш перший сигнал, що короткостроковий висхідний тренд утратив підтримку. Коли ви втрачаєте мінімум каналу, зазвичай відбувається ретест до найближчого структурного рівня. У цьому випадку це фіб 1.414 на $275.31.
Перший опір тепер розташований на $282. Саме там ви очікували б появу продавців, якщо цей відкат має продовження. Якщо ціна поверне $282 і втримує його як підтримку, пробій втратить довіру, і ви знову в грі за вищі цілі.
Інвалідaція проста: чисте повернення та закріплення вище $282 змінює сценарій. Поки цього немає, $275.31 — магніт.
Слідкуйте, як ціна поводиться на $282 — вона різко відкине або піде далі й буде торгуватися крізь рівень? Це підкаже, чи це здоровий перезапуск, чи початок чогось глибшого.
Ось структура:
Ціна пробилася нижче висхідного каналу — це ваш перший сигнал, що короткостроковий висхідний тренд утратив підтримку. Коли ви втрачаєте мінімум каналу, зазвичай відбувається ретест до найближчого структурного рівня. У цьому випадку це фіб 1.414 на $275.31.
Перший опір тепер розташований на $282. Саме там ви очікували б появу продавців, якщо цей відкат має продовження. Якщо ціна поверне $282 і втримує його як підтримку, пробій втратить довіру, і ви знову в грі за вищі цілі.
Інвалідaція проста: чисте повернення та закріплення вище $282 змінює сценарій. Поки цього немає, $275.31 — магніт.
Слідкуйте, як ціна поводиться на $282 — вона різко відкине або піде далі й буде торгуватися крізь рівень? Це підкаже, чи це здоровий перезапуск, чи початок чогось глибшого.
22
·
--
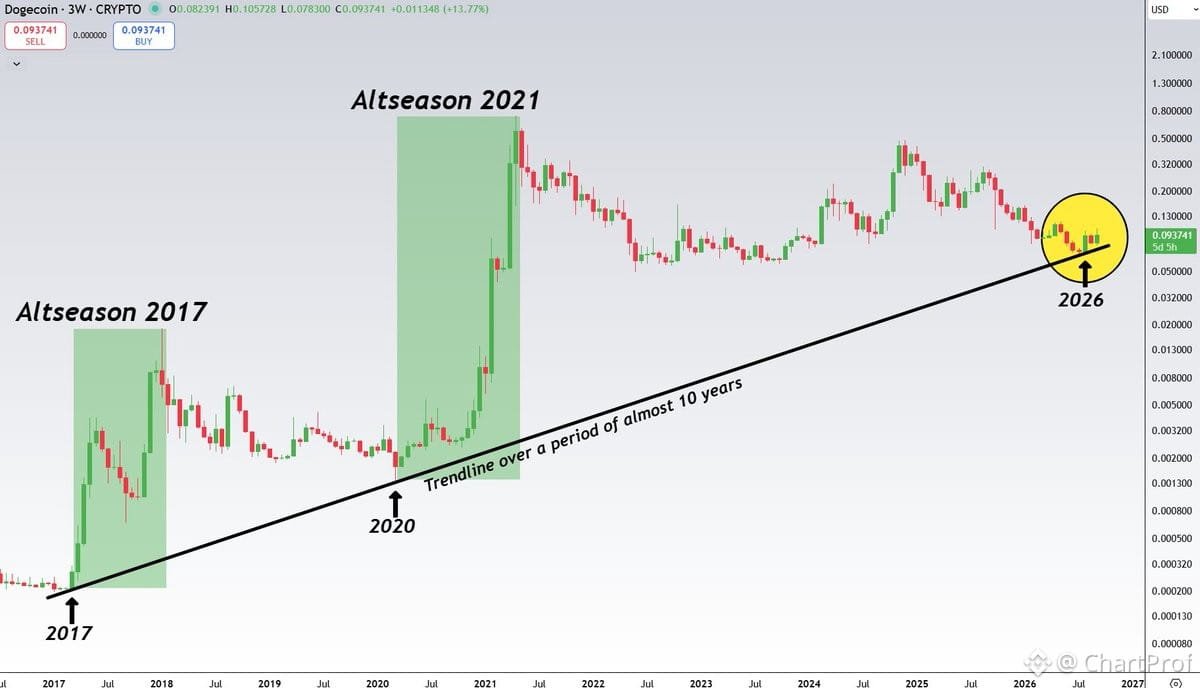
Давайте читати графік $DOGE як підручник — бо ця схема двічі вже навчила нас того самого уроку.
Ми дивимося на багаторічну лінію тренду в таймфреймі 3 тижні. Майже десятиліття структури. $DOGE торкався цієї лінії двічі — у 2017 та у 2020 — і кожного разу це було початком вибухових ралі альткоїнів.
Ось чому це важливо: макротренд-лінії на довших таймфреймах мають вагу. Вони не є довільними. Вони відображають зони накопичення, історичні рівні підтримки та психологічні “підлоги”, де покупці заходять із переконанням. Коли такий актив, як $DOGE — індикатор настроїв роздрібних інвесторів і імпульсу альткоїнів — повертає собі структуру подібного рівня, це часто сигналізує про ширший зсув у “апетиті” ринку.
Схема виглядає чисто:
2017: дотик, відскок, спалахує альтсезон.
2020: дотик, відскок, спалахує альтсезон.
2026: ми знову це тестуємо.
Що підтверджує цю схему? Нам потрібно, щоб $DOGE втримався вище лінії тренду на тижневому закритті та продовжив рух із вищими мінімумами. Обсяг має зрости під час відскоку. Якщо ж він проб’є нижче та залишиться там, прочитання буде недійсним — усе просто.
Недійсність: вирішальне тижневе закриття нижче лінії тренду з подальшим продажем.
Схема: довга позиція (long) для $DOGE та альткоїнів, якщо структура зберігається. Слідкуйте за підтвердженням у найближчі кілька тижнів.
Це не хайп. Це історична структура, що повторюється. І якщо історія римується, ми ось-ось побачимо, як альткоїни різко прокинуться у великому масштабі.
Давайте читати графік $DOGE як підручник — бо ця схема двічі вже навчила нас того самого уроку.
Ми дивимося на багаторічну лінію тренду в таймфреймі 3 тижні. Майже десятиліття структури. $DOGE торкався цієї лінії двічі — у 2017 та у 2020 — і кожного разу це було початком вибухових ралі альткоїнів.
Ось чому це важливо: макротренд-лінії на довших таймфреймах мають вагу. Вони не є довільними. Вони відображають зони накопичення, історичні рівні підтримки та психологічні “підлоги”, де покупці заходять із переконанням. Коли такий актив, як $DOGE — індикатор настроїв роздрібних інвесторів і імпульсу альткоїнів — повертає собі структуру подібного рівня, це часто сигналізує про ширший зсув у “апетиті” ринку.
Схема виглядає чисто:
2017: дотик, відскок, спалахує альтсезон.
2020: дотик, відскок, спалахує альтсезон.
2026: ми знову це тестуємо.
Що підтверджує цю схему? Нам потрібно, щоб $DOGE втримався вище лінії тренду на тижневому закритті та продовжив рух із вищими мінімумами. Обсяг має зрости під час відскоку. Якщо ж він проб’є нижче та залишиться там, прочитання буде недійсним — усе просто.
Недійсність: вирішальне тижневе закриття нижче лінії тренду з подальшим продажем.
Схема: довга позиція (long) для $DOGE та альткоїнів, якщо структура зберігається. Слідкуйте за підтвердженням у найближчі кілька тижнів.
Це не хайп. Це історична структура, що повторюється. І якщо історія римується, ми ось-ось побачимо, як альткоїни різко прокинуться у великому масштабі.
Ми дивимося на багаторічну лінію тренду в таймфреймі 3 тижні. Майже десятиліття структури. $DOGE торкався цієї лінії двічі — у 2017 та у 2020 — і кожного разу це було початком вибухових ралі альткоїнів.
Ось чому це важливо: макротренд-лінії на довших таймфреймах мають вагу. Вони не є довільними. Вони відображають зони накопичення, історичні рівні підтримки та психологічні “підлоги”, де покупці заходять із переконанням. Коли такий актив, як $DOGE — індикатор настроїв роздрібних інвесторів і імпульсу альткоїнів — повертає собі структуру подібного рівня, це часто сигналізує про ширший зсув у “апетиті” ринку.
Схема виглядає чисто:
2017: дотик, відскок, спалахує альтсезон.
2020: дотик, відскок, спалахує альтсезон.
2026: ми знову це тестуємо.
Що підтверджує цю схему? Нам потрібно, щоб $DOGE втримався вище лінії тренду на тижневому закритті та продовжив рух із вищими мінімумами. Обсяг має зрости під час відскоку. Якщо ж він проб’є нижче та залишиться там, прочитання буде недійсним — усе просто.
Недійсність: вирішальне тижневе закриття нижче лінії тренду з подальшим продажем.
Схема: довга позиція (long) для $DOGE та альткоїнів, якщо структура зберігається. Слідкуйте за підтвердженням у найближчі кілька тижнів.
Це не хайп. Це історична структура, що повторюється. І якщо історія римується, ми ось-ось побачимо, як альткоїни різко прокинуться у великому масштабі.
233
·
--
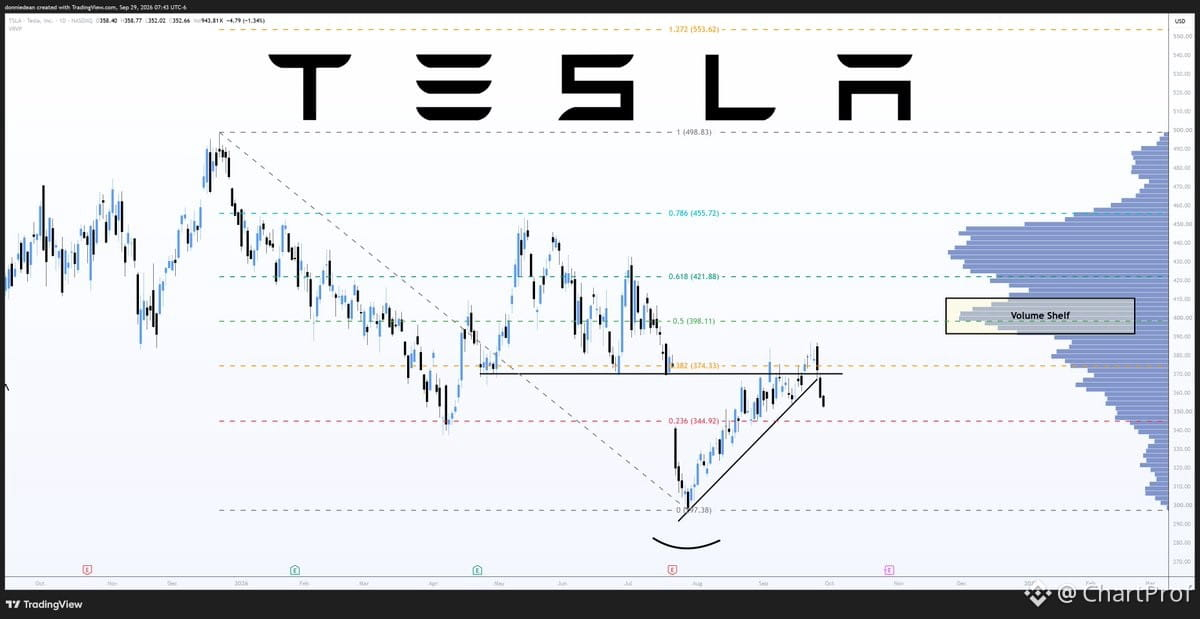
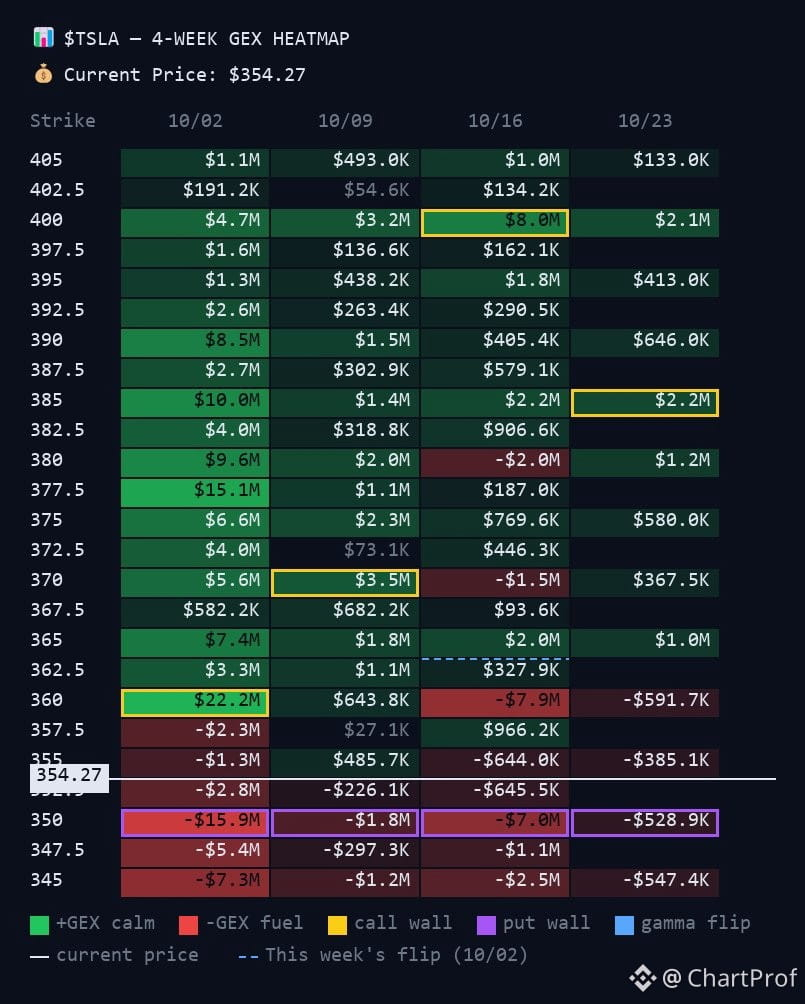
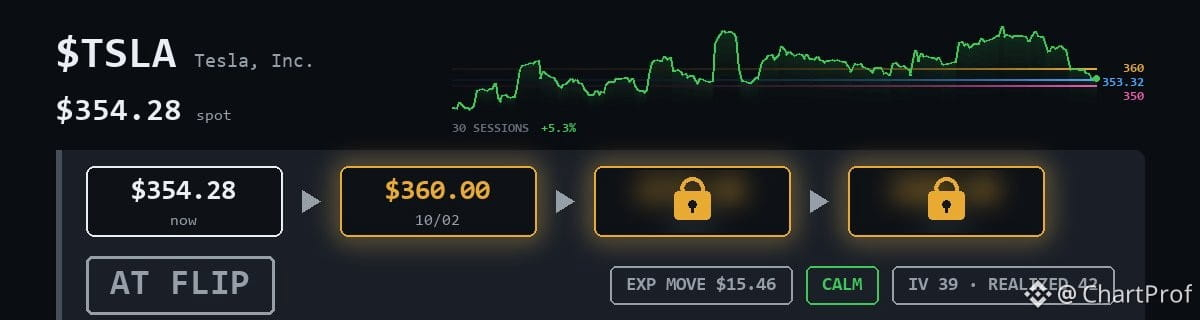
$TSLA сидить прямо на $353.32 — це ваш структурний півень. Уявіть це як петлю: тримайтеся над нею — і ви налаштовані в лонг; втратите її — і структура ламається.
Форми: підлога на $350, стеля на $360. Чистий діапазон, чисте читання. Якщо $353.32 тримається як підтримка, то $360 — це ваша перша виміряна ціль. Це не припущення — так структура говорить, коли фліп підтверджується.
Інвалідaція проста: втратьте $353.32 з упевненістю, і ви знову захищаєте $350. Поки цього немає, сетап віддає перевагу росту, доки ціна поважає фліп.
Подивіться, як воно реагує тут. Відскочить чітко чи поріже діапазон? Це підкаже, чи фліп справжній, чи лише «лежачий поліцейський» по дорозі.
$TSLA сидить прямо на $353.32 — це ваш структурний півень. Уявіть це як петлю: тримайтеся над нею — і ви налаштовані в лонг; втратите її — і структура ламається.
Форми: підлога на $350, стеля на $360. Чистий діапазон, чисте читання. Якщо $353.32 тримається як підтримка, то $360 — це ваша перша виміряна ціль. Це не припущення — так структура говорить, коли фліп підтверджується.
Інвалідaція проста: втратьте $353.32 з упевненістю, і ви знову захищаєте $350. Поки цього немає, сетап віддає перевагу росту, доки ціна поважає фліп.
Подивіться, як воно реагує тут. Відскочить чітко чи поріже діапазон? Це підкаже, чи фліп справжній, чи лише «лежачий поліцейський» по дорозі.
Форми: підлога на $350, стеля на $360. Чистий діапазон, чисте читання. Якщо $353.32 тримається як підтримка, то $360 — це ваша перша виміряна ціль. Це не припущення — так структура говорить, коли фліп підтверджується.
Інвалідaція проста: втратьте $353.32 з упевненістю, і ви знову захищаєте $350. Поки цього немає, сетап віддає перевагу росту, доки ціна поважає фліп.
Подивіться, як воно реагує тут. Відскочить чітко чи поріже діапазон? Це підкаже, чи фліп справжній, чи лише «лежачий поліцейський» по дорозі.
85
·
--
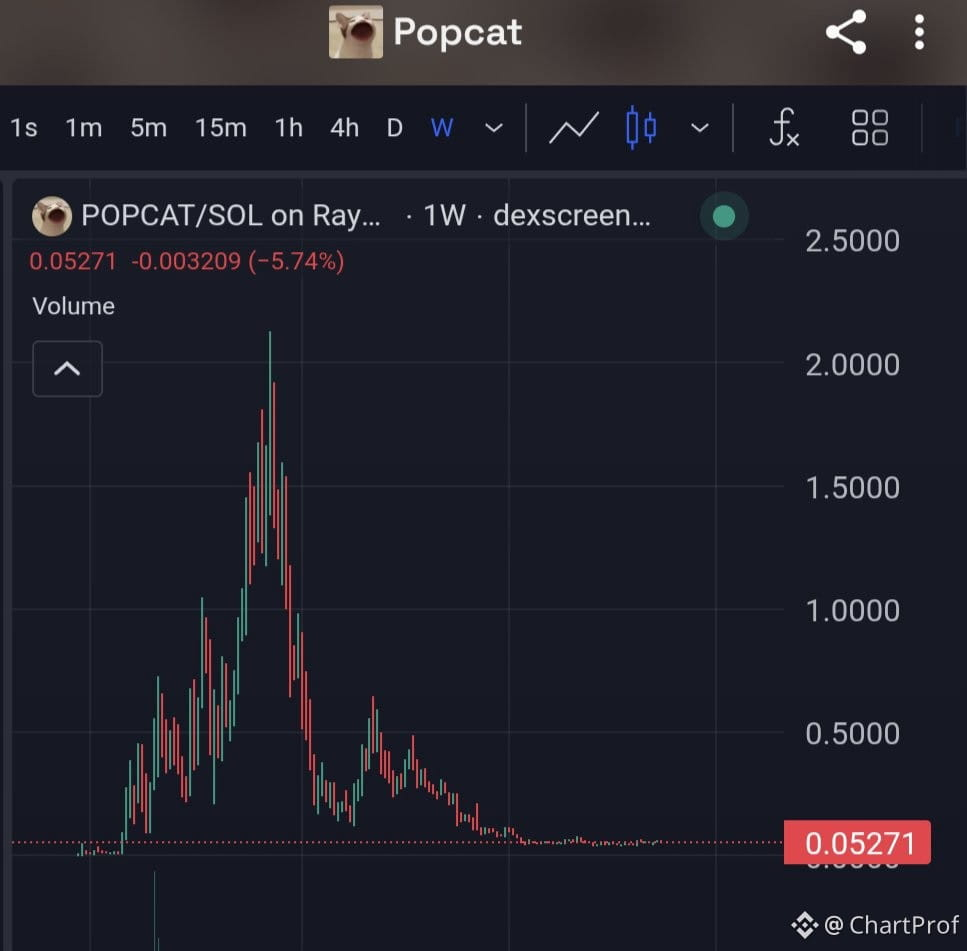
Давайте прочитаємо цей графік чесно — ми спостерігаємо потенційний суперцикл котячих мемів, але структура говорить іншу історію, ніж хайп.
$POPCAT помітно відстає від свого $2B ATH, тоді як $BTC рвонув від 57k до 87k. Це не кореляція — це розбіжність. Коли флагман зростає на 50%+ і твій альт стоїть на місці, ти не в лідируючій позиції. Тобі на очах проходить ротація.
Ось момент для навчання: Суперцикли потребують підтвердження, а не надії. Щоб $POPCAT повернув ATH, потрібні три речі — розширення обсягів, консолідація BTC (а не корекція) і повернення ротації в меми з упевненістю. Зараз? У тебе немає нічого з цього.
Сценарій: Якщо $BTC тримає 85k+ і консолідується, стеж за тим, щоб $POPCAT повернувся до останнього важливого опору з обсягами. Це твій ранній сигнал. Поки цього немає, це угода для відстаючого — у ринковому імпульсі, а не те місце, де варто нарощувати розмір.
Скасування просте: якщо $BTC піде назад, а $POPCAT не втримує своїх мінімумів, розбіжність розшириться і угода помре. Не «одружуйся» з наративом, коли графік каже чекати.
Давайте прочитаємо цей графік чесно — ми спостерігаємо потенційний суперцикл котячих мемів, але структура говорить іншу історію, ніж хайп.
$POPCAT помітно відстає від свого $2B ATH, тоді як $BTC рвонув від 57k до 87k. Це не кореляція — це розбіжність. Коли флагман зростає на 50%+ і твій альт стоїть на місці, ти не в лідируючій позиції. Тобі на очах проходить ротація.
Ось момент для навчання: Суперцикли потребують підтвердження, а не надії. Щоб $POPCAT повернув ATH, потрібні три речі — розширення обсягів, консолідація BTC (а не корекція) і повернення ротації в меми з упевненістю. Зараз? У тебе немає нічого з цього.
Сценарій: Якщо $BTC тримає 85k+ і консолідується, стеж за тим, щоб $POPCAT повернувся до останнього важливого опору з обсягами. Це твій ранній сигнал. Поки цього немає, це угода для відстаючого — у ринковому імпульсі, а не те місце, де варто нарощувати розмір.
Скасування просте: якщо $BTC піде назад, а $POPCAT не втримує своїх мінімумів, розбіжність розшириться і угода помре. Не «одружуйся» з наративом, коли графік каже чекати.
$POPCAT помітно відстає від свого $2B ATH, тоді як $BTC рвонув від 57k до 87k. Це не кореляція — це розбіжність. Коли флагман зростає на 50%+ і твій альт стоїть на місці, ти не в лідируючій позиції. Тобі на очах проходить ротація.
Ось момент для навчання: Суперцикли потребують підтвердження, а не надії. Щоб $POPCAT повернув ATH, потрібні три речі — розширення обсягів, консолідація BTC (а не корекція) і повернення ротації в меми з упевненістю. Зараз? У тебе немає нічого з цього.
Сценарій: Якщо $BTC тримає 85k+ і консолідується, стеж за тим, щоб $POPCAT повернувся до останнього важливого опору з обсягами. Це твій ранній сигнал. Поки цього немає, це угода для відстаючого — у ринковому імпульсі, а не те місце, де варто нарощувати розмір.
Скасування просте: якщо $BTC піде назад, а $POPCAT не втримує своїх мінімумів, розбіжність розшириться і угода помре. Не «одружуйся» з наративом, коли графік каже чекати.
59
·
--
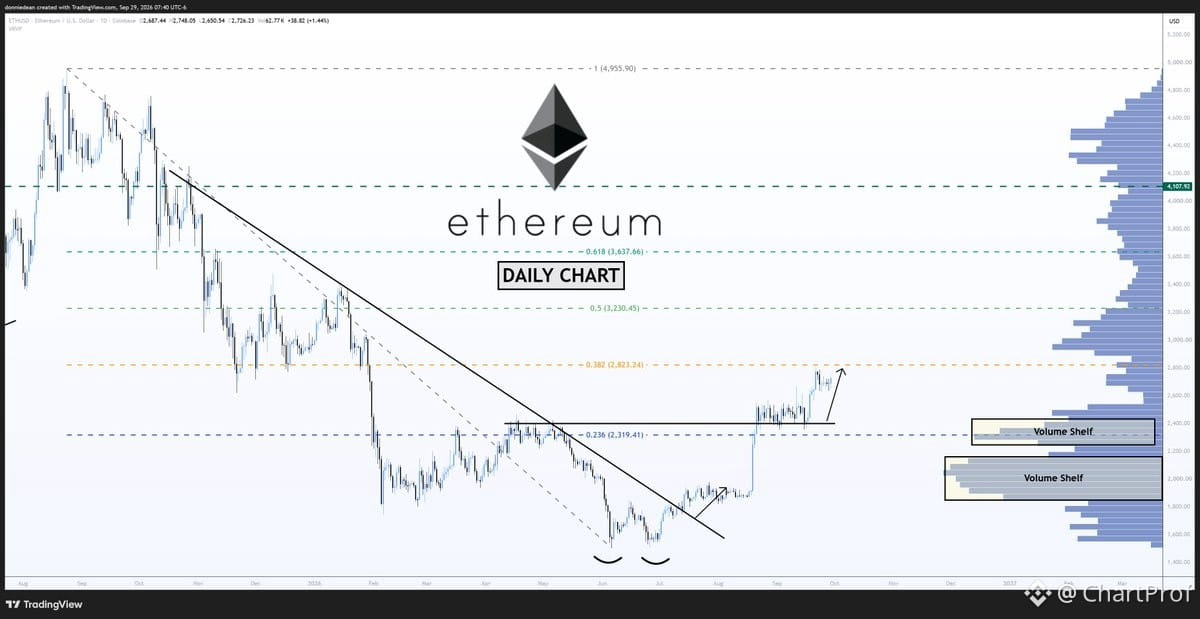
Структура $ETH тут проста — ми знаходимося під опором на рівні $2,823, це перше тестування. Це ваш найближчий рівень зверху. Якщо ціна проходить його з обсягом і утримує як підтримку під час ретесту, у вас є підтвердження дивитися вище.
Наступні цілі — $3,230 і $3,638. Рівень $3,230 означає рух на 18,6% від поточної ціни, тоді як $3,638 — розширення на 33,6%: обидві проєкції припускають, що ми спершу проб’ємо та закріпимося вище $2,823. Це не випадкові числа — це структурні цілі, що спираються на попередні зони опору та виміряні рухи.
Скасування просте: якщо $ETH не вдається на $2,823 і він втрачає локальний мінімум, сценарій відпадає. Ви торгуєте пробій, а не надію. Дочекайтеся, поки рівень проб’ється, підтвердіть переворот, а тоді вже керуйте ризиком. Ніяких припущень — хай графік покаже структуру, а тоді дійте.
Структура $ETH тут проста — ми знаходимося під опором на рівні $2,823, це перше тестування. Це ваш найближчий рівень зверху. Якщо ціна проходить його з обсягом і утримує як підтримку під час ретесту, у вас є підтвердження дивитися вище.
Наступні цілі — $3,230 і $3,638. Рівень $3,230 означає рух на 18,6% від поточної ціни, тоді як $3,638 — розширення на 33,6%: обидві проєкції припускають, що ми спершу проб’ємо та закріпимося вище $2,823. Це не випадкові числа — це структурні цілі, що спираються на попередні зони опору та виміряні рухи.
Скасування просте: якщо $ETH не вдається на $2,823 і він втрачає локальний мінімум, сценарій відпадає. Ви торгуєте пробій, а не надію. Дочекайтеся, поки рівень проб’ється, підтвердіть переворот, а тоді вже керуйте ризиком. Ніяких припущень — хай графік покаже структуру, а тоді дійте.
Наступні цілі — $3,230 і $3,638. Рівень $3,230 означає рух на 18,6% від поточної ціни, тоді як $3,638 — розширення на 33,6%: обидві проєкції припускають, що ми спершу проб’ємо та закріпимося вище $2,823. Це не випадкові числа — це структурні цілі, що спираються на попередні зони опору та виміряні рухи.
Скасування просте: якщо $ETH не вдається на $2,823 і він втрачає локальний мінімум, сценарій відпадає. Ви торгуєте пробій, а не надію. Дочекайтеся, поки рівень проб’ється, підтвердіть переворот, а тоді вже керуйте ризиком. Ніяких припущень — хай графік покаже структуру, а тоді дійте.
53
·
--
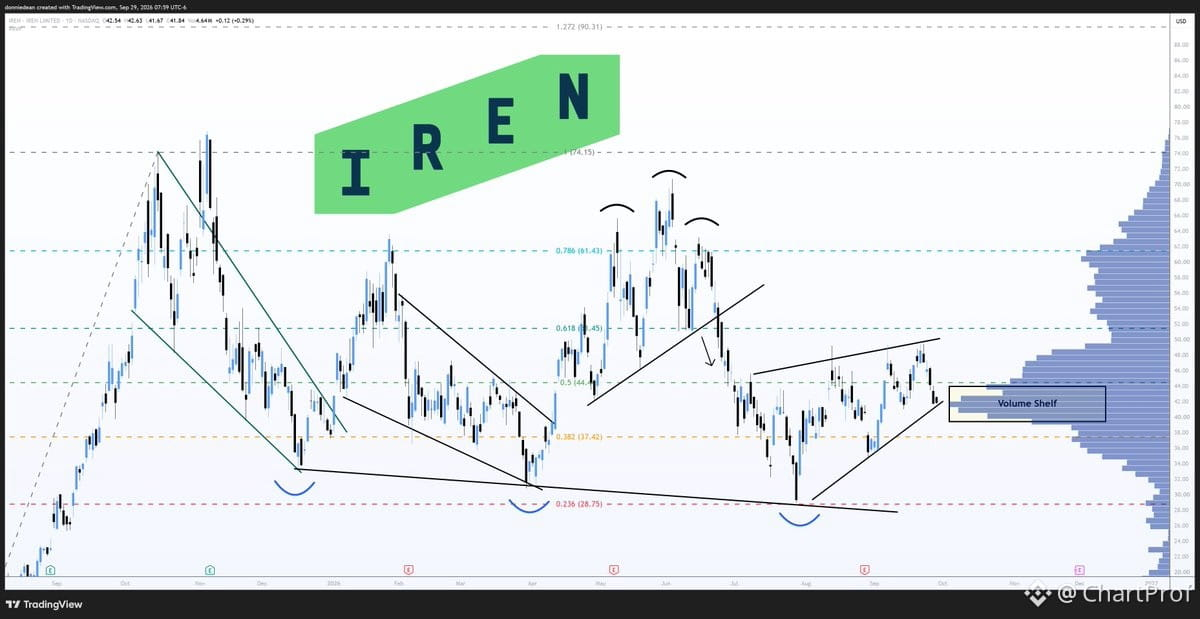
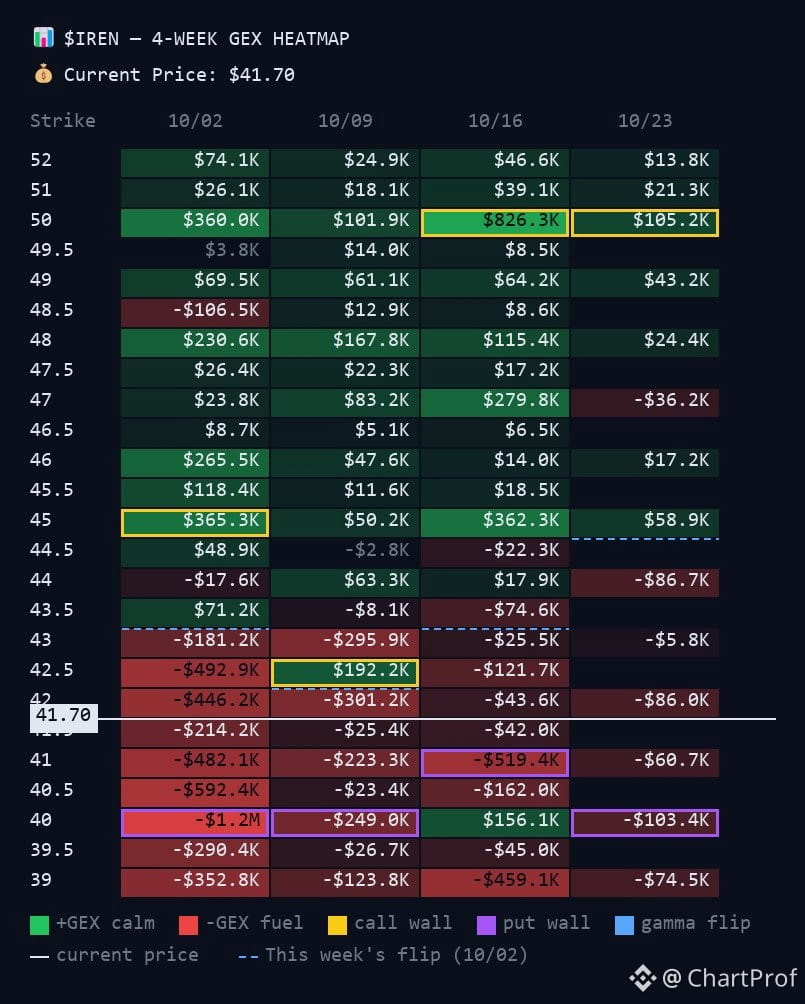
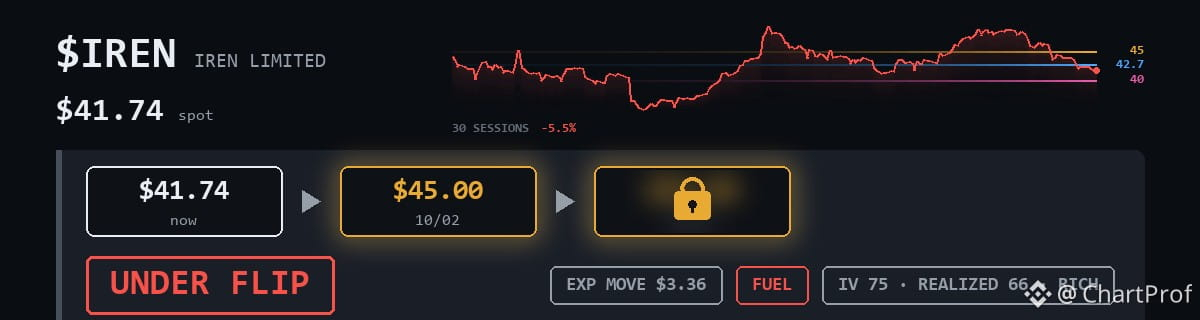
$IREN сидить прямо на полиці обсягу та зростаючій лінії тренду — класична опора з навчального прикладу.
Поточне: $41.74
Ціль: $45.00 до 10/2
Ось структура:
$40 — це твій фундамент/підлога. Саме там обсяг побудував основу. Поки ціна тримається вище, у тебе є структурна підтримка.
Зростаюча лінія тренду додає динамічну підтримку знизу. Коли ціна сидить і на полиці обсягу, і на лінії тренду, маємо конвергенцію — дві причини, чому покупці будуть захищати позиції.
Якщо $40 тримається, $45 — це перший логічний рівень опору. Це твоя перша зупинка.
Нівеляція проста: прорив нижче $40 — і сетап мертвий. Порушена полиця обсягу = немає фундаменту.
Чистий сетап. Підтримка у два шари. Чітка ціль. Чітка нівеляція. Ось як читається структура.
$IREN сидить прямо на полиці обсягу та зростаючій лінії тренду — класична опора з навчального прикладу.
Поточне: $41.74
Ціль: $45.00 до 10/2
Ось структура:
$40 — це твій фундамент/підлога. Саме там обсяг побудував основу. Поки ціна тримається вище, у тебе є структурна підтримка.
Зростаюча лінія тренду додає динамічну підтримку знизу. Коли ціна сидить і на полиці обсягу, і на лінії тренду, маємо конвергенцію — дві причини, чому покупці будуть захищати позиції.
Якщо $40 тримається, $45 — це перший логічний рівень опору. Це твоя перша зупинка.
Нівеляція проста: прорив нижче $40 — і сетап мертвий. Порушена полиця обсягу = немає фундаменту.
Чистий сетап. Підтримка у два шари. Чітка ціль. Чітка нівеляція. Ось як читається структура.
Поточне: $41.74
Ціль: $45.00 до 10/2
Ось структура:
$40 — це твій фундамент/підлога. Саме там обсяг побудував основу. Поки ціна тримається вище, у тебе є структурна підтримка.
Зростаюча лінія тренду додає динамічну підтримку знизу. Коли ціна сидить і на полиці обсягу, і на лінії тренду, маємо конвергенцію — дві причини, чому покупці будуть захищати позиції.
Якщо $40 тримається, $45 — це перший логічний рівень опору. Це твоя перша зупинка.
Нівеляція проста: прорив нижче $40 — і сетап мертвий. Порушена полиця обсягу = немає фундаменту.
Чистий сетап. Підтримка у два шари. Чітка ціль. Чітка нівеляція. Ось як читається структура.
98
·
--
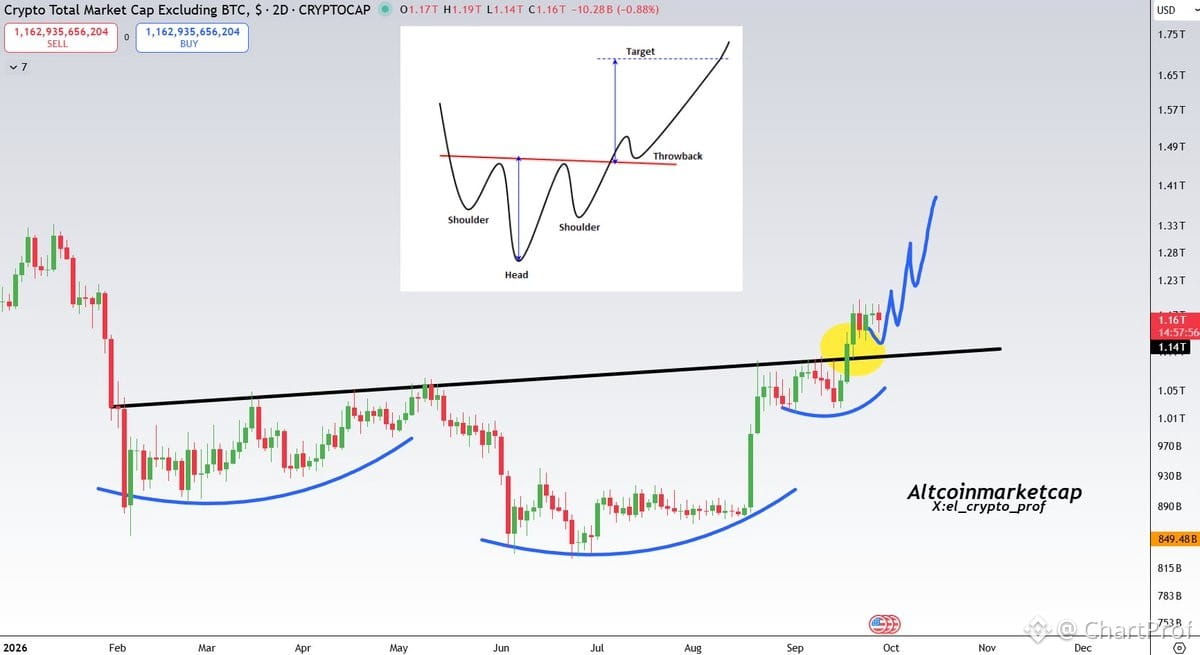
TOTAL2 (альтернативна капіталізація ринку альткоїнів) щойно прорвалася з 7-місячної інверсної моделі «голова і плечі» — класичної структури розвороту, яка сигналізує про значну зміну тренду.
Зараз ми в режимі консолідації та повторно тестуємо рівень прориву. Це класична поведінка після зламу патерну: ціні потрібно підтвердити підтримку там, де раніше була опір.
Що робить цей сетап таким чистим: формування патерну тривало 7 місяців, тож база надійна. Чим довше тримається база, тим сильнішим може бути потенціал прориву.
На що звернути увагу: доки TOTAL2 утримується вище лінії «шия» під час цього ретесту, структура залишається в силі. Якщо він поверне собі та утримає рівень, це буде вашим підтвердженням продовження руху вгору.
Нівелювання: чіткий злам назад нижче лінії «шия» з імпульсом руйнує цей сетап.
Сетапи для альтсезону не бувають набагато чистішими за цей. Ретест — це те, на що варто звернути увагу: не гнатися за початковим ривком, а дочекатися, поки структура доведе себе. Якщо він утримається, ми розглядаємо значно масштабніший рух по альтах.
TOTAL2 (альтернативна капіталізація ринку альткоїнів) щойно прорвалася з 7-місячної інверсної моделі «голова і плечі» — класичної структури розвороту, яка сигналізує про значну зміну тренду.
Зараз ми в режимі консолідації та повторно тестуємо рівень прориву. Це класична поведінка після зламу патерну: ціні потрібно підтвердити підтримку там, де раніше була опір.
Що робить цей сетап таким чистим: формування патерну тривало 7 місяців, тож база надійна. Чим довше тримається база, тим сильнішим може бути потенціал прориву.
На що звернути увагу: доки TOTAL2 утримується вище лінії «шия» під час цього ретесту, структура залишається в силі. Якщо він поверне собі та утримає рівень, це буде вашим підтвердженням продовження руху вгору.
Нівелювання: чіткий злам назад нижче лінії «шия» з імпульсом руйнує цей сетап.
Сетапи для альтсезону не бувають набагато чистішими за цей. Ретест — це те, на що варто звернути увагу: не гнатися за початковим ривком, а дочекатися, поки структура доведе себе. Якщо він утримається, ми розглядаємо значно масштабніший рух по альтах.
Зараз ми в режимі консолідації та повторно тестуємо рівень прориву. Це класична поведінка після зламу патерну: ціні потрібно підтвердити підтримку там, де раніше була опір.
Що робить цей сетап таким чистим: формування патерну тривало 7 місяців, тож база надійна. Чим довше тримається база, тим сильнішим може бути потенціал прориву.
На що звернути увагу: доки TOTAL2 утримується вище лінії «шия» під час цього ретесту, структура залишається в силі. Якщо він поверне собі та утримає рівень, це буде вашим підтвердженням продовження руху вгору.
Нівелювання: чіткий злам назад нижче лінії «шия» з імпульсом руйнує цей сетап.
Сетапи для альтсезону не бувають набагато чистішими за цей. Ретест — це те, на що варто звернути увагу: не гнатися за початковим ривком, а дочекатися, поки структура доведе себе. Якщо він утримається, ми розглядаємо значно масштабніший рух по альтах.
206
·
--
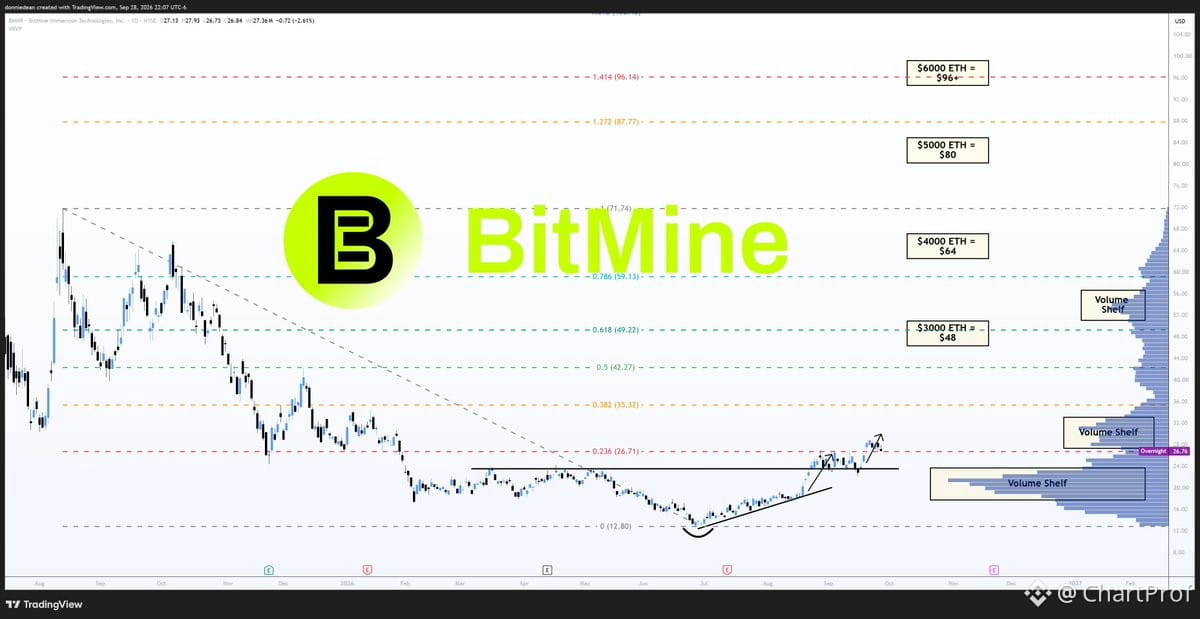
$BMNR trading at NAV — чиста структура, чиста теза.
BitMine торгується приблизно за ~$27/акцію, майже точно за чистою вартістю активів (0.99x mNAV). Це «підлога». Бичий сценарій: 1.6x NAV:
• $3K $ETH → $48
• $4K $ETH → $64
• $5K $ETH → $80
• $6K $ETH → $96+
Чому це важливо: Вони тримають 6M $ETH (4.9% від загального обсягу), 84% стейкано для дохідності (~$358M щорічно в еквіваленті). Безперервні щотижневі покупки з червня 2025. Активний buyback на $4B. Учасник Russell 1000.
Сценарій: Підлога NAV + $ETH-бета + дохідність від стейкінгу = асиметричний потенціал зростання, якщо $ETH піде вгору. Негатив обмежений балансовою вартістю скарбниці. Позитив масштабується разом із рухом ціни $ETH.
Підтвердження: $ETH утримує структуру вище ключової підтримки. Премія $BMNR розширюється, коли $ETH зростає.
Спростування: $ETH пробиває вниз, і премія схлопується назад нижче NAV.
Це важільний сценарій на $ETH із «подушкою» дохідності та відомою підлогою. Чистий ризик/винагорода, якщо ти дивишся на $ETH бичий.
$BMNR trading at NAV — чиста структура, чиста теза.
BitMine торгується приблизно за ~$27/акцію, майже точно за чистою вартістю активів (0.99x mNAV). Це «підлога». Бичий сценарій: 1.6x NAV:
• $3K $ETH → $48
• $4K $ETH → $64
• $5K $ETH → $80
• $6K $ETH → $96+
Чому це важливо: Вони тримають 6M $ETH (4.9% від загального обсягу), 84% стейкано для дохідності (~$358M щорічно в еквіваленті). Безперервні щотижневі покупки з червня 2025. Активний buyback на $4B. Учасник Russell 1000.
Сценарій: Підлога NAV + $ETH-бета + дохідність від стейкінгу = асиметричний потенціал зростання, якщо $ETH піде вгору. Негатив обмежений балансовою вартістю скарбниці. Позитив масштабується разом із рухом ціни $ETH.
Підтвердження: $ETH утримує структуру вище ключової підтримки. Премія $BMNR розширюється, коли $ETH зростає.
Спростування: $ETH пробиває вниз, і премія схлопується назад нижче NAV.
Це важільний сценарій на $ETH із «подушкою» дохідності та відомою підлогою. Чистий ризик/винагорода, якщо ти дивишся на $ETH бичий.
BitMine торгується приблизно за ~$27/акцію, майже точно за чистою вартістю активів (0.99x mNAV). Це «підлога». Бичий сценарій: 1.6x NAV:
• $3K $ETH → $48
• $4K $ETH → $64
• $5K $ETH → $80
• $6K $ETH → $96+
Чому це важливо: Вони тримають 6M $ETH (4.9% від загального обсягу), 84% стейкано для дохідності (~$358M щорічно в еквіваленті). Безперервні щотижневі покупки з червня 2025. Активний buyback на $4B. Учасник Russell 1000.
Сценарій: Підлога NAV + $ETH-бета + дохідність від стейкінгу = асиметричний потенціал зростання, якщо $ETH піде вгору. Негатив обмежений балансовою вартістю скарбниці. Позитив масштабується разом із рухом ціни $ETH.
Підтвердження: $ETH утримує структуру вище ключової підтримки. Премія $BMNR розширюється, коли $ETH зростає.
Спростування: $ETH пробиває вниз, і премія схлопується назад нижче NAV.
Це важільний сценарій на $ETH із «подушкою» дохідності та відомою підлогою. Чистий ризик/винагорода, якщо ти дивишся на $ETH бичий.
159
·
--
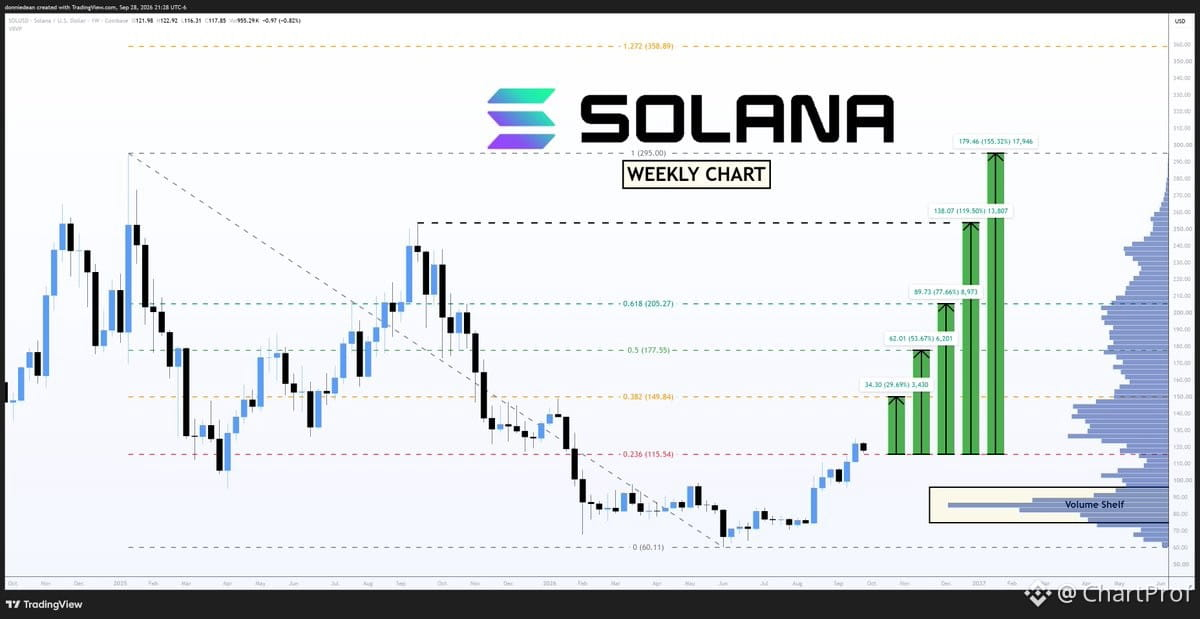
Тижневий графік по $SOL — давай розширимо погляд і окреслимо структуру.
Зараз ціна повільно «шліфує» рівень $115, намагаючись підтвердити його як підтримку. Це ключовий нижній «поріг» на цей момент. Якщо він втримується — у нас є база, з якої можна працювати. Якщо ж проб’ється — змінюється сценарій.
Наступний значущий опір розташований на $149.84 — це чіткий рух +29% від поточних рівнів. Це твоя ціль угору, якщо $115 утримується і наростає імпульс.
Торговий сетап тут доволі простий:
• Підтримка: $115 — має втриматися для бичачого продовження
• Ціль: $149.84 — наступний структурний опір
• Інвалідaція: Чистий пробій і закриття нижче $115
Це підручниковий рівень-до-рівня трейдинг. Ти стежиш за підтвердженням на підтримці, а потім цілешся в наступну зону опору. Ніяких припущень — лише читання рівнів, які показує графік.
Якщо $115 підтвердиться як підтримка з обсягом і структурою — шлях до $149 відкривається. Якщо ж ні — відступаєш убік і чекаєш наступний чистий сетап. Саме так ти залишаєшся синхронізованим із графіком.
Тижневий графік по $SOL — давай розширимо погляд і окреслимо структуру.
Зараз ціна повільно «шліфує» рівень $115, намагаючись підтвердити його як підтримку. Це ключовий нижній «поріг» на цей момент. Якщо він втримується — у нас є база, з якої можна працювати. Якщо ж проб’ється — змінюється сценарій.
Наступний значущий опір розташований на $149.84 — це чіткий рух +29% від поточних рівнів. Це твоя ціль угору, якщо $115 утримується і наростає імпульс.
Торговий сетап тут доволі простий:
• Підтримка: $115 — має втриматися для бичачого продовження
• Ціль: $149.84 — наступний структурний опір
• Інвалідaція: Чистий пробій і закриття нижче $115
Це підручниковий рівень-до-рівня трейдинг. Ти стежиш за підтвердженням на підтримці, а потім цілешся в наступну зону опору. Ніяких припущень — лише читання рівнів, які показує графік.
Якщо $115 підтвердиться як підтримка з обсягом і структурою — шлях до $149 відкривається. Якщо ж ні — відступаєш убік і чекаєш наступний чистий сетап. Саме так ти залишаєшся синхронізованим із графіком.
Зараз ціна повільно «шліфує» рівень $115, намагаючись підтвердити його як підтримку. Це ключовий нижній «поріг» на цей момент. Якщо він втримується — у нас є база, з якої можна працювати. Якщо ж проб’ється — змінюється сценарій.
Наступний значущий опір розташований на $149.84 — це чіткий рух +29% від поточних рівнів. Це твоя ціль угору, якщо $115 утримується і наростає імпульс.
Торговий сетап тут доволі простий:
• Підтримка: $115 — має втриматися для бичачого продовження
• Ціль: $149.84 — наступний структурний опір
• Інвалідaція: Чистий пробій і закриття нижче $115
Це підручниковий рівень-до-рівня трейдинг. Ти стежиш за підтвердженням на підтримці, а потім цілешся в наступну зону опору. Ніяких припущень — лише читання рівнів, які показує графік.
Якщо $115 підтвердиться як підтримка з обсягом і структурою — шлях до $149 відкривається. Якщо ж ні — відступаєш убік і чекаєш наступний чистий сетап. Саме так ти залишаєшся синхронізованим із графіком.
268
·
--
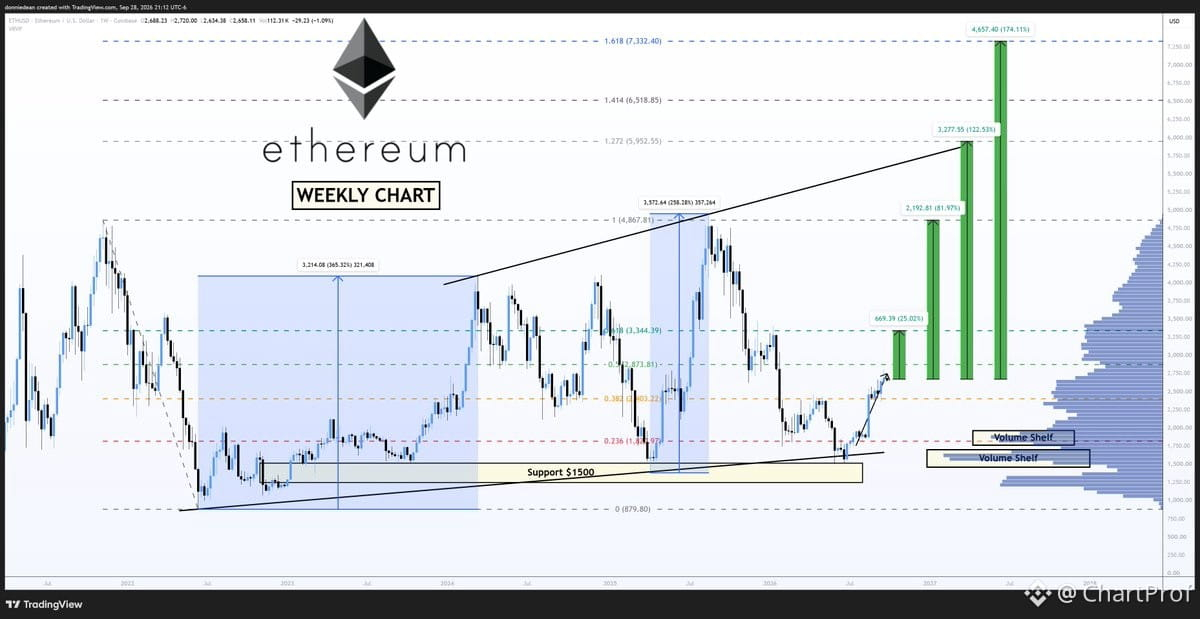
Давайте трохи віддалимось від $ETH і прочитаємо тижневу структуру — саме тут важлива перспектива.
У вас є три чіткі цілі за Фібоначчі, які окреслюють загальну картину:
$3,344 — відкат 0.618. Це ваша структурна підтримка, якщо буде відплив назад. Це не випадковість — саме там макро-розмах знаходить рівновагу. Якщо ціна тримається вище цього рівня, бичача структура залишається цілісною.
$4,867 — 100% розширення. Це перше завершення виміряного руху. Якщо ціна повертає цей рівень, це означає, що ми повністю відпрацювали попередню корекцію й підтвердили продовження. Це ваша базова ціль для наступного етапу.
$7,332 — розширення 1.618, «золоте» співвідношення. Це ваш підручниковий проєкційний рівень Фібоначчі для наступного великого імпульсу. Це не хопіум — це математика. Якщо імпульс зберігається й структура підтверджує, саме тут завершується свінг.
Ось що важливо: тижневі таймфрейми не обманюють. Ці рівні — не здогадки — вони виведені зі структури свінгу та геометрії Фібоначчі. 0.618 — це ваш «поріг недійсності» (invalidation). 100% — це підтвердження продовження. 1.618 — це ціль, якщо тренд розгортається далі.
Читайте графік як мапу. Знайте, де ви перебуваєте, де живе підтримка, і куди структура проєктує рух. Саме так ви торгуєте з упевненістю, а не реагуєте на шум.
Давайте трохи віддалимось від $ETH і прочитаємо тижневу структуру — саме тут важлива перспектива.
У вас є три чіткі цілі за Фібоначчі, які окреслюють загальну картину:
$3,344 — відкат 0.618. Це ваша структурна підтримка, якщо буде відплив назад. Це не випадковість — саме там макро-розмах знаходить рівновагу. Якщо ціна тримається вище цього рівня, бичача структура залишається цілісною.
$4,867 — 100% розширення. Це перше завершення виміряного руху. Якщо ціна повертає цей рівень, це означає, що ми повністю відпрацювали попередню корекцію й підтвердили продовження. Це ваша базова ціль для наступного етапу.
$7,332 — розширення 1.618, «золоте» співвідношення. Це ваш підручниковий проєкційний рівень Фібоначчі для наступного великого імпульсу. Це не хопіум — це математика. Якщо імпульс зберігається й структура підтверджує, саме тут завершується свінг.
Ось що важливо: тижневі таймфрейми не обманюють. Ці рівні — не здогадки — вони виведені зі структури свінгу та геометрії Фібоначчі. 0.618 — це ваш «поріг недійсності» (invalidation). 100% — це підтвердження продовження. 1.618 — це ціль, якщо тренд розгортається далі.
Читайте графік як мапу. Знайте, де ви перебуваєте, де живе підтримка, і куди структура проєктує рух. Саме так ви торгуєте з упевненістю, а не реагуєте на шум.
У вас є три чіткі цілі за Фібоначчі, які окреслюють загальну картину:
$3,344 — відкат 0.618. Це ваша структурна підтримка, якщо буде відплив назад. Це не випадковість — саме там макро-розмах знаходить рівновагу. Якщо ціна тримається вище цього рівня, бичача структура залишається цілісною.
$4,867 — 100% розширення. Це перше завершення виміряного руху. Якщо ціна повертає цей рівень, це означає, що ми повністю відпрацювали попередню корекцію й підтвердили продовження. Це ваша базова ціль для наступного етапу.
$7,332 — розширення 1.618, «золоте» співвідношення. Це ваш підручниковий проєкційний рівень Фібоначчі для наступного великого імпульсу. Це не хопіум — це математика. Якщо імпульс зберігається й структура підтверджує, саме тут завершується свінг.
Ось що важливо: тижневі таймфрейми не обманюють. Ці рівні — не здогадки — вони виведені зі структури свінгу та геометрії Фібоначчі. 0.618 — це ваш «поріг недійсності» (invalidation). 100% — це підтвердження продовження. 1.618 — це ціль, якщо тренд розгортається далі.
Читайте графік як мапу. Знайте, де ви перебуваєте, де живе підтримка, і куди структура проєктує рух. Саме так ви торгуєте з упевненістю, а не реагуєте на шум.
176
·
--
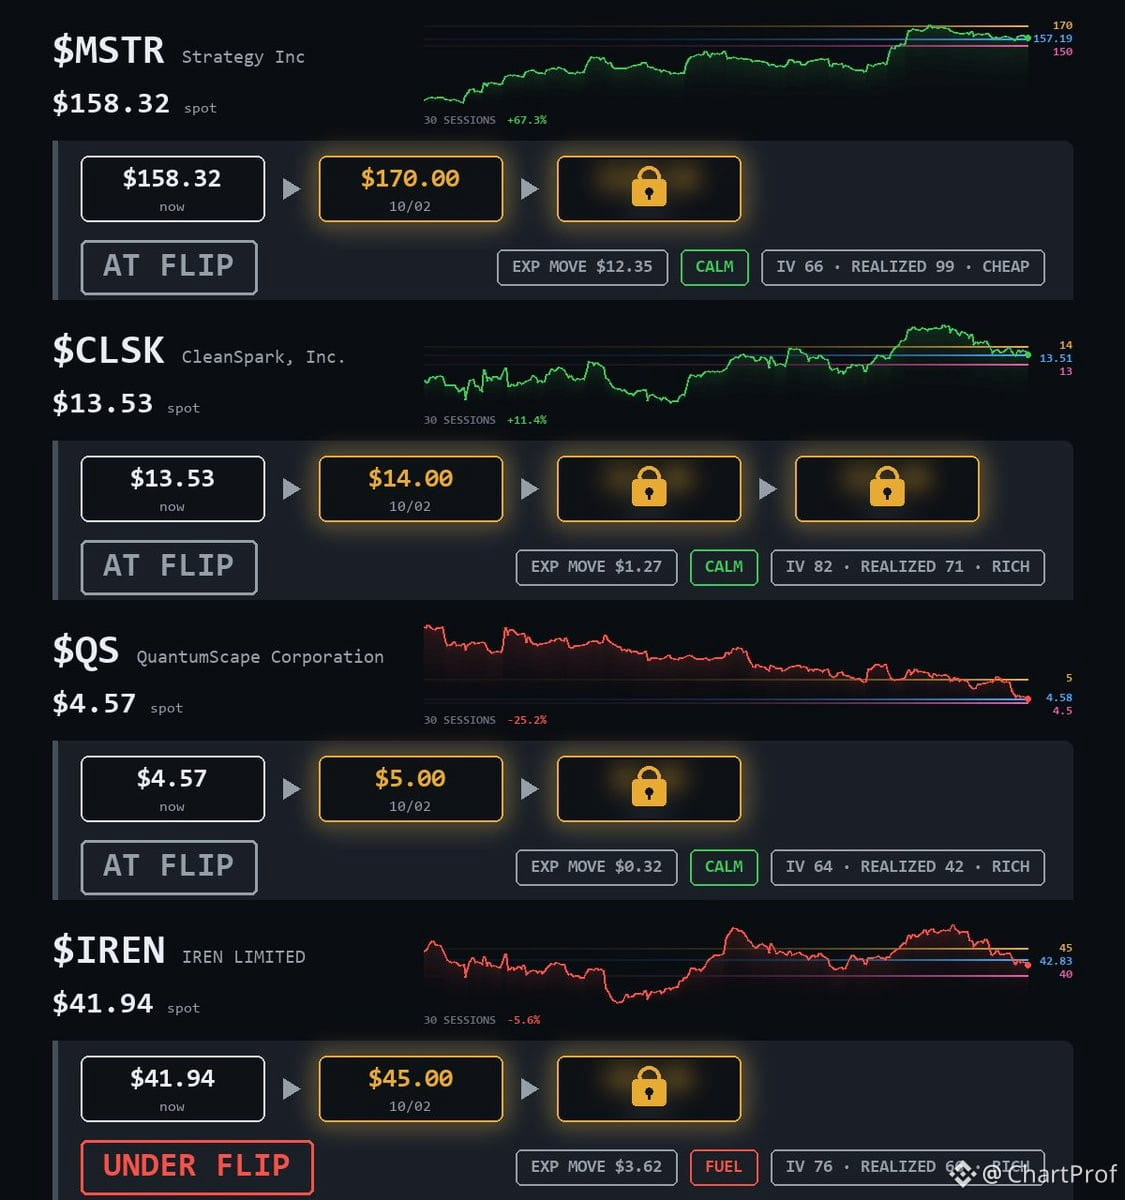
Налаштування на понеділок в одному місці.
$MSTR перевернувся — спостерігаю $170 над головою. Це стеля. Вище неї відкривається структура. Нижче перевороту ти знову в межах діапазону.
$CLSK перевернувся всередині коридору $13–$14. Чистий діапазон. Торгуй межі або чекай пробою. Коробка — це структура, доки вона не перестане нею бути.
$QS перевернувся так, що $4.50 лежить зовсім під ним як підтримка. Це твоя підлога. Тримай її — і все нормально. Втрачаєш — сетап недійсний.
$IREN під фліпом $42.83. $45 — стеля зверху, $40 — підлога знизу. Ти посередині — без торгів, доки він не обере сторону.
Повний розбір у постах на понеділок. Це твої рівні. Знай, де ти всередині, а де — вже поза.
Налаштування на понеділок в одному місці.
$MSTR перевернувся — спостерігаю $170 над головою. Це стеля. Вище неї відкривається структура. Нижче перевороту ти знову в межах діапазону.
$CLSK перевернувся всередині коридору $13–$14. Чистий діапазон. Торгуй межі або чекай пробою. Коробка — це структура, доки вона не перестане нею бути.
$QS перевернувся так, що $4.50 лежить зовсім під ним як підтримка. Це твоя підлога. Тримай її — і все нормально. Втрачаєш — сетап недійсний.
$IREN під фліпом $42.83. $45 — стеля зверху, $40 — підлога знизу. Ти посередині — без торгів, доки він не обере сторону.
Повний розбір у постах на понеділок. Це твої рівні. Знай, де ти всередині, а де — вже поза.
$MSTR перевернувся — спостерігаю $170 над головою. Це стеля. Вище неї відкривається структура. Нижче перевороту ти знову в межах діапазону.
$CLSK перевернувся всередині коридору $13–$14. Чистий діапазон. Торгуй межі або чекай пробою. Коробка — це структура, доки вона не перестане нею бути.
$QS перевернувся так, що $4.50 лежить зовсім під ним як підтримка. Це твоя підлога. Тримай її — і все нормально. Втрачаєш — сетап недійсний.
$IREN під фліпом $42.83. $45 — стеля зверху, $40 — підлога знизу. Ти посередині — без торгів, доки він не обере сторону.
Повний розбір у постах на понеділок. Це твої рівні. Знай, де ти всередині, а де — вже поза.
38
·
--
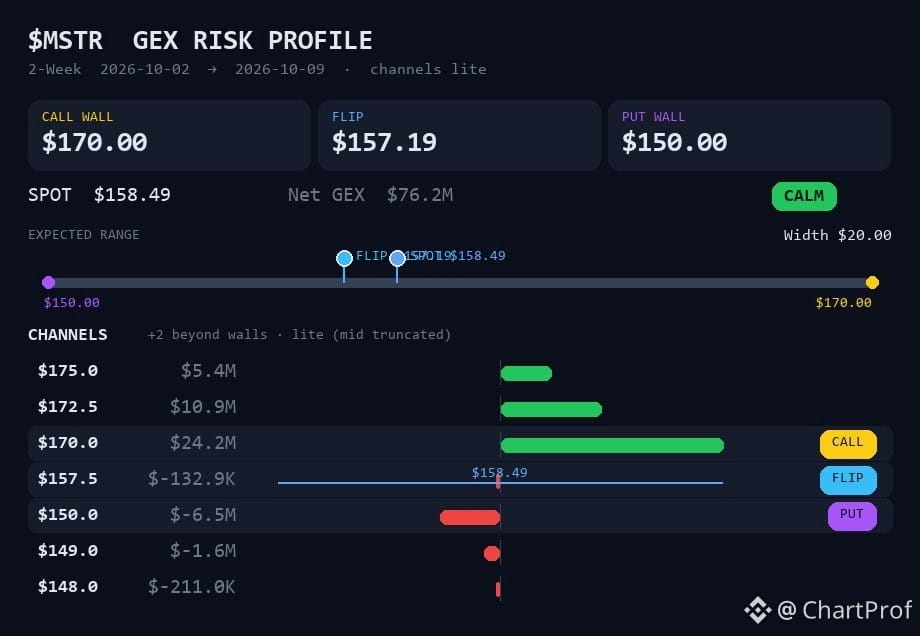
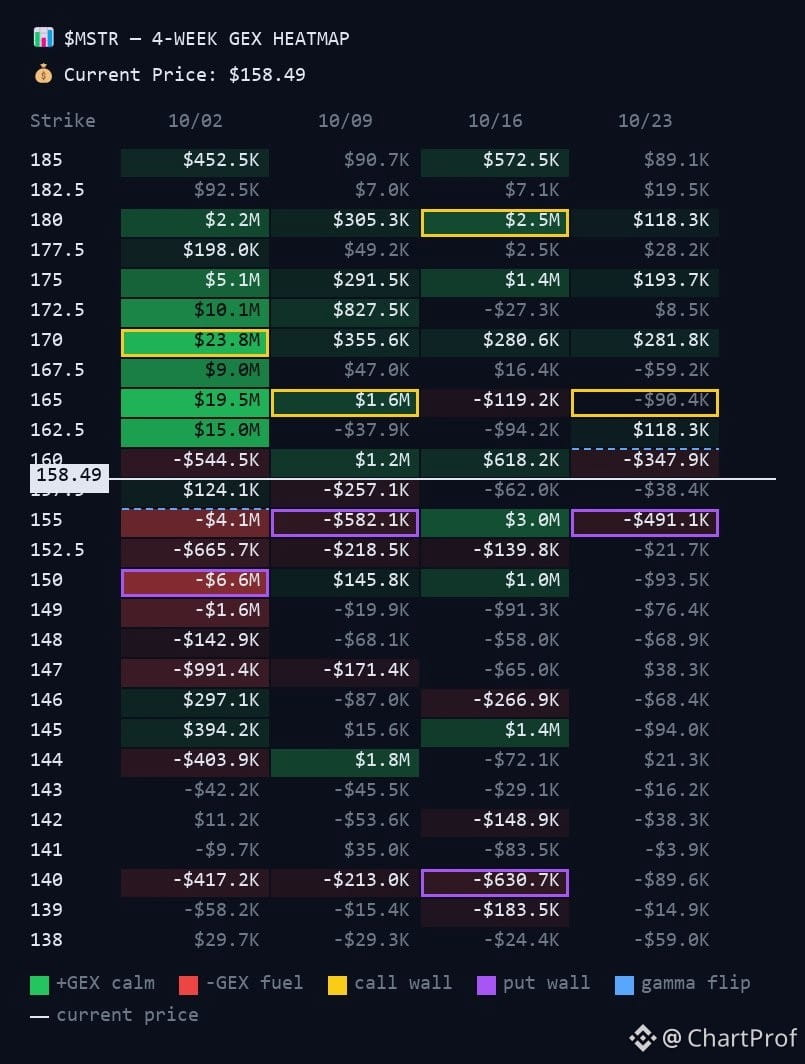
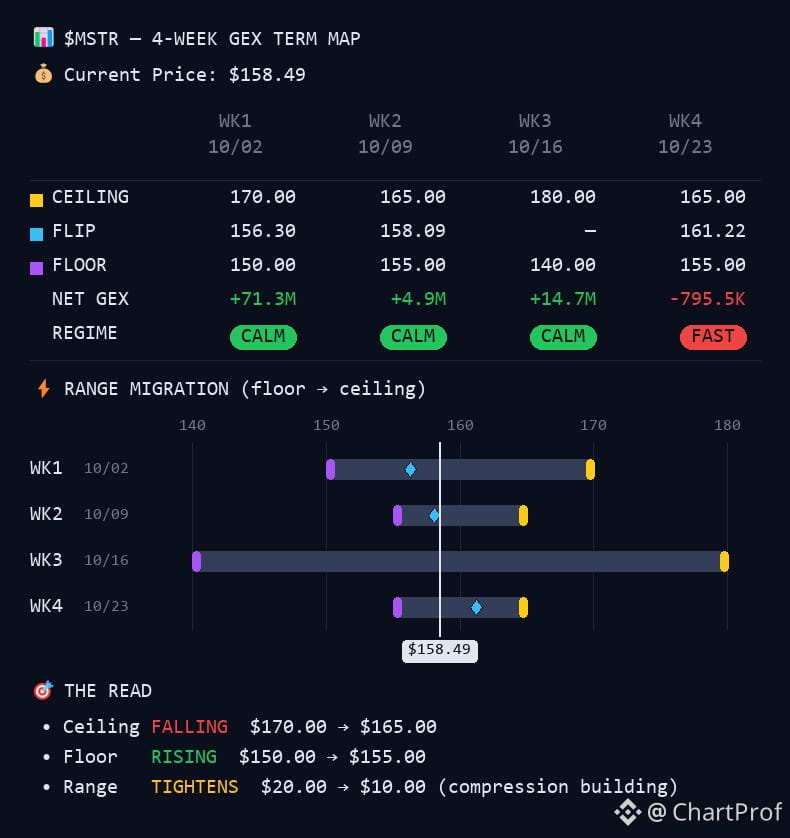
$MSTR сидить на 158.49, прямо над гамма-переворотом на 157.19. Давайте розберемося, що це означає і чому це важливо.
Переворот — це місце, де змінюється поведінка хеджування з боку дилерів. Вище перевороту маркетмейкери хеджують так, що приглушує волатильність — рухи зазвичай спокійніші. Нижче нього їхнє хеджування посилює рухи — ціна може сильніше розтягуватися в будь-якому напрямку.
Зараз ціна лише на 1.30 пункту вище за переворот. Це тонкий запас. Сам переворот зрушив нижче з 158.21 раніше, тож структура стискається.
Ваші межі:
- Call wall (стіна кол-опціонів) на 170: найважчий call-страйк, де хеджування дилерів «працює проти» ралі. Це ваш стеля.
- Put wall (стіна пут-опціонів) на 150: найважчий put-страйк, де хеджування підтримує зниження. Це ваш підлога.
Отже, діапазон — 150–170, а переворот на 157.19 є опорою всередині цього діапазону.
Сценарій:
Тримайтеся вище 157.19 → очікуйте спокійніші, обмежені рамками рухи в межах 150–170.
Втратили 157.19 → очікуйте ширші й швидші рухи, імовірно в бік підлоги на 150.
157.19 — це ваша межа. Слідкуйте, як ціна її поважає. Це підкаже, чи дилери приглушують, чи посилюють наступний рух.
$MSTR сидить на 158.49, прямо над гамма-переворотом на 157.19. Давайте розберемося, що це означає і чому це важливо.
Переворот — це місце, де змінюється поведінка хеджування з боку дилерів. Вище перевороту маркетмейкери хеджують так, що приглушує волатильність — рухи зазвичай спокійніші. Нижче нього їхнє хеджування посилює рухи — ціна може сильніше розтягуватися в будь-якому напрямку.
Зараз ціна лише на 1.30 пункту вище за переворот. Це тонкий запас. Сам переворот зрушив нижче з 158.21 раніше, тож структура стискається.
Ваші межі:
- Call wall (стіна кол-опціонів) на 170: найважчий call-страйк, де хеджування дилерів «працює проти» ралі. Це ваш стеля.
- Put wall (стіна пут-опціонів) на 150: найважчий put-страйк, де хеджування підтримує зниження. Це ваш підлога.
Отже, діапазон — 150–170, а переворот на 157.19 є опорою всередині цього діапазону.
Сценарій:
Тримайтеся вище 157.19 → очікуйте спокійніші, обмежені рамками рухи в межах 150–170.
Втратили 157.19 → очікуйте ширші й швидші рухи, імовірно в бік підлоги на 150.
157.19 — це ваша межа. Слідкуйте, як ціна її поважає. Це підкаже, чи дилери приглушують, чи посилюють наступний рух.
Переворот — це місце, де змінюється поведінка хеджування з боку дилерів. Вище перевороту маркетмейкери хеджують так, що приглушує волатильність — рухи зазвичай спокійніші. Нижче нього їхнє хеджування посилює рухи — ціна може сильніше розтягуватися в будь-якому напрямку.
Зараз ціна лише на 1.30 пункту вище за переворот. Це тонкий запас. Сам переворот зрушив нижче з 158.21 раніше, тож структура стискається.
Ваші межі:
- Call wall (стіна кол-опціонів) на 170: найважчий call-страйк, де хеджування дилерів «працює проти» ралі. Це ваш стеля.
- Put wall (стіна пут-опціонів) на 150: найважчий put-страйк, де хеджування підтримує зниження. Це ваш підлога.
Отже, діапазон — 150–170, а переворот на 157.19 є опорою всередині цього діапазону.
Сценарій:
Тримайтеся вище 157.19 → очікуйте спокійніші, обмежені рамками рухи в межах 150–170.
Втратили 157.19 → очікуйте ширші й швидші рухи, імовірно в бік підлоги на 150.
157.19 — це ваша межа. Слідкуйте, як ціна її поважає. Це підкаже, чи дилери приглушують, чи посилюють наступний рух.
60
·
--
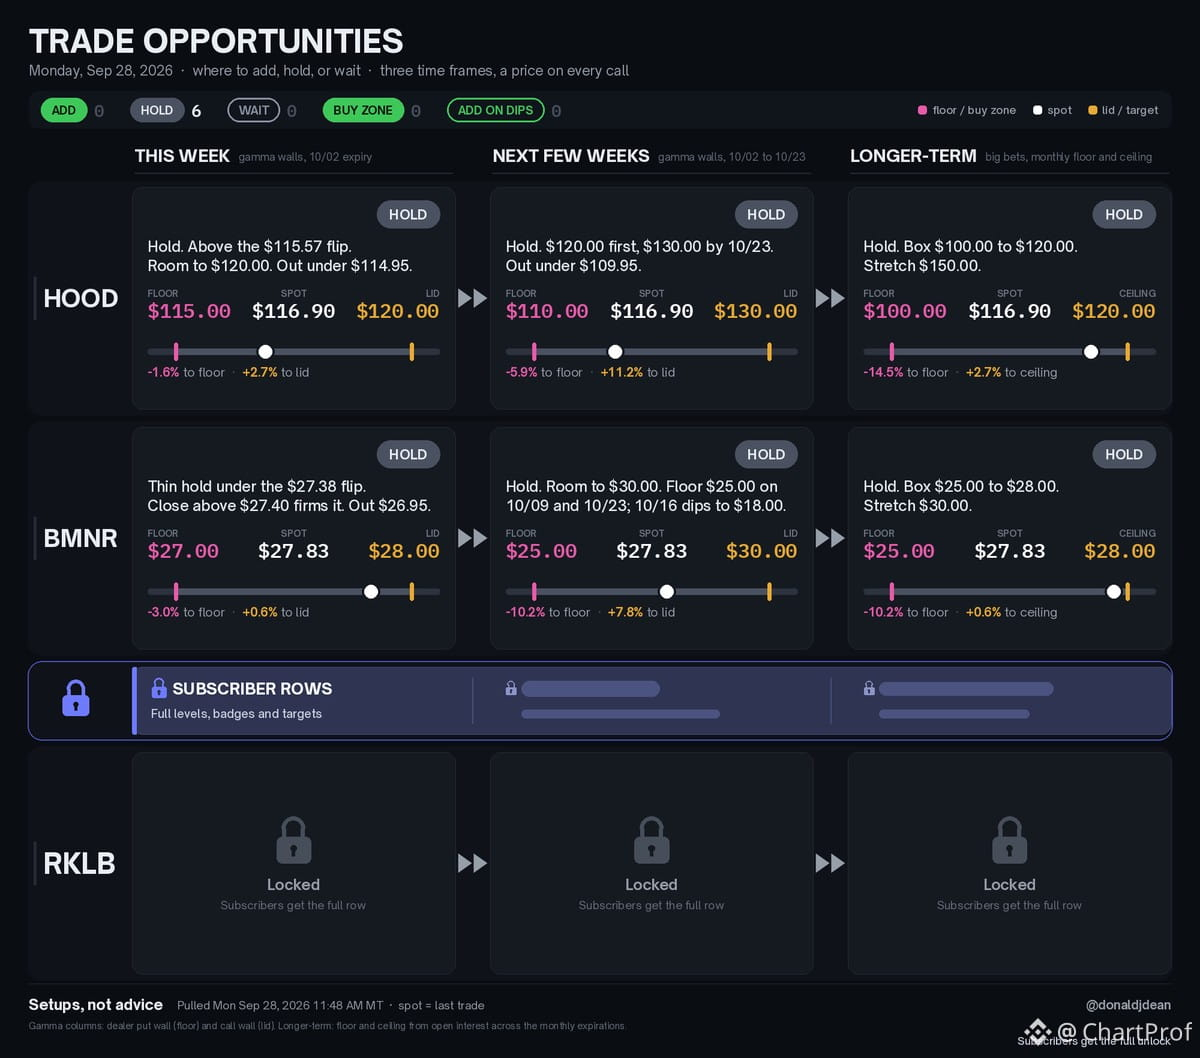
Понедільна дошка — усі рівні тримаються, нових входів немає.
$HOOD сидить на $116.90, вище pivot $115.57. Структура відкриває $120 цього тижня, $130 до 10/23, якщо утримується. Недійсність — чисте падіння нижче $114.95.
$BMNR тонкий на $27.83. Потрібне закриття вище $27.40, щоб зміцнити утримання. Вихід — нижче $26.95. Є простір до $30 протягом найближчих кількох тижнів, якщо буде кооперуватися.
Жодних покупок не позначено. Чекайте на налаштування, щоб вони підтягнулися.
Понедільна дошка — усі рівні тримаються, нових входів немає.
$HOOD сидить на $116.90, вище pivot $115.57. Структура відкриває $120 цього тижня, $130 до 10/23, якщо утримується. Недійсність — чисте падіння нижче $114.95.
$BMNR тонкий на $27.83. Потрібне закриття вище $27.40, щоб зміцнити утримання. Вихід — нижче $26.95. Є простір до $30 протягом найближчих кількох тижнів, якщо буде кооперуватися.
Жодних покупок не позначено. Чекайте на налаштування, щоб вони підтягнулися.
$HOOD сидить на $116.90, вище pivot $115.57. Структура відкриває $120 цього тижня, $130 до 10/23, якщо утримується. Недійсність — чисте падіння нижче $114.95.
$BMNR тонкий на $27.83. Потрібне закриття вище $27.40, щоб зміцнити утримання. Вихід — нижче $26.95. Є простір до $30 протягом найближчих кількох тижнів, якщо буде кооперуватися.
Жодних покупок не позначено. Чекайте на налаштування, щоб вони підтягнулися.
41
·
--
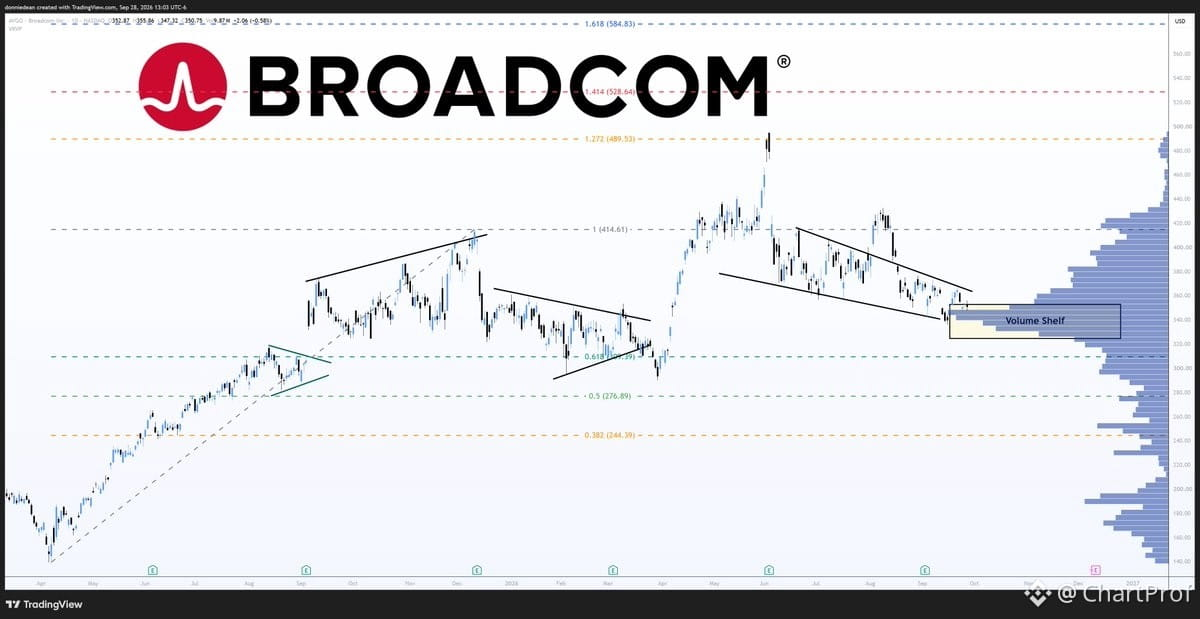
$AVGO сидить на $351 — трохи вище $350 «put»-стіни, яка тут виступає підлогою.
Перший опір — $360 на стороні call. Якщо проб’єте її чисто, ваш погляд буде на $375, який виступає стелею до 9 жовтня.
Скасування просте: втрачайте $350 — і сетап ламається. Структурно ми все ще всередині широкого діапазону $300–$400, тож по суті це перевірка нижньої межі короткострокового діапазону.
Слідкуйте за $350 як підтримкою, $360 — як першим рівнем пробою та $375 — як наступною логічною ціллю, якщо імпульс продовжиться.
$AVGO сидить на $351 — трохи вище $350 «put»-стіни, яка тут виступає підлогою.
Перший опір — $360 на стороні call. Якщо проб’єте її чисто, ваш погляд буде на $375, який виступає стелею до 9 жовтня.
Скасування просте: втрачайте $350 — і сетап ламається. Структурно ми все ще всередині широкого діапазону $300–$400, тож по суті це перевірка нижньої межі короткострокового діапазону.
Слідкуйте за $350 як підтримкою, $360 — як першим рівнем пробою та $375 — як наступною логічною ціллю, якщо імпульс продовжиться.
Перший опір — $360 на стороні call. Якщо проб’єте її чисто, ваш погляд буде на $375, який виступає стелею до 9 жовтня.
Скасування просте: втрачайте $350 — і сетап ламається. Структурно ми все ще всередині широкого діапазону $300–$400, тож по суті це перевірка нижньої межі короткострокового діапазону.
Слідкуйте за $350 як підтримкою, $360 — як першим рівнем пробою та $375 — як наступною логічною ціллю, якщо імпульс продовжиться.
39
·
--
Щойно вийшли нові дані FINRA по коротких позиціях (розрахункові 15/09), і кілька імен сильно змістилися. Давайте розберемося, що саме змінилося і що це означає структурно.
$BETR тепер на вершині мого списку спостереження за «сікзом». Кількість днів для покриття майже подвоїлася — з 4,21 до 7,85 — а шорти тримають приблизно 52% флоута. Це щільна конфігурація. Якщо ціна піде вперед і обсяги залишаться нормальними, шортам потрібно майже вісім днів, щоб вийти. Це паливо, а не угода як така, але воно вже на дошці.
$QS також показав майже подвійне зростання днів для покриття — з 5,34 до 10,47. При цьому сама коротка заборгованість майже не змінилася, тож це історія про обсяги. Тепер шортам потрібно близько десяти днів середнього обсягу, щоб розвантажитися. Це довгий вихід, якщо імпульс підключиться.
$ASST короткі позиції зросли приблизно на 21%. Тепер шорти тримають близько 27,6% флоута, тоді як раніше було 22,8%. Не екстремально, але рух важливий — більше впевненості з боку шортів, або більше «в пастці», якщо воно рвоне.
$CYPH короткі позиції зросли приблизно на 43,5% з моменту попереднього звіту. Це різке збільшення. Слідкуйте, як ціна торгується, коли підходить до рівня опору.
$WYFI все ще тримається близько 50% флоута в шортах. Значних змін немає, але це все ще «згорнута пружина», якщо спрацює правильний каталізатор.
$GME пішов у протилежний бік. Короткі позиції впали приблизно на 31,4%, а дні для покриття знизилися з 9,72 до 4,29. Шорти покриваються. Це зменшує частину «пального» для стиснення, принаймні наразі.
Ось навчальний момент: висока коротка заборгованість — це не сигнал на купівлю. Вона показує, де саме «паливо» сидить, якщо ціна почне рухатися. Але вам потрібен каталізатор, технічна структура та підтвердження. Це мапа, а не угода.
Щойно вийшли нові дані FINRA по коротких позиціях (розрахункові 15/09), і кілька імен сильно змістилися. Давайте розберемося, що саме змінилося і що це означає структурно.
$BETR тепер на вершині мого списку спостереження за «сікзом». Кількість днів для покриття майже подвоїлася — з 4,21 до 7,85 — а шорти тримають приблизно 52% флоута. Це щільна конфігурація. Якщо ціна піде вперед і обсяги залишаться нормальними, шортам потрібно майже вісім днів, щоб вийти. Це паливо, а не угода як така, але воно вже на дошці.
$QS також показав майже подвійне зростання днів для покриття — з 5,34 до 10,47. При цьому сама коротка заборгованість майже не змінилася, тож це історія про обсяги. Тепер шортам потрібно близько десяти днів середнього обсягу, щоб розвантажитися. Це довгий вихід, якщо імпульс підключиться.
$ASST короткі позиції зросли приблизно на 21%. Тепер шорти тримають близько 27,6% флоута, тоді як раніше було 22,8%. Не екстремально, але рух важливий — більше впевненості з боку шортів, або більше «в пастці», якщо воно рвоне.
$CYPH короткі позиції зросли приблизно на 43,5% з моменту попереднього звіту. Це різке збільшення. Слідкуйте, як ціна торгується, коли підходить до рівня опору.
$WYFI все ще тримається близько 50% флоута в шортах. Значних змін немає, але це все ще «згорнута пружина», якщо спрацює правильний каталізатор.
$GME пішов у протилежний бік. Короткі позиції впали приблизно на 31,4%, а дні для покриття знизилися з 9,72 до 4,29. Шорти покриваються. Це зменшує частину «пального» для стиснення, принаймні наразі.
Ось навчальний момент: висока коротка заборгованість — це не сигнал на купівлю. Вона показує, де саме «паливо» сидить, якщо ціна почне рухатися. Але вам потрібен каталізатор, технічна структура та підтвердження. Це мапа, а не угода.
$BETR тепер на вершині мого списку спостереження за «сікзом». Кількість днів для покриття майже подвоїлася — з 4,21 до 7,85 — а шорти тримають приблизно 52% флоута. Це щільна конфігурація. Якщо ціна піде вперед і обсяги залишаться нормальними, шортам потрібно майже вісім днів, щоб вийти. Це паливо, а не угода як така, але воно вже на дошці.
$QS також показав майже подвійне зростання днів для покриття — з 5,34 до 10,47. При цьому сама коротка заборгованість майже не змінилася, тож це історія про обсяги. Тепер шортам потрібно близько десяти днів середнього обсягу, щоб розвантажитися. Це довгий вихід, якщо імпульс підключиться.
$ASST короткі позиції зросли приблизно на 21%. Тепер шорти тримають близько 27,6% флоута, тоді як раніше було 22,8%. Не екстремально, але рух важливий — більше впевненості з боку шортів, або більше «в пастці», якщо воно рвоне.
$CYPH короткі позиції зросли приблизно на 43,5% з моменту попереднього звіту. Це різке збільшення. Слідкуйте, як ціна торгується, коли підходить до рівня опору.
$WYFI все ще тримається близько 50% флоута в шортах. Значних змін немає, але це все ще «згорнута пружина», якщо спрацює правильний каталізатор.
$GME пішов у протилежний бік. Короткі позиції впали приблизно на 31,4%, а дні для покриття знизилися з 9,72 до 4,29. Шорти покриваються. Це зменшує частину «пального» для стиснення, принаймні наразі.
Ось навчальний момент: висока коротка заборгованість — це не сигнал на купівлю. Вона показує, де саме «паливо» сидить, якщо ціна почне рухатися. Але вам потрібен каталізатор, технічна структура та підтвердження. Це мапа, а не угода.
26
Увійдіть, щоб переглянути інший контент
Приєднуйтесь до користувачів криптовалют по всьому світу на Binance Square
⚡️ Отримуйте актуальну та корисну інформацію про криптовалюти.
💬 Приєднуйтесь до найбільшої у світі криптобіржі.
👍 Відкрийте справжні ідеї від перевірених авторів.
Електронна пошта / номер телефону