
Joao Wedson
108 Публікації

Joao Wedson
Поскаржитись
Заблокувати користувача
💎Founder & CEO of @Alphractal
🏅Verified Author at CoinMarketCap & CryptoQuant
⚙ MSc in Data Science & AI
🦾Engineer in Robotics & Automation
₿itcoin OG
0 Підписки
4 Підписники
11 Вподобань
Публікації
·
--
Переглянути переклад
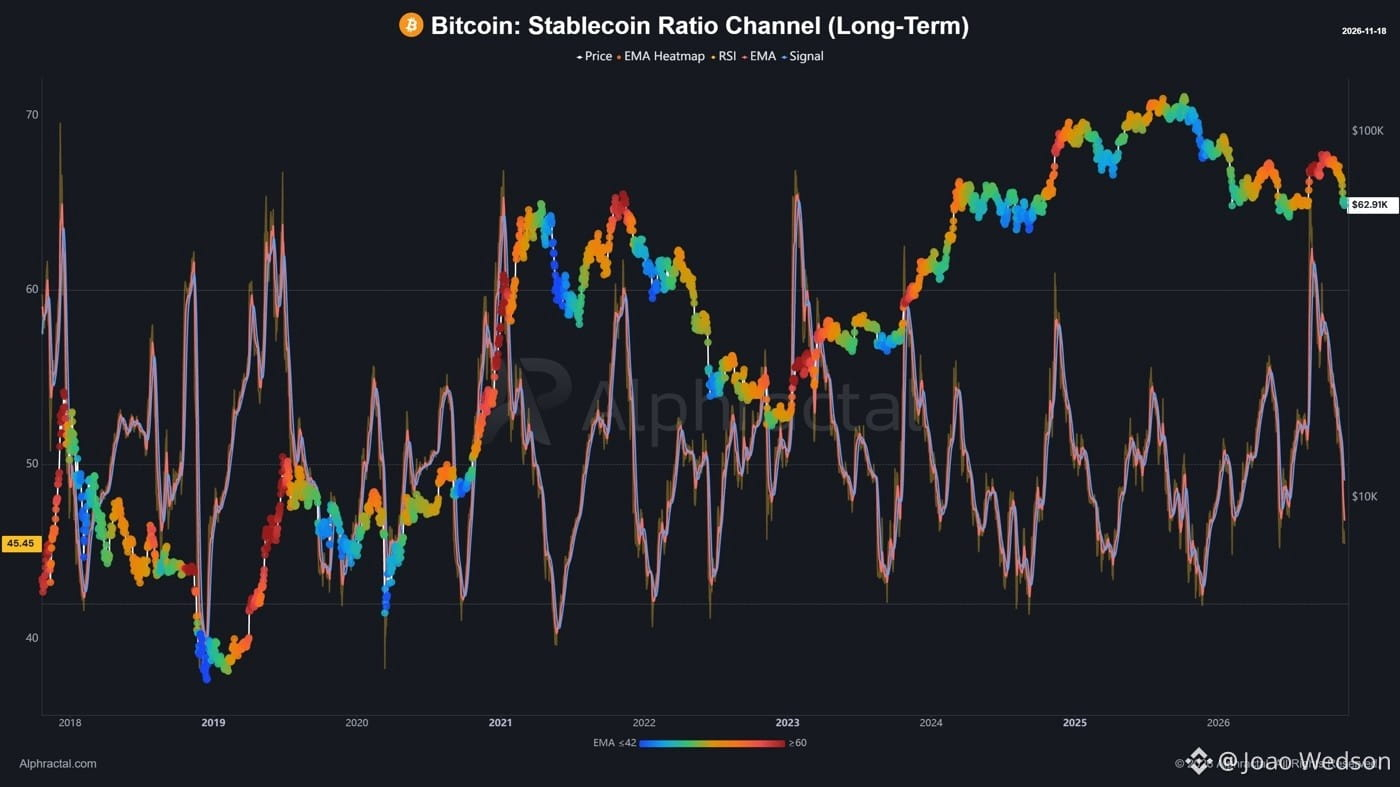
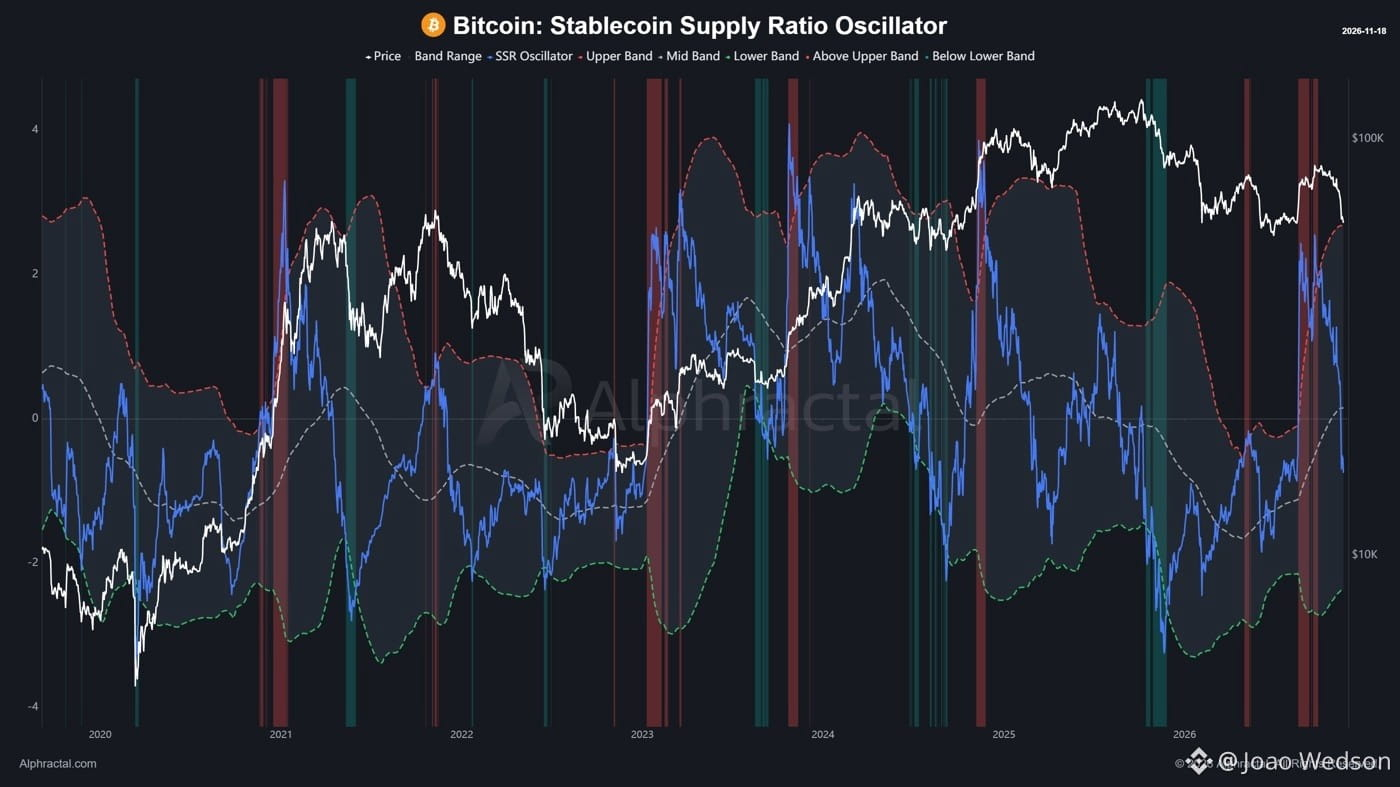
Bitcoin Liquidity: Stablecoins Are a Key Signal to Watch! The Bitcoin Stablecoin Supply Ratio Oscillator is declining, but it has yet to confirm a positive signal. A stronger shift in liquidity conditions may still take time. This metric measures Bitcoin's market capitalization relative to stablecoin supply, helping identify changes in potential buying power and liquidity conditions. Stablecoins play a crucial role in crypto market liquidity, and understanding their relative buying power is essential in the current market environment. At Alphractal, we provide advanced metrics to help you monitor liquidity, identify market shifts, and make data-driven decisions. BLACK FRIDAY STARTS EARLY! Get 70% OFF with coupon BLACK70. Explore Alphractal's extensive range of metrics and start your analysis today. 🚀alphractal.com
Bitcoin Liquidity: Stablecoins Are a Key Signal to Watch! The Bitcoin Stablecoin Supply Ratio Oscillator is declining, but it has yet to confirm a positive signal. A stronger shift in liquidity conditions may still take time. This metric measures Bitcoin's market capitalization relative to stablecoin supply, helping identify changes in potential buying power and liquidity conditions. Stablecoins play a crucial role in crypto market liquidity, and understanding their relative buying power is essential in the current market environment. At Alphractal, we provide advanced metrics to help you monitor liquidity, identify market shifts, and make data-driven decisions. BLACK FRIDAY STARTS EARLY! Get 70% OFF with coupon BLACK70. Explore Alphractal's extensive range of metrics and start your analysis today. 🚀alphractal.com
59
·
--
Переглянути переклад
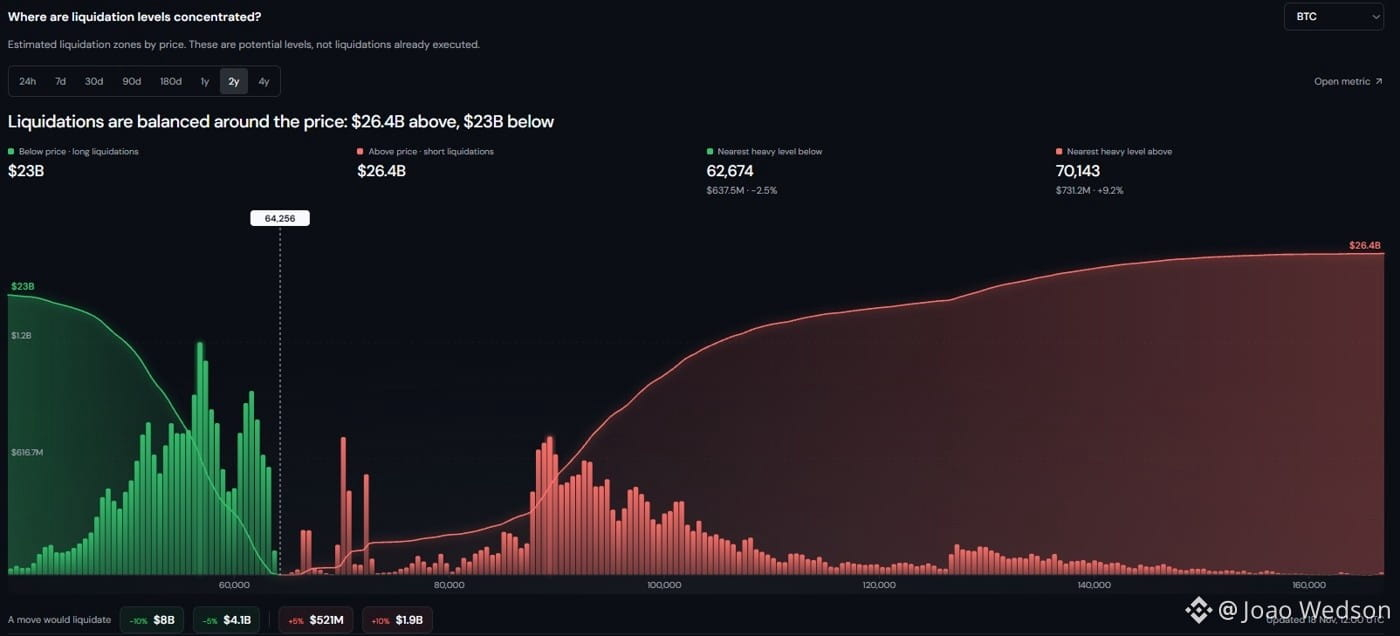
🚨 BITCOIN: WHERE ARE LEVERAGED TRADERS MOST VULNERABLE? Over the past 2 years, an estimated $49.4 billion in potential BTC liquidations have accumulated across the market. However, the real imbalance becomes clear when we analyze liquidation exposure near the current price. 📉 A 5% drop: $4.1B in potential long liquidations. 📈 A 5% rally: Just $521M in potential short liquidations. That's nearly 8x more liquidation exposure to the downside! 🔍 Key Liquidation Levels: 🟢 $62,674: Nearest major long liquidation cluster. 🟢 $57,000: The largest concentration of potential long liquidations, making it a critical downside liquidity zone. 🔴 $70,143: Nearest major short liquidation cluster. Despite relatively balanced total liquidation exposure, leveraged longs are significantly more vulnerable to a short-term decline. These are estimated liquidation levels, not guaranteed outcomes. The data speaks for itself. 🔥 ALPHRACTAL BLACK FRIDAY: 70% OFF! See what most traders can't. Explore advanced Liquidation Levels, real-time market intelligence, and over 2,000 market metrics with Alphractal. 🎟 Use code: BLACK70 🌐alphractal.com
🚨 BITCOIN: WHERE ARE LEVERAGED TRADERS MOST VULNERABLE? Over the past 2 years, an estimated $49.4 billion in potential BTC liquidations have accumulated across the market. However, the real imbalance becomes clear when we analyze liquidation exposure near the current price. 📉 A 5% drop: $4.1B in potential long liquidations. 📈 A 5% rally: Just $521M in potential short liquidations. That's nearly 8x more liquidation exposure to the downside! 🔍 Key Liquidation Levels: 🟢 $62,674: Nearest major long liquidation cluster. 🟢 $57,000: The largest concentration of potential long liquidations, making it a critical downside liquidity zone. 🔴 $70,143: Nearest major short liquidation cluster. Despite relatively balanced total liquidation exposure, leveraged longs are significantly more vulnerable to a short-term decline. These are estimated liquidation levels, not guaranteed outcomes. The data speaks for itself. 🔥 ALPHRACTAL BLACK FRIDAY: 70% OFF! See what most traders can't. Explore advanced Liquidation Levels, real-time market intelligence, and over 2,000 market metrics with Alphractal. 🎟 Use code: BLACK70 🌐alphractal.com
66
·
--
Переглянути переклад
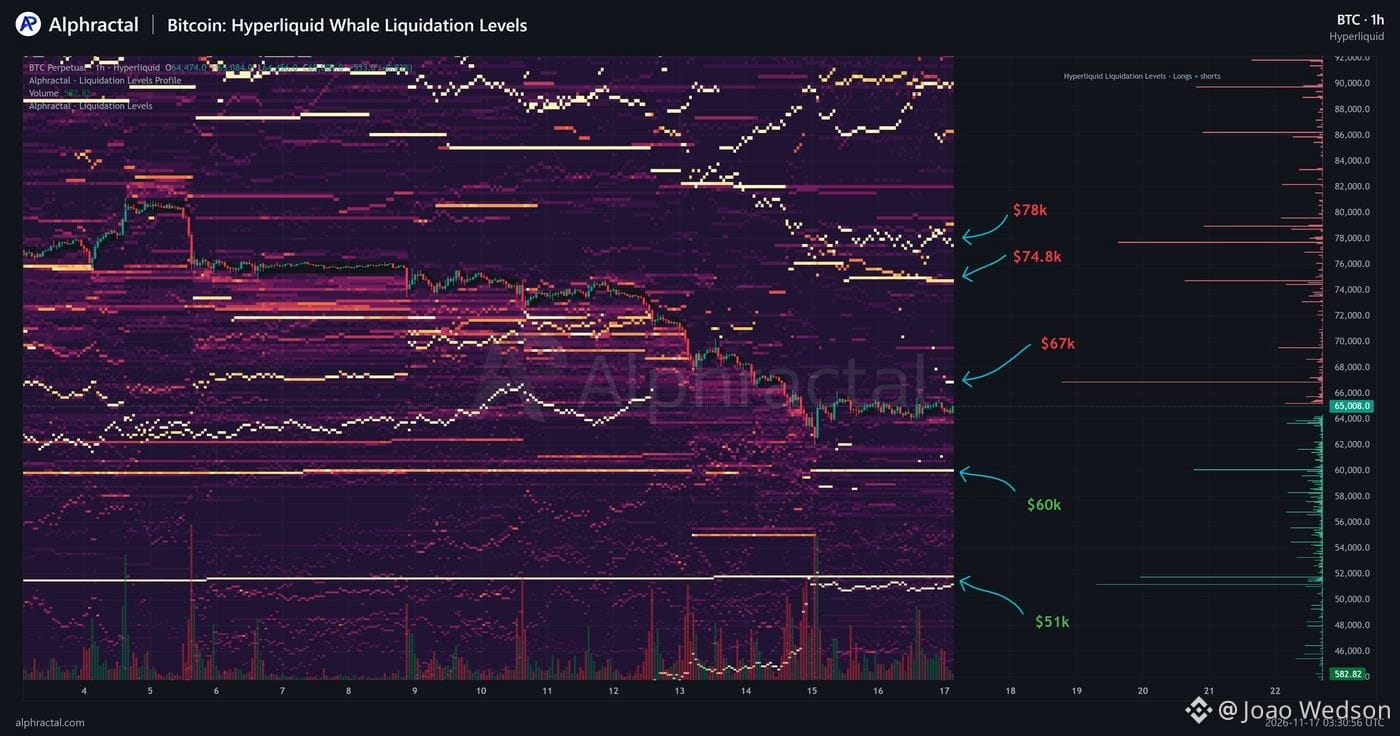
Bitcoin: Where Will Hyperliquid Whales Get Liquidated? 🔴 SHORTS: $67K | $74.8K | $78K 🟢 LONGS: $60K | $51K The key liquidation zones are right on the map. Now, play your cards. This is the level of detail Alphractal Next-Gen will put at your fingertips. I can't wait to share everything we've been building! Data > Narratives. Don't miss our biggest Black Friday deal yet! Check out the post below and use code BLACK70 for 70% OFF.
Bitcoin: Where Will Hyperliquid Whales Get Liquidated? 🔴 SHORTS: $67K | $74.8K | $78K 🟢 LONGS: $60K | $51K The key liquidation zones are right on the map. Now, play your cards. This is the level of detail Alphractal Next-Gen will put at your fingertips. I can't wait to share everything we've been building! Data > Narratives. Don't miss our biggest Black Friday deal yet! Check out the post below and use code BLACK70 for 70% OFF.
5
·
--
Переглянути переклад
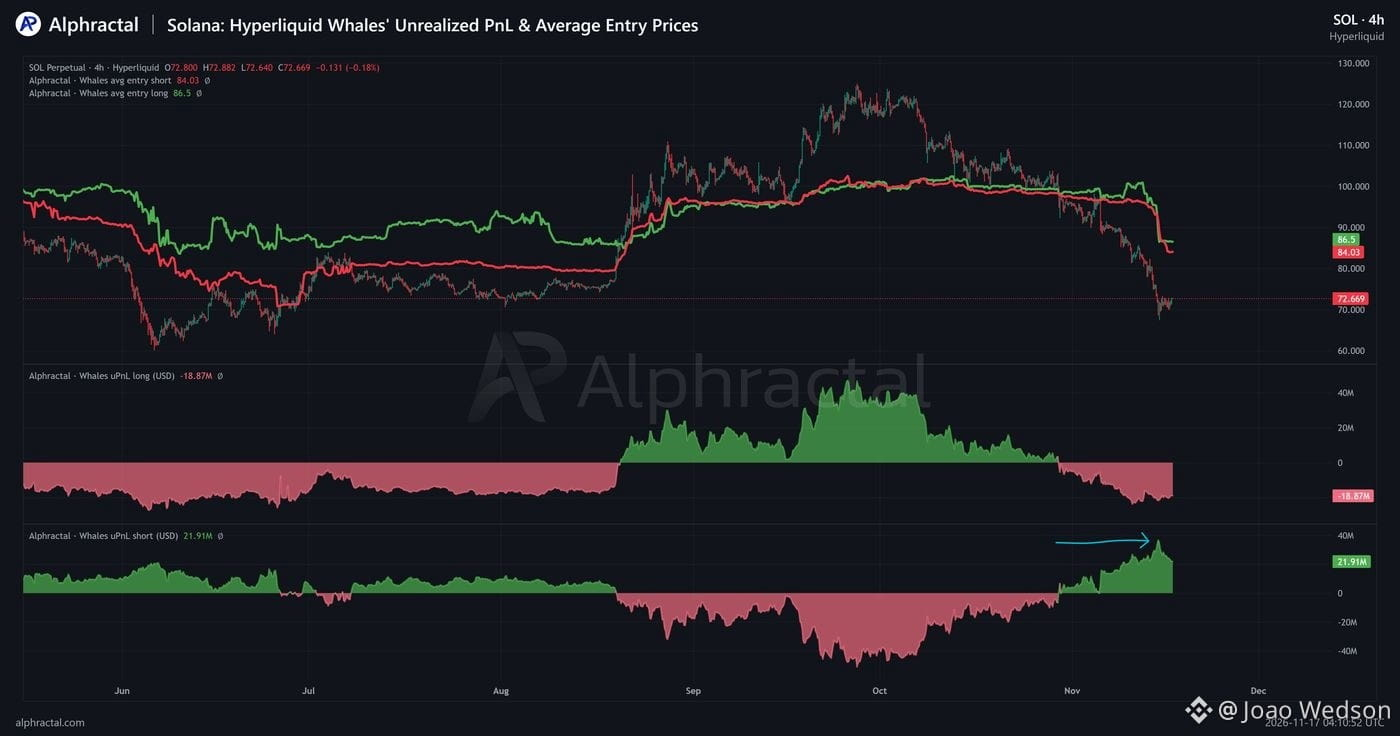
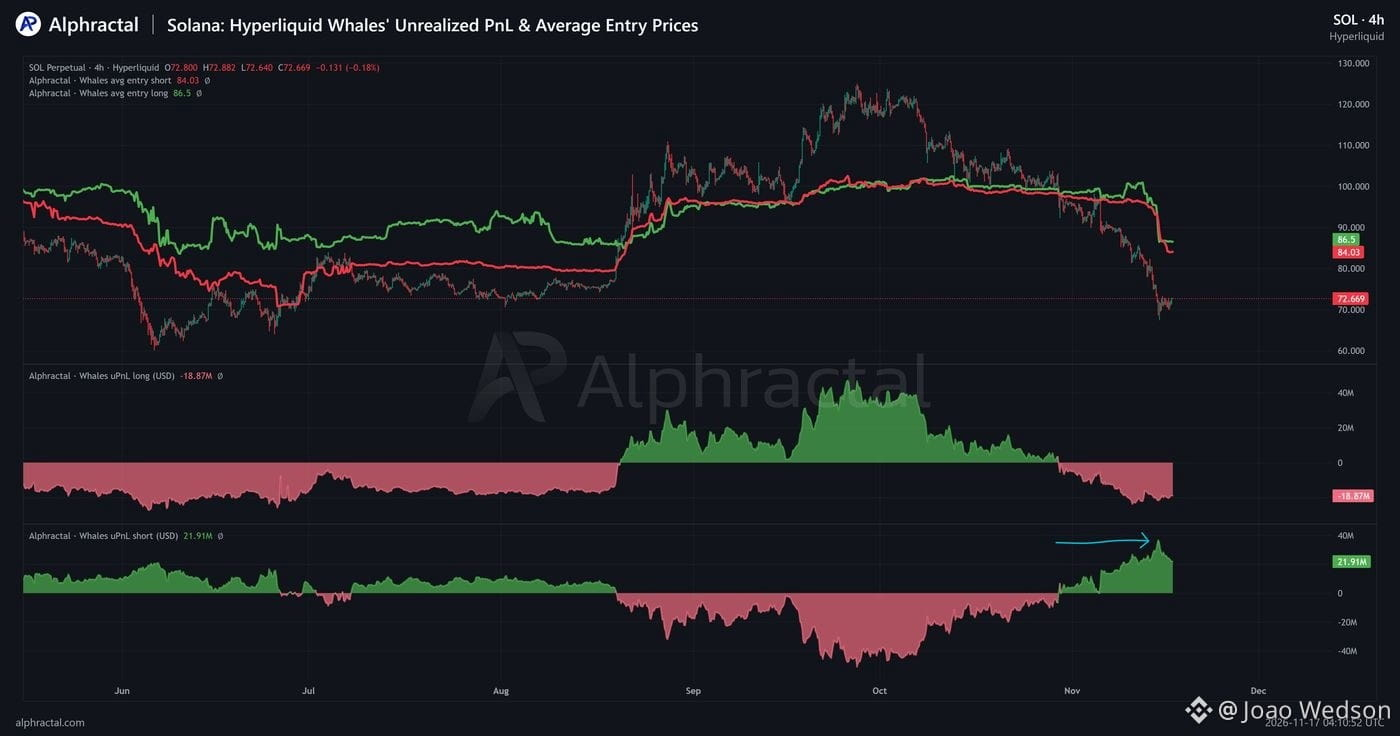
Solana: Hyperliquid Whales Hit Record Short Profits in 2026! SOL whales on Hyperliquid recently reached their highest unrealized profits from Short positions this year. 🟢 SHORTS - Average Entry Price: $84.03 - Unrealized PnL: +$21.91M 🔴 LONGS - Average Entry Price: $86.50 - Unrealized PnL: -$18.87M With SOL trading around $72.67, Short whales are sitting on massive profits. Meanwhile, other whales are betting against the trend, holding significant unrealized losses on their Long positions. Same market. Opposite bets. Very different outcomes. All tracked by Alphractal. Data > Narratives.
Solana: Hyperliquid Whales Hit Record Short Profits in 2026! SOL whales on Hyperliquid recently reached their highest unrealized profits from Short positions this year. 🟢 SHORTS - Average Entry Price: $84.03 - Unrealized PnL: +$21.91M 🔴 LONGS - Average Entry Price: $86.50 - Unrealized PnL: -$18.87M With SOL trading around $72.67, Short whales are sitting on massive profits. Meanwhile, other whales are betting against the trend, holding significant unrealized losses on their Long positions. Same market. Opposite bets. Very different outcomes. All tracked by Alphractal. Data > Narratives.
3
·
--
Переглянути переклад
Solana: Hyperliquid Whales Hit Record Short Profits in 2026!
SOL whales on Hyperliquid recently reached their highest unrealized profits from Short positions this year.
🟢 SHORTS
- Average Entry Price: $84.03
- Unrealized PnL: +$21.91M
🔴 LONGS
- Average Entry Price: $86.50
- Unrealized PnL: -$18.87M
With SOL trading around $72.67, Short whales are sitting on massive profits.
Meanwhile, other whales are betting against the trend, holding significant unrealized losses on their Long positions.
Same market. Opposite bets. Very different outcomes.
All tracked by Alphractal.
Data > Narratives.
Solana: Hyperliquid Whales Hit Record Short Profits in 2026!
SOL whales on Hyperliquid recently reached their highest unrealized profits from Short positions this year.
🟢 SHORTS
- Average Entry Price: $84.03
- Unrealized PnL: +$21.91M
🔴 LONGS
- Average Entry Price: $86.50
- Unrealized PnL: -$18.87M
With SOL trading around $72.67, Short whales are sitting on massive profits.
Meanwhile, other whales are betting against the trend, holding significant unrealized losses on their Long positions.
Same market. Opposite bets. Very different outcomes.
All tracked by Alphractal.
Data > Narratives.
SOL whales on Hyperliquid recently reached their highest unrealized profits from Short positions this year.
🟢 SHORTS
- Average Entry Price: $84.03
- Unrealized PnL: +$21.91M
🔴 LONGS
- Average Entry Price: $86.50
- Unrealized PnL: -$18.87M
With SOL trading around $72.67, Short whales are sitting on massive profits.
Meanwhile, other whales are betting against the trend, holding significant unrealized losses on their Long positions.
Same market. Opposite bets. Very different outcomes.
All tracked by Alphractal.
Data > Narratives.
4
·
--
Переглянути переклад
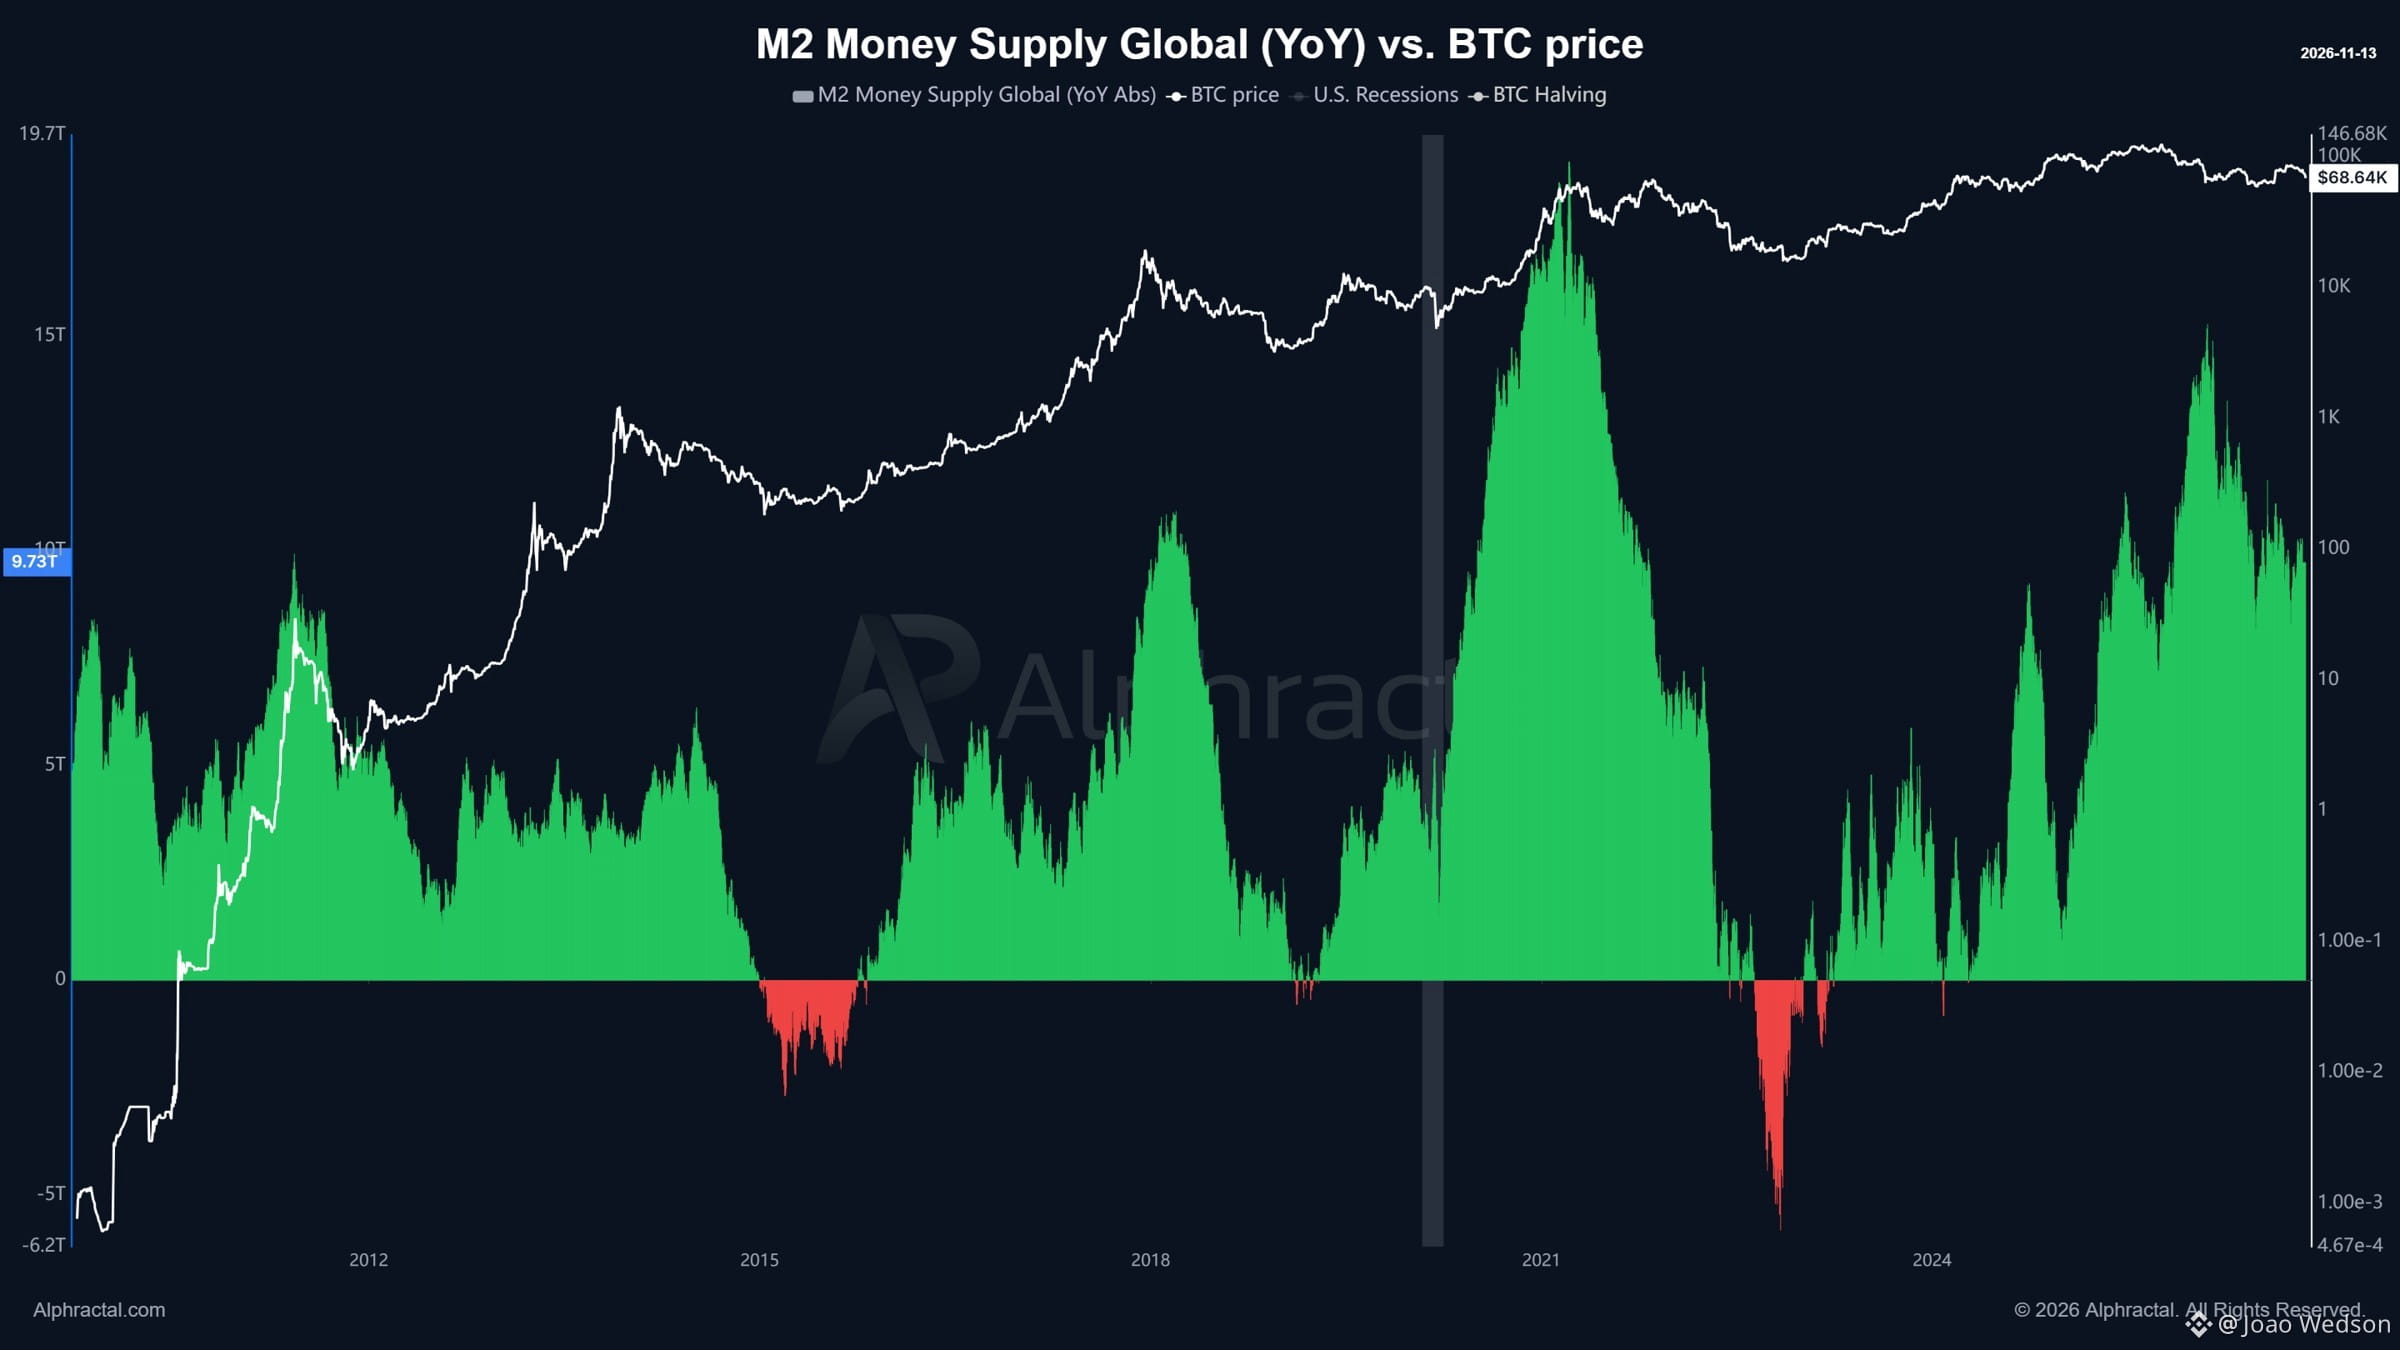
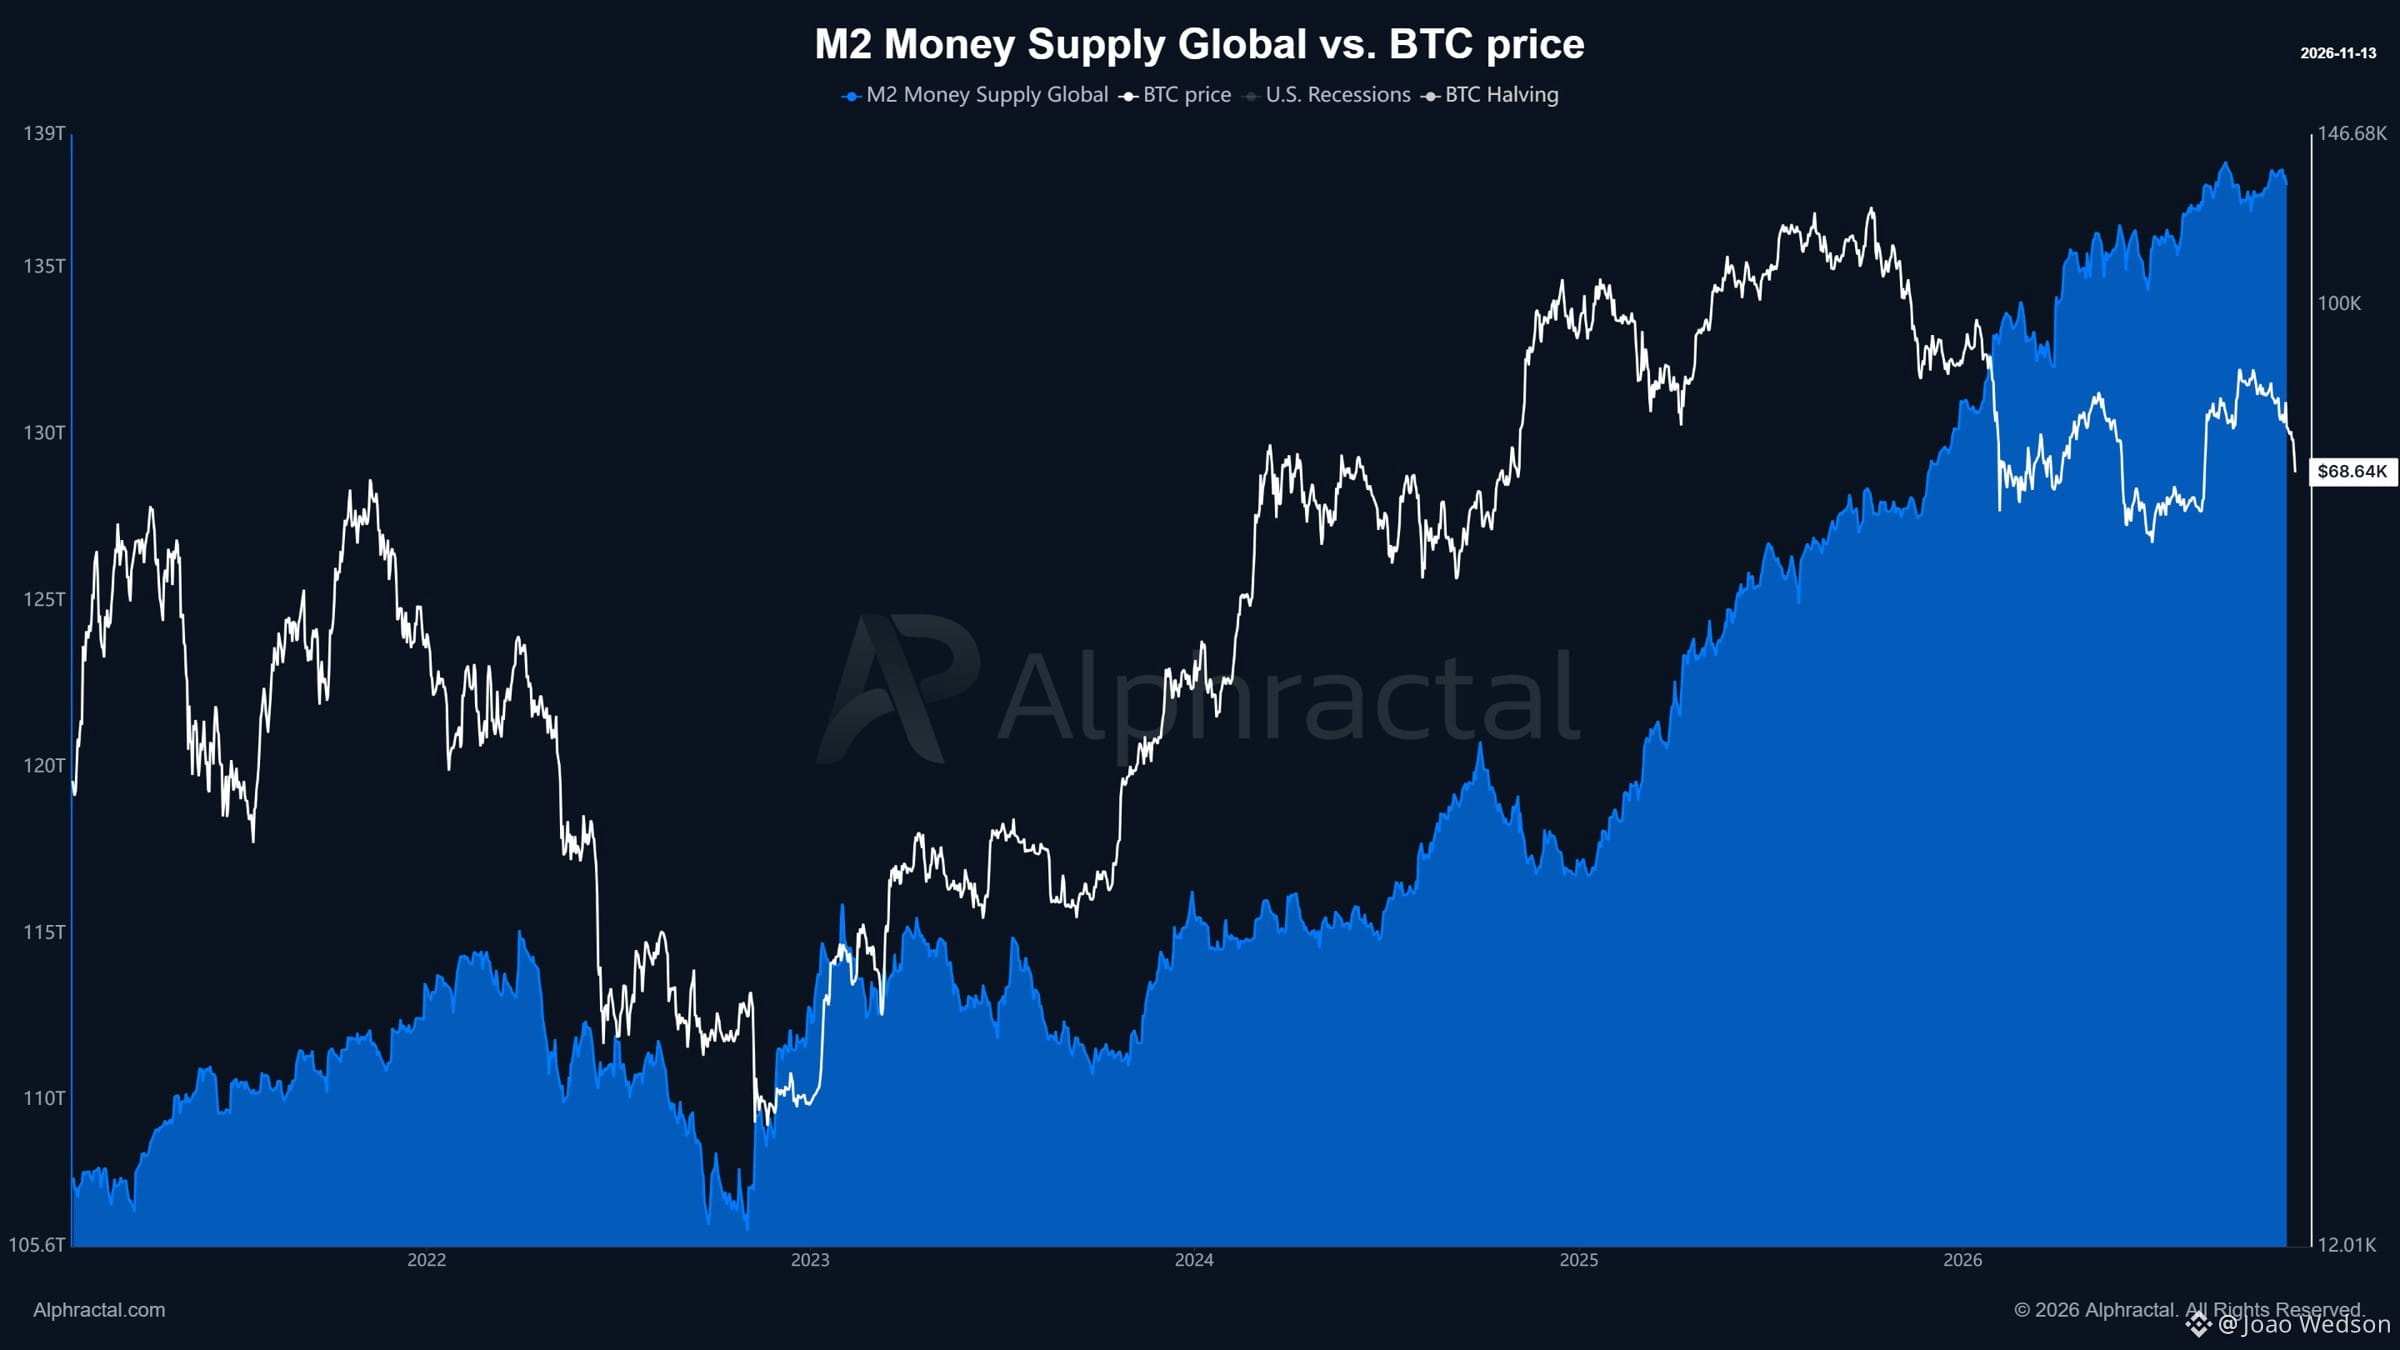
🚨 GLOBAL M2 HAS STOPPED RISING! After a strong expansion through 2025 and early 2026, Global M2 Money Supply is now moving sideways near its highs, around $138T. The bigger signal is in the yearly change: Global M2 YoY has been falling since February 2026 and is now at $9.73T. Historically, every time the YoY variation turned negative, it lined up with major Bitcoin bottoms: 🔴 2015 🔴 2018 🔴 2022 The variation is still positive, so this is not a bottom signal yet. But liquidity is losing momentum, and that has historically been a headwind for BTC. Source: Alphractal
🚨 GLOBAL M2 HAS STOPPED RISING! After a strong expansion through 2025 and early 2026, Global M2 Money Supply is now moving sideways near its highs, around $138T. The bigger signal is in the yearly change: Global M2 YoY has been falling since February 2026 and is now at $9.73T. Historically, every time the YoY variation turned negative, it lined up with major Bitcoin bottoms: 🔴 2015 🔴 2018 🔴 2022 The variation is still positive, so this is not a bottom signal yet. But liquidity is losing momentum, and that has historically been a headwind for BTC. Source: Alphractal
33
·
--
Переглянути переклад
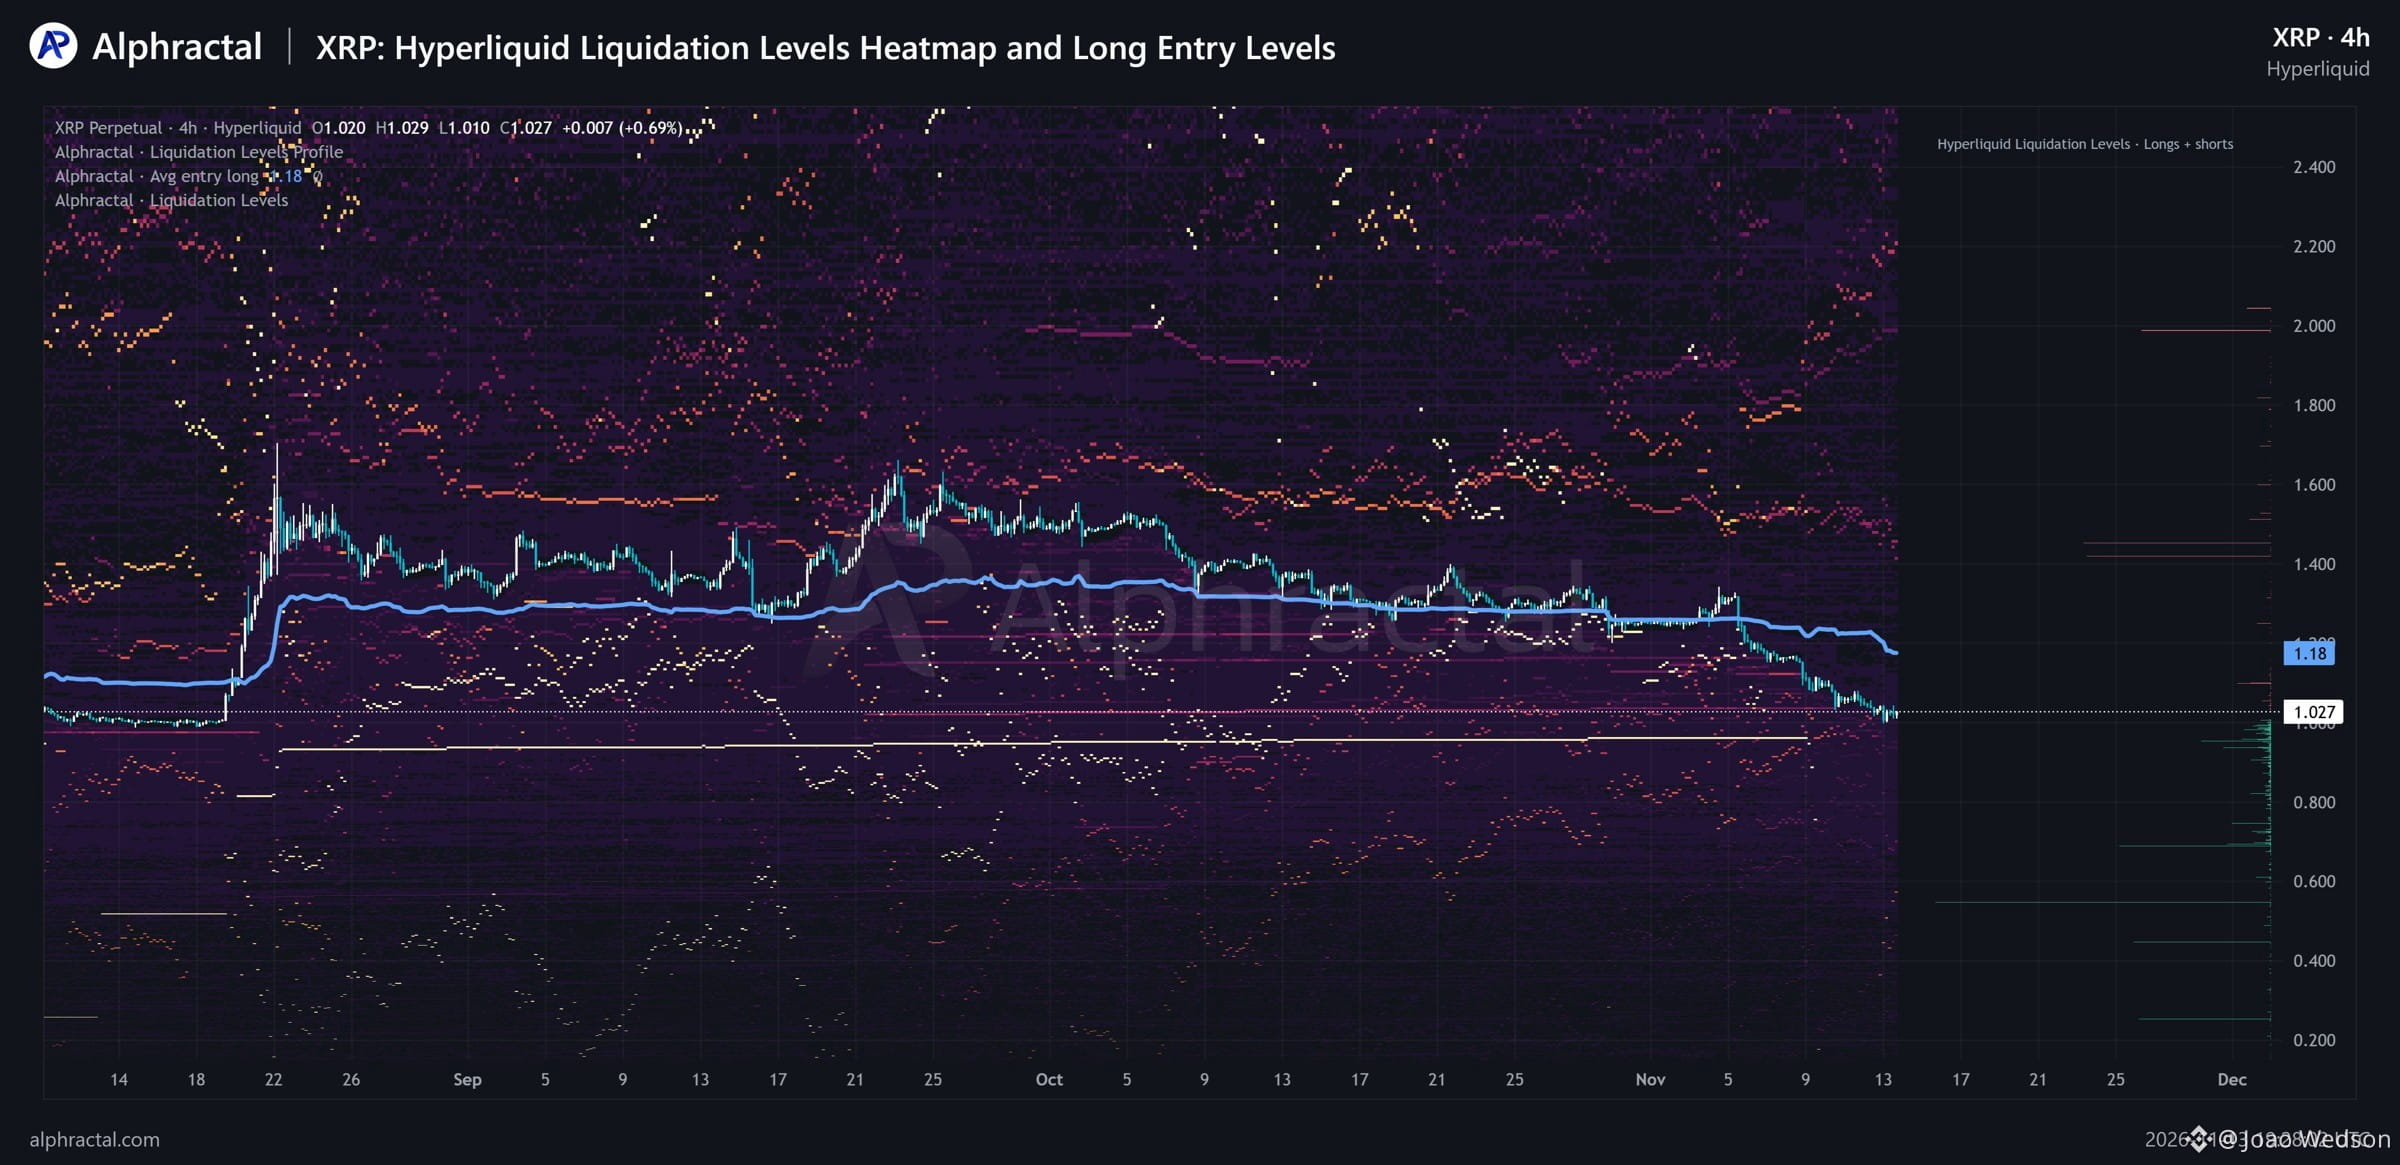
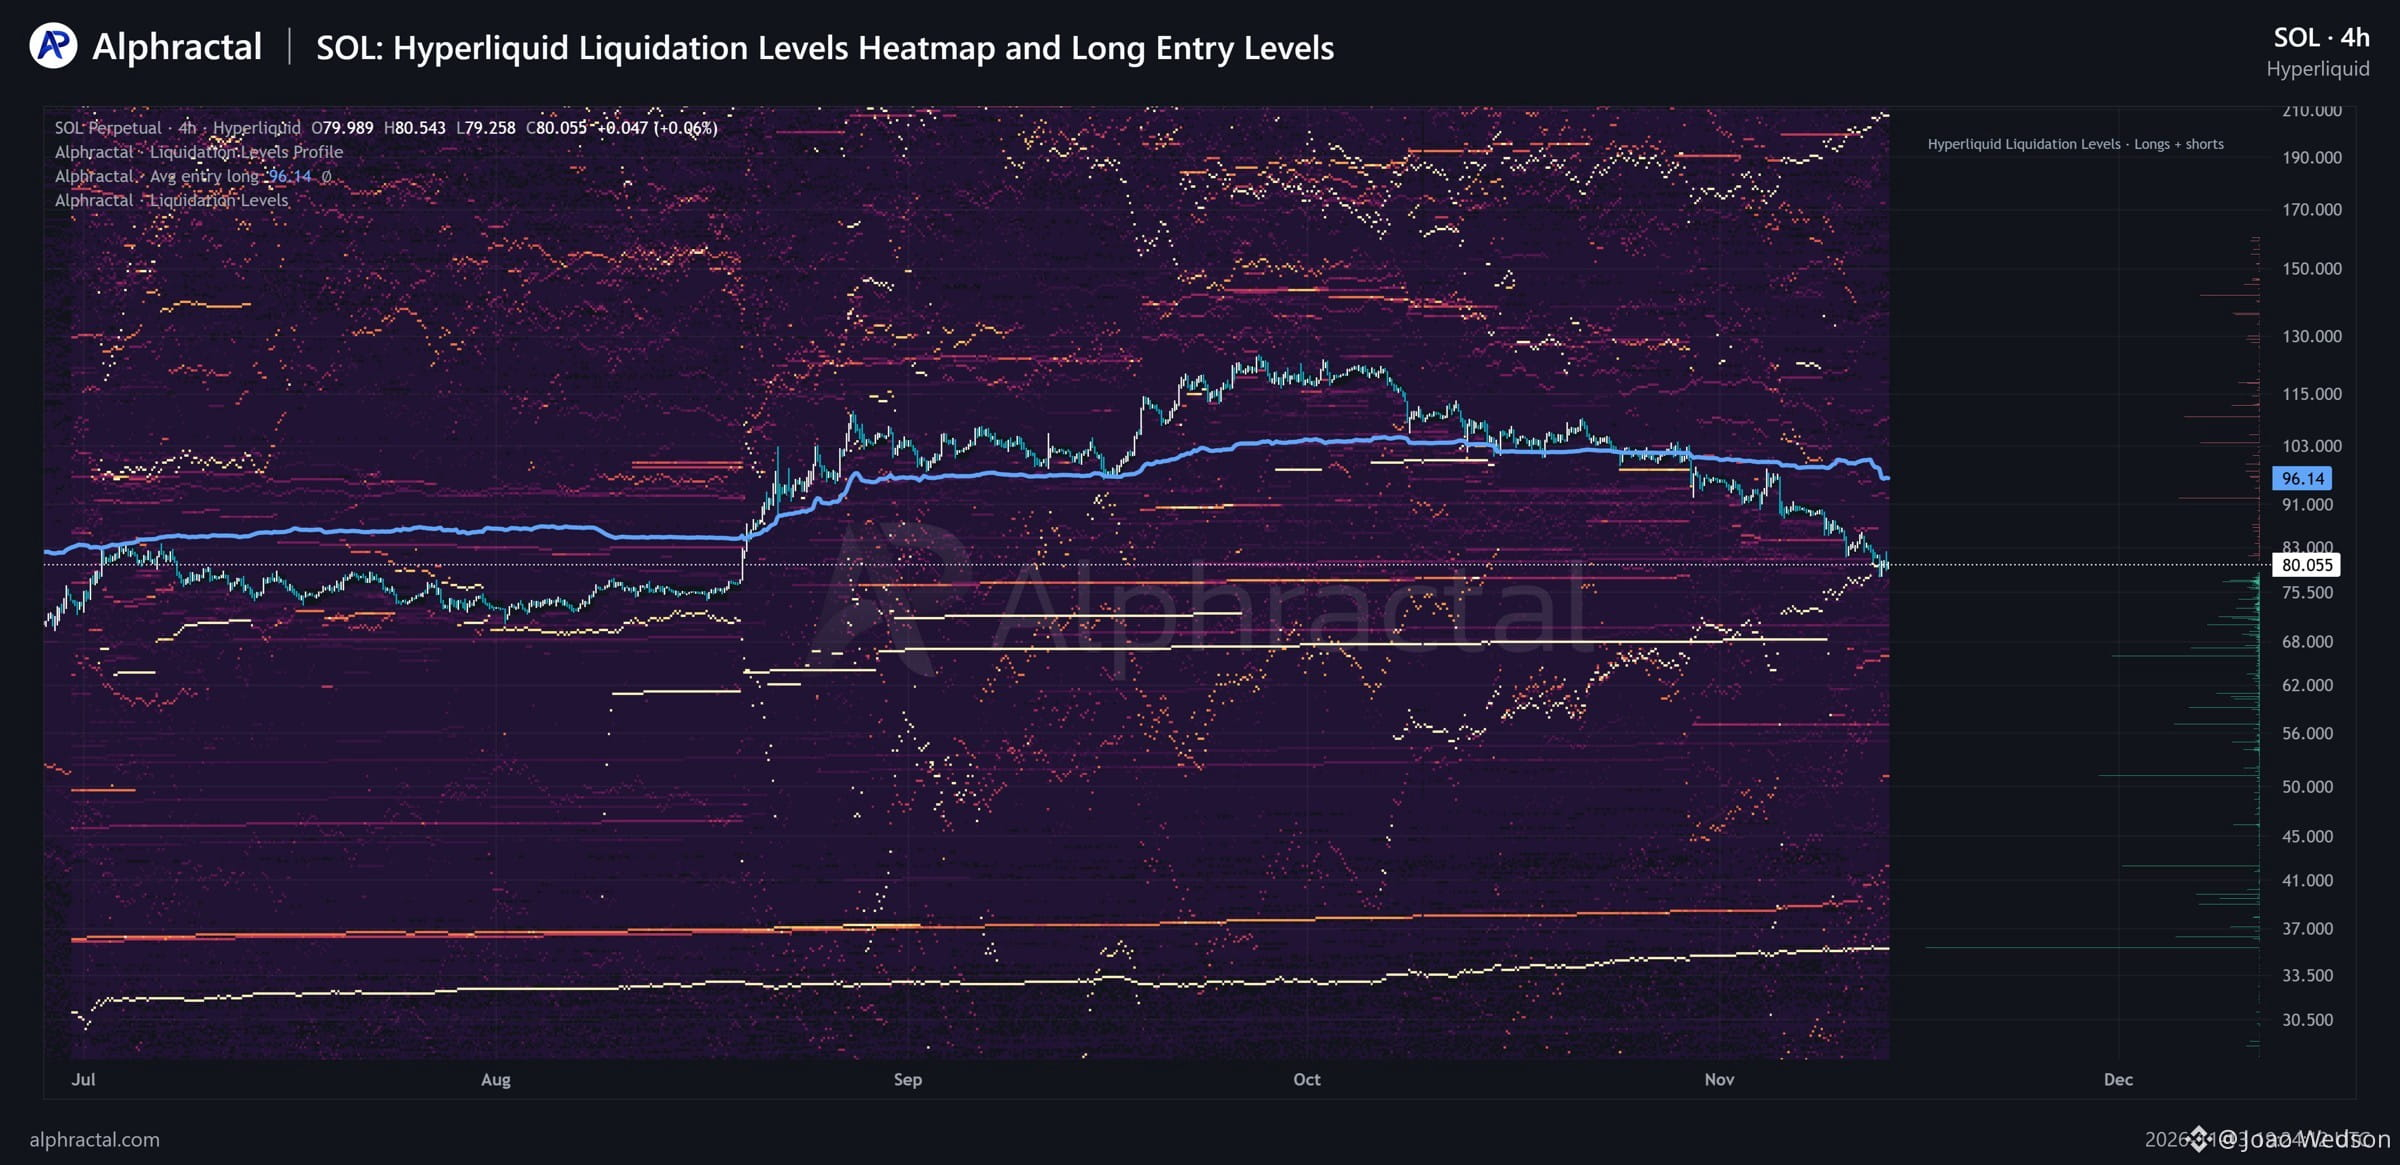
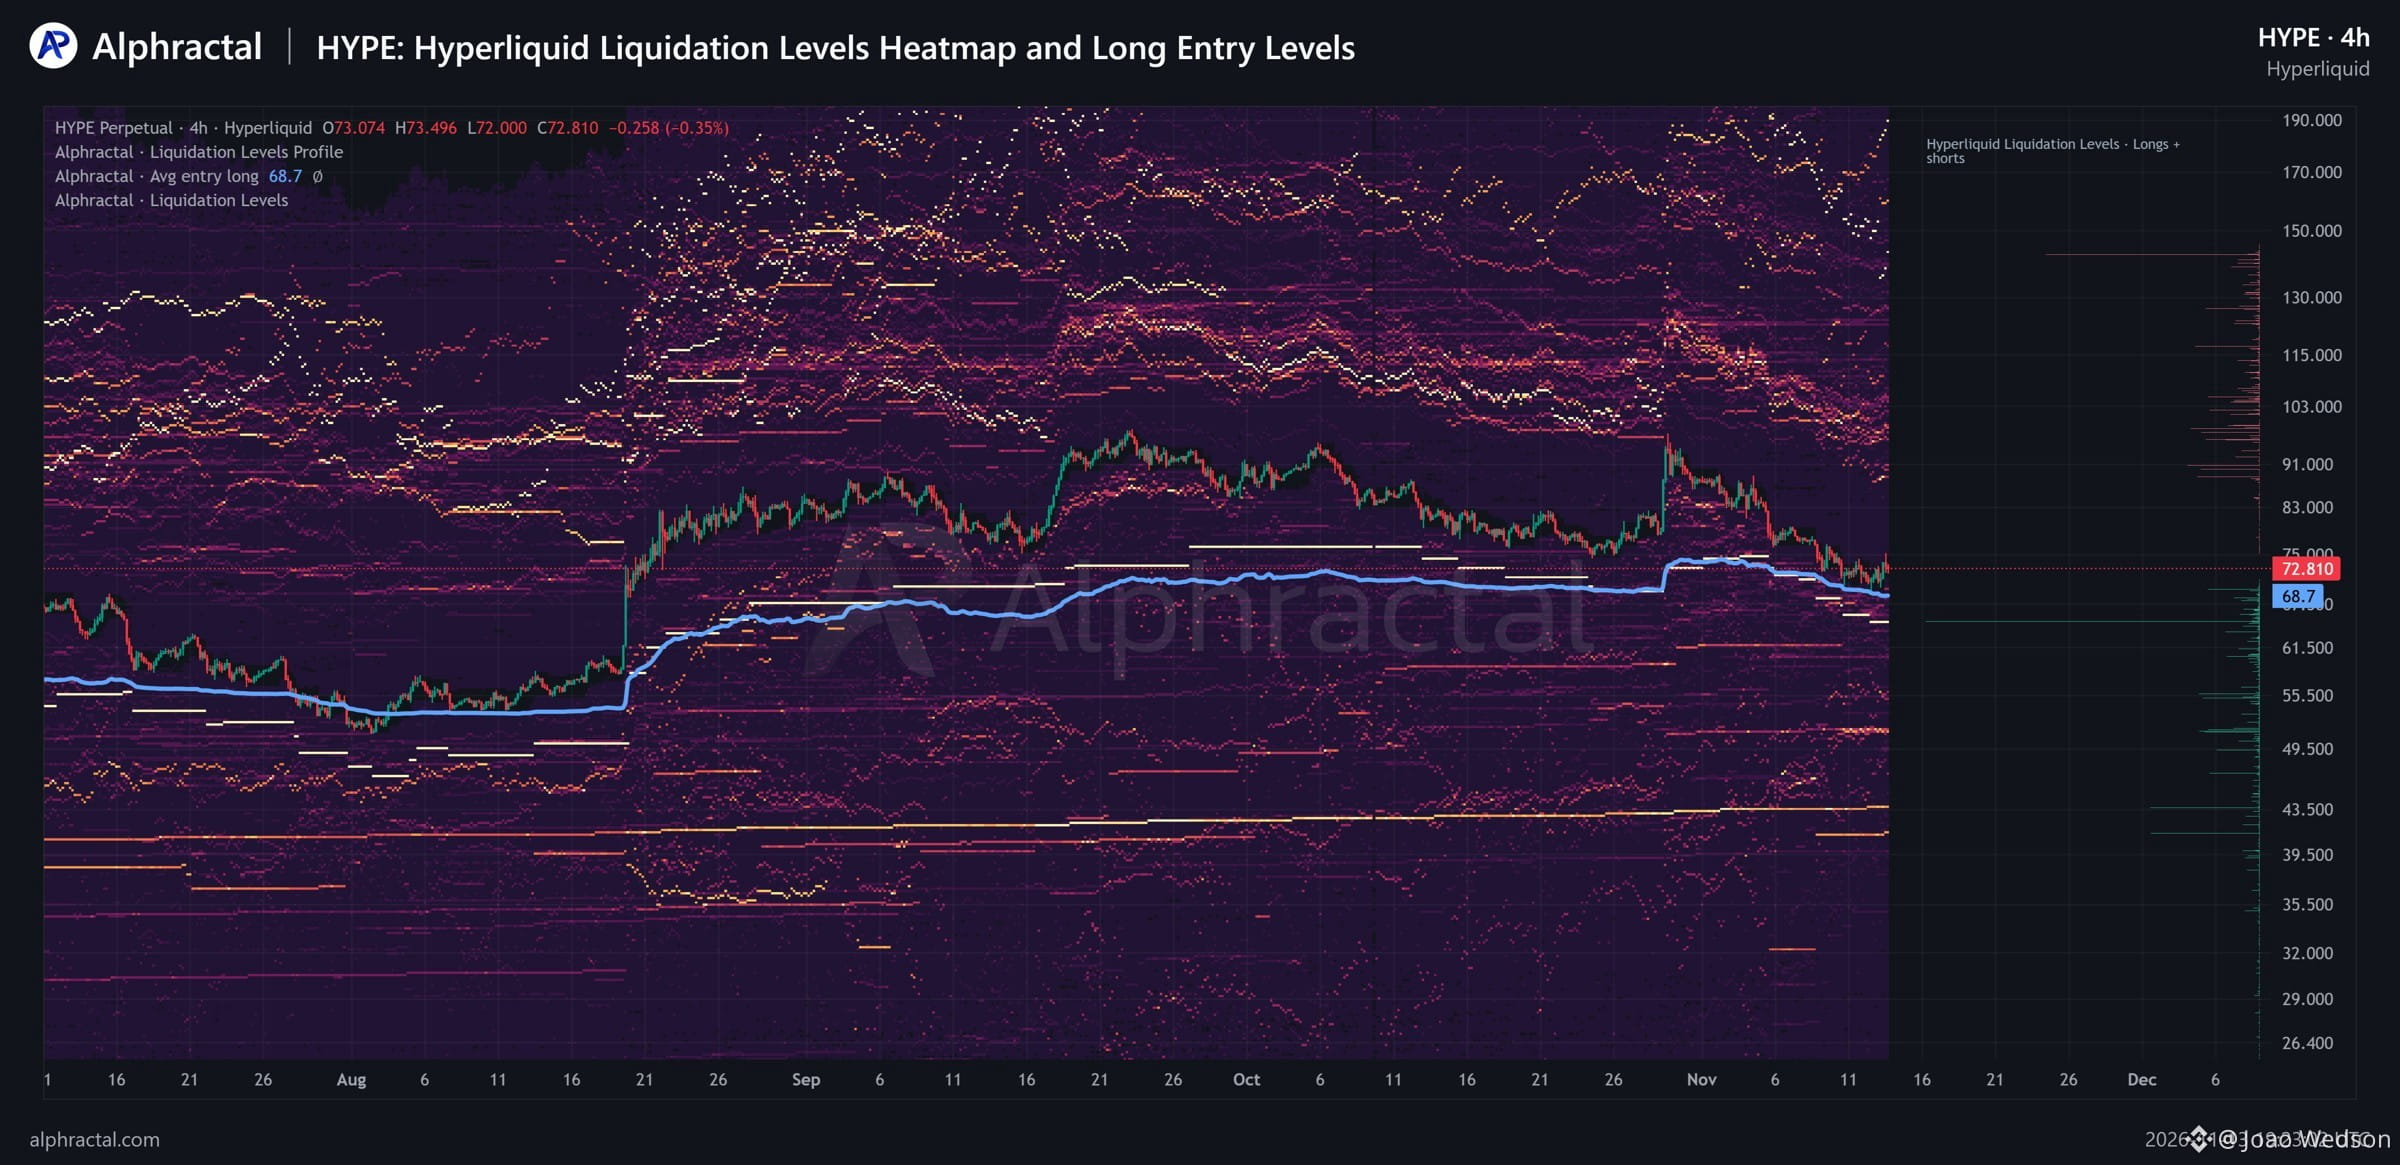
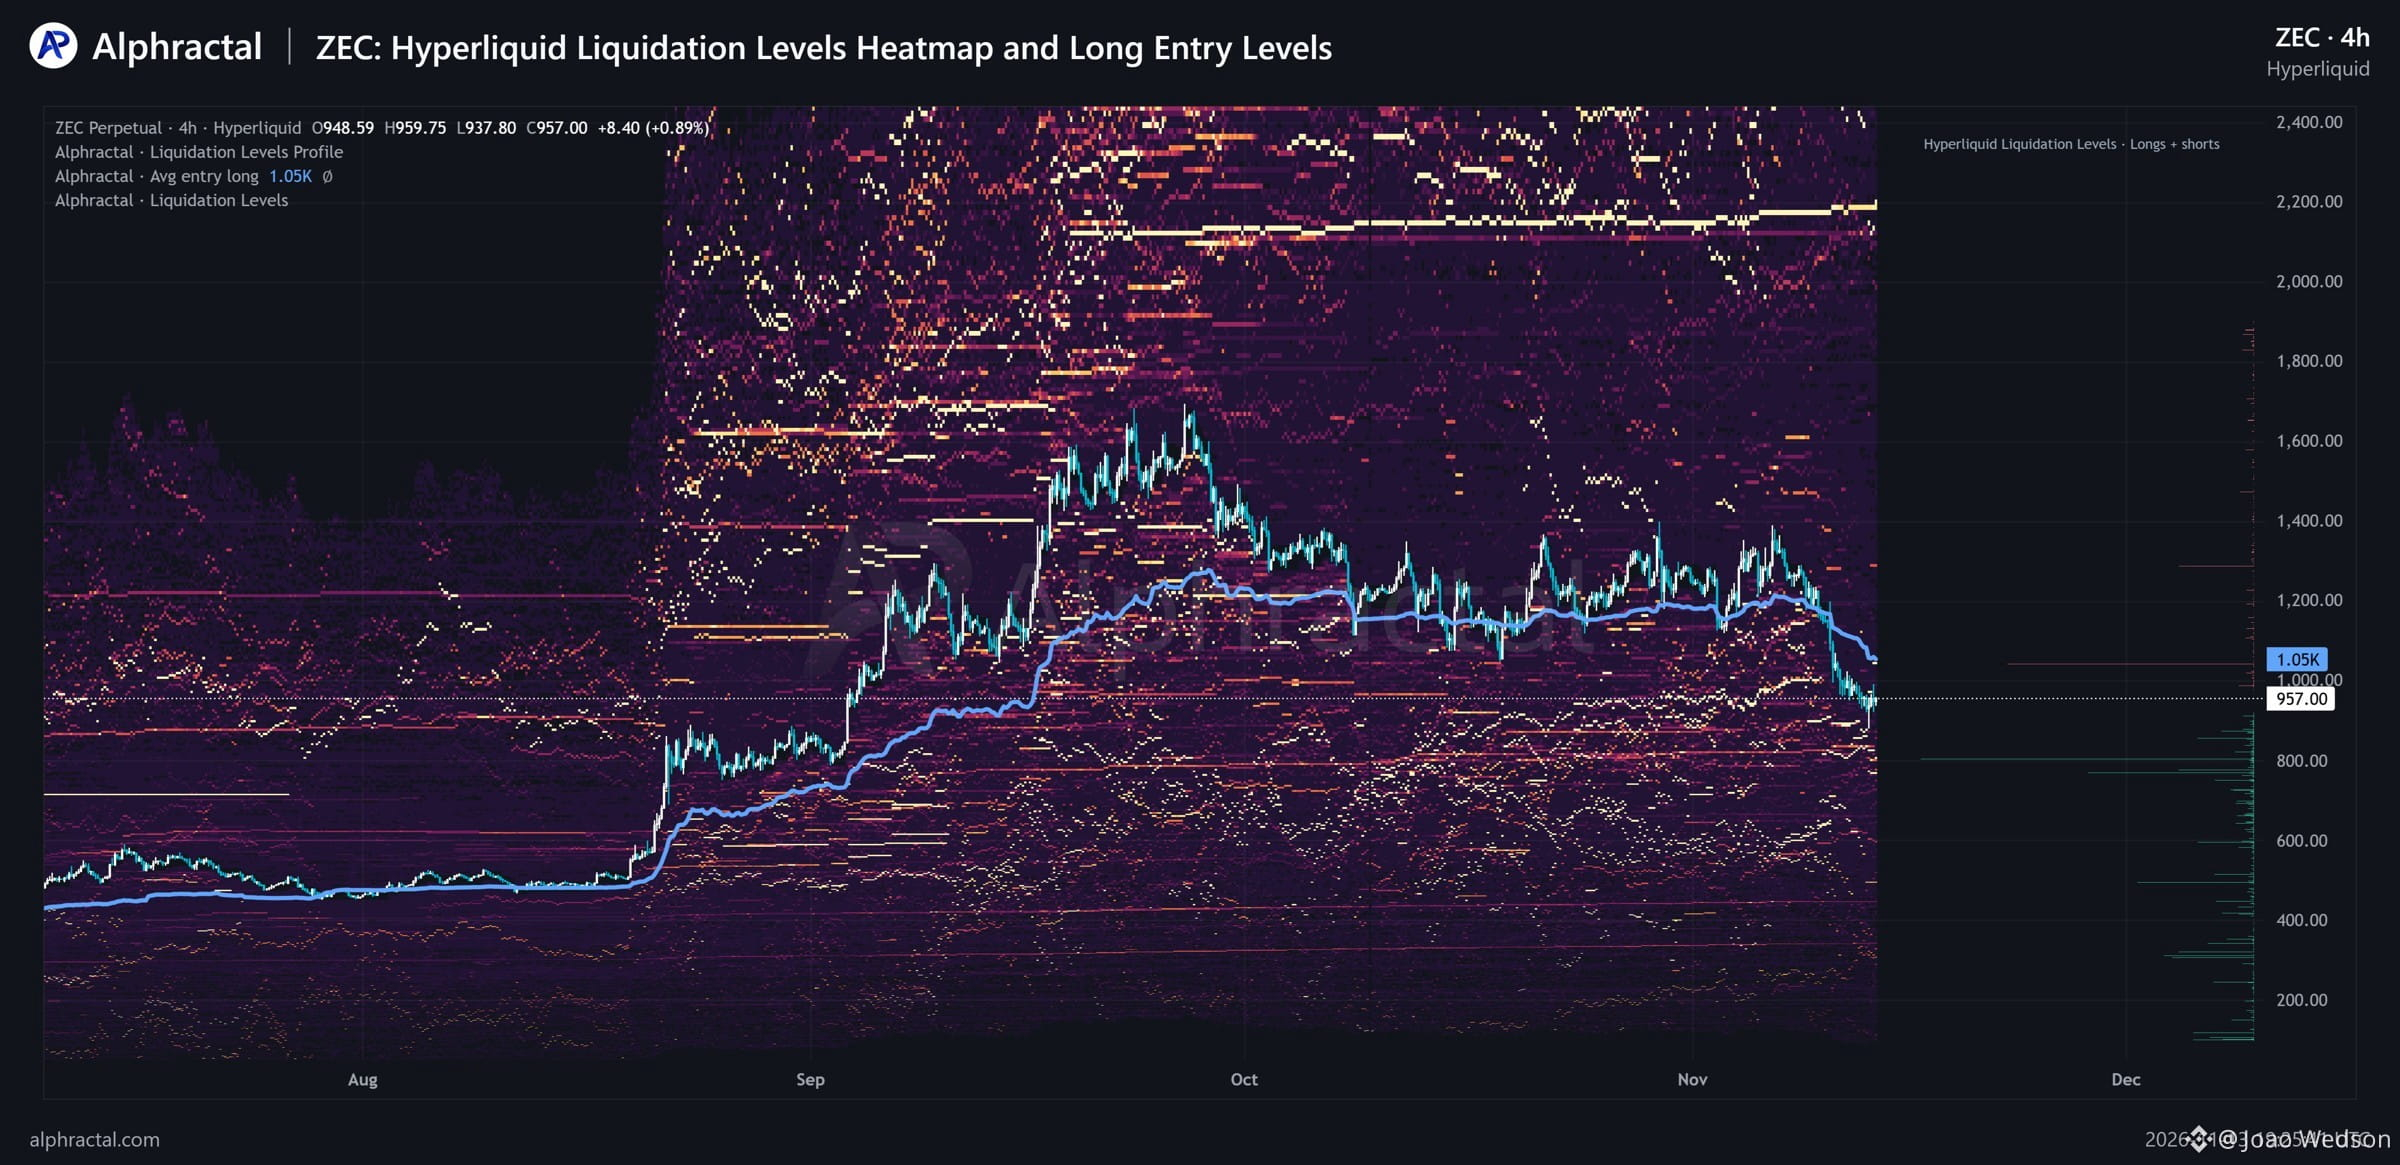
🚨 LONGS DOMINATE ACROSS 12 CRYPTO ASSETS ON HYPERLIQUID! (3/3) - $XRP: $1.18 (14.90% above) - $ZEC: $1,050 (9.72% above) - $SOL: $96.14 (20.09% above) - $HYPE: $68.70 (5.64% below) Currently, 10 out of these 12 assets are trading below their Average Long Entry Prices! Only HYPE and LIT remain above theirs. This suggests that Long positioning remains heavily exposed to downside pressure, despite the market already experiencing significant declines. And here's where things get even more interesting. Our Hyperliquid Liquidation Levels Heatmaps reveal where Long and Short liquidations are concentrated, allowing us to identify potential liquidity zones and understand how leveraged positioning may influence future price movements. These are real exchange-level data, not hypothetical liquidation estimates. The next generation of market analysis is coming to Alphractal. Explore more: Alphractal.com
🚨 LONGS DOMINATE ACROSS 12 CRYPTO ASSETS ON HYPERLIQUID! (3/3) - $XRP: $1.18 (14.90% above) - $ZEC: $1,050 (9.72% above) - $SOL: $96.14 (20.09% above) - $HYPE: $68.70 (5.64% below) Currently, 10 out of these 12 assets are trading below their Average Long Entry Prices! Only HYPE and LIT remain above theirs. This suggests that Long positioning remains heavily exposed to downside pressure, despite the market already experiencing significant declines. And here's where things get even more interesting. Our Hyperliquid Liquidation Levels Heatmaps reveal where Long and Short liquidations are concentrated, allowing us to identify potential liquidity zones and understand how leveraged positioning may influence future price movements. These are real exchange-level data, not hypothetical liquidation estimates. The next generation of market analysis is coming to Alphractal. Explore more: Alphractal.com
39
·
--
Переглянути переклад
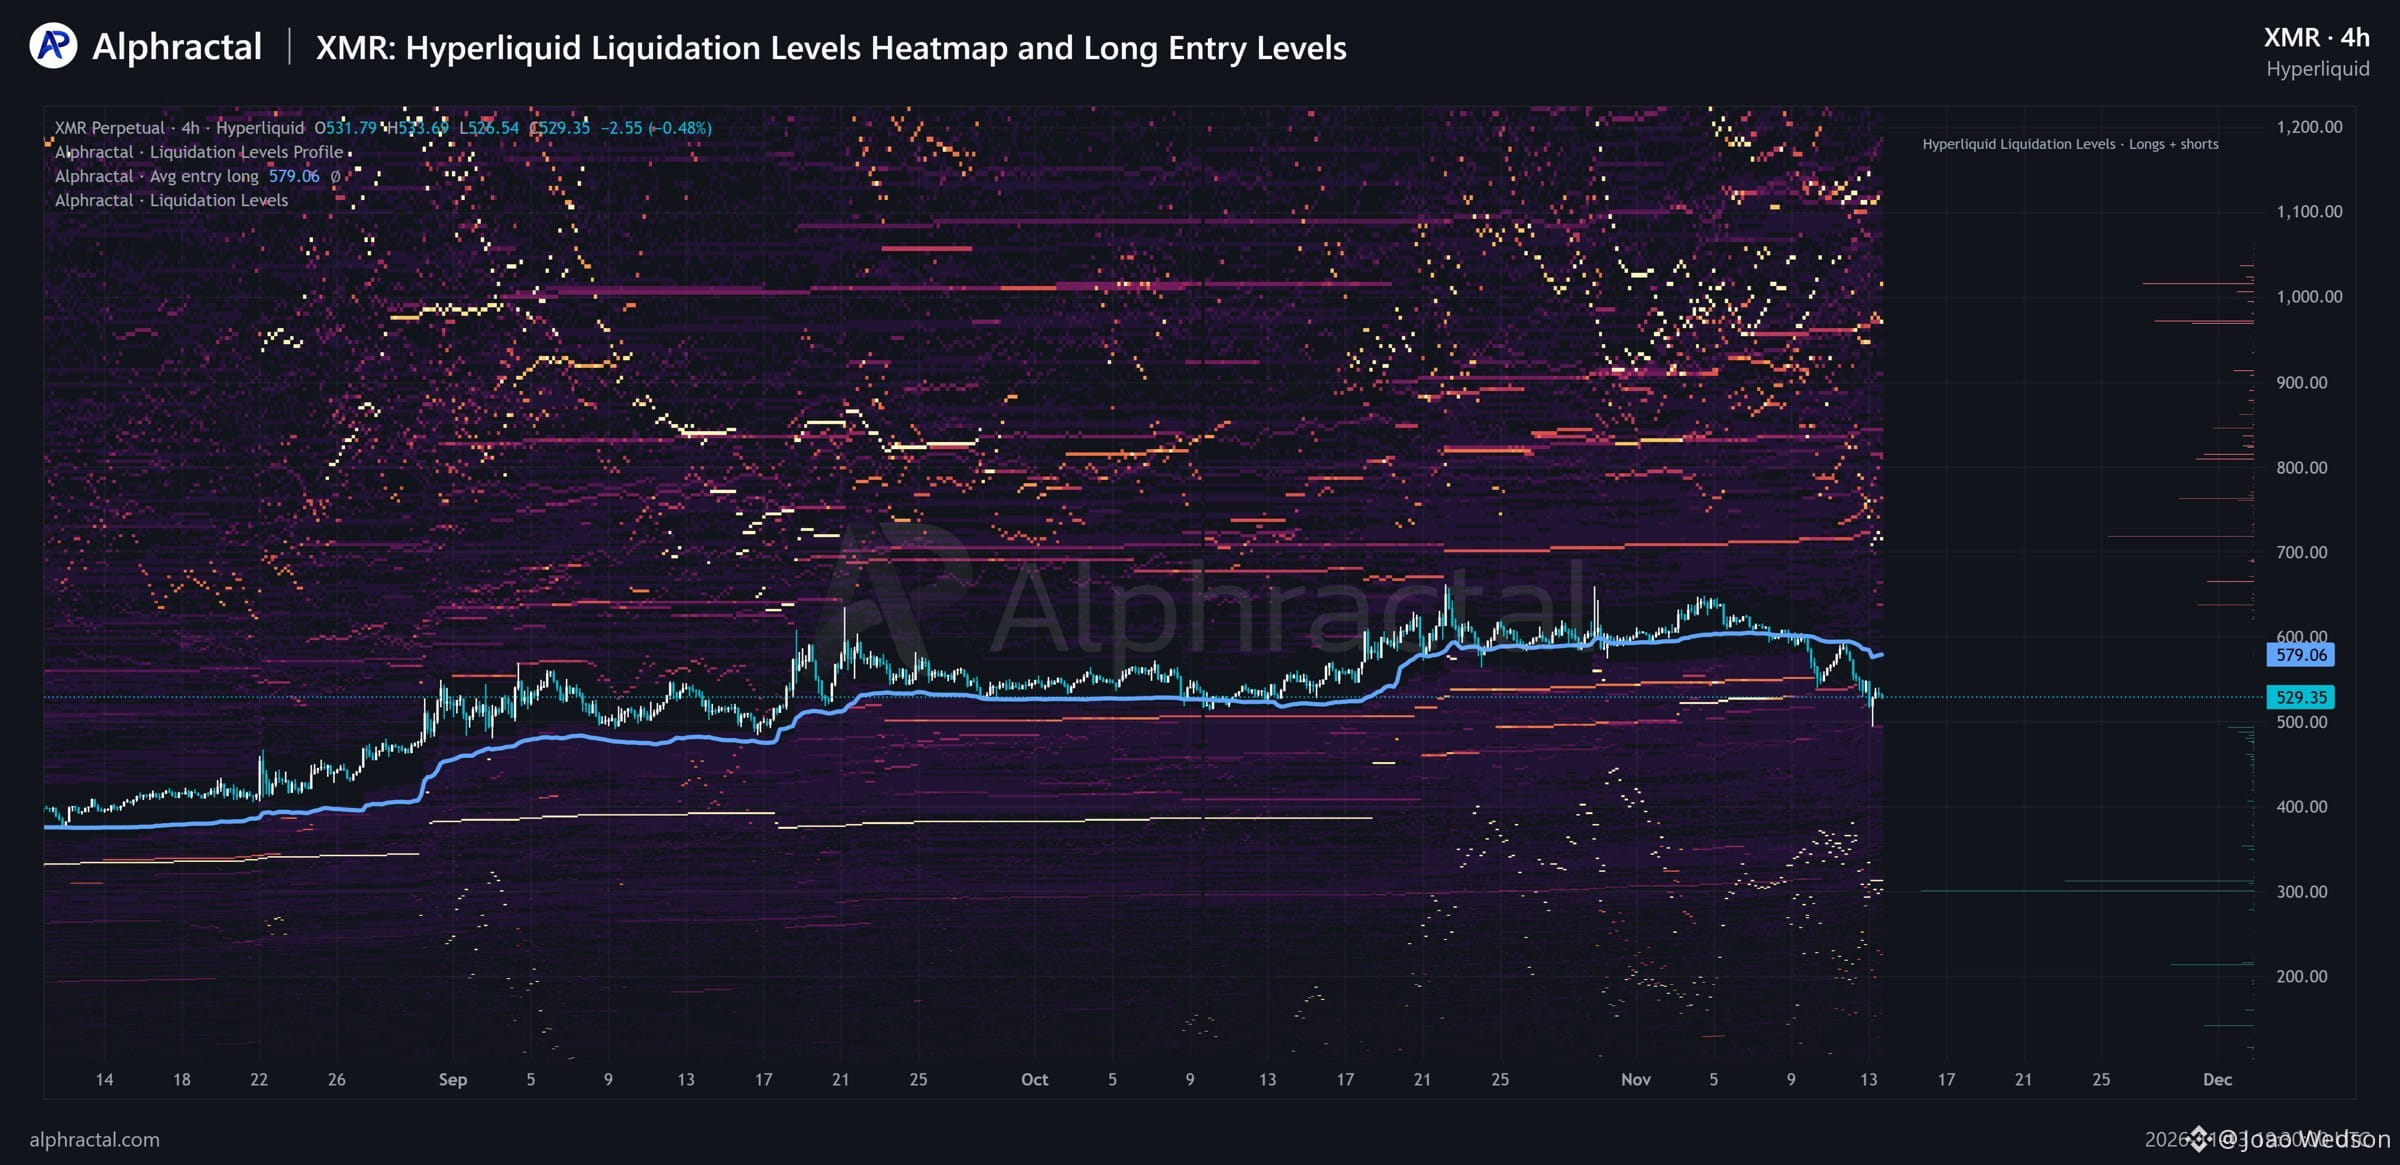
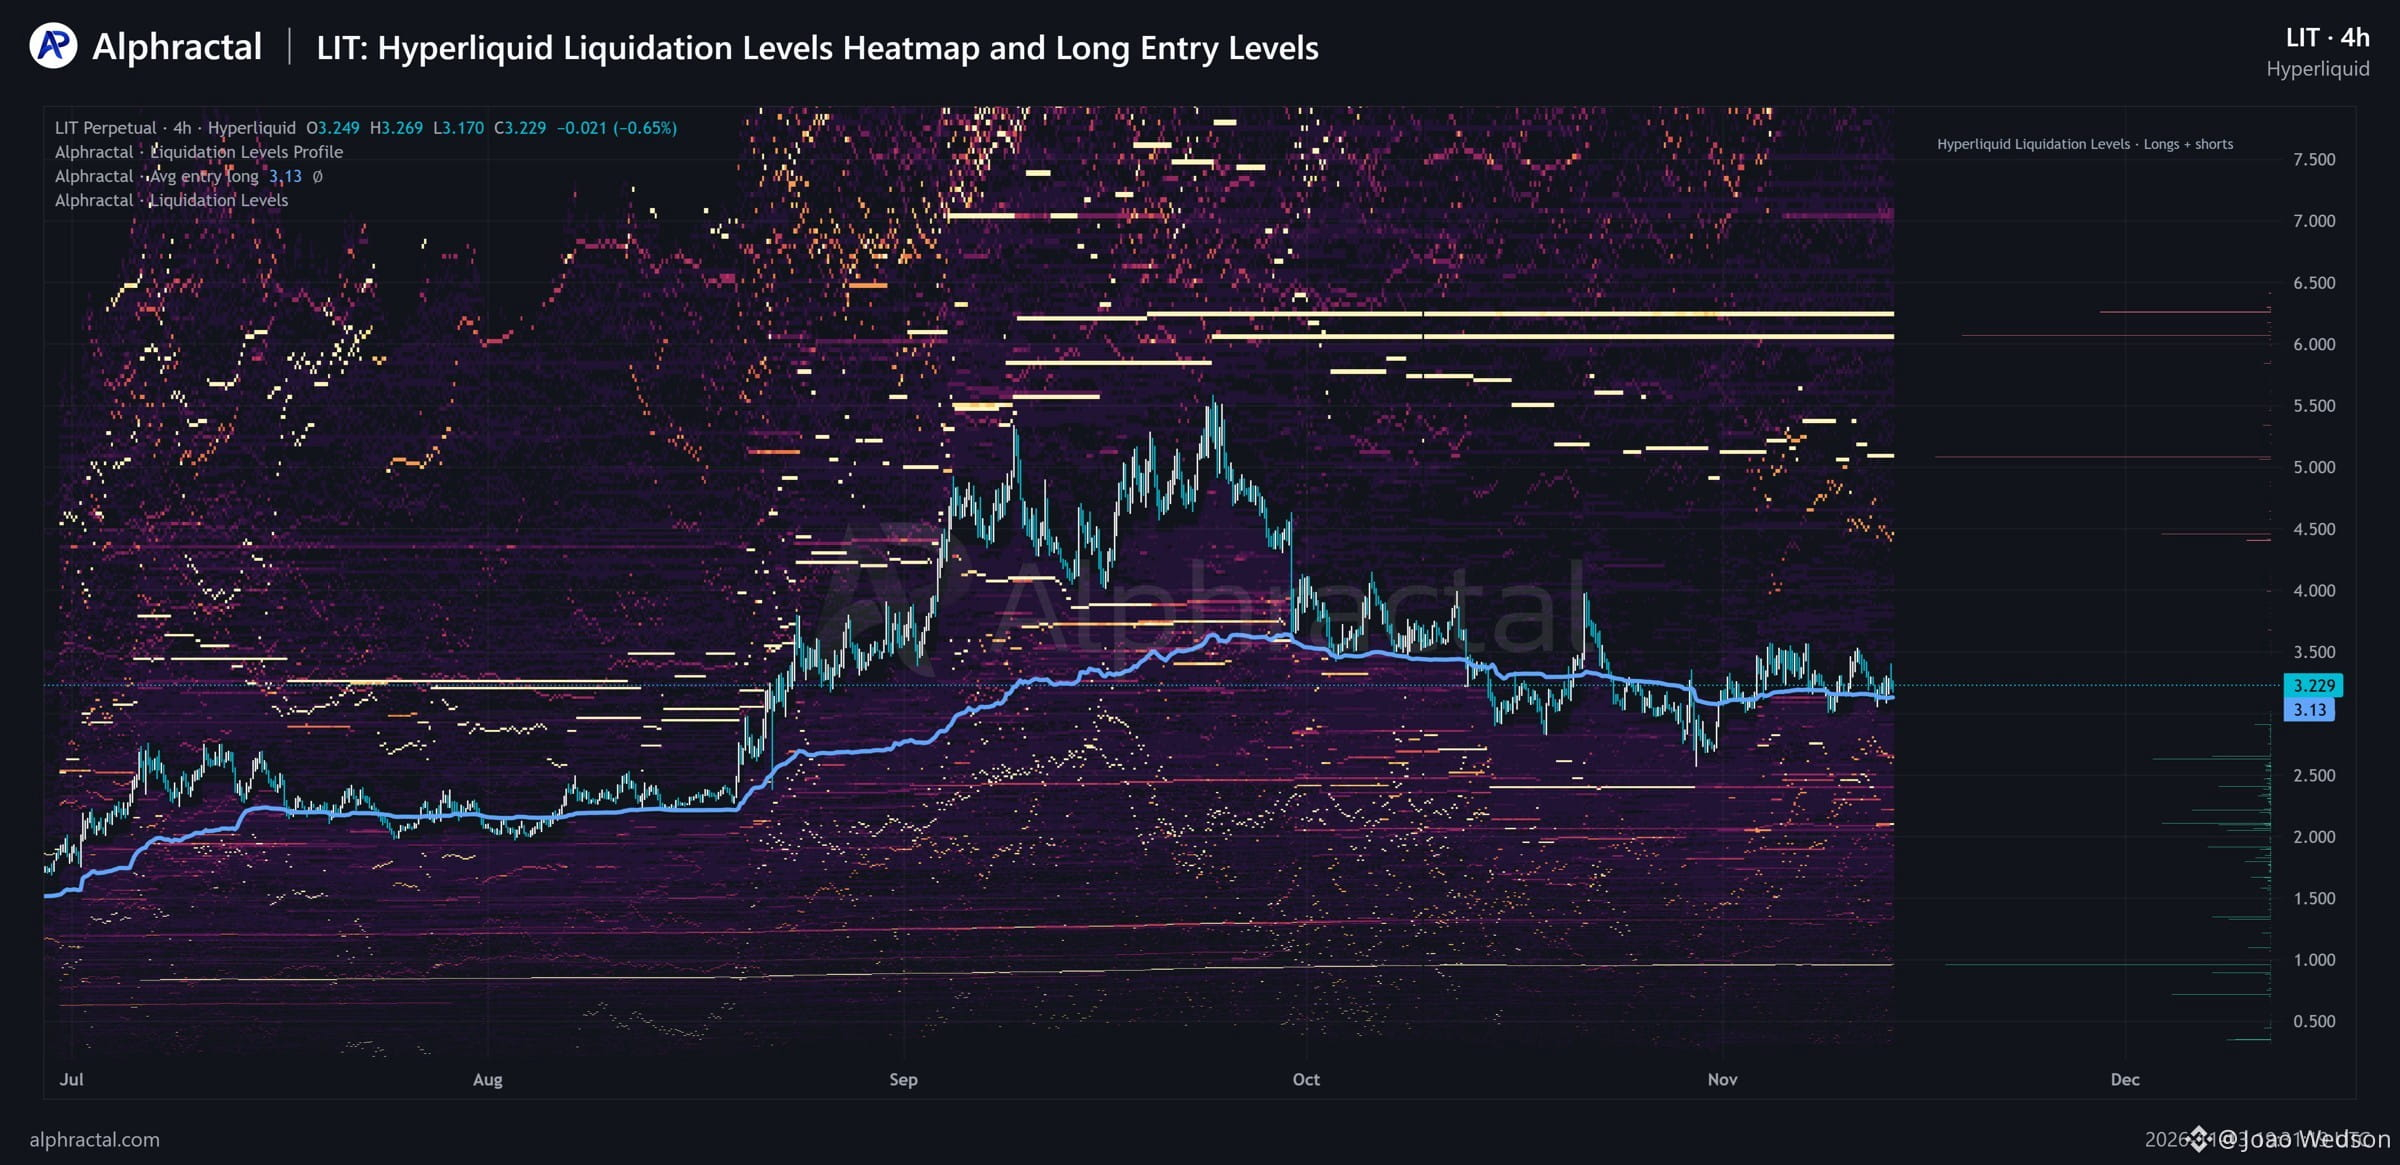
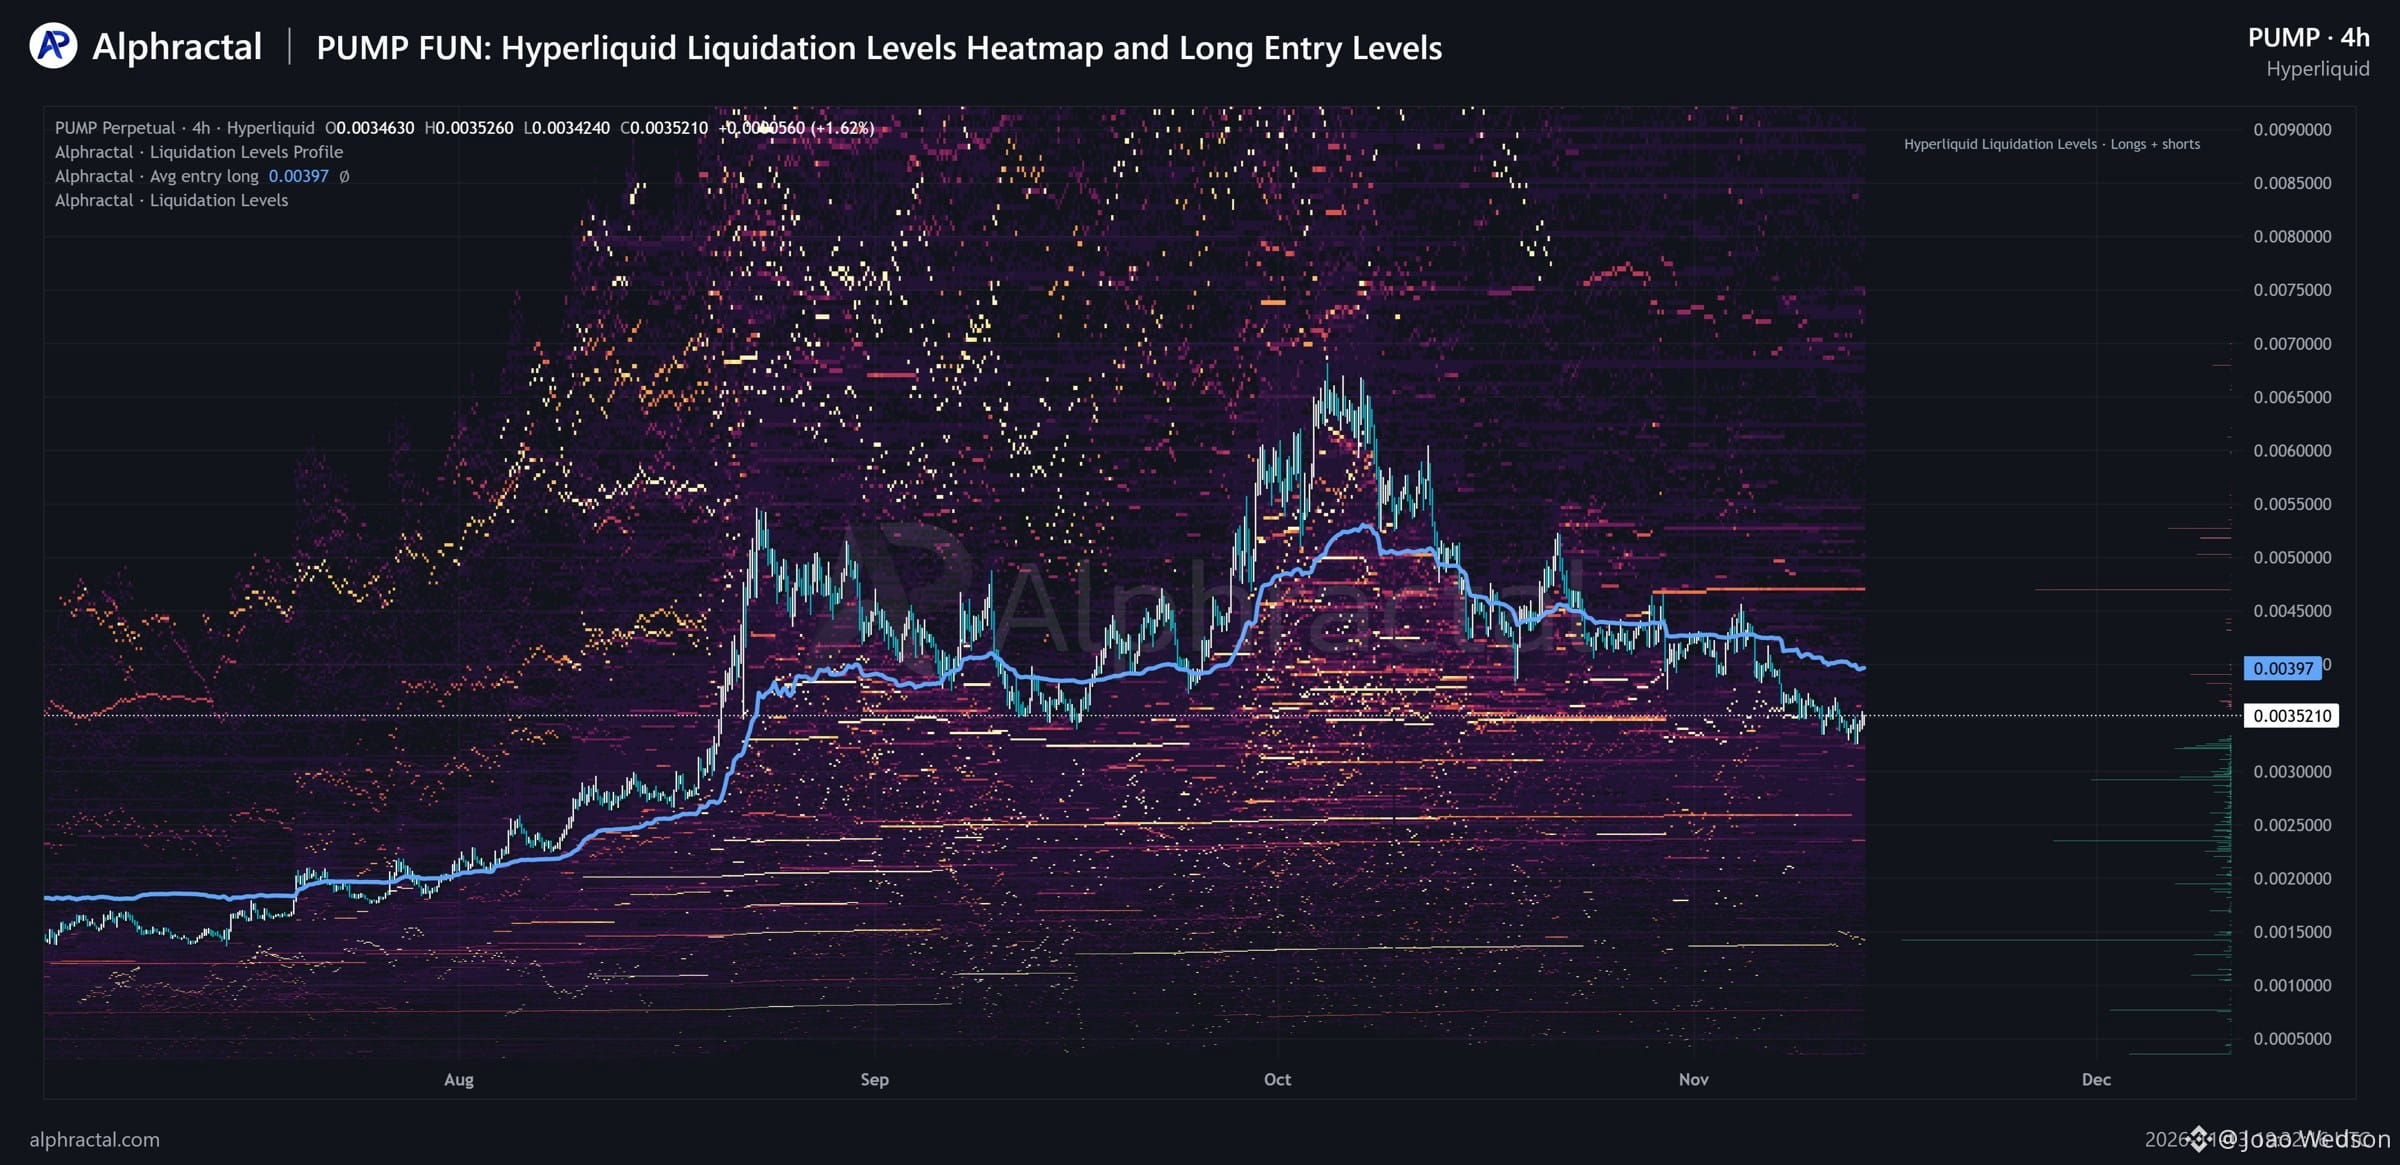
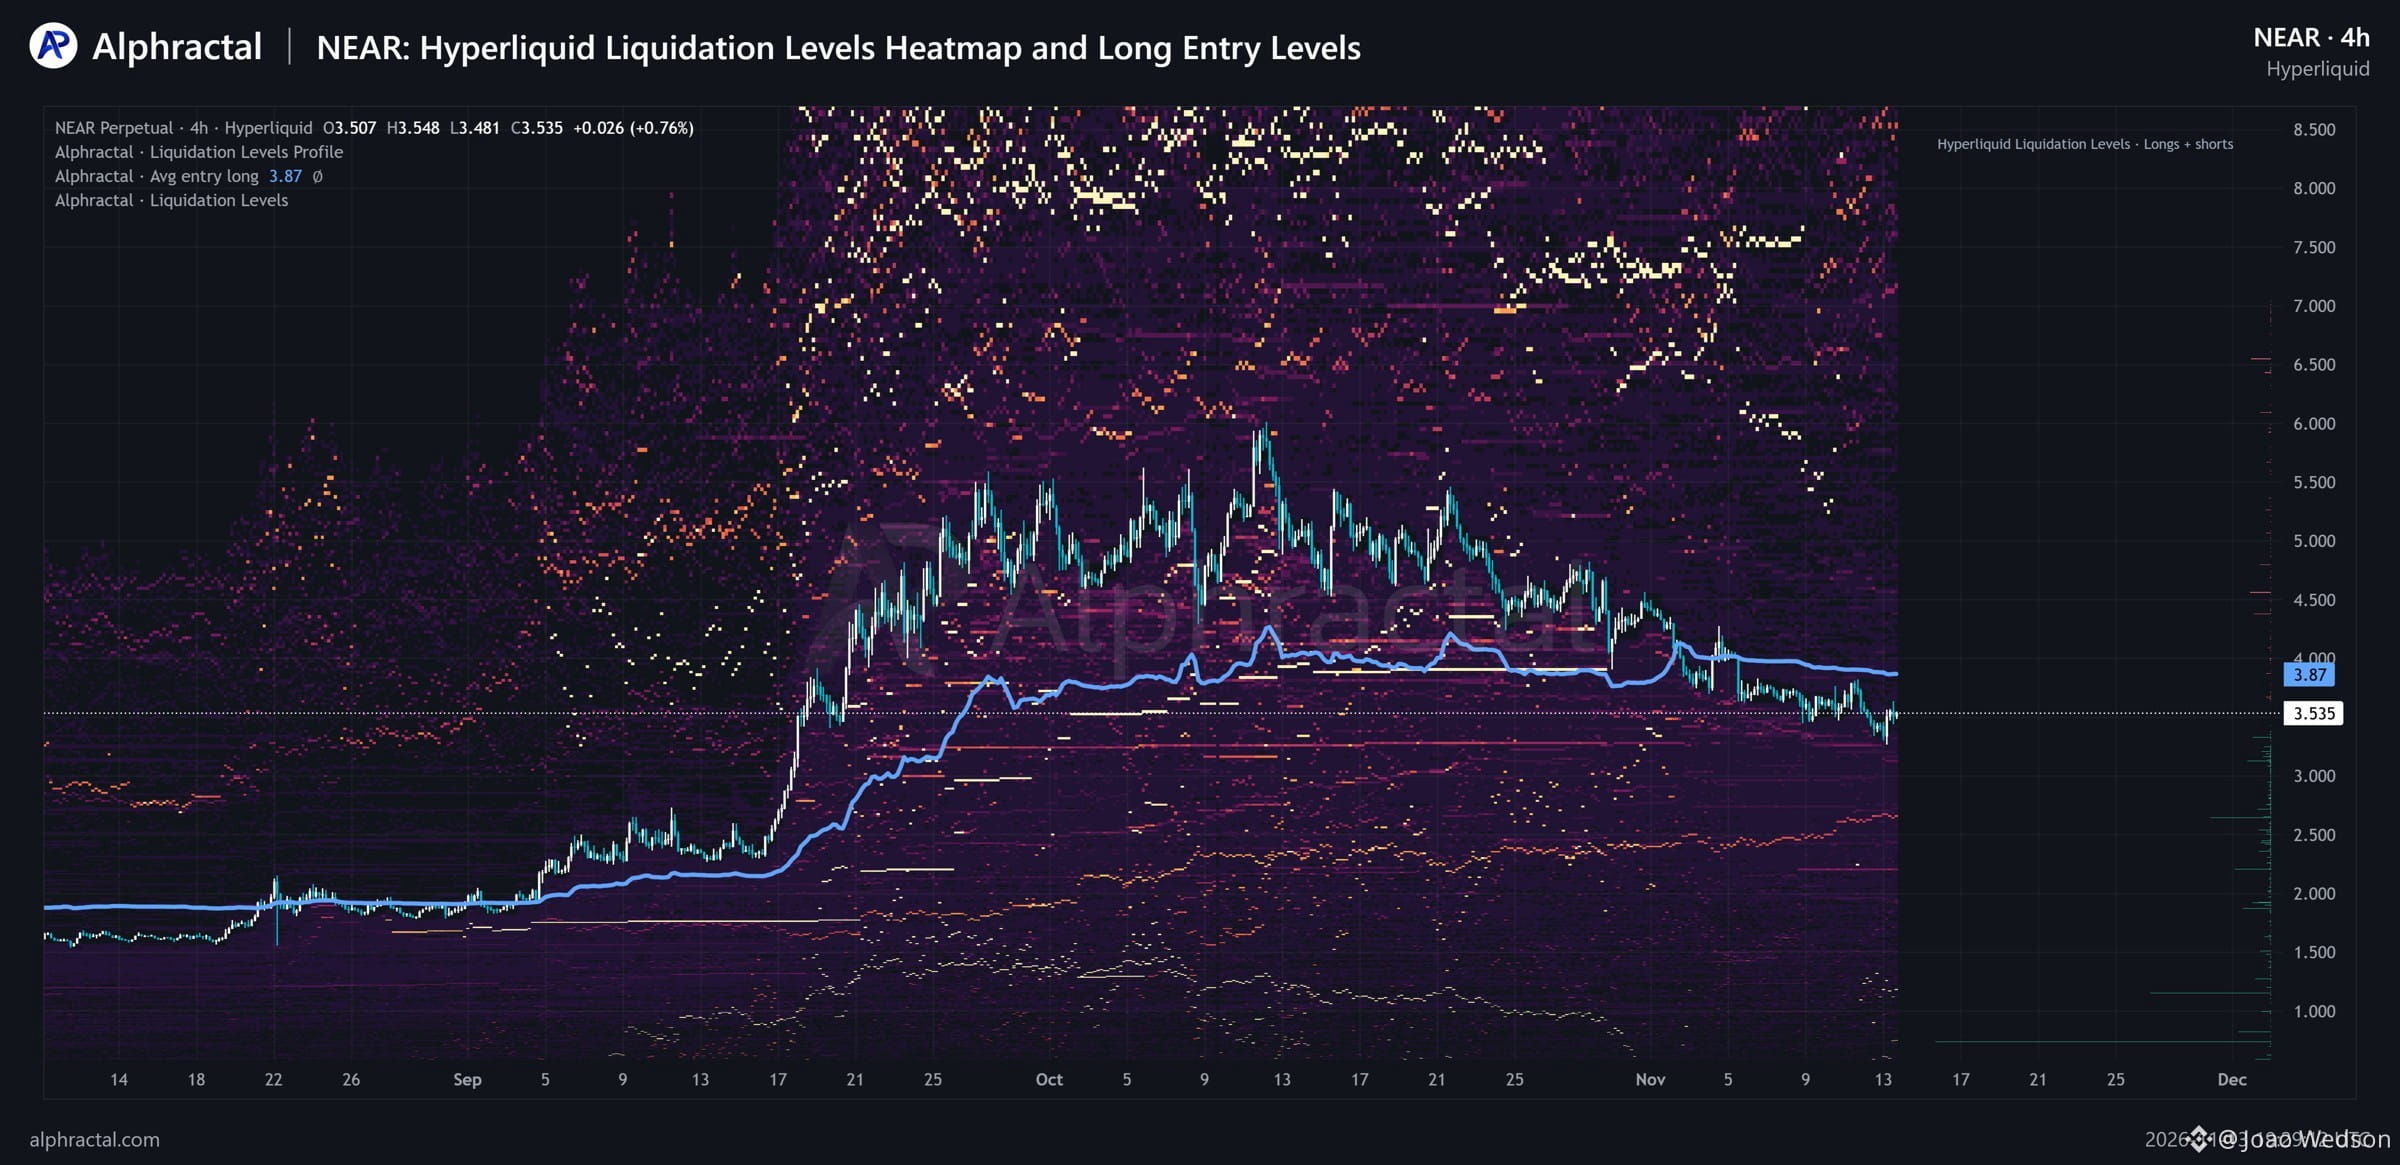
🚨 LONGS DOMINATE ACROSS 12 CRYPTO ASSETS ON HYPERLIQUID! (2/3) Average Long Entry Prices vs current market prices: - $PUMP: $0.00397 (12.75% above) - $LIT: $3.13 (3.07% below) - $XMR: $579.06 (9.39% above) - $NEAR: $3.87 (9.48% above) Why does this matter? The Average Long Entry Price is an important level to monitor because it can act as dynamic support or resistance. When prices trade above this level, it can serve as potential support. When prices fall below it, the same level can become resistance as underwater Long traders look for opportunities to exit near breakeven.
🚨 LONGS DOMINATE ACROSS 12 CRYPTO ASSETS ON HYPERLIQUID! (2/3) Average Long Entry Prices vs current market prices: - $PUMP: $0.00397 (12.75% above) - $LIT: $3.13 (3.07% below) - $XMR: $579.06 (9.39% above) - $NEAR: $3.87 (9.48% above) Why does this matter? The Average Long Entry Price is an important level to monitor because it can act as dynamic support or resistance. When prices trade above this level, it can serve as potential support. When prices fall below it, the same level can become resistance as underwater Long traders look for opportunities to exit near breakeven.
59
·
--
Переглянути переклад
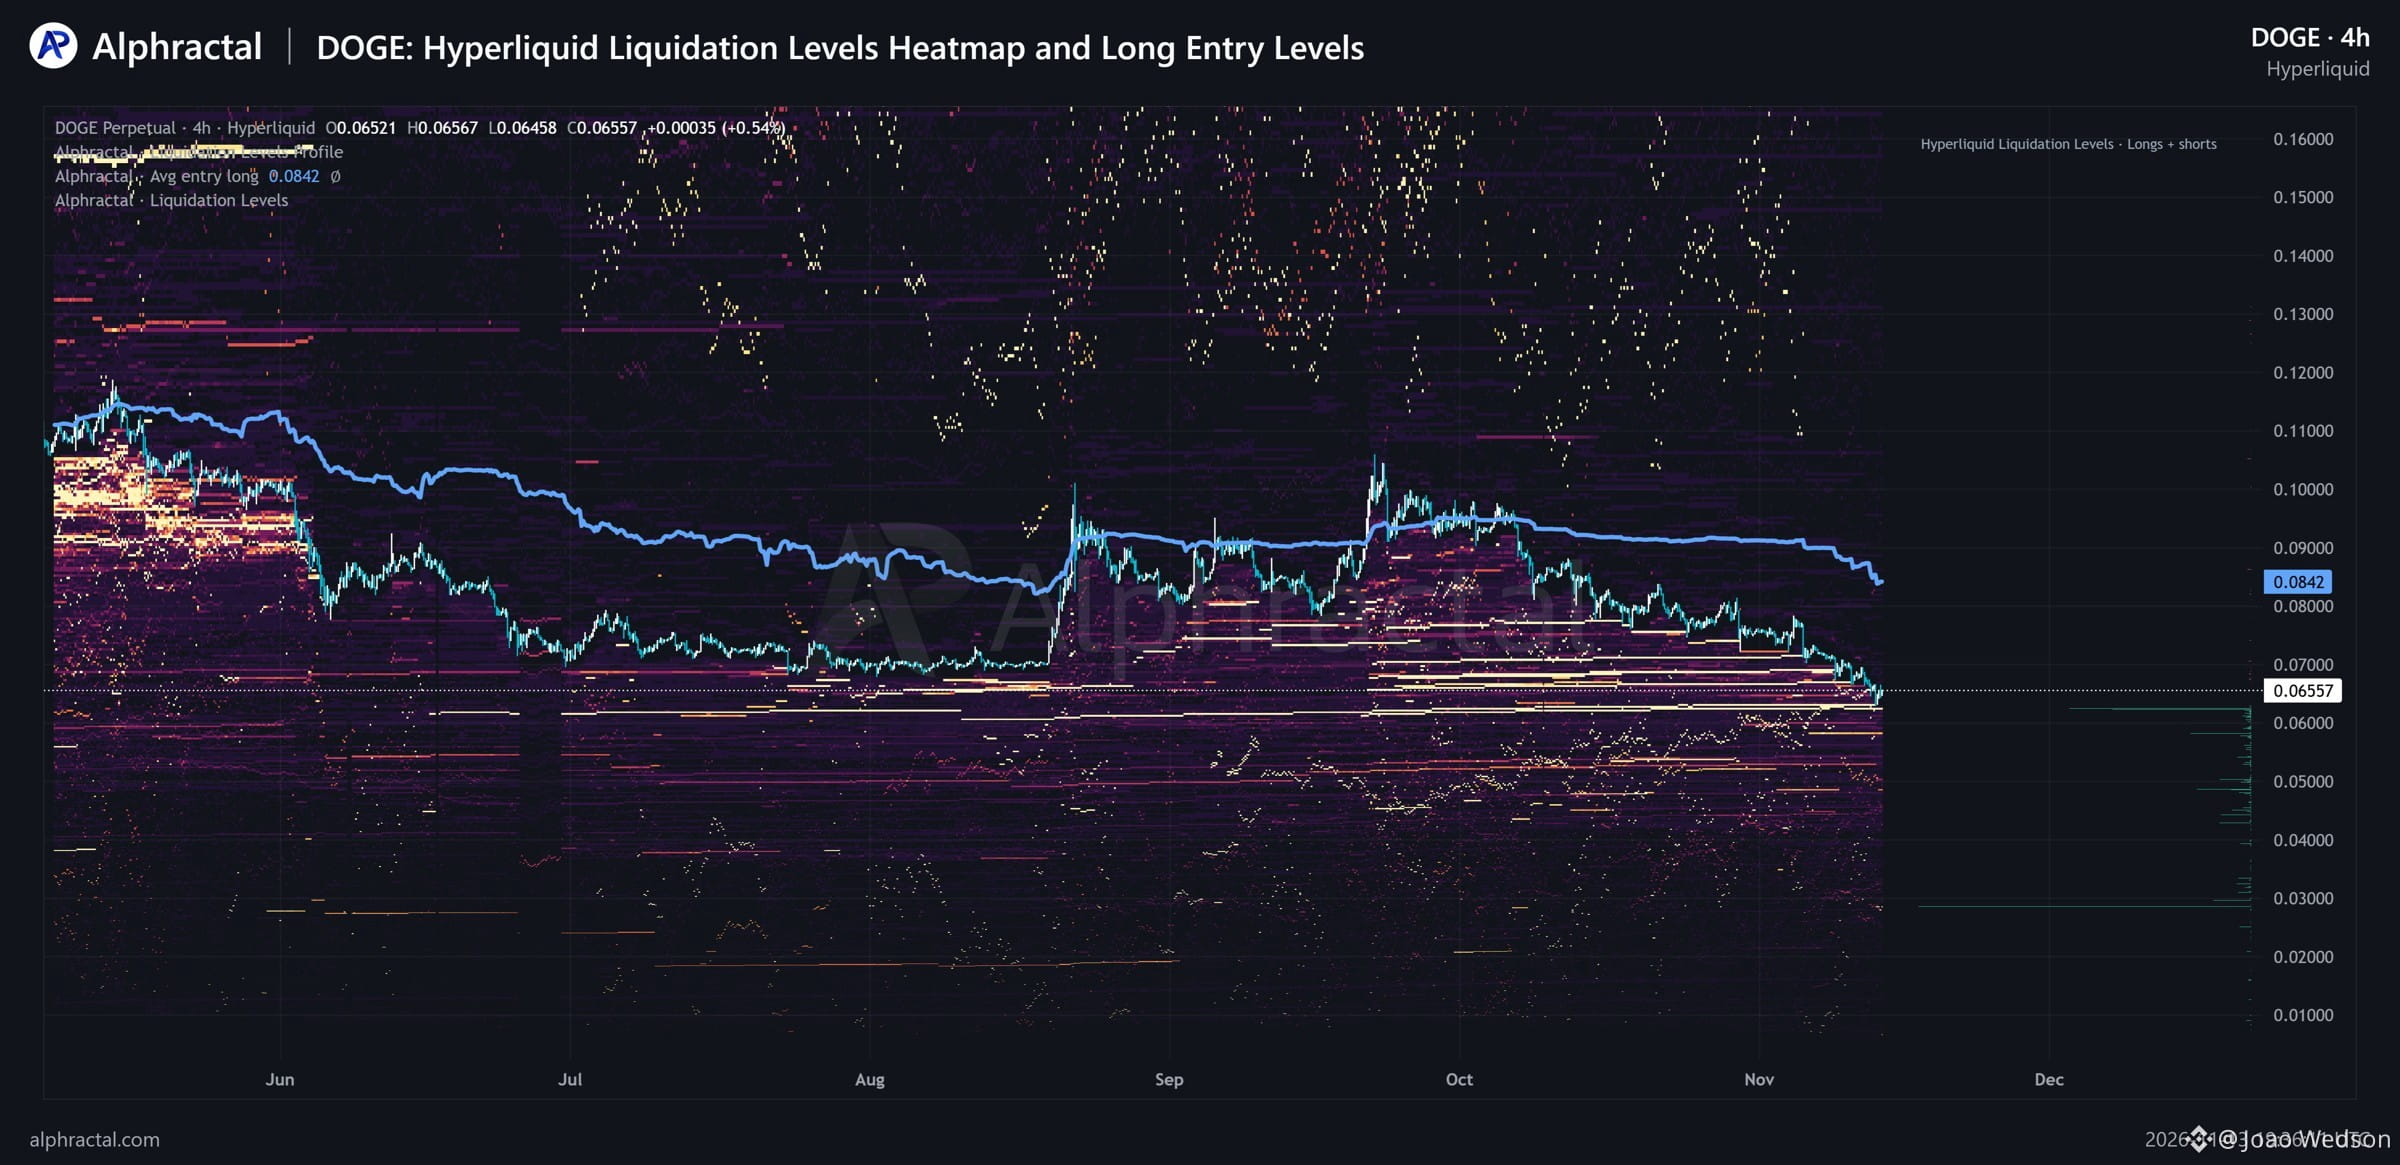
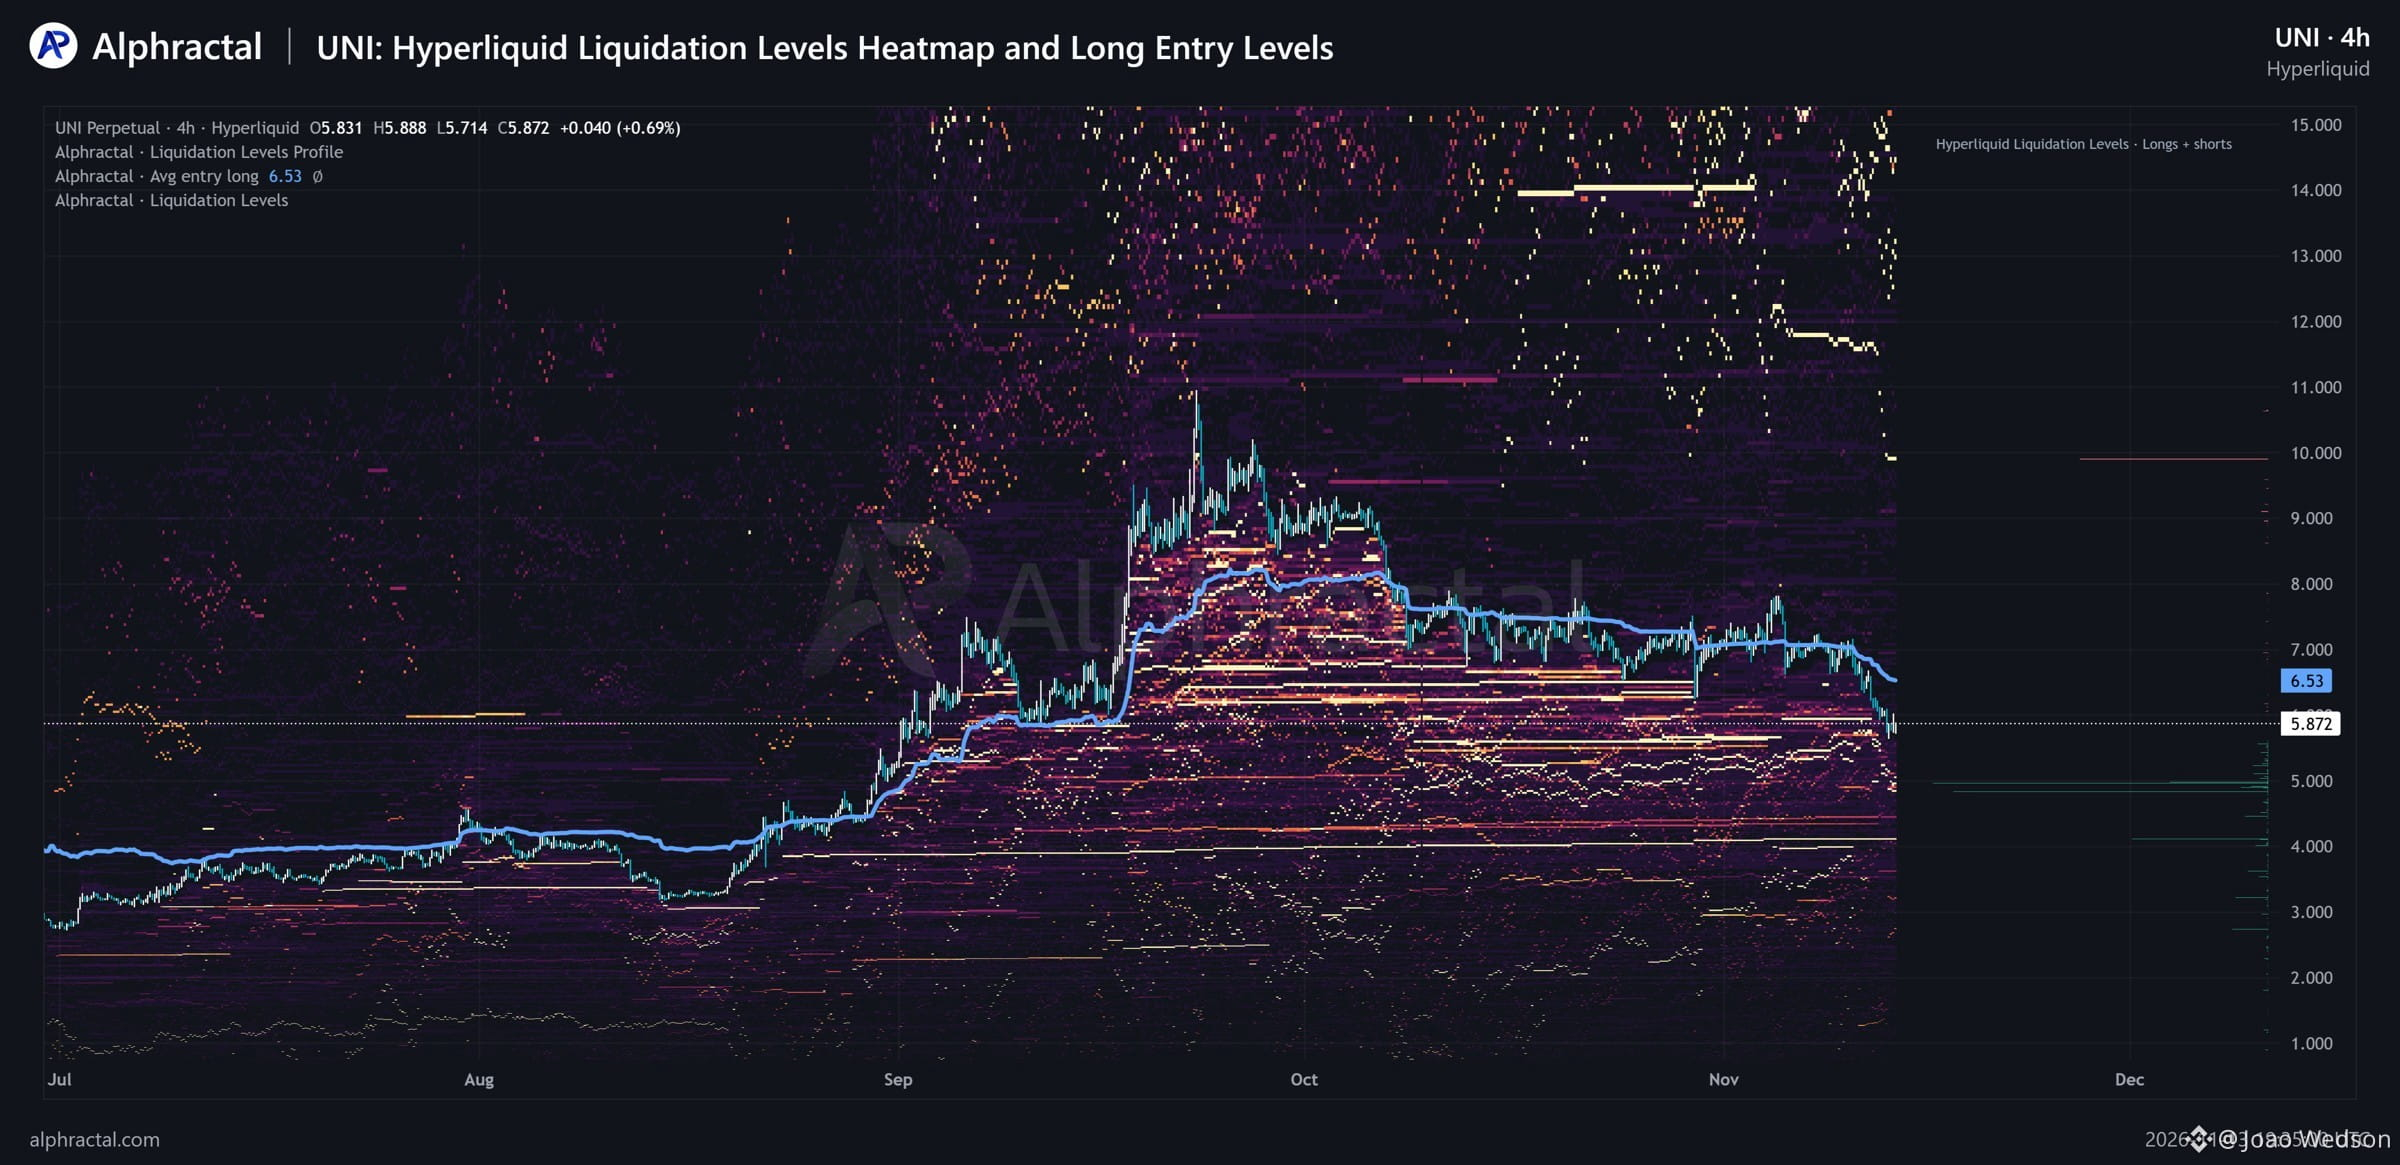
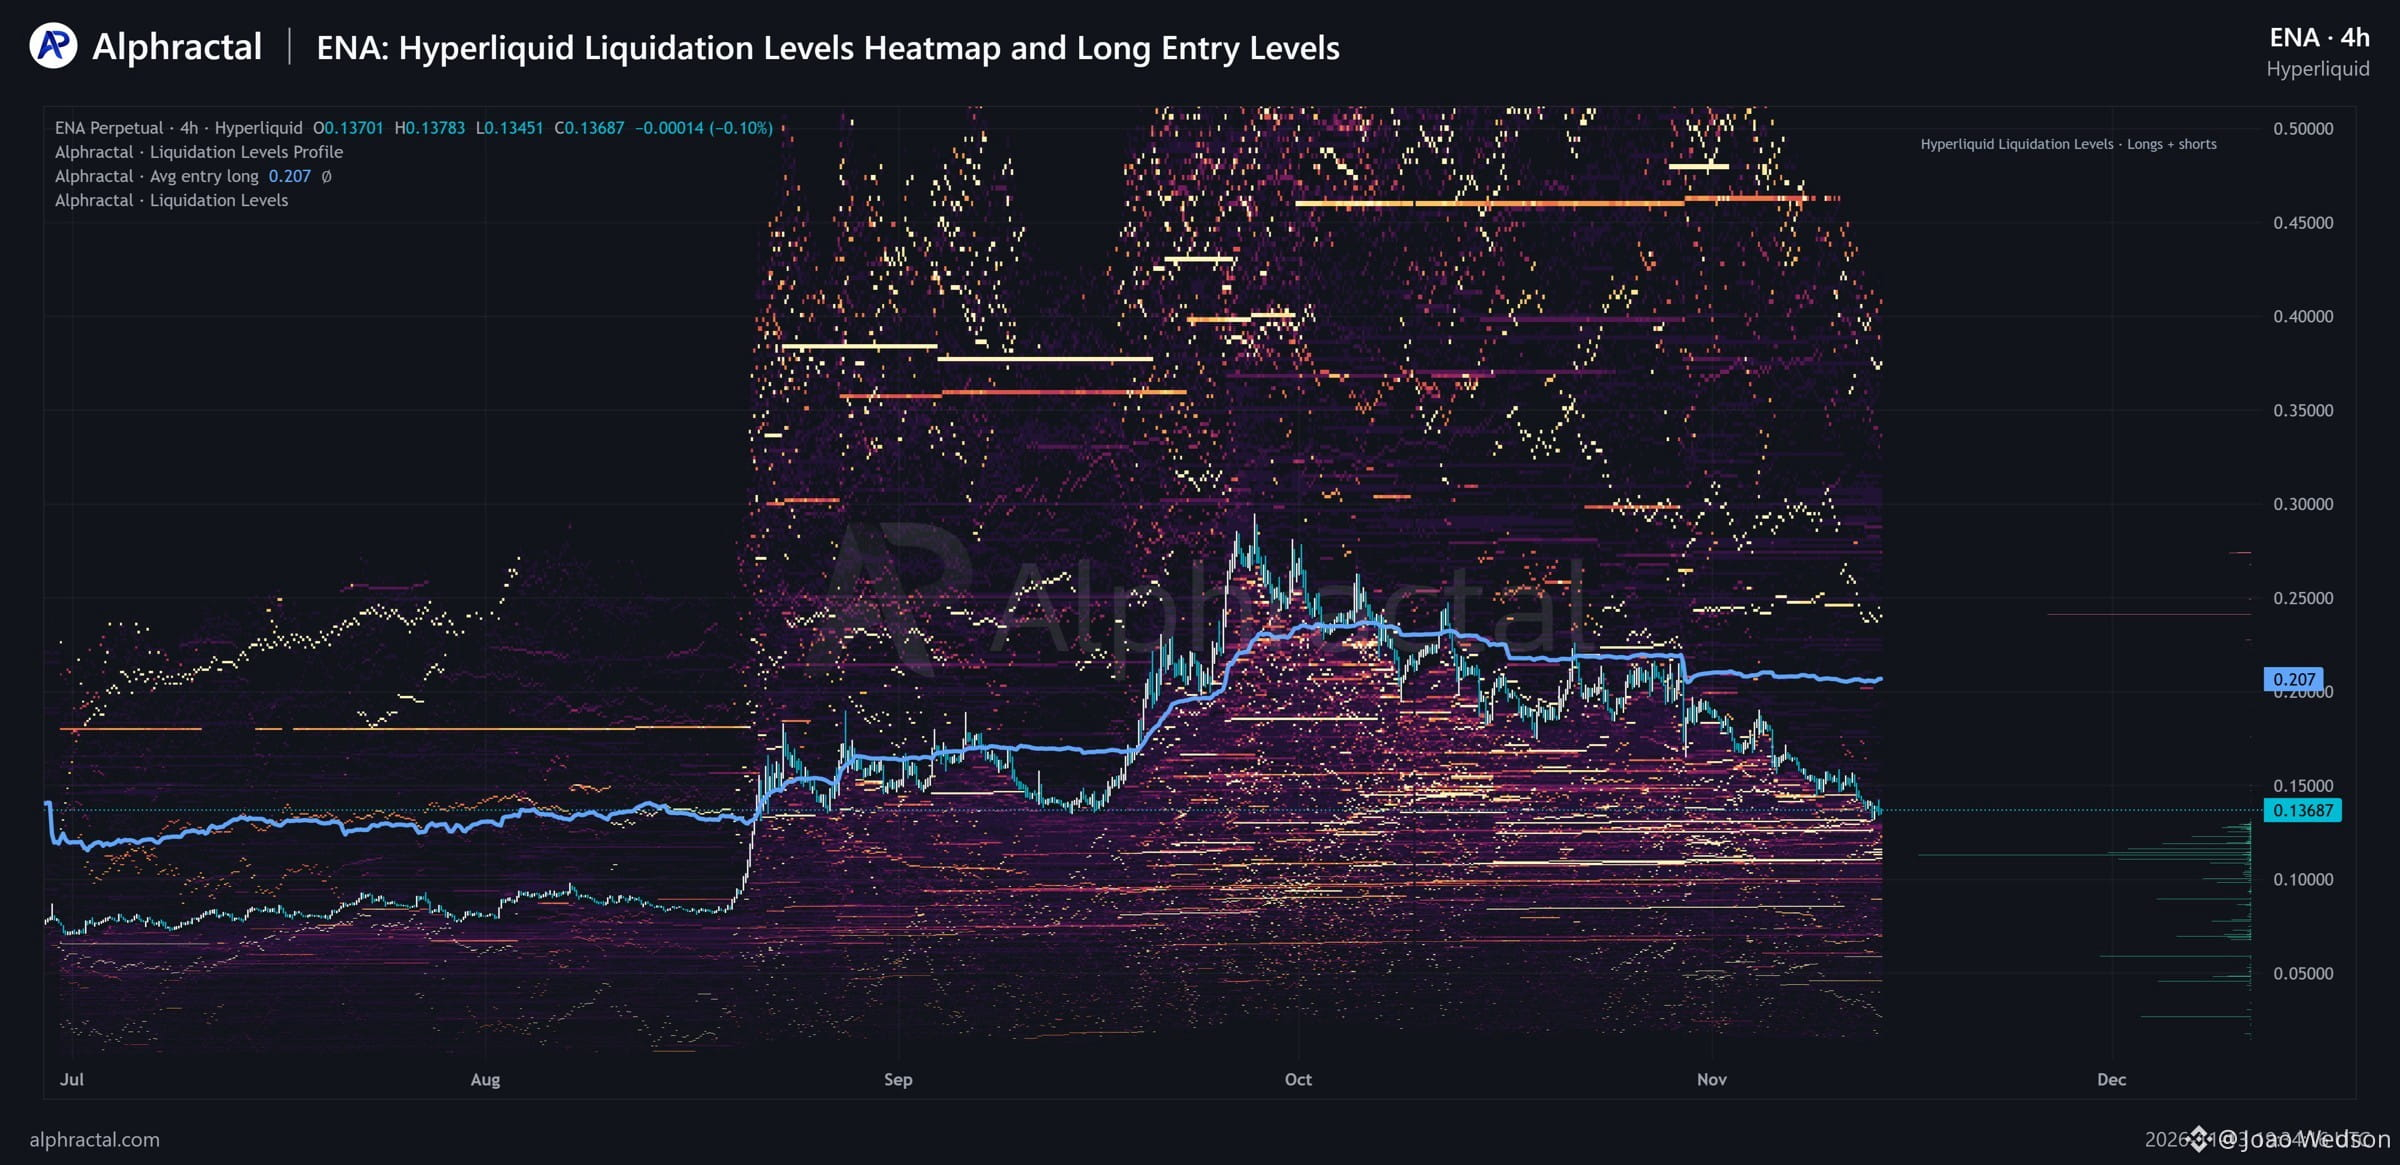
🚨 LONGS DOMINATE ACROSS 12 CRYPTO ASSETS ON HYPERLIQUID! (1/3) Something interesting is happening in the derivatives market. Our latest Alphractal data shows that Long positions dominate across these 12 assets on Hyperliquid, even as prices continue to decline. Here are the Average Long Entry Prices, including their percentage difference from current market prices: - $DOGE: $0.0842 (28.41% above current price) - $UNI: $6.53 (11.21% above) - $ENA: $0.207 (51.24% above) - $PEPE: $0.00477 (6.97% above, kPEPE contract)
🚨 LONGS DOMINATE ACROSS 12 CRYPTO ASSETS ON HYPERLIQUID! (1/3) Something interesting is happening in the derivatives market. Our latest Alphractal data shows that Long positions dominate across these 12 assets on Hyperliquid, even as prices continue to decline. Here are the Average Long Entry Prices, including their percentage difference from current market prices: - $DOGE: $0.0842 (28.41% above current price) - $UNI: $6.53 (11.21% above) - $ENA: $0.207 (51.24% above) - $PEPE: $0.00477 (6.97% above, kPEPE contract)
80
·
--
Переглянути переклад
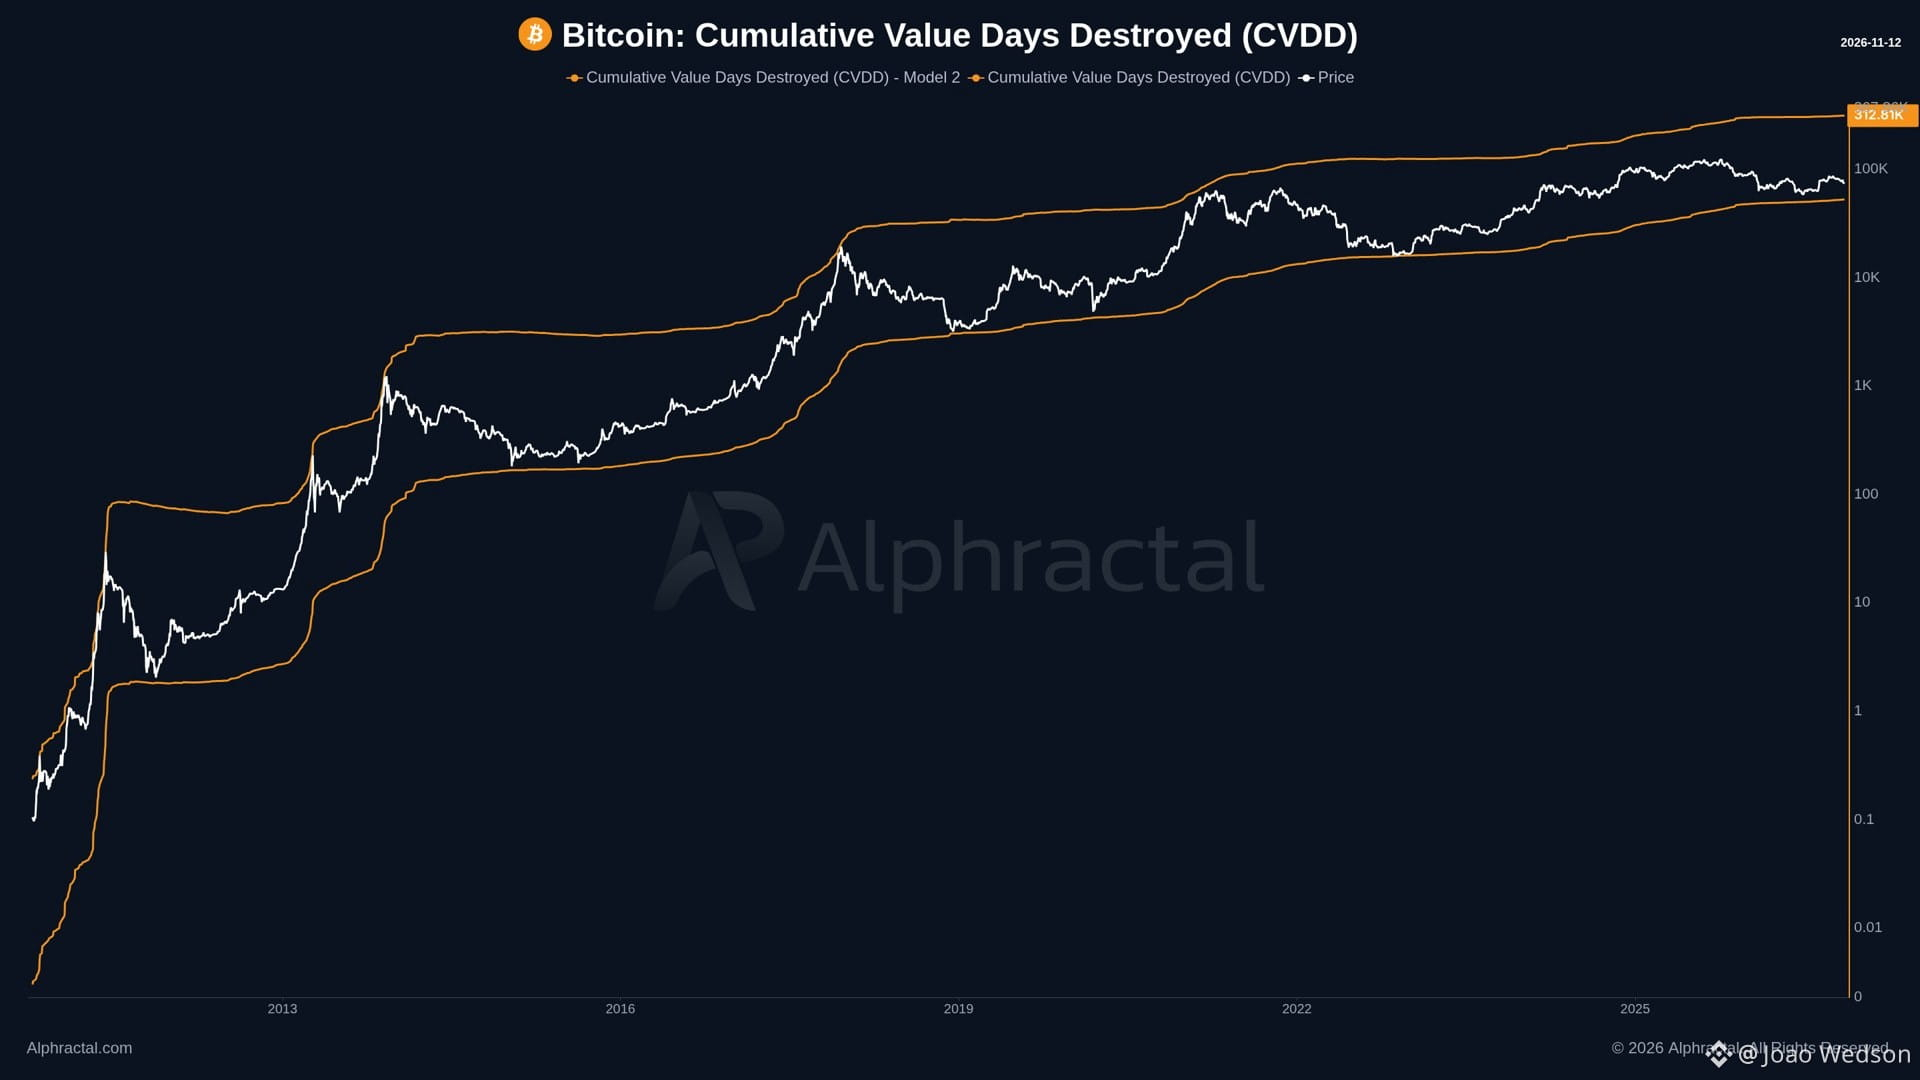
CVDD, historically the most accurate Bitcoin bottom metric, is sitting at $52.7K right now! Alphractal's Cumulative Value Days Destroyed shows BTC ($72.5K) still 37.7% above it. A full retest would mean a ~27% drop from here. Every major bottom met it: 🔴 Jan 2015: low $152 vs CVDD $168 (~9% below) 🔴 Dec 2018: low $3,122 vs CVDD $3,060 (~2% above) 🔴 Mar 2020: low $3,850 vs CVDD $4,280 (~10% below) 🔴 Nov 2022: low $15,479 vs CVDD $15,900 (~3% below) So is this time different, or is it just a matter of time? Keep in mind CVDD isn't a fixed line. It's dynamic and moves every day with on-chain activity, as old coins change hands. The longer the market drifts, the higher it climbs toward price. Follow the data, not the narrative.
CVDD, historically the most accurate Bitcoin bottom metric, is sitting at $52.7K right now! Alphractal's Cumulative Value Days Destroyed shows BTC ($72.5K) still 37.7% above it. A full retest would mean a ~27% drop from here. Every major bottom met it: 🔴 Jan 2015: low $152 vs CVDD $168 (~9% below) 🔴 Dec 2018: low $3,122 vs CVDD $3,060 (~2% above) 🔴 Mar 2020: low $3,850 vs CVDD $4,280 (~10% below) 🔴 Nov 2022: low $15,479 vs CVDD $15,900 (~3% below) So is this time different, or is it just a matter of time? Keep in mind CVDD isn't a fixed line. It's dynamic and moves every day with on-chain activity, as old coins change hands. The longer the market drifts, the higher it climbs toward price. Follow the data, not the narrative.
29
·
--
Переглянути переклад
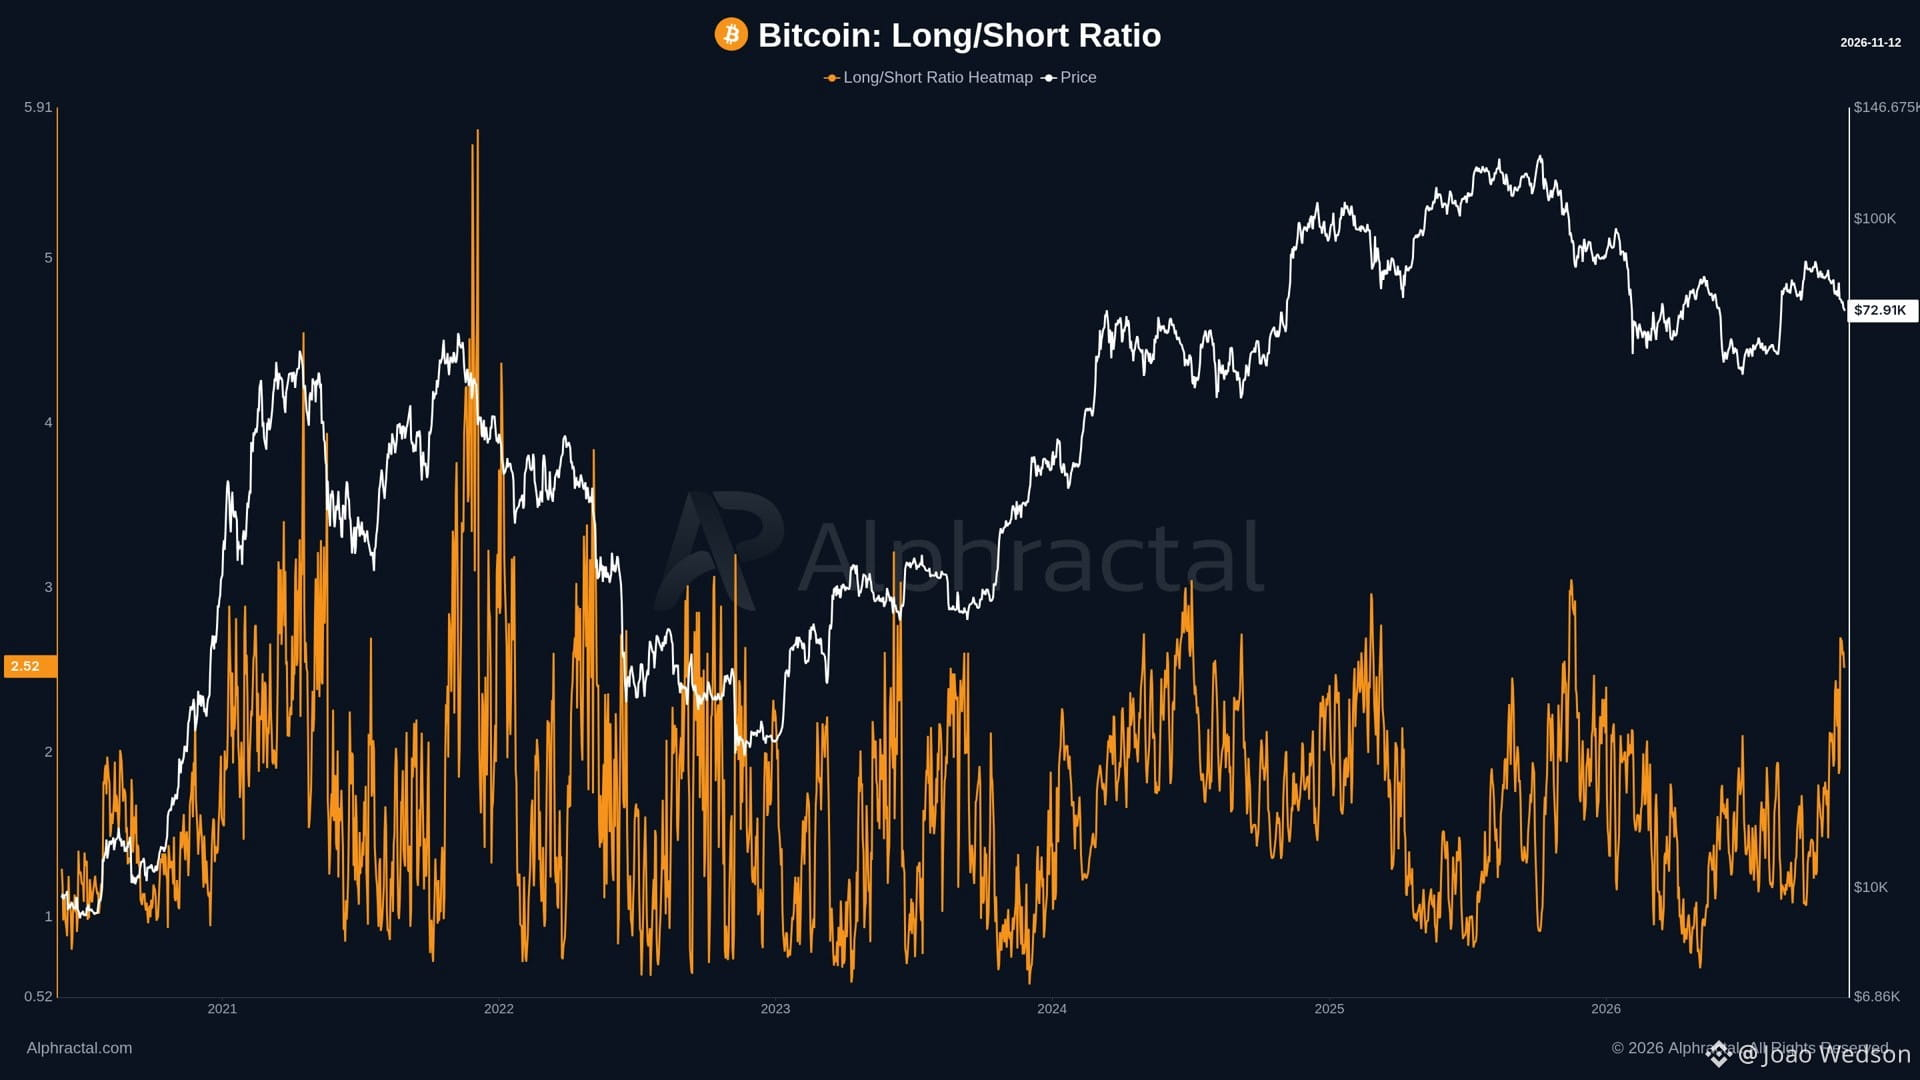
Everyone on X is talking about "record shorts." The data says the opposite! Alphractal's Bitcoin Long/Short Ratio just hit 2.52, up 32% in 7 days, near the top of its 2024–2026 range. 🟢 Long/Short Ratio: 2.52 (+32% 7d) 🔴 BTC: $72.9K, down from $74.8K on Nov 8 • Funding rate: still positive • Open Interest: $43.37B (−2.4% 7d) Price is falling while traders keep adding longs. That's not capitulation, it's dip-buying with leverage. Historically, spikes in this ratio during drawdowns have left the market vulnerable to long squeezes before a real bottom forms. That said, a high ratio isn't a timing signal on its own. If BTC holds the $72K–$74K zone, these longs can become fuel for a bounce. Follow the data, not the narrative.
Everyone on X is talking about "record shorts." The data says the opposite! Alphractal's Bitcoin Long/Short Ratio just hit 2.52, up 32% in 7 days, near the top of its 2024–2026 range. 🟢 Long/Short Ratio: 2.52 (+32% 7d) 🔴 BTC: $72.9K, down from $74.8K on Nov 8 • Funding rate: still positive • Open Interest: $43.37B (−2.4% 7d) Price is falling while traders keep adding longs. That's not capitulation, it's dip-buying with leverage. Historically, spikes in this ratio during drawdowns have left the market vulnerable to long squeezes before a real bottom forms. That said, a high ratio isn't a timing signal on its own. If BTC holds the $72K–$74K zone, these longs can become fuel for a bounce. Follow the data, not the narrative.
39
·
--
Переглянути переклад
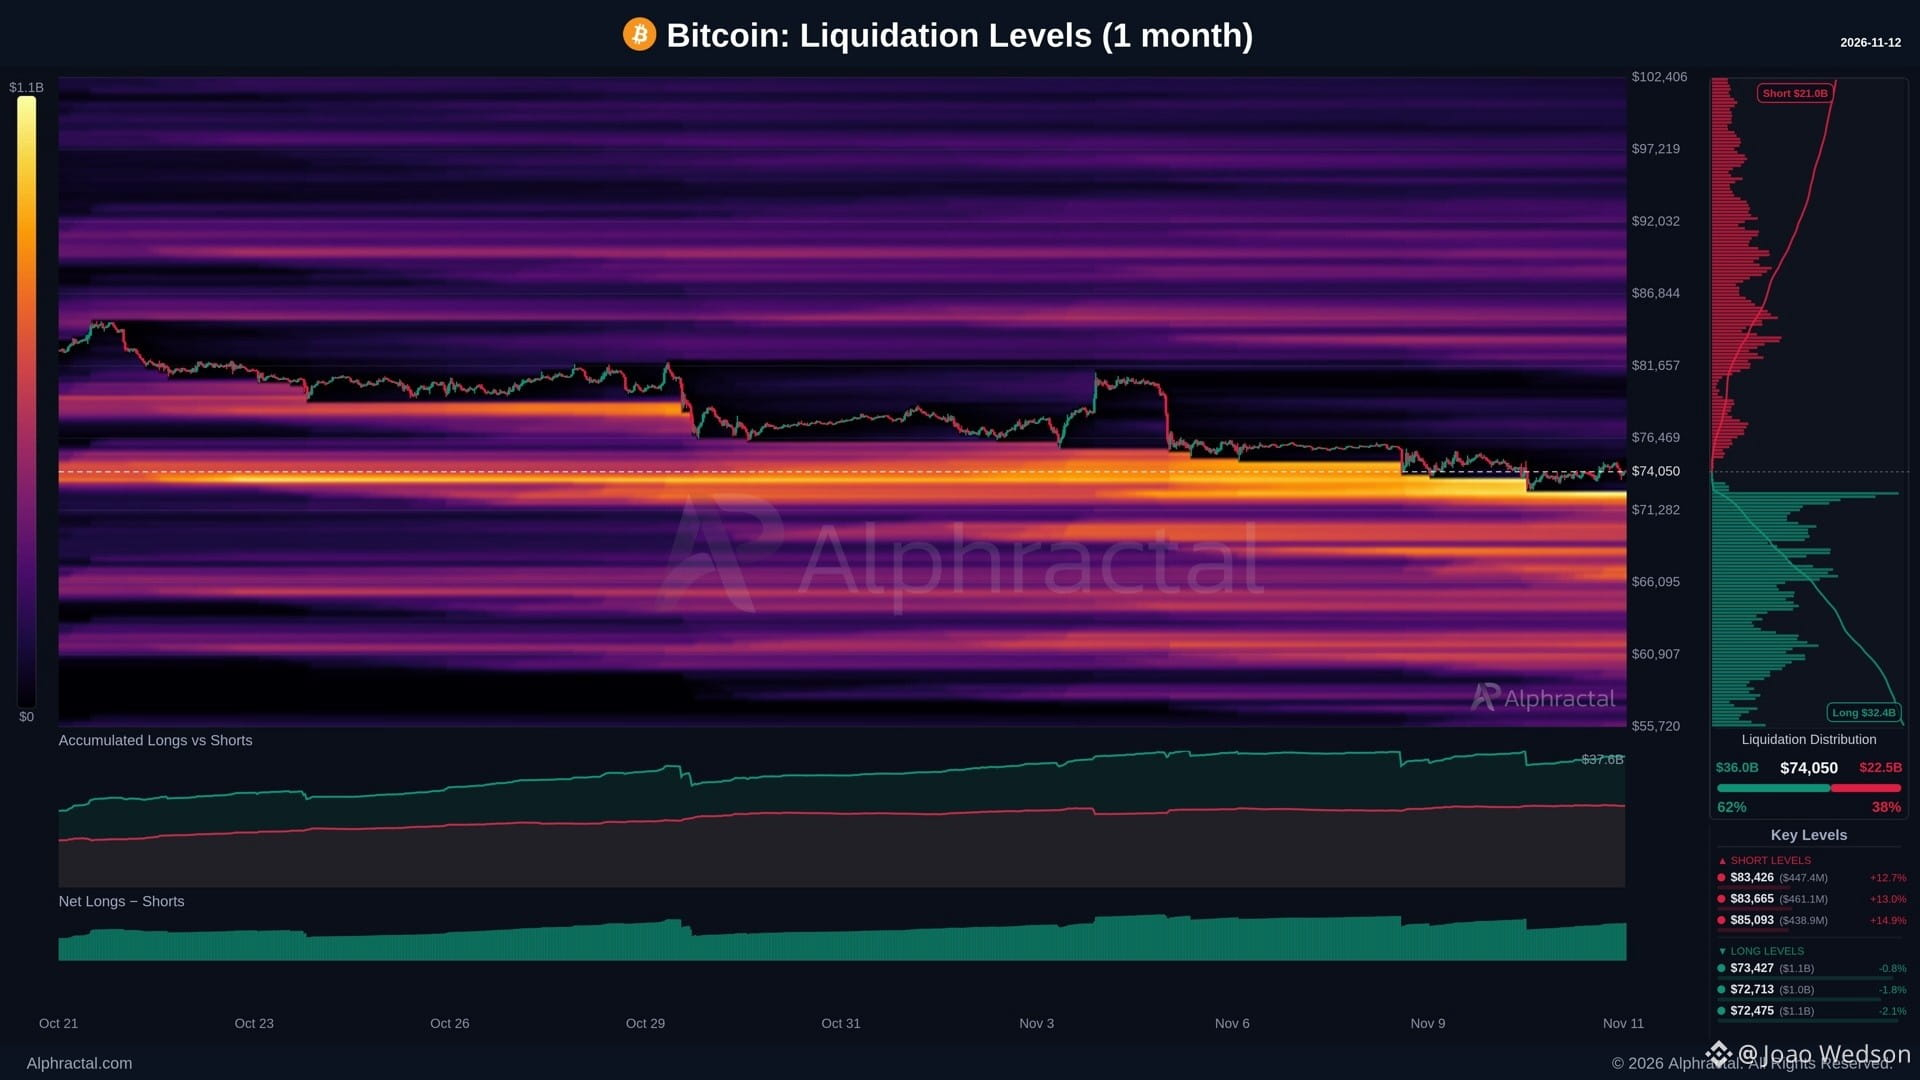
Bitcoin is sitting right on top of a long liquidation wall! Alphractal's Liquidation Levels show the market is clearly long-heavy: 🟢 Longs at risk: $36.0B (62%) 🔴 Shorts at risk: $22.5B (38%) The densest clusters are just below price ($74,050): • $73,427, about $1.1B (−0.8%) • $72,713, about $1.0B (−1.8%) • $72,475, about $1.1B (−2.1%) On the other side, the first meaningful short clusters only appear around $83.4K–$85.1K, 12–15% away. When this much leverage piles up this close to price, liquidity tends to be hunted first. A clean break below $72.5K could trigger a cascade of more than $1B in long liquidations. That said, liquidation maps show where the fuel is, not where price must go. Follow the data, not the narrative.
Bitcoin is sitting right on top of a long liquidation wall! Alphractal's Liquidation Levels show the market is clearly long-heavy: 🟢 Longs at risk: $36.0B (62%) 🔴 Shorts at risk: $22.5B (38%) The densest clusters are just below price ($74,050): • $73,427, about $1.1B (−0.8%) • $72,713, about $1.0B (−1.8%) • $72,475, about $1.1B (−2.1%) On the other side, the first meaningful short clusters only appear around $83.4K–$85.1K, 12–15% away. When this much leverage piles up this close to price, liquidity tends to be hunted first. A clean break below $72.5K could trigger a cascade of more than $1B in long liquidations. That said, liquidation maps show where the fuel is, not where price must go. Follow the data, not the narrative.
73
·
--
Переглянути переклад
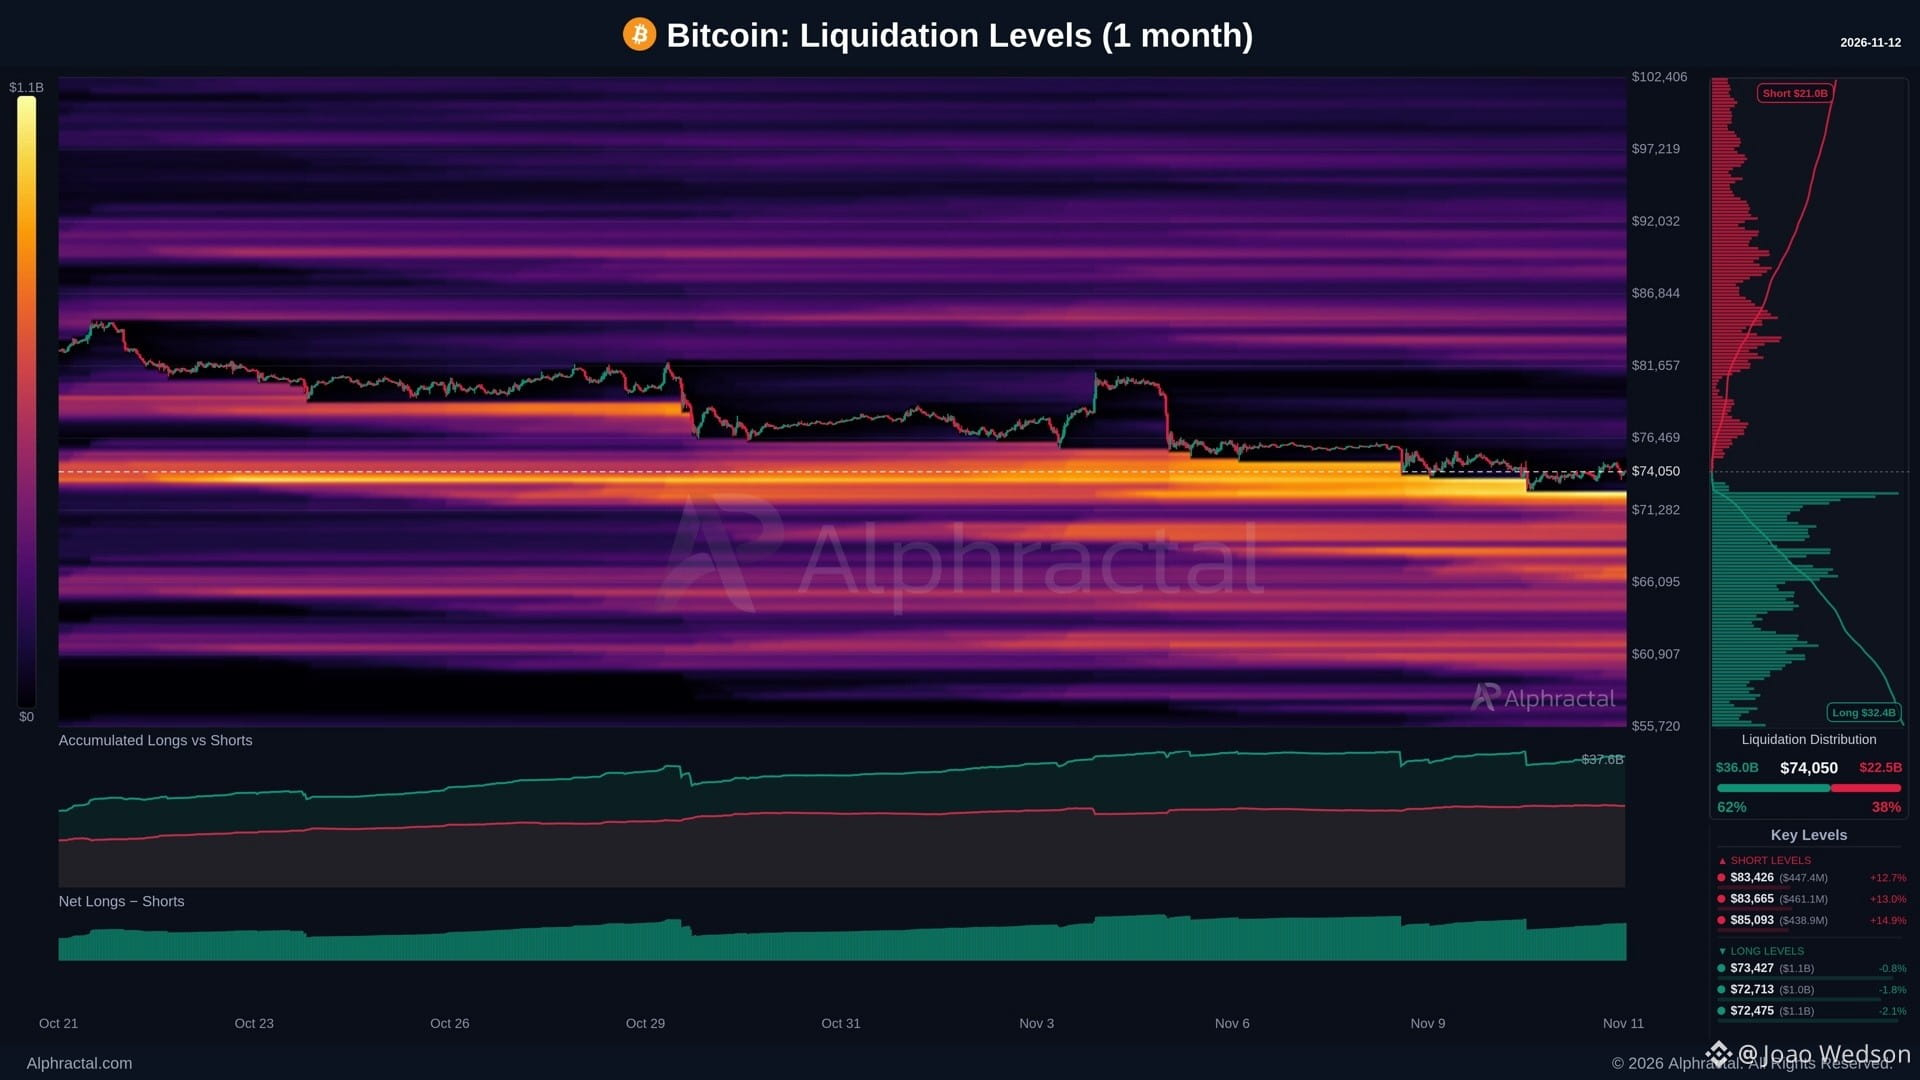
Bitcoin is sitting right on top of a long liquidation wall!
Alphractal's Liquidation Levels show the market is clearly long-heavy:
🟢 Longs at risk: $36.0B (62%)
🔴 Shorts at risk: $22.5B (38%)
The densest clusters are just below price ($74,050):
• $73,427, about $1.1B (−0.8%)
• $72,713, about $1.0B (−1.8%)
• $72,475, about $1.1B (−2.1%)
On the other side, the first meaningful short clusters only appear around $83.4K–$85.1K, 12–15% away.
When this much leverage piles up this close to price, liquidity tends to be hunted first. A clean break below $72.5K could trigger a cascade of more than $1B in long liquidations.
That said, liquidation maps show where the fuel is, not where price must go.
Follow the data, not the narrative.
Bitcoin is sitting right on top of a long liquidation wall!
Alphractal's Liquidation Levels show the market is clearly long-heavy:
🟢 Longs at risk: $36.0B (62%)
🔴 Shorts at risk: $22.5B (38%)
The densest clusters are just below price ($74,050):
• $73,427, about $1.1B (−0.8%)
• $72,713, about $1.0B (−1.8%)
• $72,475, about $1.1B (−2.1%)
On the other side, the first meaningful short clusters only appear around $83.4K–$85.1K, 12–15% away.
When this much leverage piles up this close to price, liquidity tends to be hunted first. A clean break below $72.5K could trigger a cascade of more than $1B in long liquidations.
That said, liquidation maps show where the fuel is, not where price must go.
Follow the data, not the narrative.
Alphractal's Liquidation Levels show the market is clearly long-heavy:
🟢 Longs at risk: $36.0B (62%)
🔴 Shorts at risk: $22.5B (38%)
The densest clusters are just below price ($74,050):
• $73,427, about $1.1B (−0.8%)
• $72,713, about $1.0B (−1.8%)
• $72,475, about $1.1B (−2.1%)
On the other side, the first meaningful short clusters only appear around $83.4K–$85.1K, 12–15% away.
When this much leverage piles up this close to price, liquidity tends to be hunted first. A clean break below $72.5K could trigger a cascade of more than $1B in long liquidations.
That said, liquidation maps show where the fuel is, not where price must go.
Follow the data, not the narrative.
75
·
--
Переглянути переклад
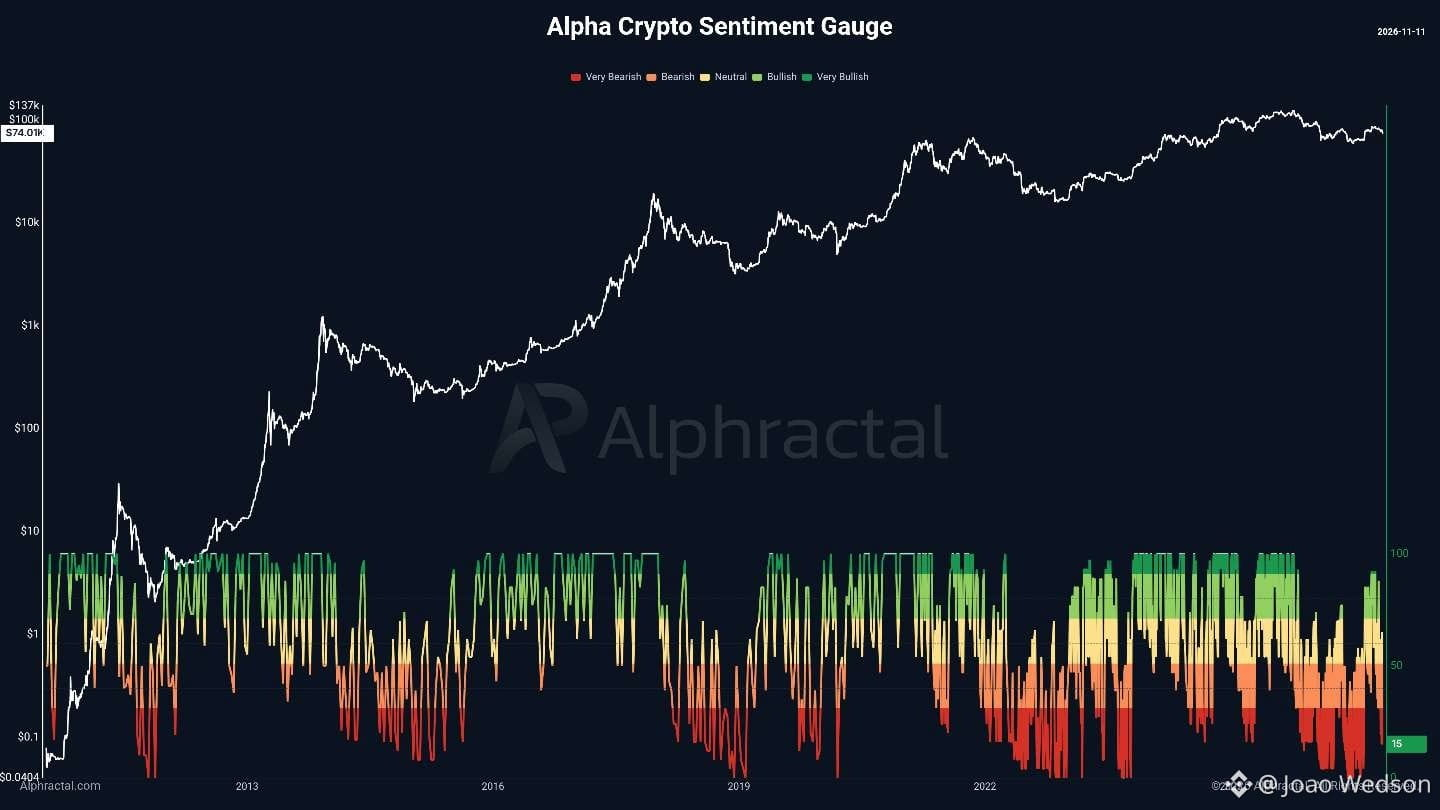
Let's talk about crypto market sentiment.
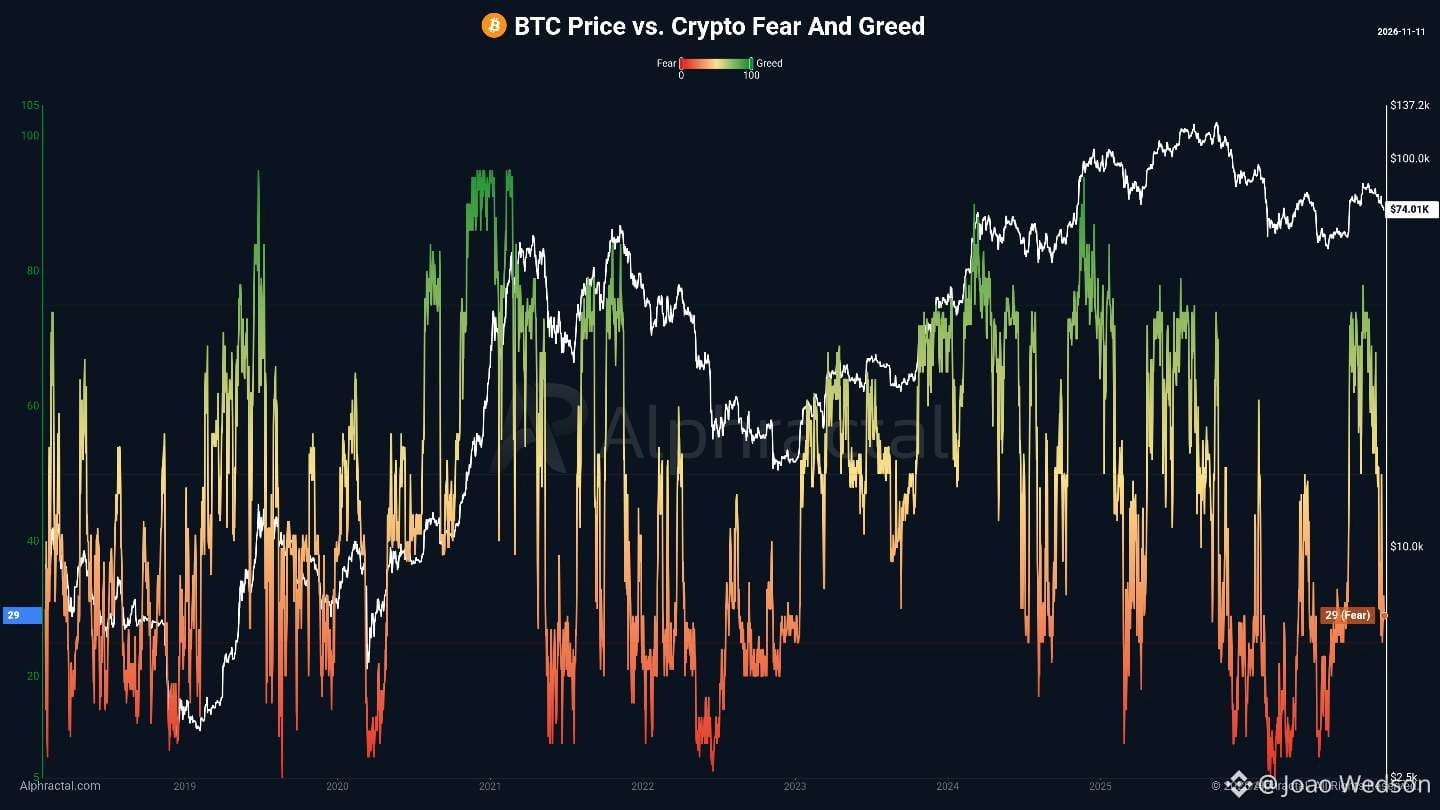
• Crypto Fear & Greed: 29 (Fear).
• Alphractal's Alpha Crypto Sentiment Gauge: 15 (Very Bearish), reflecting news and social media sentiment.
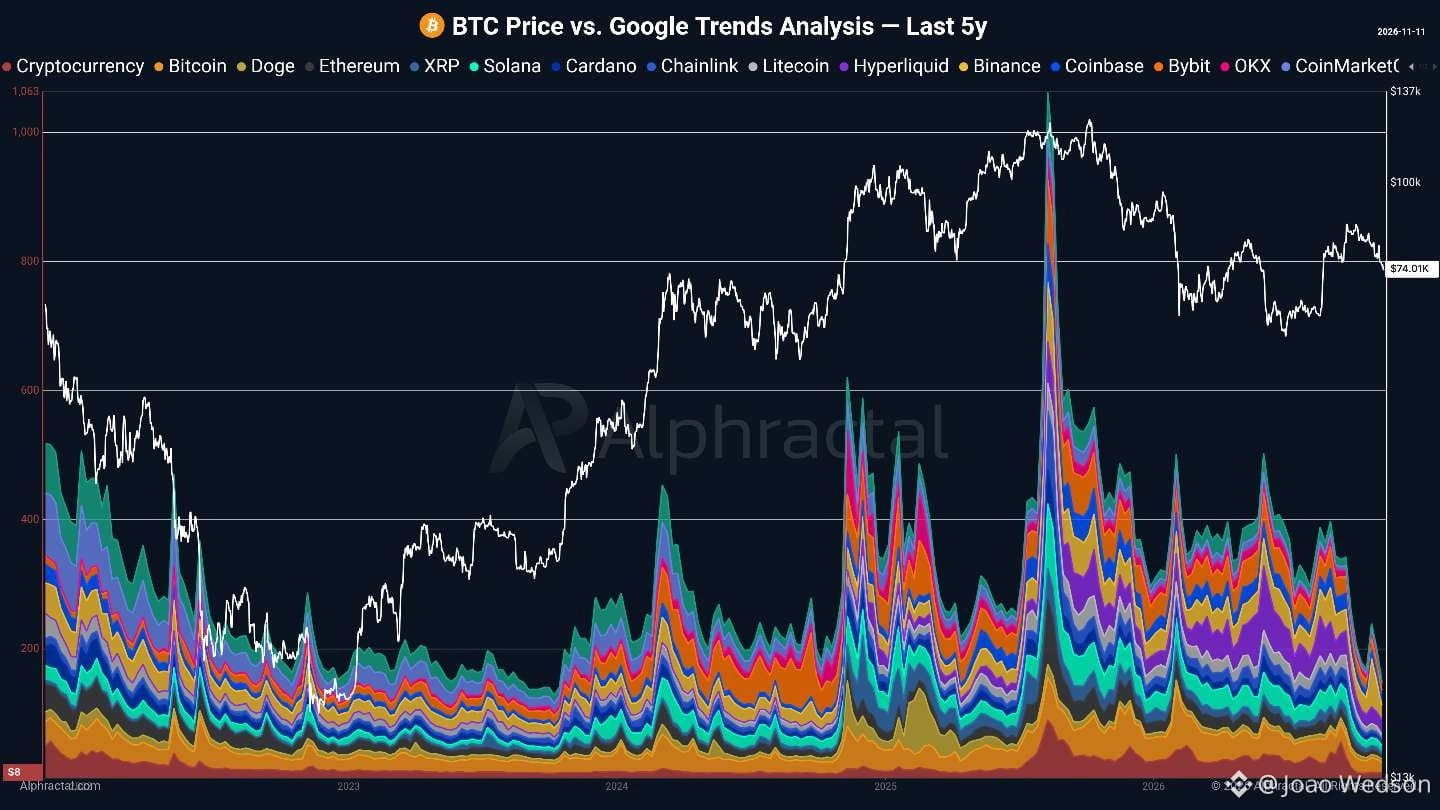
• Google searches for crypto topics are at levels not seen since 2023.
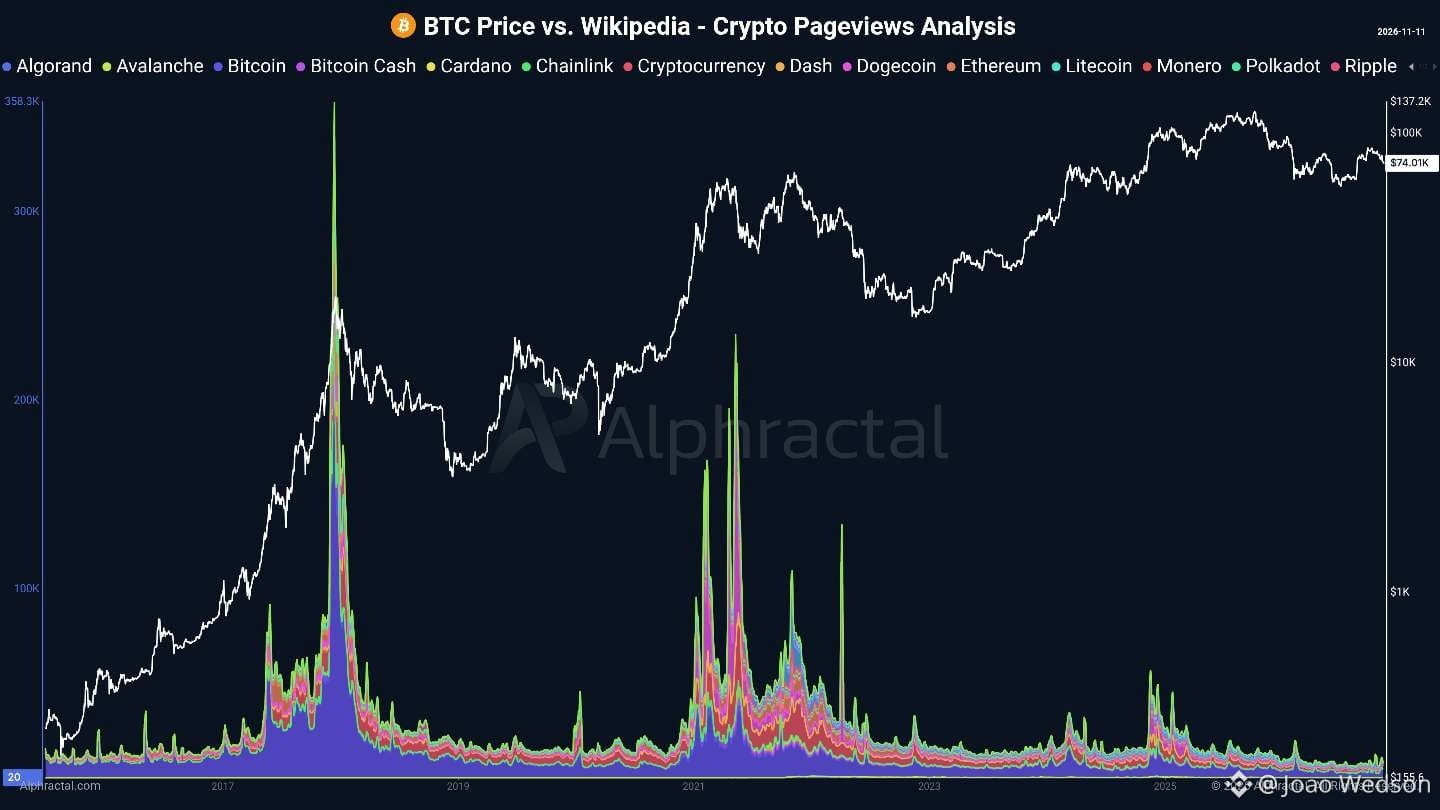
• Crypto Wikipedia pageviews are near historic lows, although LLMs have changed how people seek information.
Apathy is taking over.
This looks like the boring accumulation phase: altcoins weaken, investors leave, and analysts keep calling for reversals based on technical signals that fail to hold.
Strong fundamentals alone do not guarantee higher prices. Sustainable rallies require real demand, spot buying and on-chain accumulation. Yet derivatives increasingly drive short-term price movements, a significant shift from the greater influence of Spot and OTC markets before 2020.
Weak interest also pressures exchanges to cut jobs, operations and marketing. Some former market leaders have lost relevance or disappeared.
Still, I see light at the end of the tunnel.
Historically, prolonged apathy has often preceded renewed retail enthusiasm one or two years later. By 2028, fresh narratives could bring investors back, but many might only start accumulating when OGs are distributing.
I made a similar interpretation in 2022, when many doubted BTC could fall below $20K. The ensuing apathy created opportunities for patient investors.
Yes, LLMs have changed search behavior, so these attention metrics need context. But together, they still tell a compelling story.
I build in crypto and believe in its long-term future. That does not mean ignoring bearish data or confusing personal conviction with market reality.
Now is the time for resilience, patience and intelligent accumulation.
The biggest opportunities often form when almost nobody is paying attention.
Charts: Alphractal
Many are free.
Let's talk about crypto market sentiment.
• Crypto Fear & Greed: 29 (Fear).
• Alphractal's Alpha Crypto Sentiment Gauge: 15 (Very Bearish), reflecting news and social media sentiment.
• Google searches for crypto topics are at levels not seen since 2023.
• Crypto Wikipedia pageviews are near historic lows, although LLMs have changed how people seek information.
Apathy is taking over.
This looks like the boring accumulation phase: altcoins weaken, investors leave, and analysts keep calling for reversals based on technical signals that fail to hold.
Strong fundamentals alone do not guarantee higher prices. Sustainable rallies require real demand, spot buying and on-chain accumulation. Yet derivatives increasingly drive short-term price movements, a significant shift from the greater influence of Spot and OTC markets before 2020.
Weak interest also pressures exchanges to cut jobs, operations and marketing. Some former market leaders have lost relevance or disappeared.
Still, I see light at the end of the tunnel.
Historically, prolonged apathy has often preceded renewed retail enthusiasm one or two years later. By 2028, fresh narratives could bring investors back, but many might only start accumulating when OGs are distributing.
I made a similar interpretation in 2022, when many doubted BTC could fall below $20K. The ensuing apathy created opportunities for patient investors.
Yes, LLMs have changed search behavior, so these attention metrics need context. But together, they still tell a compelling story.
I build in crypto and believe in its long-term future. That does not mean ignoring bearish data or confusing personal conviction with market reality.
Now is the time for resilience, patience and intelligent accumulation.
The biggest opportunities often form when almost nobody is paying attention.
Charts: Alphractal
Many are free.
• Crypto Fear & Greed: 29 (Fear).
• Alphractal's Alpha Crypto Sentiment Gauge: 15 (Very Bearish), reflecting news and social media sentiment.
• Google searches for crypto topics are at levels not seen since 2023.
• Crypto Wikipedia pageviews are near historic lows, although LLMs have changed how people seek information.
Apathy is taking over.
This looks like the boring accumulation phase: altcoins weaken, investors leave, and analysts keep calling for reversals based on technical signals that fail to hold.
Strong fundamentals alone do not guarantee higher prices. Sustainable rallies require real demand, spot buying and on-chain accumulation. Yet derivatives increasingly drive short-term price movements, a significant shift from the greater influence of Spot and OTC markets before 2020.
Weak interest also pressures exchanges to cut jobs, operations and marketing. Some former market leaders have lost relevance or disappeared.
Still, I see light at the end of the tunnel.
Historically, prolonged apathy has often preceded renewed retail enthusiasm one or two years later. By 2028, fresh narratives could bring investors back, but many might only start accumulating when OGs are distributing.
I made a similar interpretation in 2022, when many doubted BTC could fall below $20K. The ensuing apathy created opportunities for patient investors.
Yes, LLMs have changed search behavior, so these attention metrics need context. But together, they still tell a compelling story.
I build in crypto and believe in its long-term future. That does not mean ignoring bearish data or confusing personal conviction with market reality.
Now is the time for resilience, patience and intelligent accumulation.
The biggest opportunities often form when almost nobody is paying attention.
Charts: Alphractal
Many are free.
80
·
--
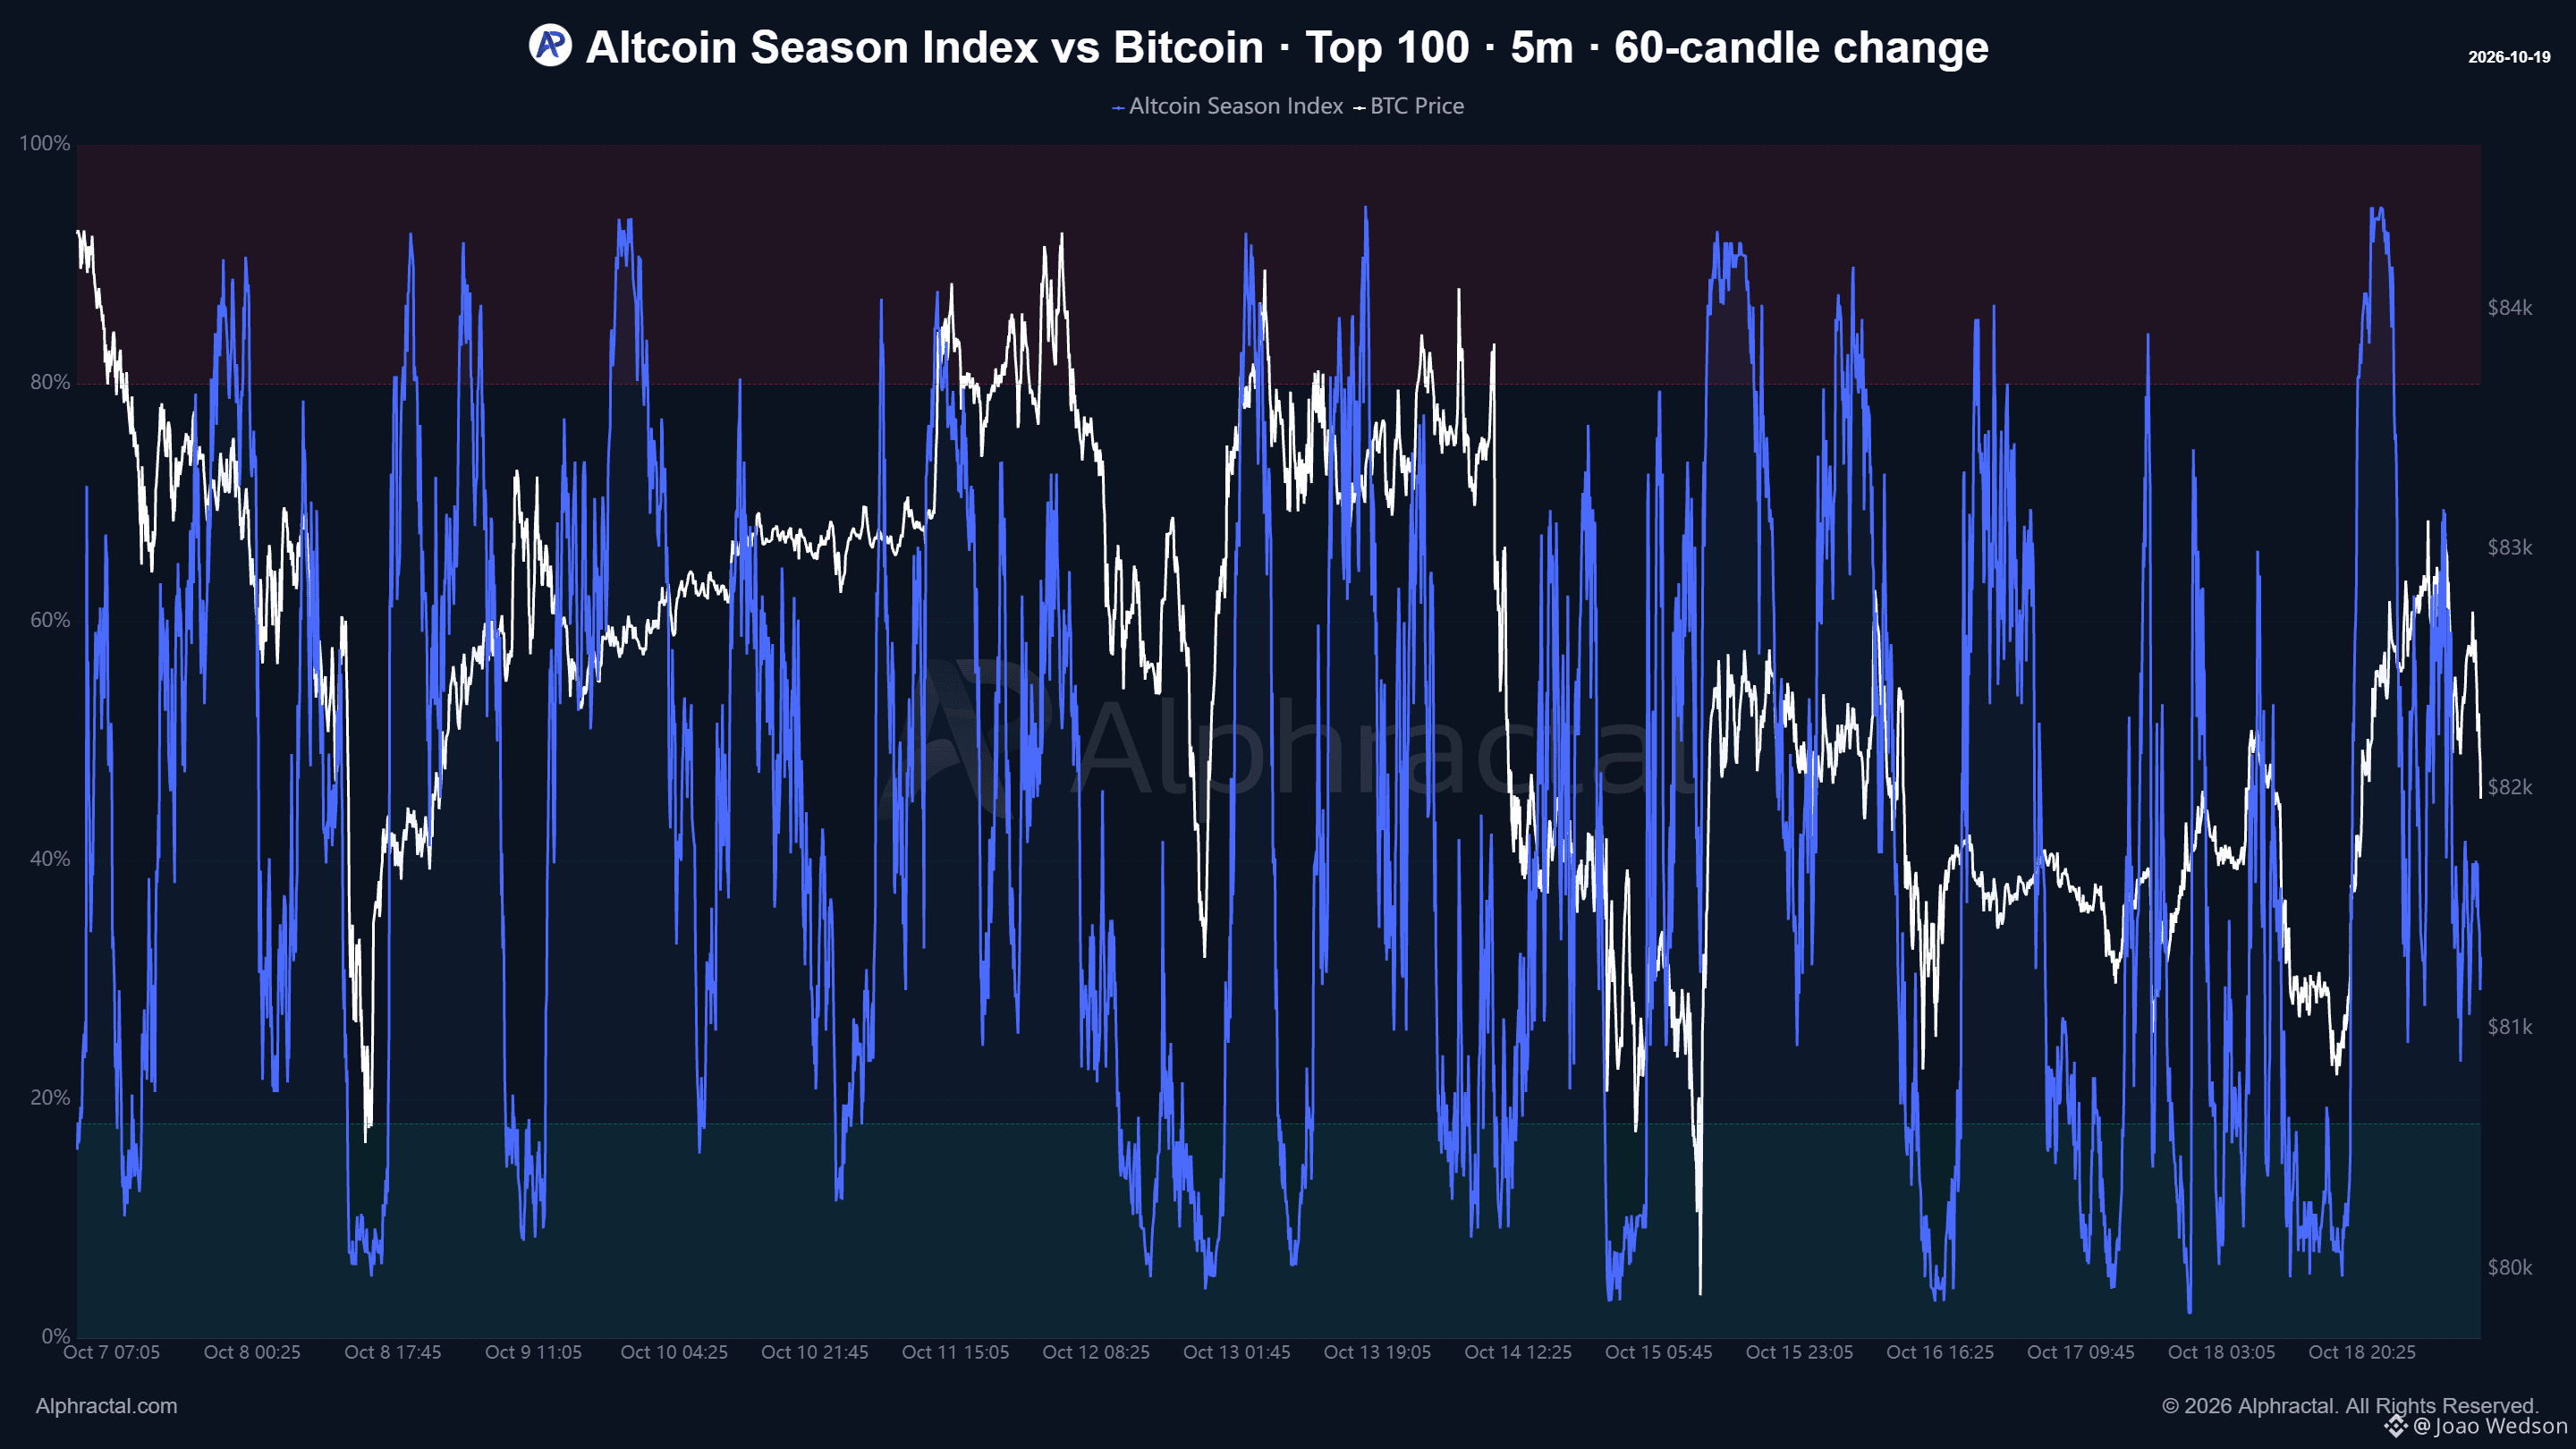
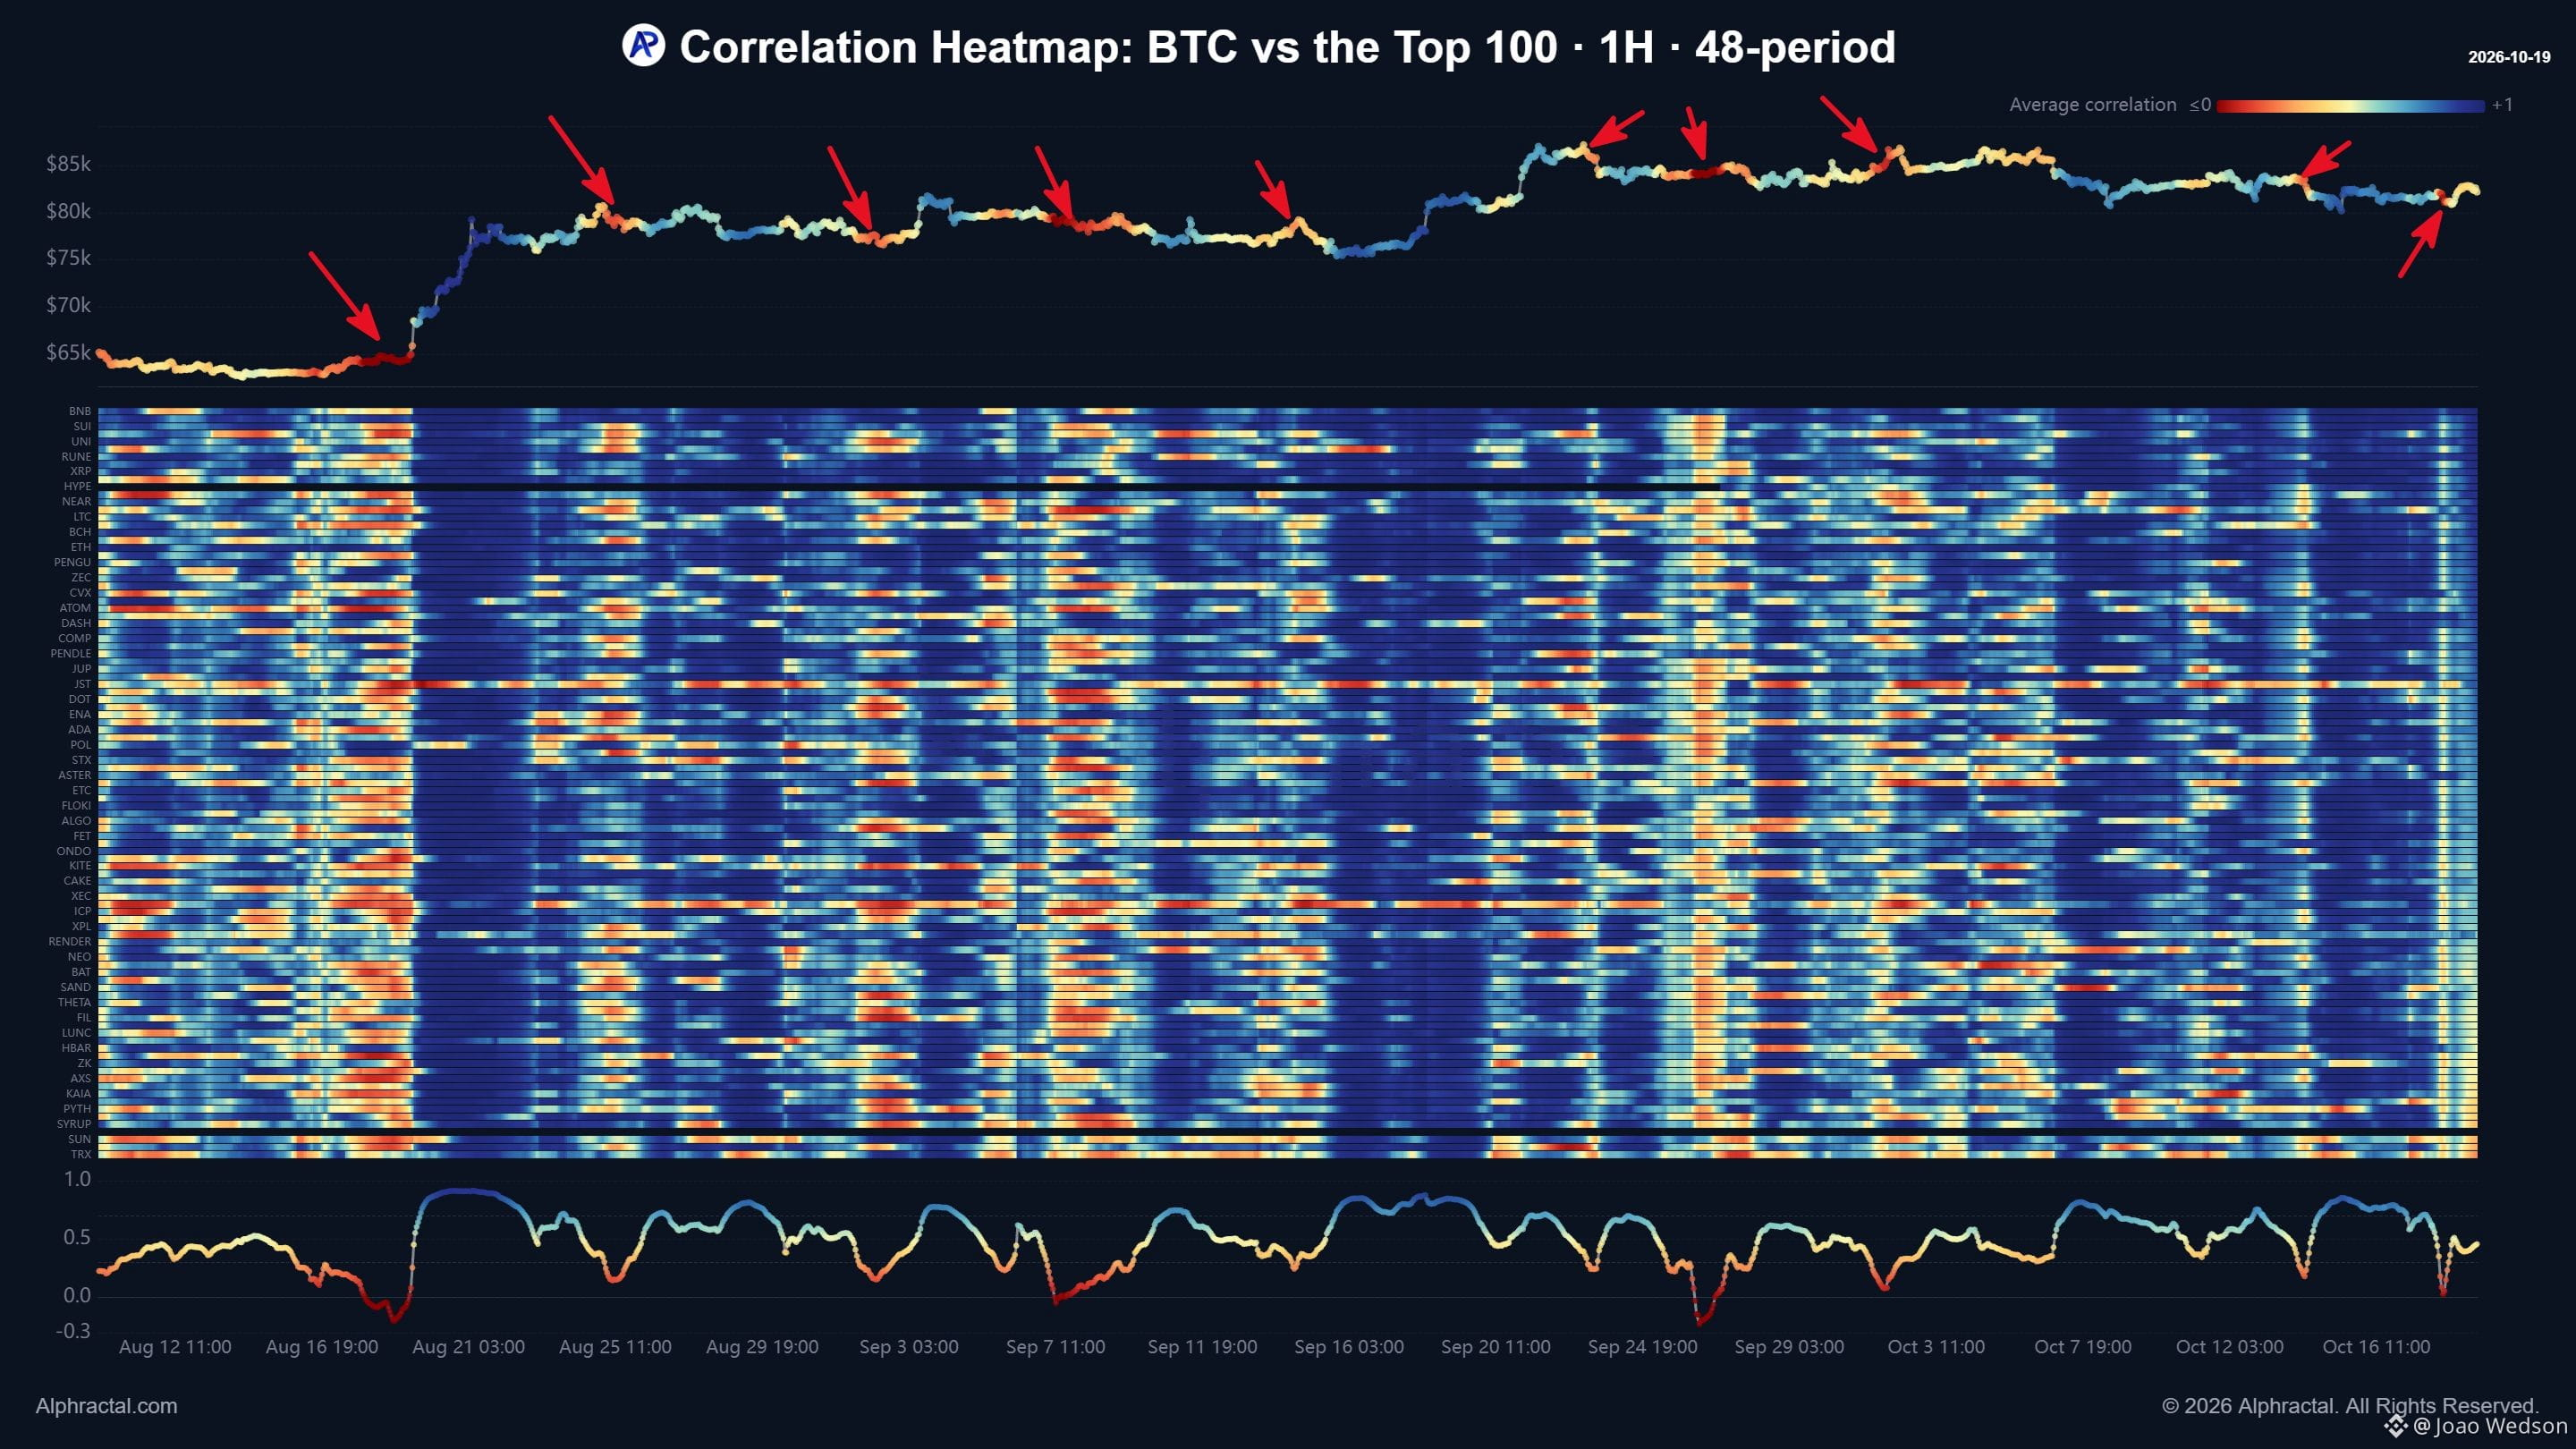
Один зі способів передбачити значну волатильність на крипторинку — проаналізувати кореляцію біткоїна з провідними альткоїнами. Подивіться, що відбувається, коли альткоїни перестають рухатися за ціною біткоїна, і як невдовзі після цього реагує ринок! Такі моменти трапляються відносно рідко. У цьому випадку я використав часовий інтервал 1 година та ковзне вікно кореляції на 48 годин, вимірюючи взаємозв’язок за останні два дні. Зазвичай це відбувається, коли альткоїни падають, а біткоїн зростає, або коли альткоїни зростають, а біткоїн падає. Такі розбіжності часто є попереджувальним сигналом масштабних ліквідацій! Тепер Alphractal — одна з небагатьох платформ, де можна переглядати подібні графіки на будь-яких часових інтервалах, починаючи лише з 1 хвилини, а також користуватися такими індикаторами, як Індекс сезону альткоїнів! #Bitcoin $BTC
Один зі способів передбачити значну волатильність на крипторинку — проаналізувати кореляцію біткоїна з провідними альткоїнами. Подивіться, що відбувається, коли альткоїни перестають рухатися за ціною біткоїна, і як невдовзі після цього реагує ринок! Такі моменти трапляються відносно рідко. У цьому випадку я використав часовий інтервал 1 година та ковзне вікно кореляції на 48 годин, вимірюючи взаємозв’язок за останні два дні. Зазвичай це відбувається, коли альткоїни падають, а біткоїн зростає, або коли альткоїни зростають, а біткоїн падає. Такі розбіжності часто є попереджувальним сигналом масштабних ліквідацій! Тепер Alphractal — одна з небагатьох платформ, де можна переглядати подібні графіки на будь-яких часових інтервалах, починаючи лише з 1 хвилини, а також користуватися такими індикаторами, як Індекс сезону альткоїнів! #Bitcoin $BTC
74
·
--
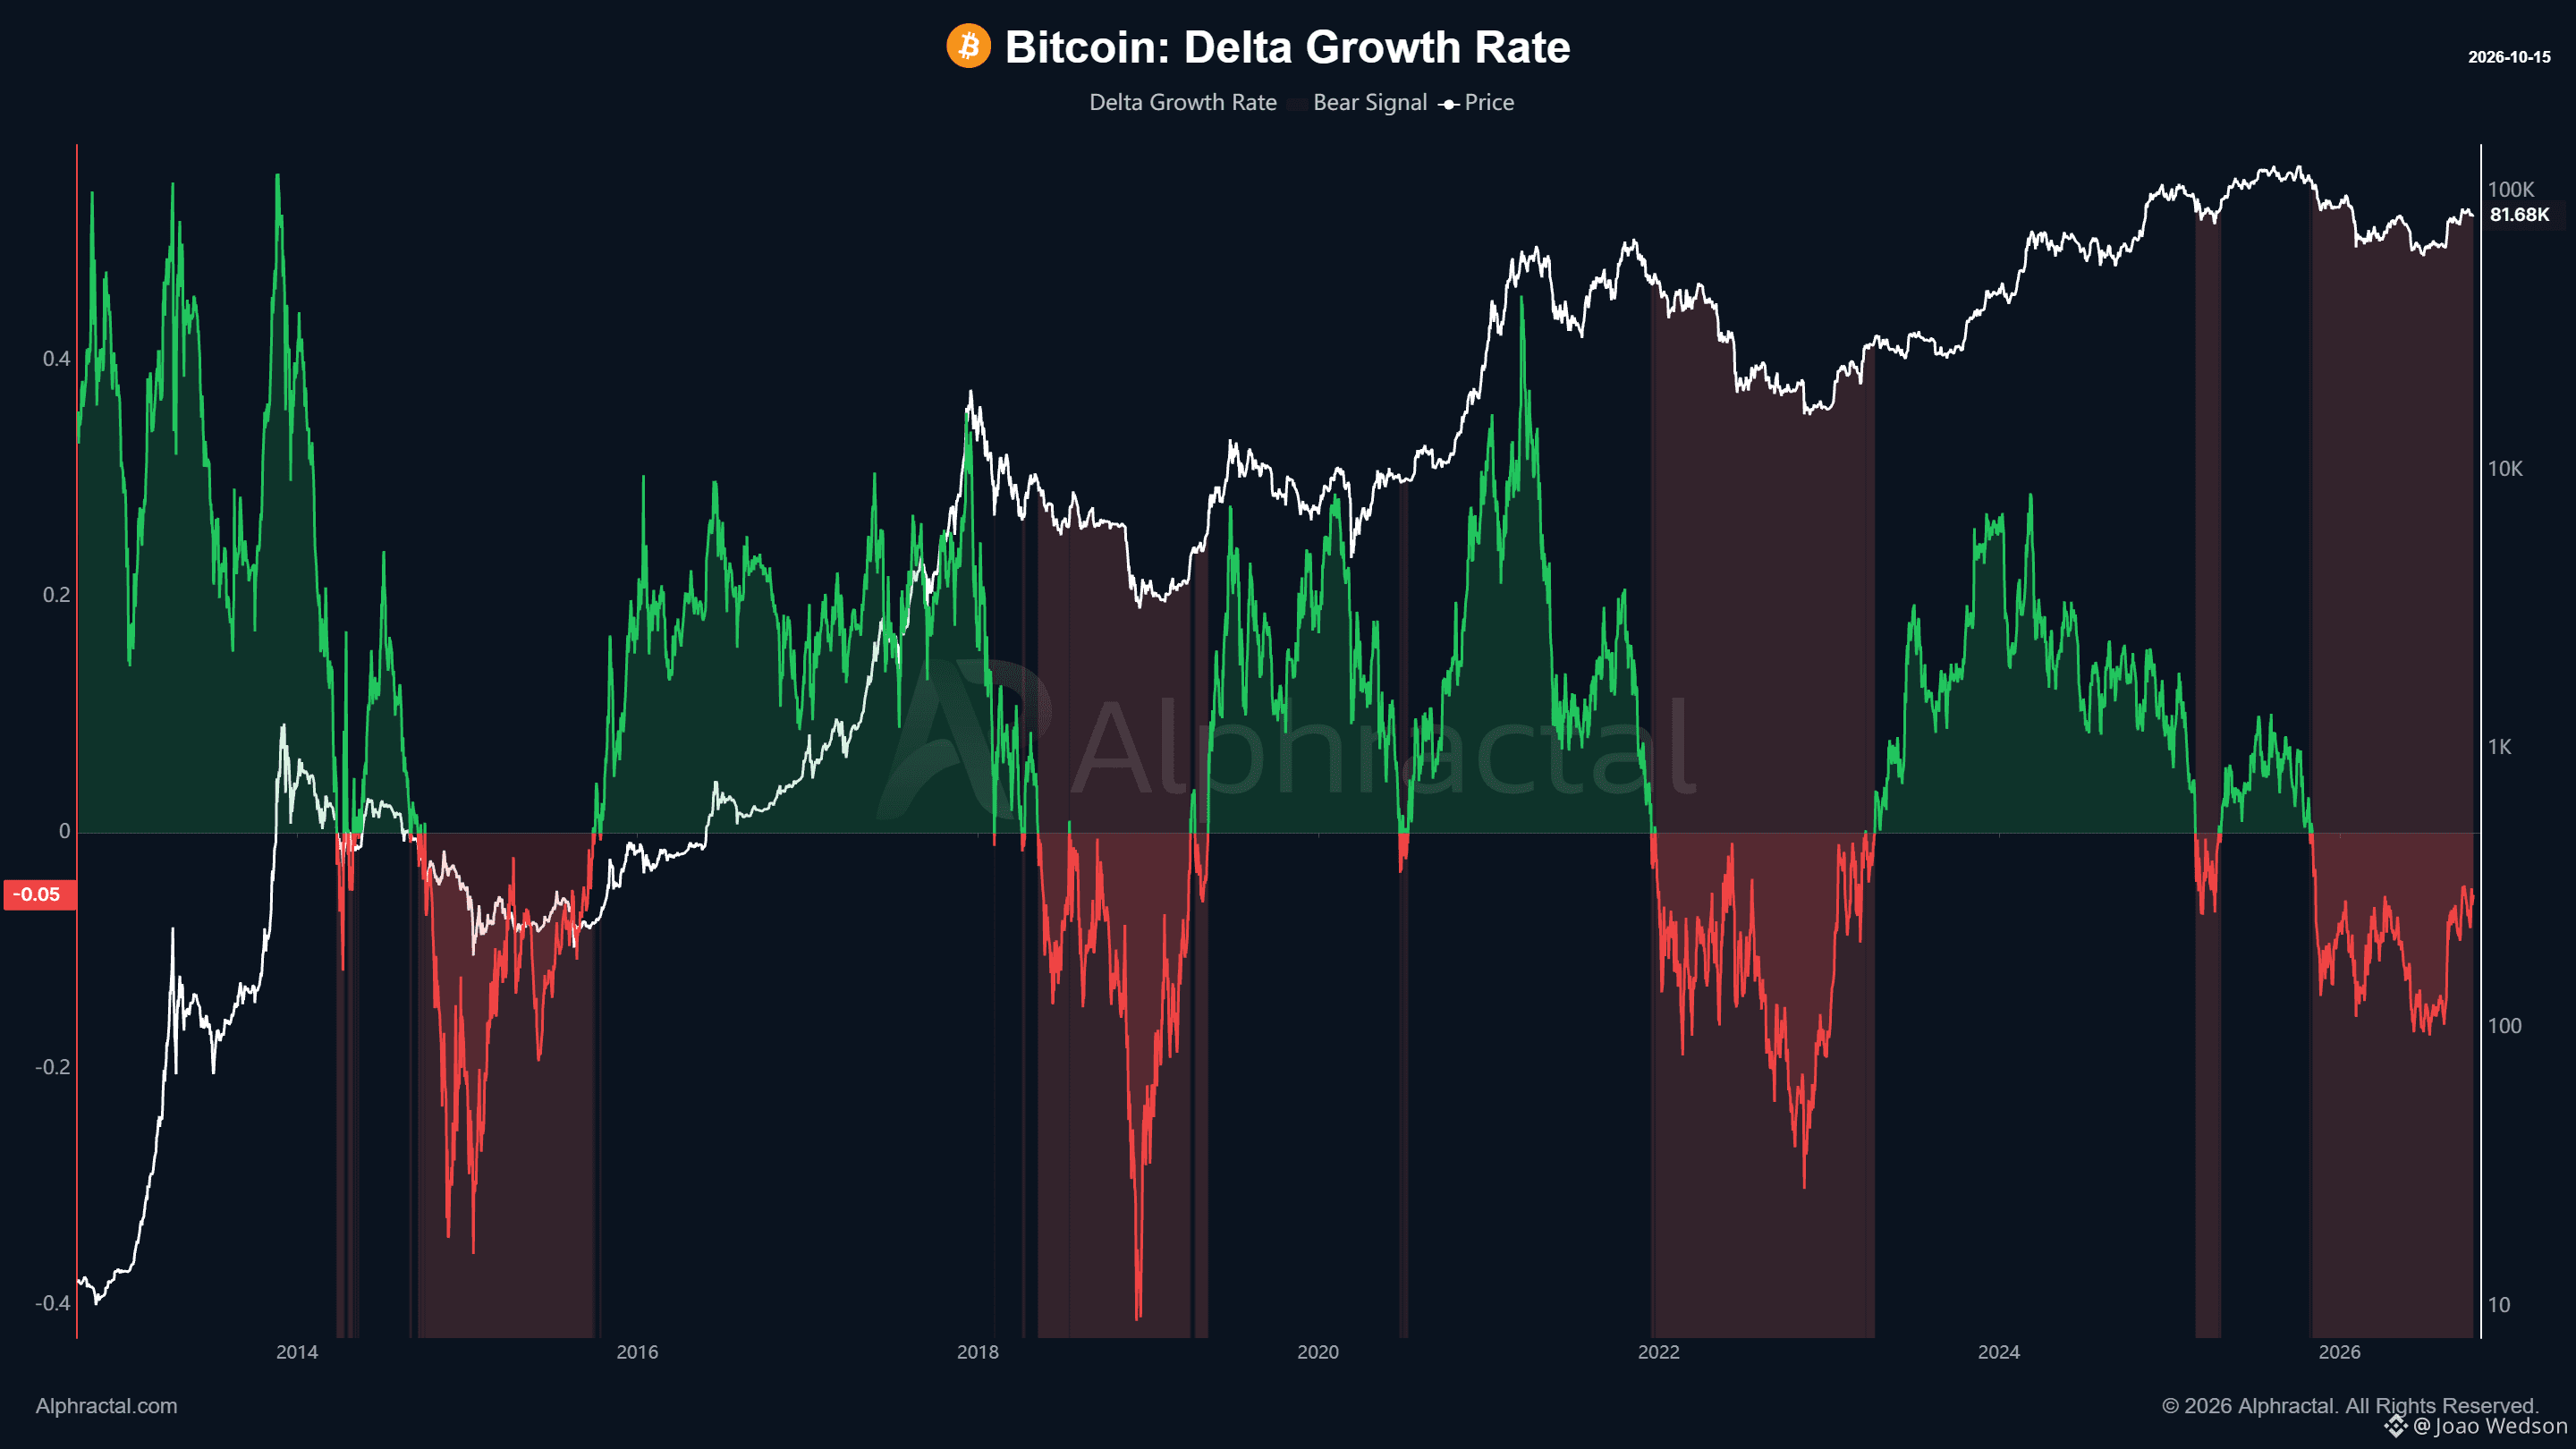
Bitcoin: темп зростання Delta демонструє ознаки відновлення! Темп зростання Delta — це показник, який поєднує зростання ринкової та реалізованої капіталізації, допомагаючи виявляти розбіжності між зростанням ціни Bitcoin і накопиченням ончейн-вартості. Історично від’ємні значення пов’язували з періодами слабшої спекулятивної активності, накопичення та потенційної недооціненості. **Наразі показник залишається в негативній зоні, але від липня 2026 року він відновлюється!** Цей рух свідчить про поступове покращення ринкової динаміки, хоча його поки що недостатньо, щоб підтвердити структурний розворот тренду. Тепер головне питання: чи буде це відновлення достатньо сильним, щоб повернути темп зростання Delta в позитивну зону? Дізнайтеся більше про цей та інші показники на Alphractal $BTC #Bitcoin
Bitcoin: темп зростання Delta демонструє ознаки відновлення! Темп зростання Delta — це показник, який поєднує зростання ринкової та реалізованої капіталізації, допомагаючи виявляти розбіжності між зростанням ціни Bitcoin і накопиченням ончейн-вартості. Історично від’ємні значення пов’язували з періодами слабшої спекулятивної активності, накопичення та потенційної недооціненості. **Наразі показник залишається в негативній зоні, але від липня 2026 року він відновлюється!** Цей рух свідчить про поступове покращення ринкової динаміки, хоча його поки що недостатньо, щоб підтвердити структурний розворот тренду. Тепер головне питання: чи буде це відновлення достатньо сильним, щоб повернути темп зростання Delta в позитивну зону? Дізнайтеся більше про цей та інші показники на Alphractal $BTC #Bitcoin
71
·
--
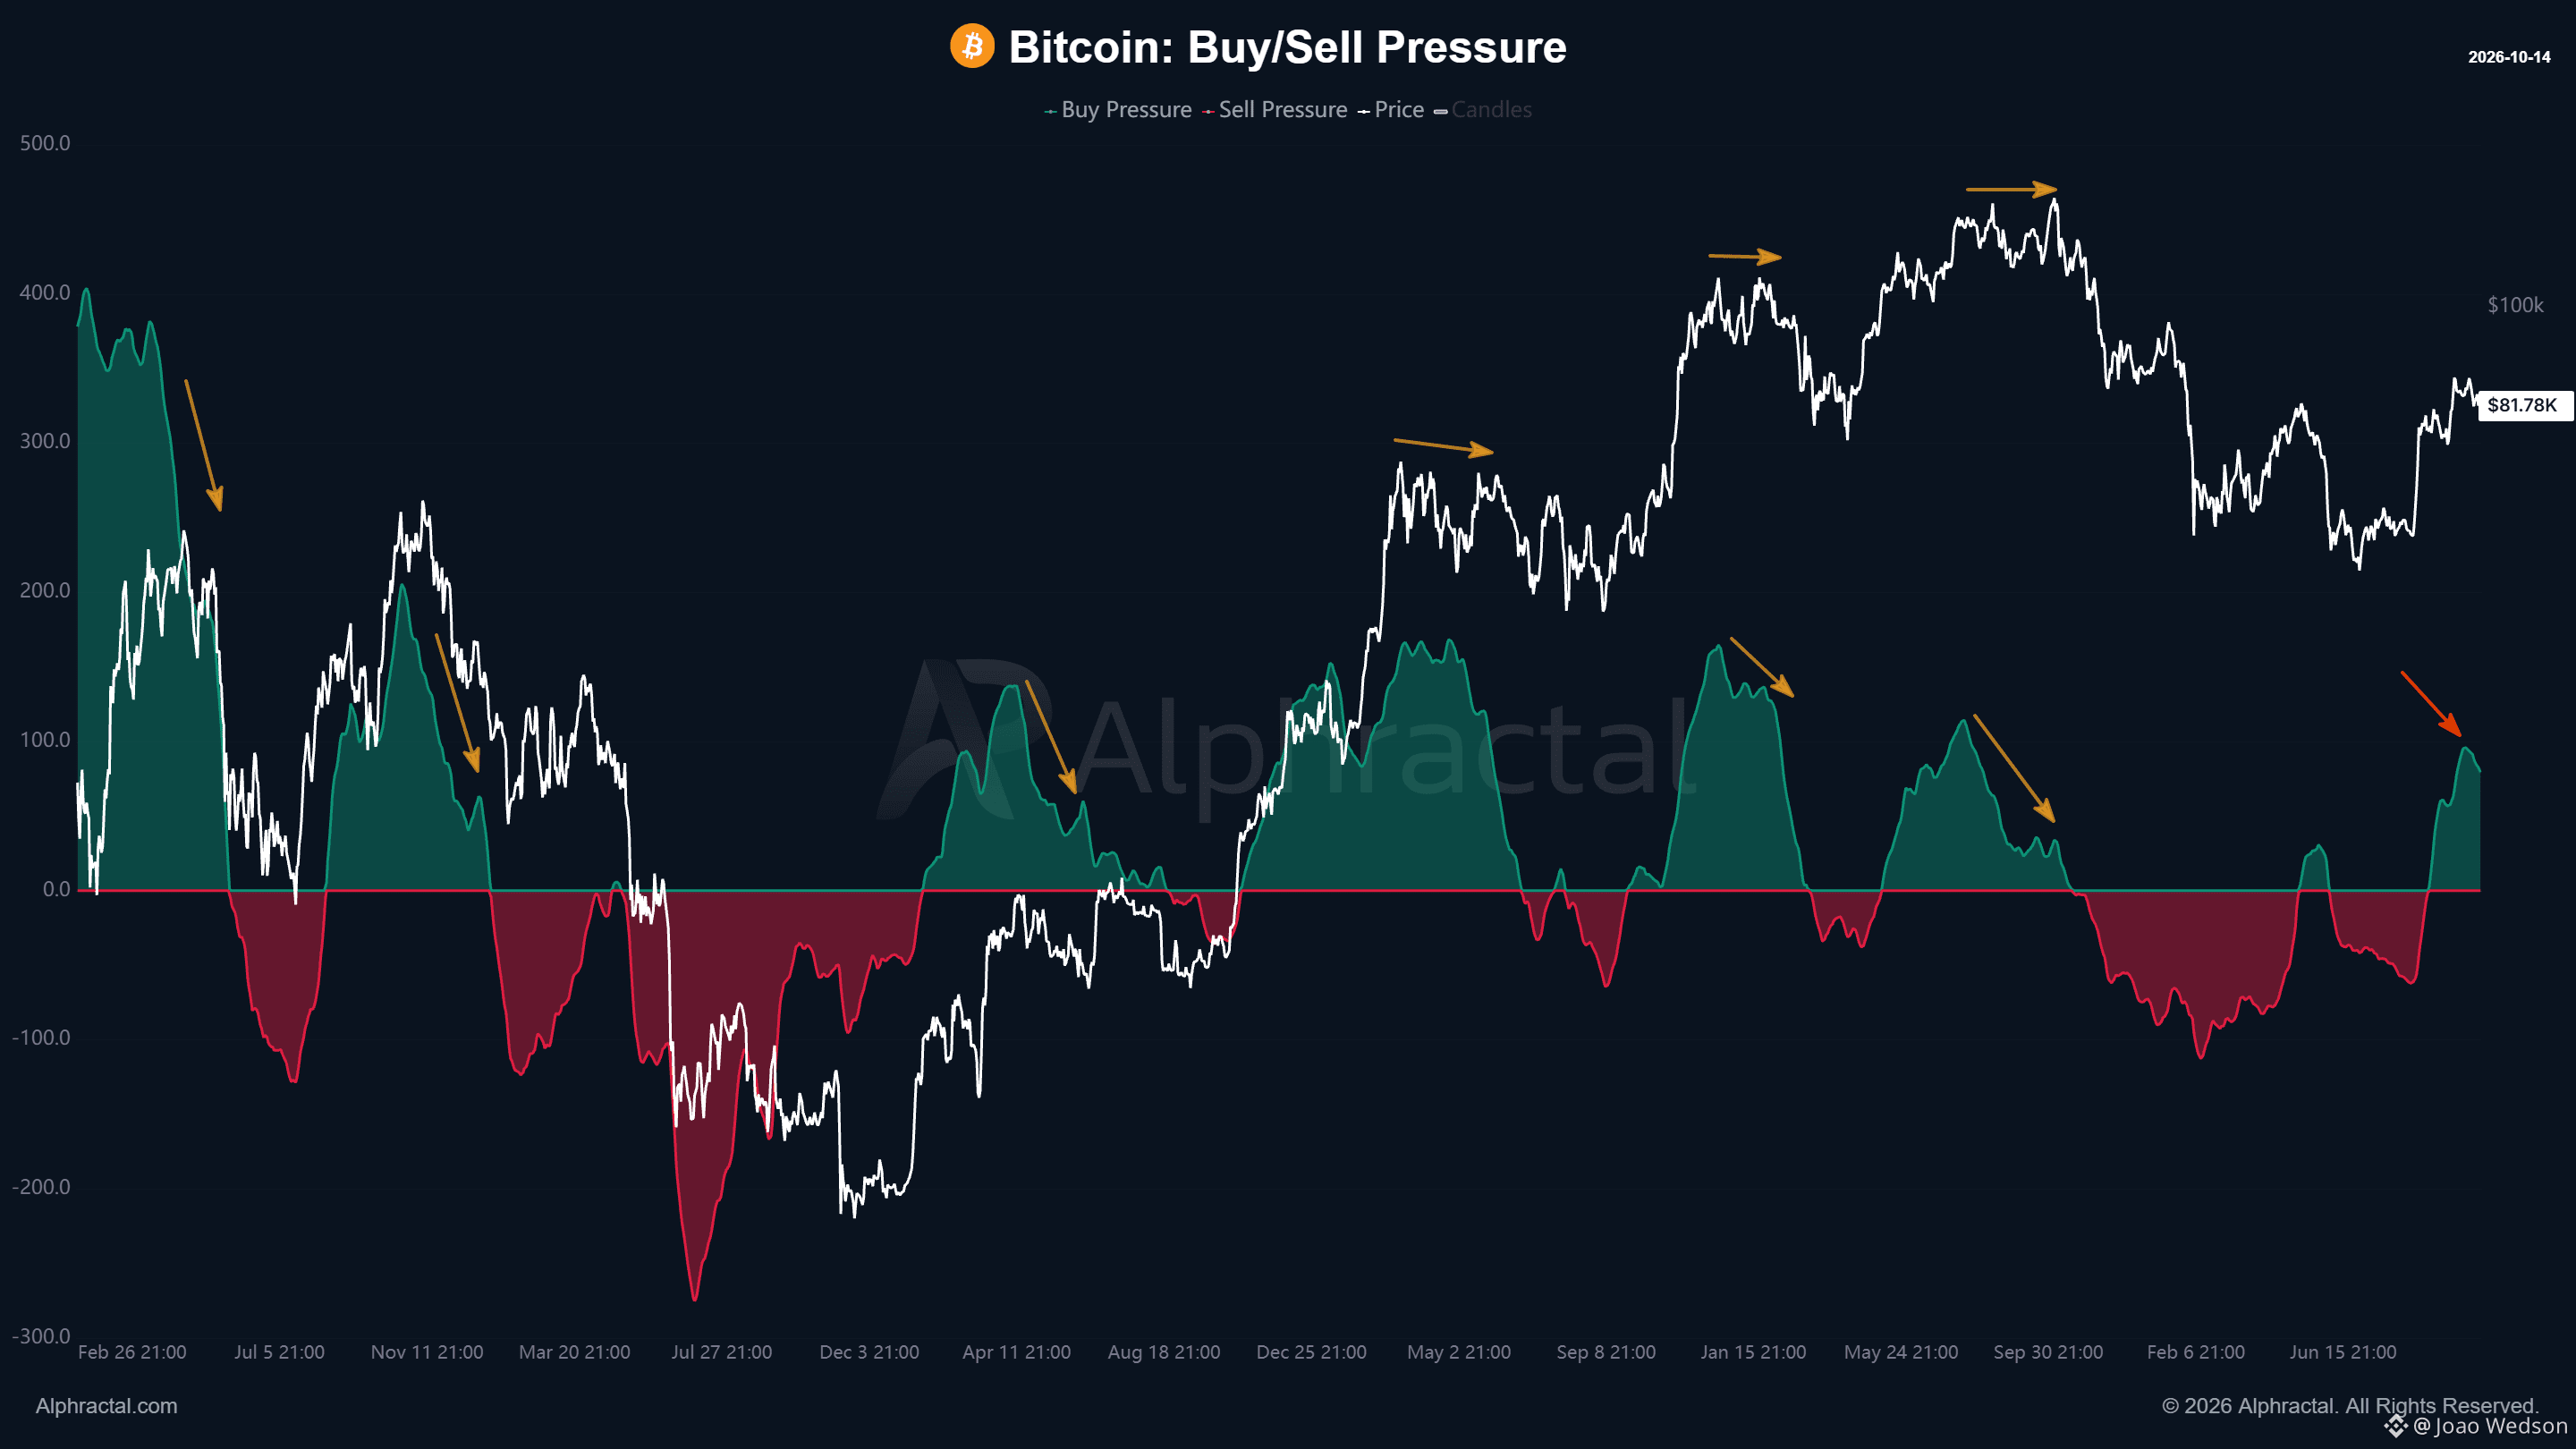
Дельта тиску купівлі/продажу Bitcoin показує невелике зниження купівельного тиску! У ведмежому сценарії цей показник зазвичай продовжує знижуватися протягом кількох днів, зрештою переходячи в негативну зону. Цікаво, що історичні дані виявляють дві повторювані моделі, коли Delta тиску купівлі/продажу перестає зростати: 1. Ціна Bitcoin починає знижуватися. 2. Bitcoin входить у фазу консолідації, формуючи причинно-наслідкову структуру, яка зрештою може призвести до більшого падіння ціни. Це робить Delta тиску купівлі/продажу чудовим індикатором для відстеження бичачого імпульсу купівлі та визначення моменту, коли ведмеді починають брати контроль над ринком. Наразі невелике зменшення купівельного тиску не обов’язково є приводом для занепокоєння. Однак надзвичайно важливо уважно стежити за цим показником, особливо якщо тиск продажів почне посилюватися. Ключове питання полягає в тому: чи бики просто втрачають імпульс, чи ведмеді готуються взяти контроль? Не чекайте, поки ринок зробить свій наступний рух! Отримайте доступ до платформи Alphractal уже зараз і налаштуйте сповіщення, щоб отримувати повідомлення, коли тиск продажів зростає. Ви навіть можете використовувати ChatGPT або Claude через нашу інтеграцію MCP, щоб налаштувати автоматизований моніторинг і отримувати сповіщення, коли ці умови виникатимуть. Будьте на крок попереду ринку. Нехай дані говорять самі за себе. Alphractal $BTC
Дельта тиску купівлі/продажу Bitcoin показує невелике зниження купівельного тиску! У ведмежому сценарії цей показник зазвичай продовжує знижуватися протягом кількох днів, зрештою переходячи в негативну зону. Цікаво, що історичні дані виявляють дві повторювані моделі, коли Delta тиску купівлі/продажу перестає зростати: 1. Ціна Bitcoin починає знижуватися. 2. Bitcoin входить у фазу консолідації, формуючи причинно-наслідкову структуру, яка зрештою може призвести до більшого падіння ціни. Це робить Delta тиску купівлі/продажу чудовим індикатором для відстеження бичачого імпульсу купівлі та визначення моменту, коли ведмеді починають брати контроль над ринком. Наразі невелике зменшення купівельного тиску не обов’язково є приводом для занепокоєння. Однак надзвичайно важливо уважно стежити за цим показником, особливо якщо тиск продажів почне посилюватися. Ключове питання полягає в тому: чи бики просто втрачають імпульс, чи ведмеді готуються взяти контроль? Не чекайте, поки ринок зробить свій наступний рух! Отримайте доступ до платформи Alphractal уже зараз і налаштуйте сповіщення, щоб отримувати повідомлення, коли тиск продажів зростає. Ви навіть можете використовувати ChatGPT або Claude через нашу інтеграцію MCP, щоб налаштувати автоматизований моніторинг і отримувати сповіщення, коли ці умови виникатимуть. Будьте на крок попереду ринку. Нехай дані говорять самі за себе. Alphractal $BTC
72
·
--
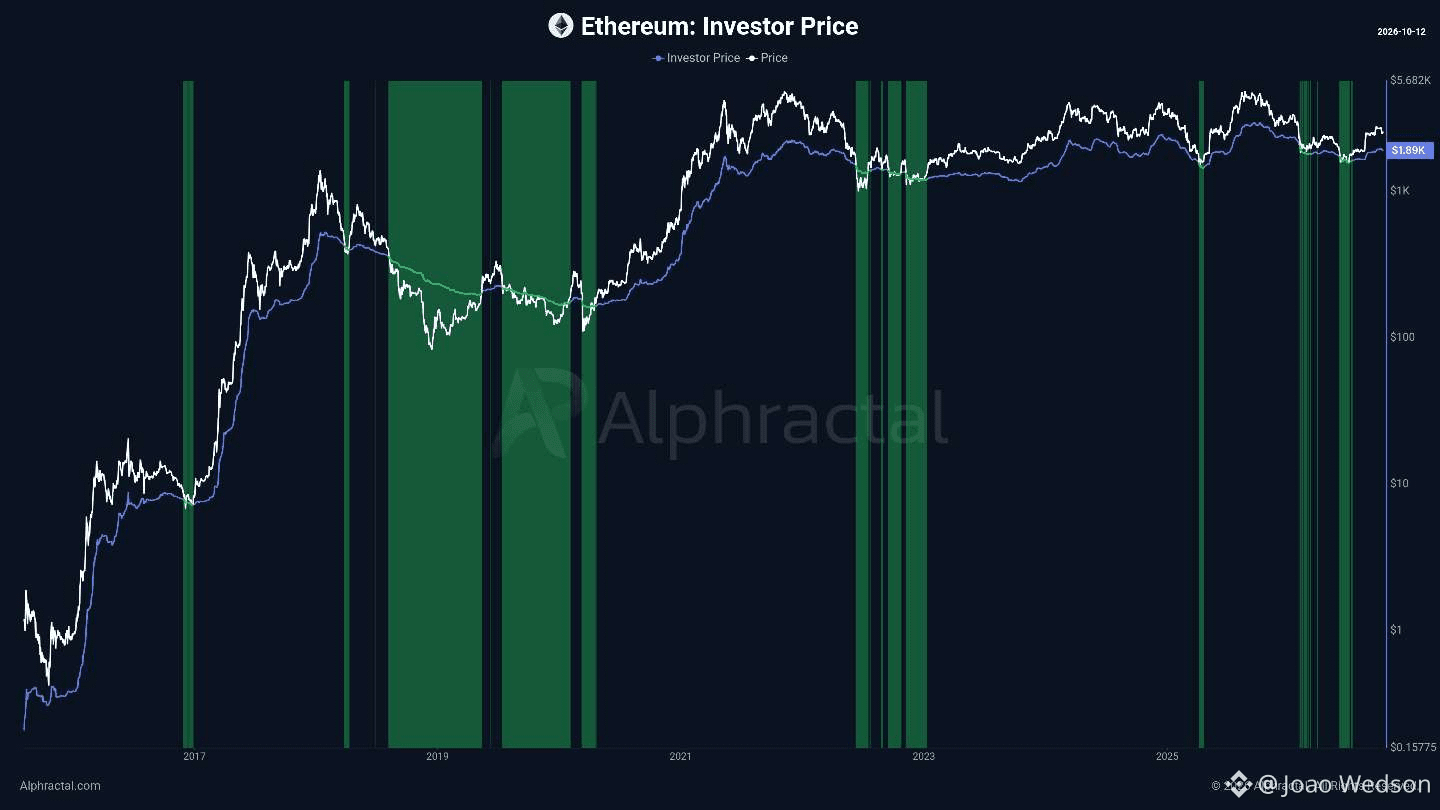
Ethereum (ETH): Важливий ончейн-рівень, за яким варто стежити!
Для тих, хто ще не купив Ethereum, уважно стежте за ончейн-метриками, такими як Investor Price.
Якщо ETH зазнає ще однієї корекції, ця метрика може допомогти визначити потенційну зону накопичення та важливий довгостроковий рівень підтримки.
Що таке Investor Price?
Він відображає середню ціну придбання економічно циркулюючих $ETH, без урахування монет, які вважаються безповоротно втраченими.
Розділивши Investor Cap на Adjusted Supply, ця метрика пропонує більш точний погляд на сукупну собівартість ринку, зменшуючи викривлення, характерні для традиційних моделей Realized Price.
Хоча жодна метрика не гарантує досягнення ринкового дна, Investor Price може надати цінний контекст під час оцінювання потенційних можливостей для купівлі.
Встановіть цінові сповіщення та дозвольте даним спрямовувати ваші рішення.
Дізнайтеся більше на Alphractal. com
Ethereum (ETH): Важливий ончейн-рівень, за яким варто стежити!
Для тих, хто ще не купив Ethereum, уважно стежте за ончейн-метриками, такими як Investor Price.
Якщо ETH зазнає ще однієї корекції, ця метрика може допомогти визначити потенційну зону накопичення та важливий довгостроковий рівень підтримки.
Що таке Investor Price?
Він відображає середню ціну придбання економічно циркулюючих $ETH, без урахування монет, які вважаються безповоротно втраченими.
Розділивши Investor Cap на Adjusted Supply, ця метрика пропонує більш точний погляд на сукупну собівартість ринку, зменшуючи викривлення, характерні для традиційних моделей Realized Price.
Хоча жодна метрика не гарантує досягнення ринкового дна, Investor Price може надати цінний контекст під час оцінювання потенційних можливостей для купівлі.
Встановіть цінові сповіщення та дозвольте даним спрямовувати ваші рішення.
Дізнайтеся більше на Alphractal. com
Для тих, хто ще не купив Ethereum, уважно стежте за ончейн-метриками, такими як Investor Price.
Якщо ETH зазнає ще однієї корекції, ця метрика може допомогти визначити потенційну зону накопичення та важливий довгостроковий рівень підтримки.
Що таке Investor Price?
Він відображає середню ціну придбання економічно циркулюючих $ETH, без урахування монет, які вважаються безповоротно втраченими.
Розділивши Investor Cap на Adjusted Supply, ця метрика пропонує більш точний погляд на сукупну собівартість ринку, зменшуючи викривлення, характерні для традиційних моделей Realized Price.
Хоча жодна метрика не гарантує досягнення ринкового дна, Investor Price може надати цінний контекст під час оцінювання потенційних можливостей для купівлі.
Встановіть цінові сповіщення та дозвольте даним спрямовувати ваші рішення.
Дізнайтеся більше на Alphractal. com
73
·
--
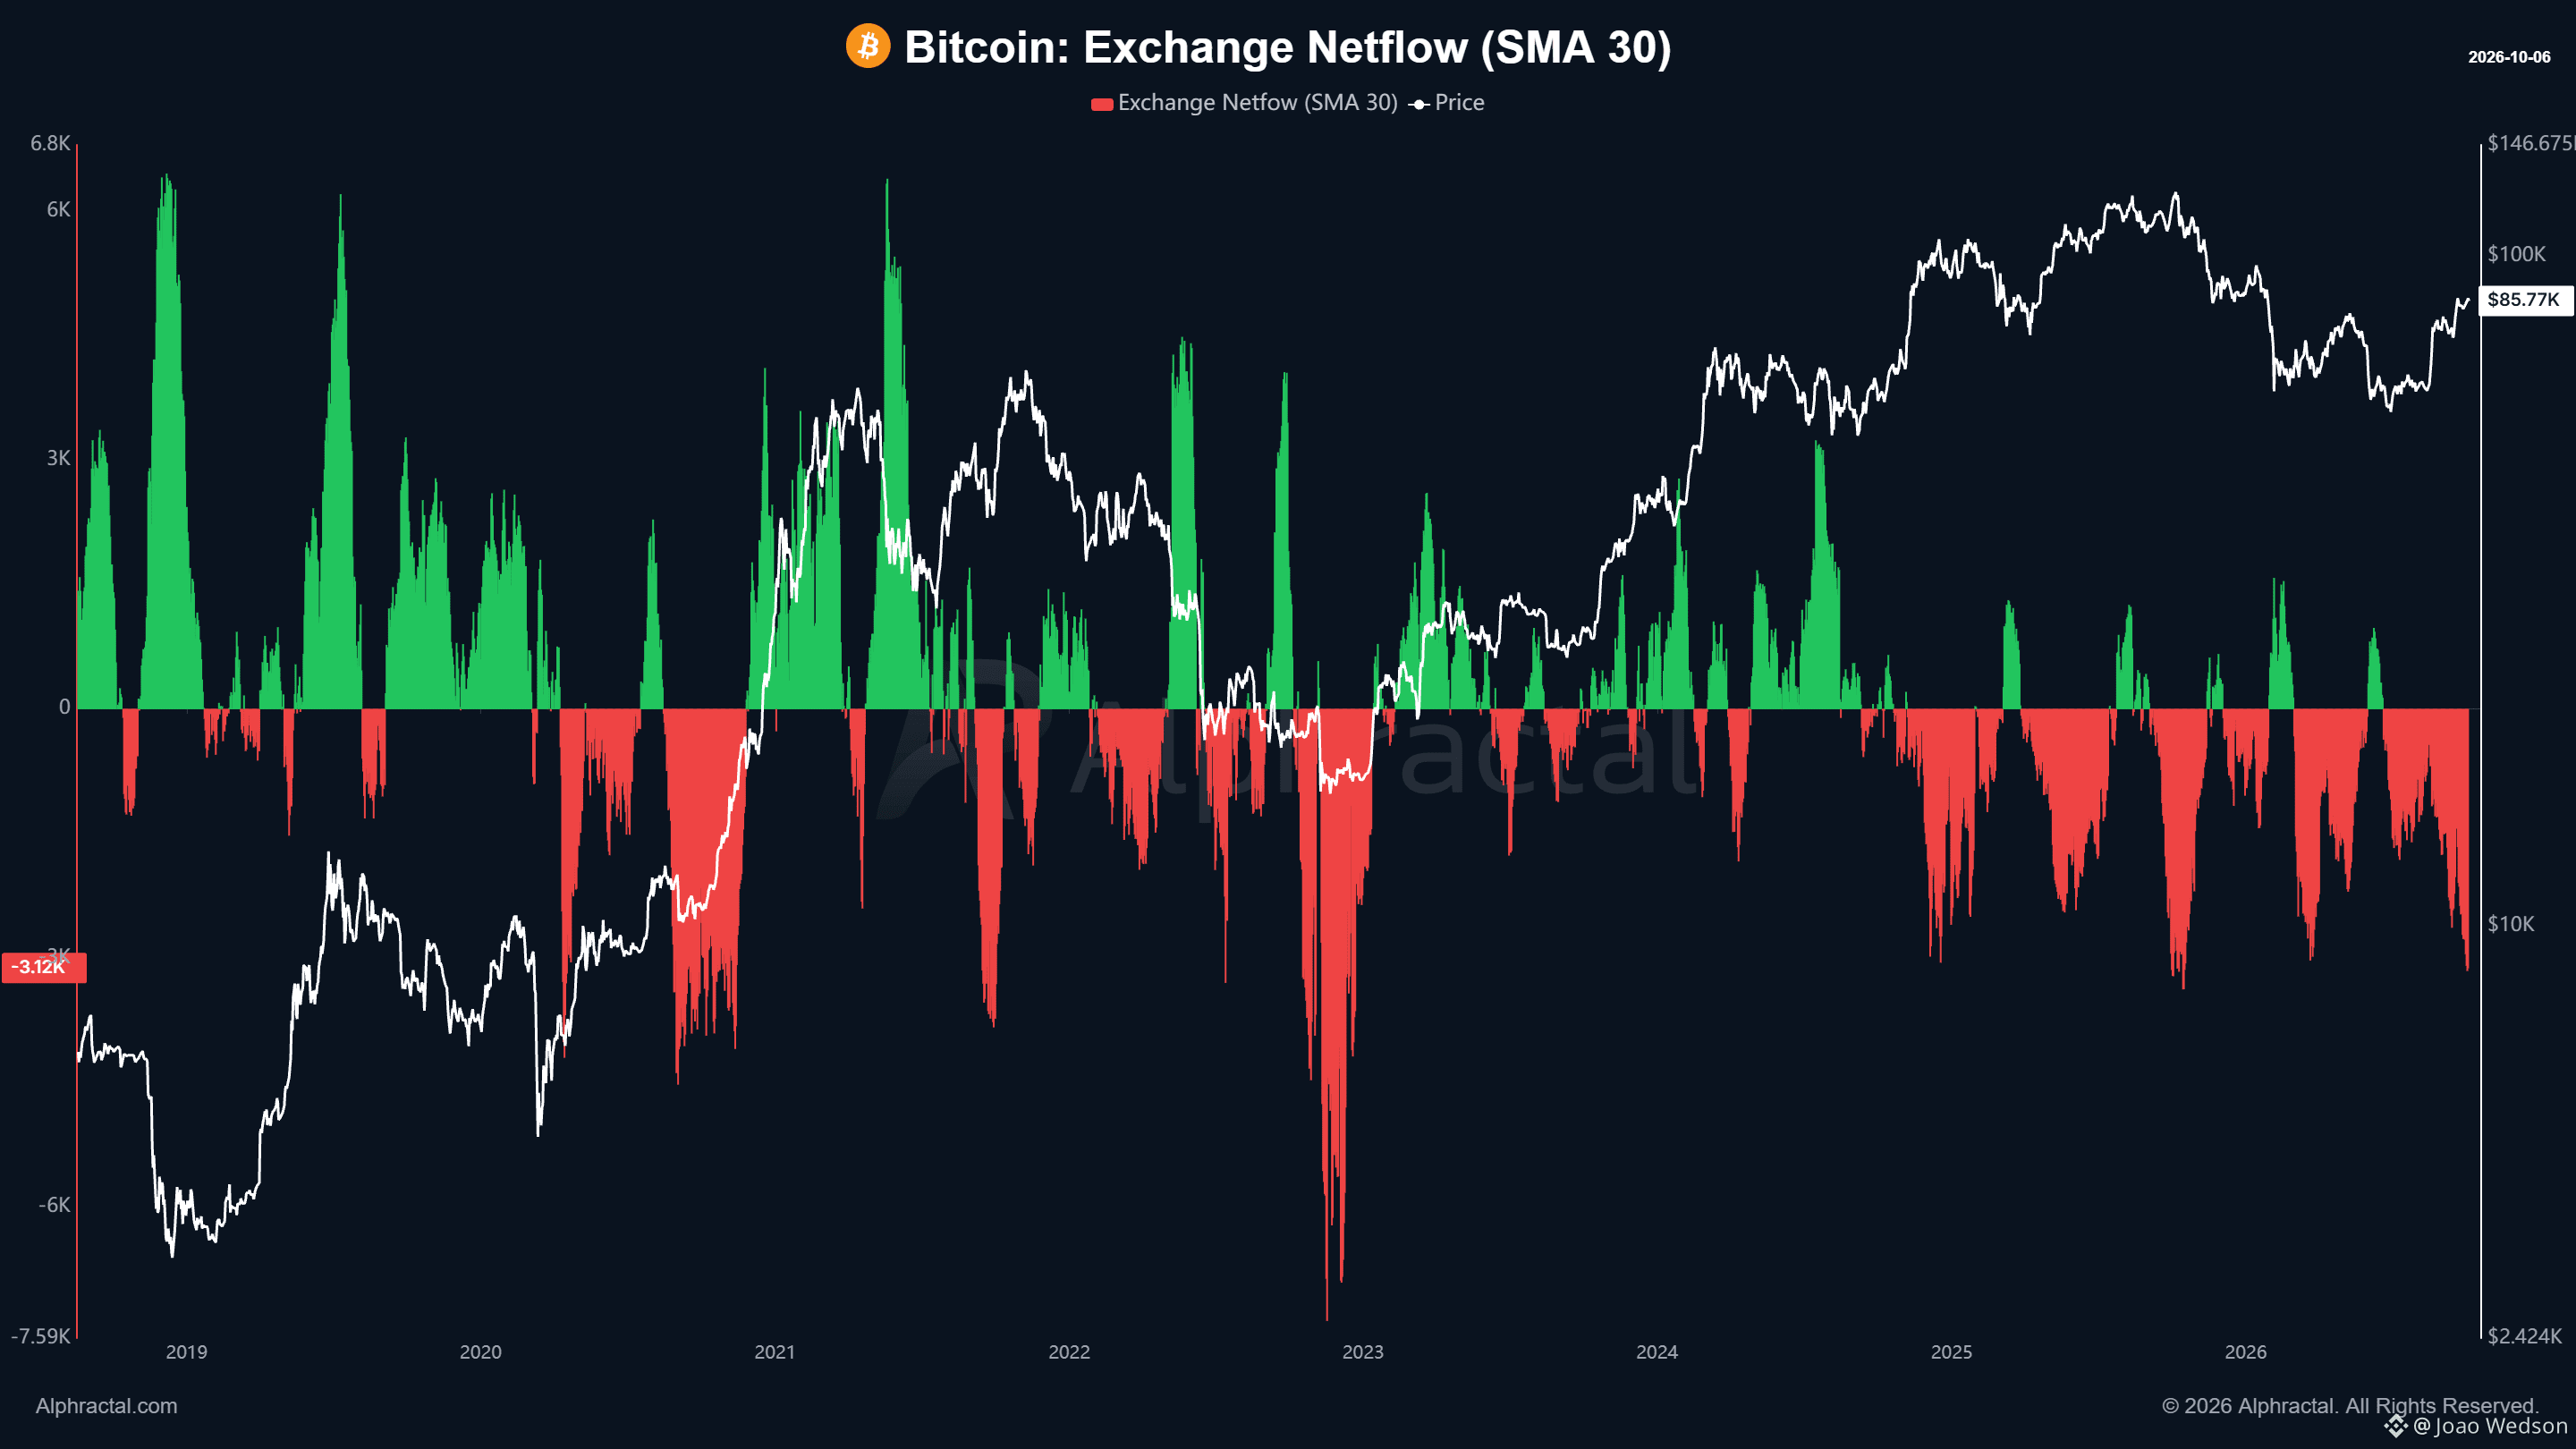
Чистий потік Bitcoin на біржі, розрахований на основі 30-денного ковзного середнього, залишається значно від’ємним. Це свідчить про те, що останнім часом з бірж виводять більше BTC, ніж надсилають на них. Від’ємний чистий потік не слід сприймати як прямий сигнал до зростання ціни. Однак стійкий відтік коштів із бірж є важливим фундаментальним показником. Він свідчить про те, що значну кількість Bitcoin виводять із бірж — потенційно для самостійного зберігання або довгострокового утримання, — зменшуючи обсяг BTC, доступний для торгівлі. Навіть після значної волатильності ринку інвестори продовжують виводити Bitcoin із бірж. Це не визначає короткостроковий напрямок ціни, але залишається важливим свідченням довгострокової впевненості в Bitcoin. $BTC
Чистий потік Bitcoin на біржі, розрахований на основі 30-денного ковзного середнього, залишається значно від’ємним. Це свідчить про те, що останнім часом з бірж виводять більше BTC, ніж надсилають на них. Від’ємний чистий потік не слід сприймати як прямий сигнал до зростання ціни. Однак стійкий відтік коштів із бірж є важливим фундаментальним показником. Він свідчить про те, що значну кількість Bitcoin виводять із бірж — потенційно для самостійного зберігання або довгострокового утримання, — зменшуючи обсяг BTC, доступний для торгівлі. Навіть після значної волатильності ринку інвестори продовжують виводити Bitcoin із бірж. Це не визначає короткостроковий напрямок ціни, але залишається важливим свідченням довгострокової впевненості в Bitcoin. $BTC
68
·
--
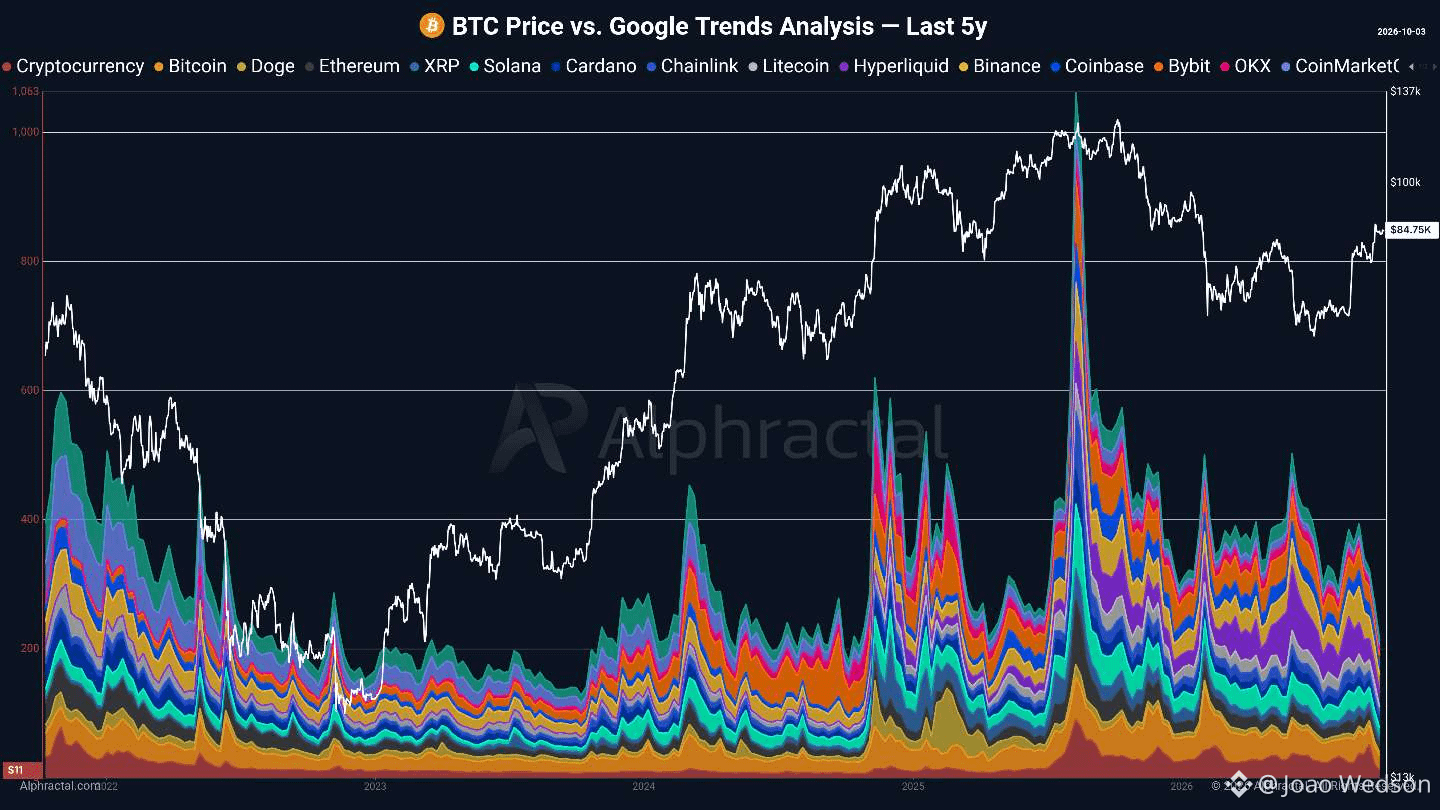
⚠️Інтерес до криптовалют у Google Search впав до найнижчого рівня з 2024 року.
Це відображає ширше зниження уваги роздрібних інвесторів по всьому ринку. Нижчий інтерес також помітний у YouTube, X, криптоновинах, на біржах, агрегаторах на кшталт CoinMarketCap і CoinGecko, а також на аналітичних платформах, таких як TradingView.
Для творців контенту таке середовище зазвичай означає менше охоплення та слабшу взаємодію. Для платформ і бірж це означає менше користувачів, які активно шукають, торгують і досліджують ринок.
Такі періоди — справжня перевірка стійкості роздрібних інвесторів.
Коли глобальна увага згасає, залишатися активним стає важче. Але історично ринок не залишається цікавим лише тоді, коли ціни зростають і залученість висока.
Іноді найважливіші періоди — саме ті, коли на ринок звертає увагу менше людей.
Скористайтеся купоном Alphractal зі знижкою 50%
Джерело: Alphractal
$BTC $ETH $XRP $SOL $HYPE
⚠️Інтерес до криптовалют у Google Search впав до найнижчого рівня з 2024 року.
Це відображає ширше зниження уваги роздрібних інвесторів по всьому ринку. Нижчий інтерес також помітний у YouTube, X, криптоновинах, на біржах, агрегаторах на кшталт CoinMarketCap і CoinGecko, а також на аналітичних платформах, таких як TradingView.
Для творців контенту таке середовище зазвичай означає менше охоплення та слабшу взаємодію. Для платформ і бірж це означає менше користувачів, які активно шукають, торгують і досліджують ринок.
Такі періоди — справжня перевірка стійкості роздрібних інвесторів.
Коли глобальна увага згасає, залишатися активним стає важче. Але історично ринок не залишається цікавим лише тоді, коли ціни зростають і залученість висока.
Іноді найважливіші періоди — саме ті, коли на ринок звертає увагу менше людей.
Скористайтеся купоном Alphractal зі знижкою 50%
Джерело: Alphractal
$BTC $ETH $XRP $SOL $HYPE
Це відображає ширше зниження уваги роздрібних інвесторів по всьому ринку. Нижчий інтерес також помітний у YouTube, X, криптоновинах, на біржах, агрегаторах на кшталт CoinMarketCap і CoinGecko, а також на аналітичних платформах, таких як TradingView.
Для творців контенту таке середовище зазвичай означає менше охоплення та слабшу взаємодію. Для платформ і бірж це означає менше користувачів, які активно шукають, торгують і досліджують ринок.
Такі періоди — справжня перевірка стійкості роздрібних інвесторів.
Коли глобальна увага згасає, залишатися активним стає важче. Але історично ринок не залишається цікавим лише тоді, коли ціни зростають і залученість висока.
Іноді найважливіші періоди — саме ті, коли на ринок звертає увагу менше людей.
Скористайтеся купоном Alphractal зі знижкою 50%
Джерело: Alphractal
$BTC $ETH $XRP $SOL $HYPE
75
Увійдіть, щоб переглянути інший контент
Приєднуйтесь до користувачів криптовалют по всьому світу на Binance Square
⚡️ Отримуйте актуальну та корисну інформацію про криптовалюти.
💬 Приєднуйтесь до найбільшої у світі криптобіржі.
👍 Відкрийте справжні ідеї від перевірених авторів.
Електронна пошта / номер телефону
Трендові теми
fomcвідстеження
128,566 переглядів
563 обговорюють
Думаєте, ШІ-хайп триватиме вічно? ФРС вже починає готуватися до гіршого 👀
VoLoDyMyR7
·12 вподобань
·326 переглядів
IsAnthropic’s$1.5TMarketCapJustified?
62,775 переглядів
325 обговорюють
BTCBelow$62KAmidHikeFearsAndShiftToAnthropic
20,381 переглядів
122 обговорюють