
TEKT0NIC 1
1.6k Публікації

TEKT0NIC 1
Поскаржитись
Заблокувати користувача
Passionate about crypto and blockchain | Crypto Enthusiastic | Technical Analysis | Fundamental News
0 Підписки
10 Підписники
39 Вподобань
Публікації
·
--
Переглянути переклад
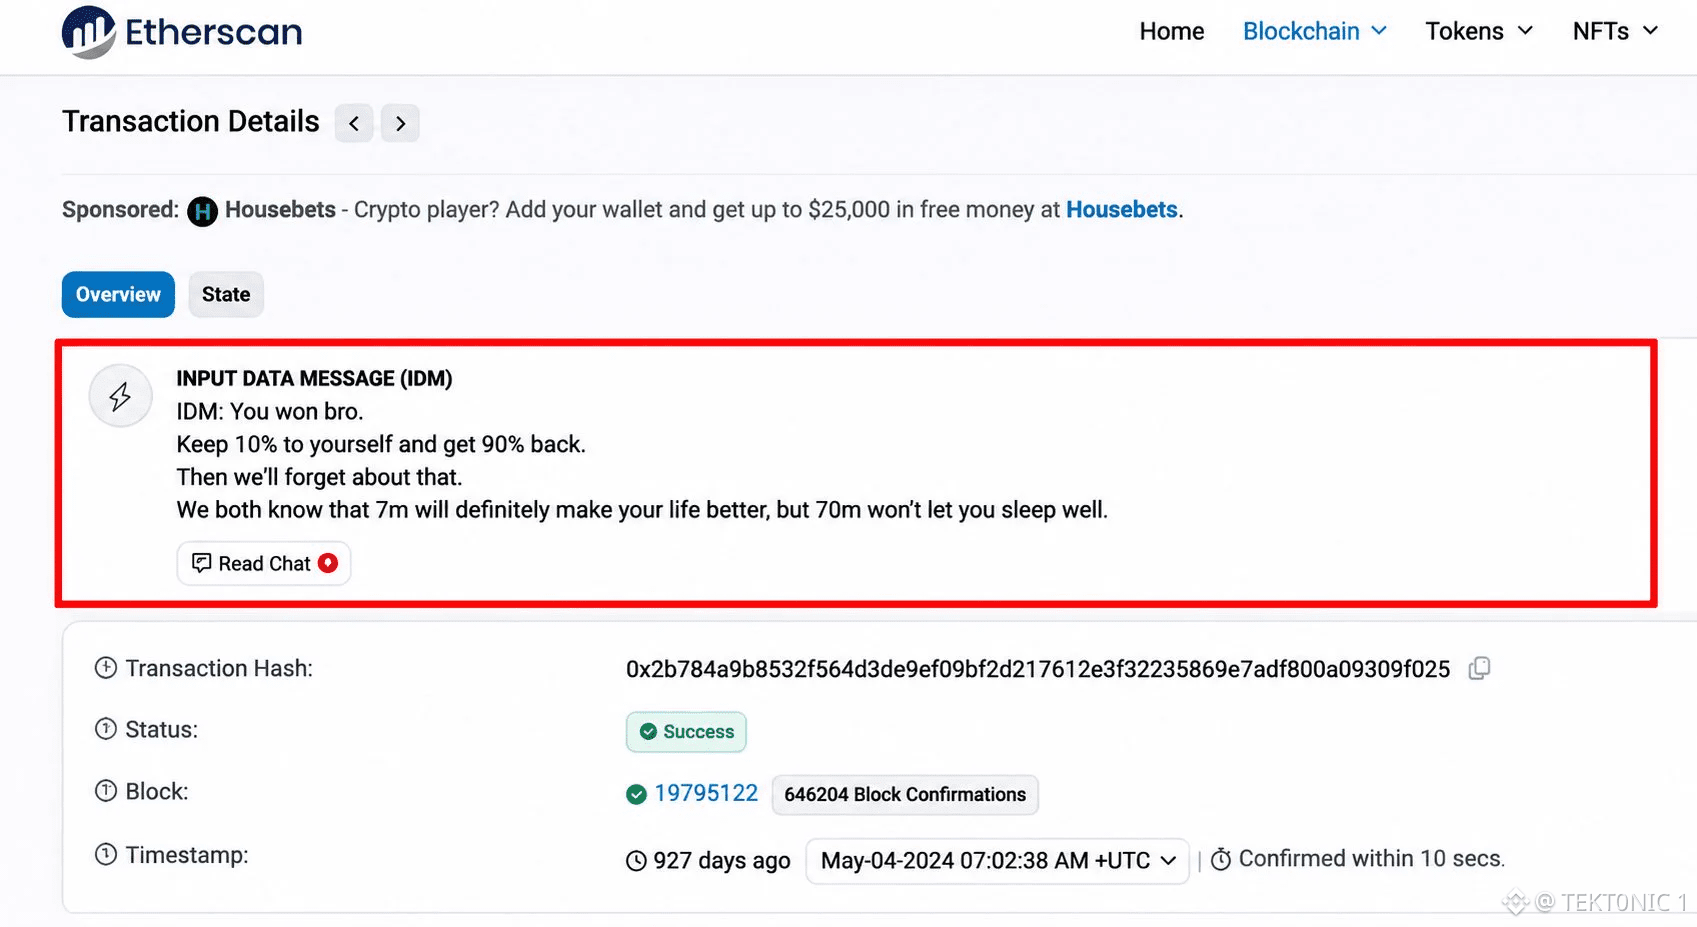
a crypto whale lost $71 million to an address-poisoning scam. instead of giving up, the victim negotiated directly with the attacker through an ethereum transaction message — and recovered approximately $65.7 million. 👀😂 the incident happened on may 3, 2024, when the victim mistakenly sent 1,155 wrapped bitcoin (WBTC) to a fraudulent wallet. the attacker had created an address that closely resembled one the victim had previously used. this is known as address poisoning: scammers send transactions from lookalike addresses to make them appear in a wallet's transaction history, hoping the victim will copy the wrong address during a future transfer. after the funds disappeared, the victim started sending messages through ethereum transactions, offering the attacker 10% of the stolen amount in exchange for returning the remaining 90%. one message read: "you've won, brother. you can keep 10% and return 90%. we both know that $7 million will definitely make your life better, but $70 million won't let you sleep well." the negotiations eventually worked. on may 9, the attacker began returning the funds in ETH, and blockchain data showed that the victim recovered nearly all the available value. according to Chainalysis, the attacker returned approximately $68 million in ETH, while retaining around $3 million in gains from changes in token prices. the case shows that blockchain transactions are not just financial transfers. ethereum's input data field can also carry messages, allowing wallet owners to communicate directly through onchain activity. it also reinforces a basic security lesson: never rely on a wallet's transaction history to copy an address. always verify the complete destination address before sending funds. #BTC Price Analysis# #Bitcoin Price Prediction: What is Bitcoins next move?# #Macro Insights# $BTC $ETH
a crypto whale lost $71 million to an address-poisoning scam. instead of giving up, the victim negotiated directly with the attacker through an ethereum transaction message — and recovered approximately $65.7 million. 👀😂 the incident happened on may 3, 2024, when the victim mistakenly sent 1,155 wrapped bitcoin (WBTC) to a fraudulent wallet. the attacker had created an address that closely resembled one the victim had previously used. this is known as address poisoning: scammers send transactions from lookalike addresses to make them appear in a wallet's transaction history, hoping the victim will copy the wrong address during a future transfer. after the funds disappeared, the victim started sending messages through ethereum transactions, offering the attacker 10% of the stolen amount in exchange for returning the remaining 90%. one message read: "you've won, brother. you can keep 10% and return 90%. we both know that $7 million will definitely make your life better, but $70 million won't let you sleep well." the negotiations eventually worked. on may 9, the attacker began returning the funds in ETH, and blockchain data showed that the victim recovered nearly all the available value. according to Chainalysis, the attacker returned approximately $68 million in ETH, while retaining around $3 million in gains from changes in token prices. the case shows that blockchain transactions are not just financial transfers. ethereum's input data field can also carry messages, allowing wallet owners to communicate directly through onchain activity. it also reinforces a basic security lesson: never rely on a wallet's transaction history to copy an address. always verify the complete destination address before sending funds. #BTC Price Analysis# #Bitcoin Price Prediction: What is Bitcoins next move?# #Macro Insights# $BTC $ETH
·
--
Переглянути переклад
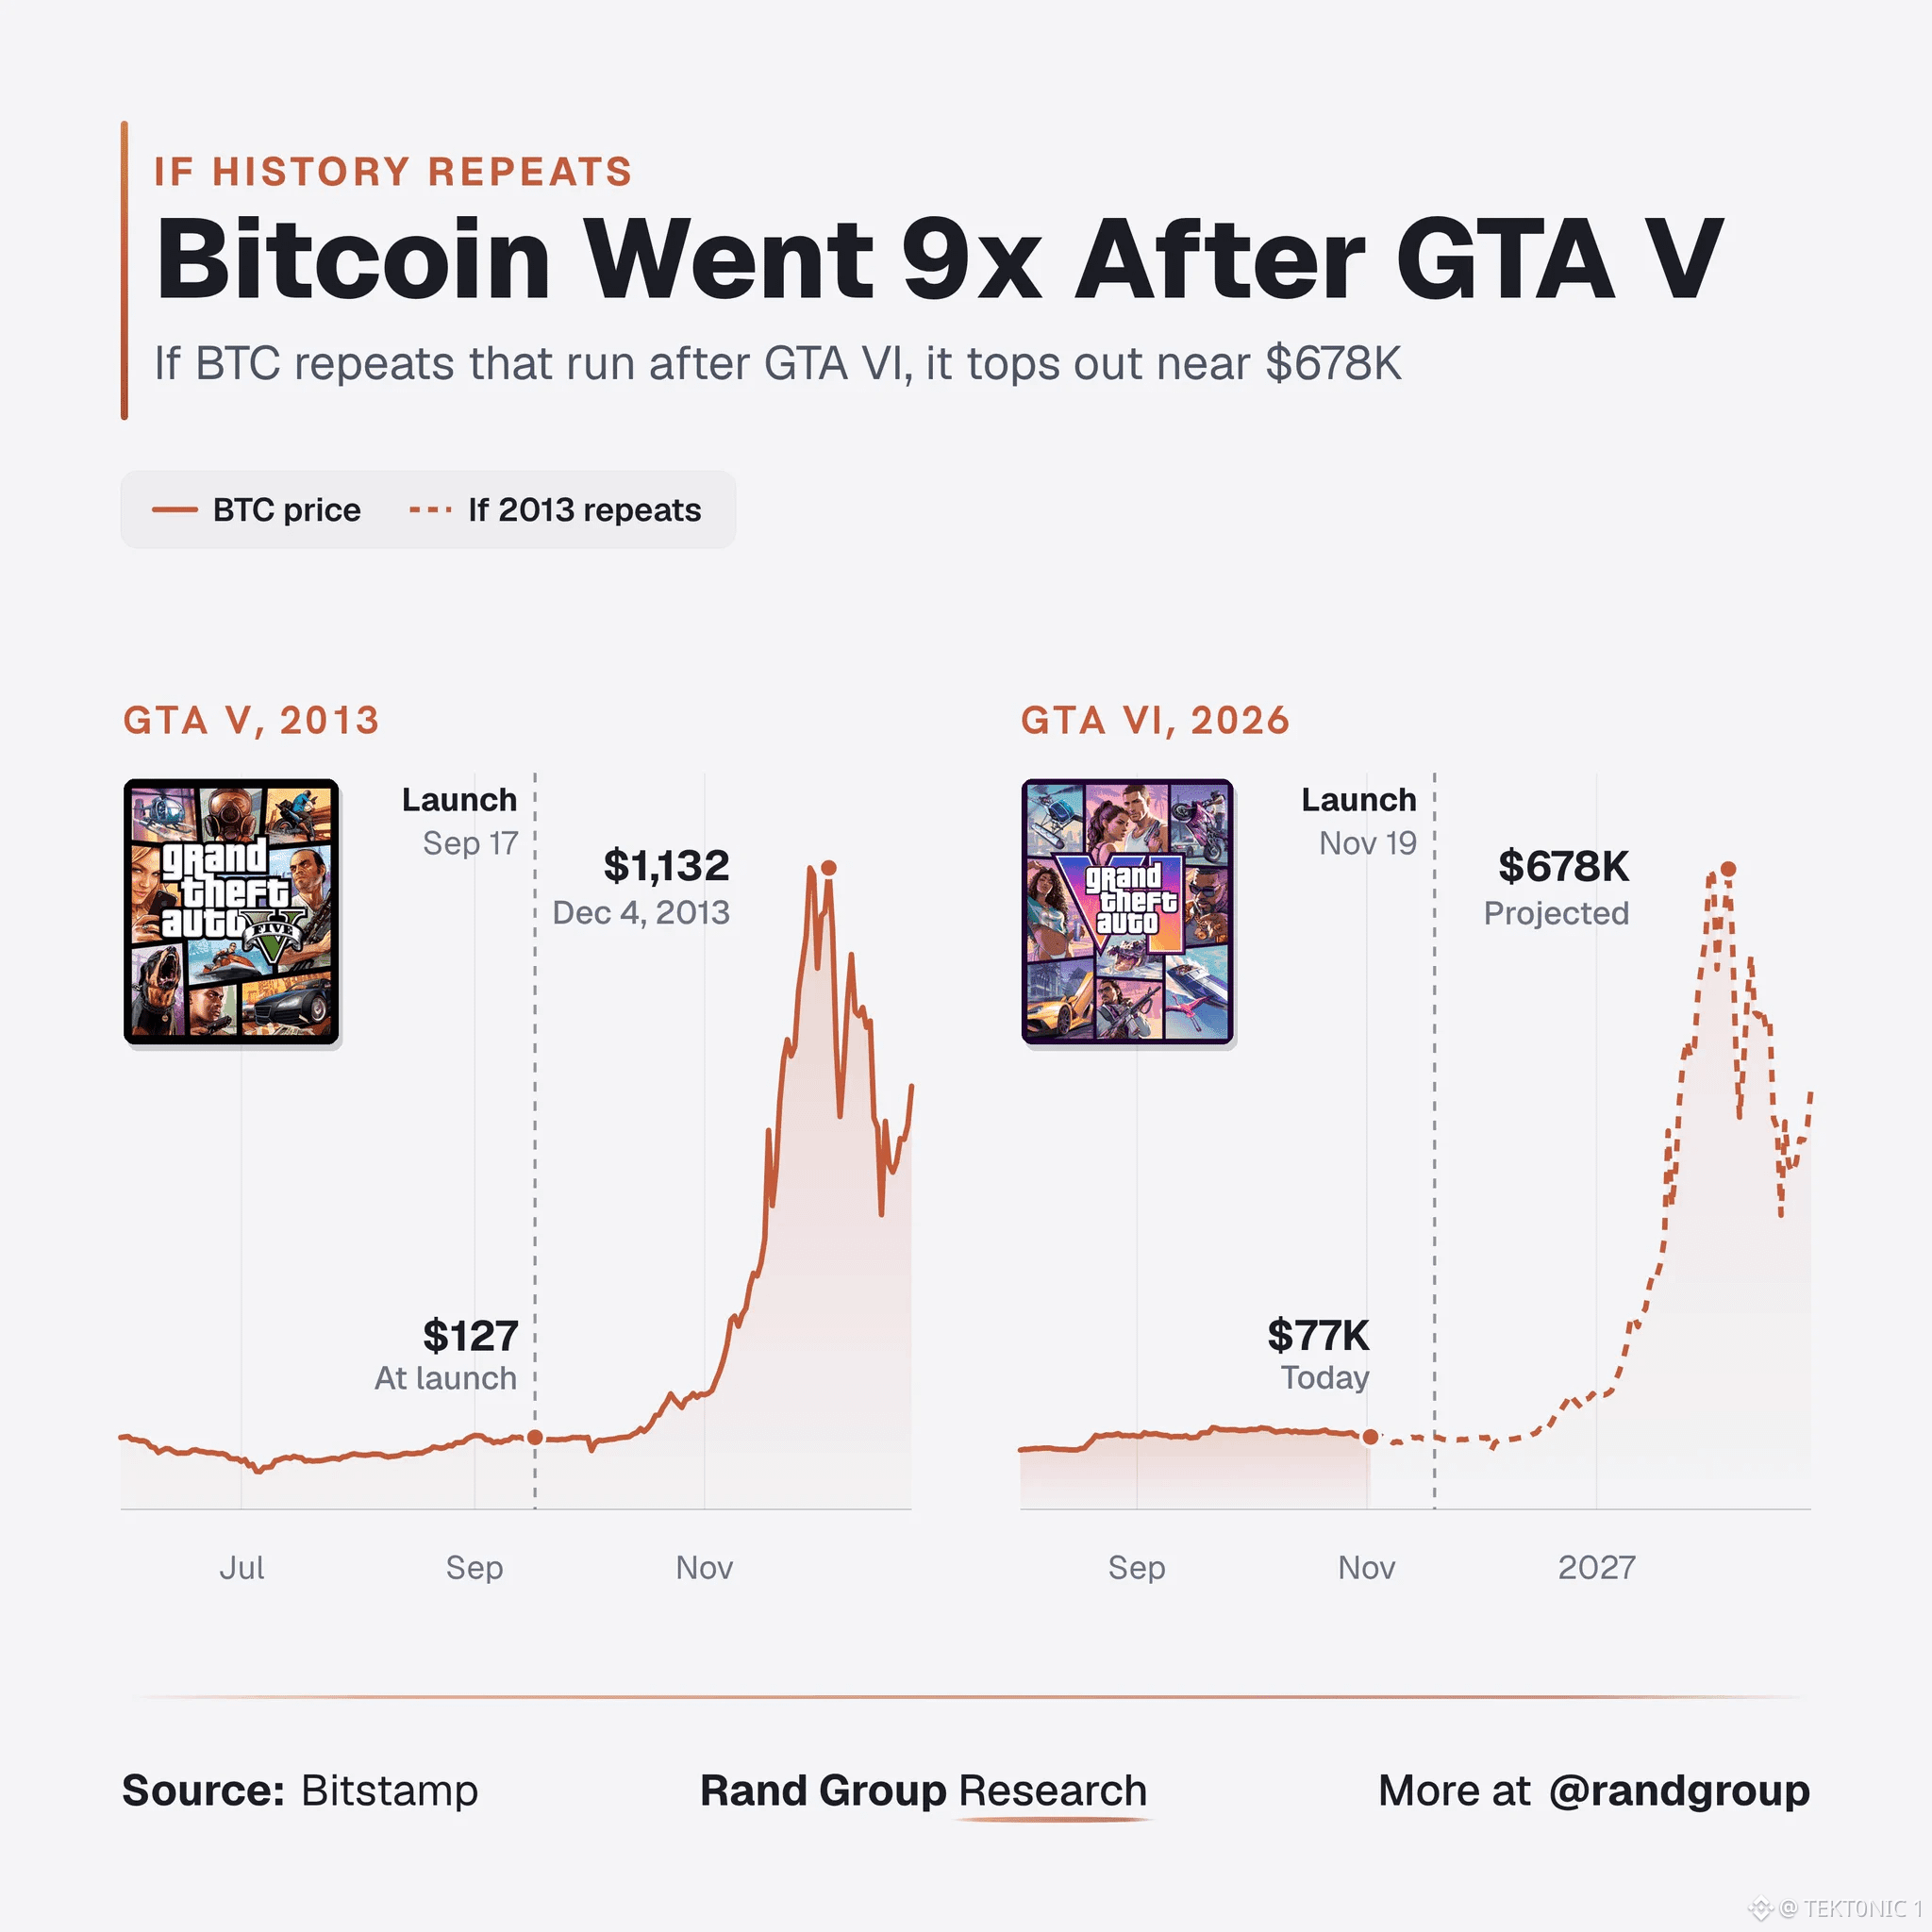
bitcoin delivered an almost 9x rally in the weeks following gta v's launch in 2013. with gta vi arriving tomorrow, traders are revisiting the historical comparison. gta v launched on september 17, 2013, when bitcoin was trading around $127. by december 4, $BTC had reached approximately $1,132, representing an 8.9x increase in just 78 days. now, more than 13 years later, gta vi is set to launch on november 19, 2026, while bitcoin trades around $62,300. if $BTC repeated the same 8.9x performance from its current price, it would reach approximately $555,000. that would represent a massive move, but the historical comparison needs context. bitcoin's 2013 rally happened during an early adoption phase, when the market was much smaller and more volatile. today's market has institutional investors, spot ETFs, deeper liquidity and a significantly larger market capitalization. the timing of gta v's release and bitcoin's rally was a historical coincidence, not evidence that a major video game launch drives crypto prices. still, the comparison gives traders an interesting historical scenario to watch. repeating the same percentage gain would require a very different amount of capital in today's bitcoin market. source: Bitstamp historical BTC prices; Rockstar Games #BTC Price Analysis# #Bitcoin Price Prediction: What is Bitcoins next move?# #Macro Insights# $XRP
bitcoin delivered an almost 9x rally in the weeks following gta v's launch in 2013. with gta vi arriving tomorrow, traders are revisiting the historical comparison. gta v launched on september 17, 2013, when bitcoin was trading around $127. by december 4, $BTC had reached approximately $1,132, representing an 8.9x increase in just 78 days. now, more than 13 years later, gta vi is set to launch on november 19, 2026, while bitcoin trades around $62,300. if $BTC repeated the same 8.9x performance from its current price, it would reach approximately $555,000. that would represent a massive move, but the historical comparison needs context. bitcoin's 2013 rally happened during an early adoption phase, when the market was much smaller and more volatile. today's market has institutional investors, spot ETFs, deeper liquidity and a significantly larger market capitalization. the timing of gta v's release and bitcoin's rally was a historical coincidence, not evidence that a major video game launch drives crypto prices. still, the comparison gives traders an interesting historical scenario to watch. repeating the same percentage gain would require a very different amount of capital in today's bitcoin market. source: Bitstamp historical BTC prices; Rockstar Games #BTC Price Analysis# #Bitcoin Price Prediction: What is Bitcoins next move?# #Macro Insights# $XRP
·
--
Переглянути переклад
GTA vi is set to become the cheapest mainline grand theft auto release in real terms, despite having the highest launch price on the original price tag. 👀 rockstar has priced the standard edition at $79.99 for its november 19, 2026 launch. at first glance, that's more expensive than previous entries. however, adjusting earlier US launch prices for inflation changes the comparison. using the US consumer price index, the launch prices of previous titles work out to: > GTA iii (2001): $94.95 > vice city (2002): $93.06 > san andreas (2004): $88.38 > GTA iv (2008): $94.25 > GTA v (2013): $86.47 gta vi's $79.99 price is lower than all five when compared in 2026 dollars. against gta v, that's approximately 7.5% cheaper in inflation-adjusted terms. the reason is simple: game prices have not increased at the same pace as general consumer prices over the past decade. gta vi costs more in nominal dollars, but its launch price has less purchasing power than the $59.99 charged for gta v in 2013. this comparison covers the standard US editions and adjusts for inflation. it does not account for regional pricing, taxes, special editions or the cost of gaming hardware. so while $79.99 may look like a premium price, its real cost is lower than what players paid to buy earlier mainline GTA games at launch. source: Rand Group Research, US BLS CPI-U and Rockstar Games #Bitcoin Price Prediction: What is Bitcoins next move?# #Gaming #Bullish $BTC $XRP
GTA vi is set to become the cheapest mainline grand theft auto release in real terms, despite having the highest launch price on the original price tag. 👀 rockstar has priced the standard edition at $79.99 for its november 19, 2026 launch. at first glance, that's more expensive than previous entries. however, adjusting earlier US launch prices for inflation changes the comparison. using the US consumer price index, the launch prices of previous titles work out to: > GTA iii (2001): $94.95 > vice city (2002): $93.06 > san andreas (2004): $88.38 > GTA iv (2008): $94.25 > GTA v (2013): $86.47 gta vi's $79.99 price is lower than all five when compared in 2026 dollars. against gta v, that's approximately 7.5% cheaper in inflation-adjusted terms. the reason is simple: game prices have not increased at the same pace as general consumer prices over the past decade. gta vi costs more in nominal dollars, but its launch price has less purchasing power than the $59.99 charged for gta v in 2013. this comparison covers the standard US editions and adjusts for inflation. it does not account for regional pricing, taxes, special editions or the cost of gaming hardware. so while $79.99 may look like a premium price, its real cost is lower than what players paid to buy earlier mainline GTA games at launch. source: Rand Group Research, US BLS CPI-U and Rockstar Games #Bitcoin Price Prediction: What is Bitcoins next move?# #Gaming #Bullish $BTC $XRP

·
--
Переглянути переклад
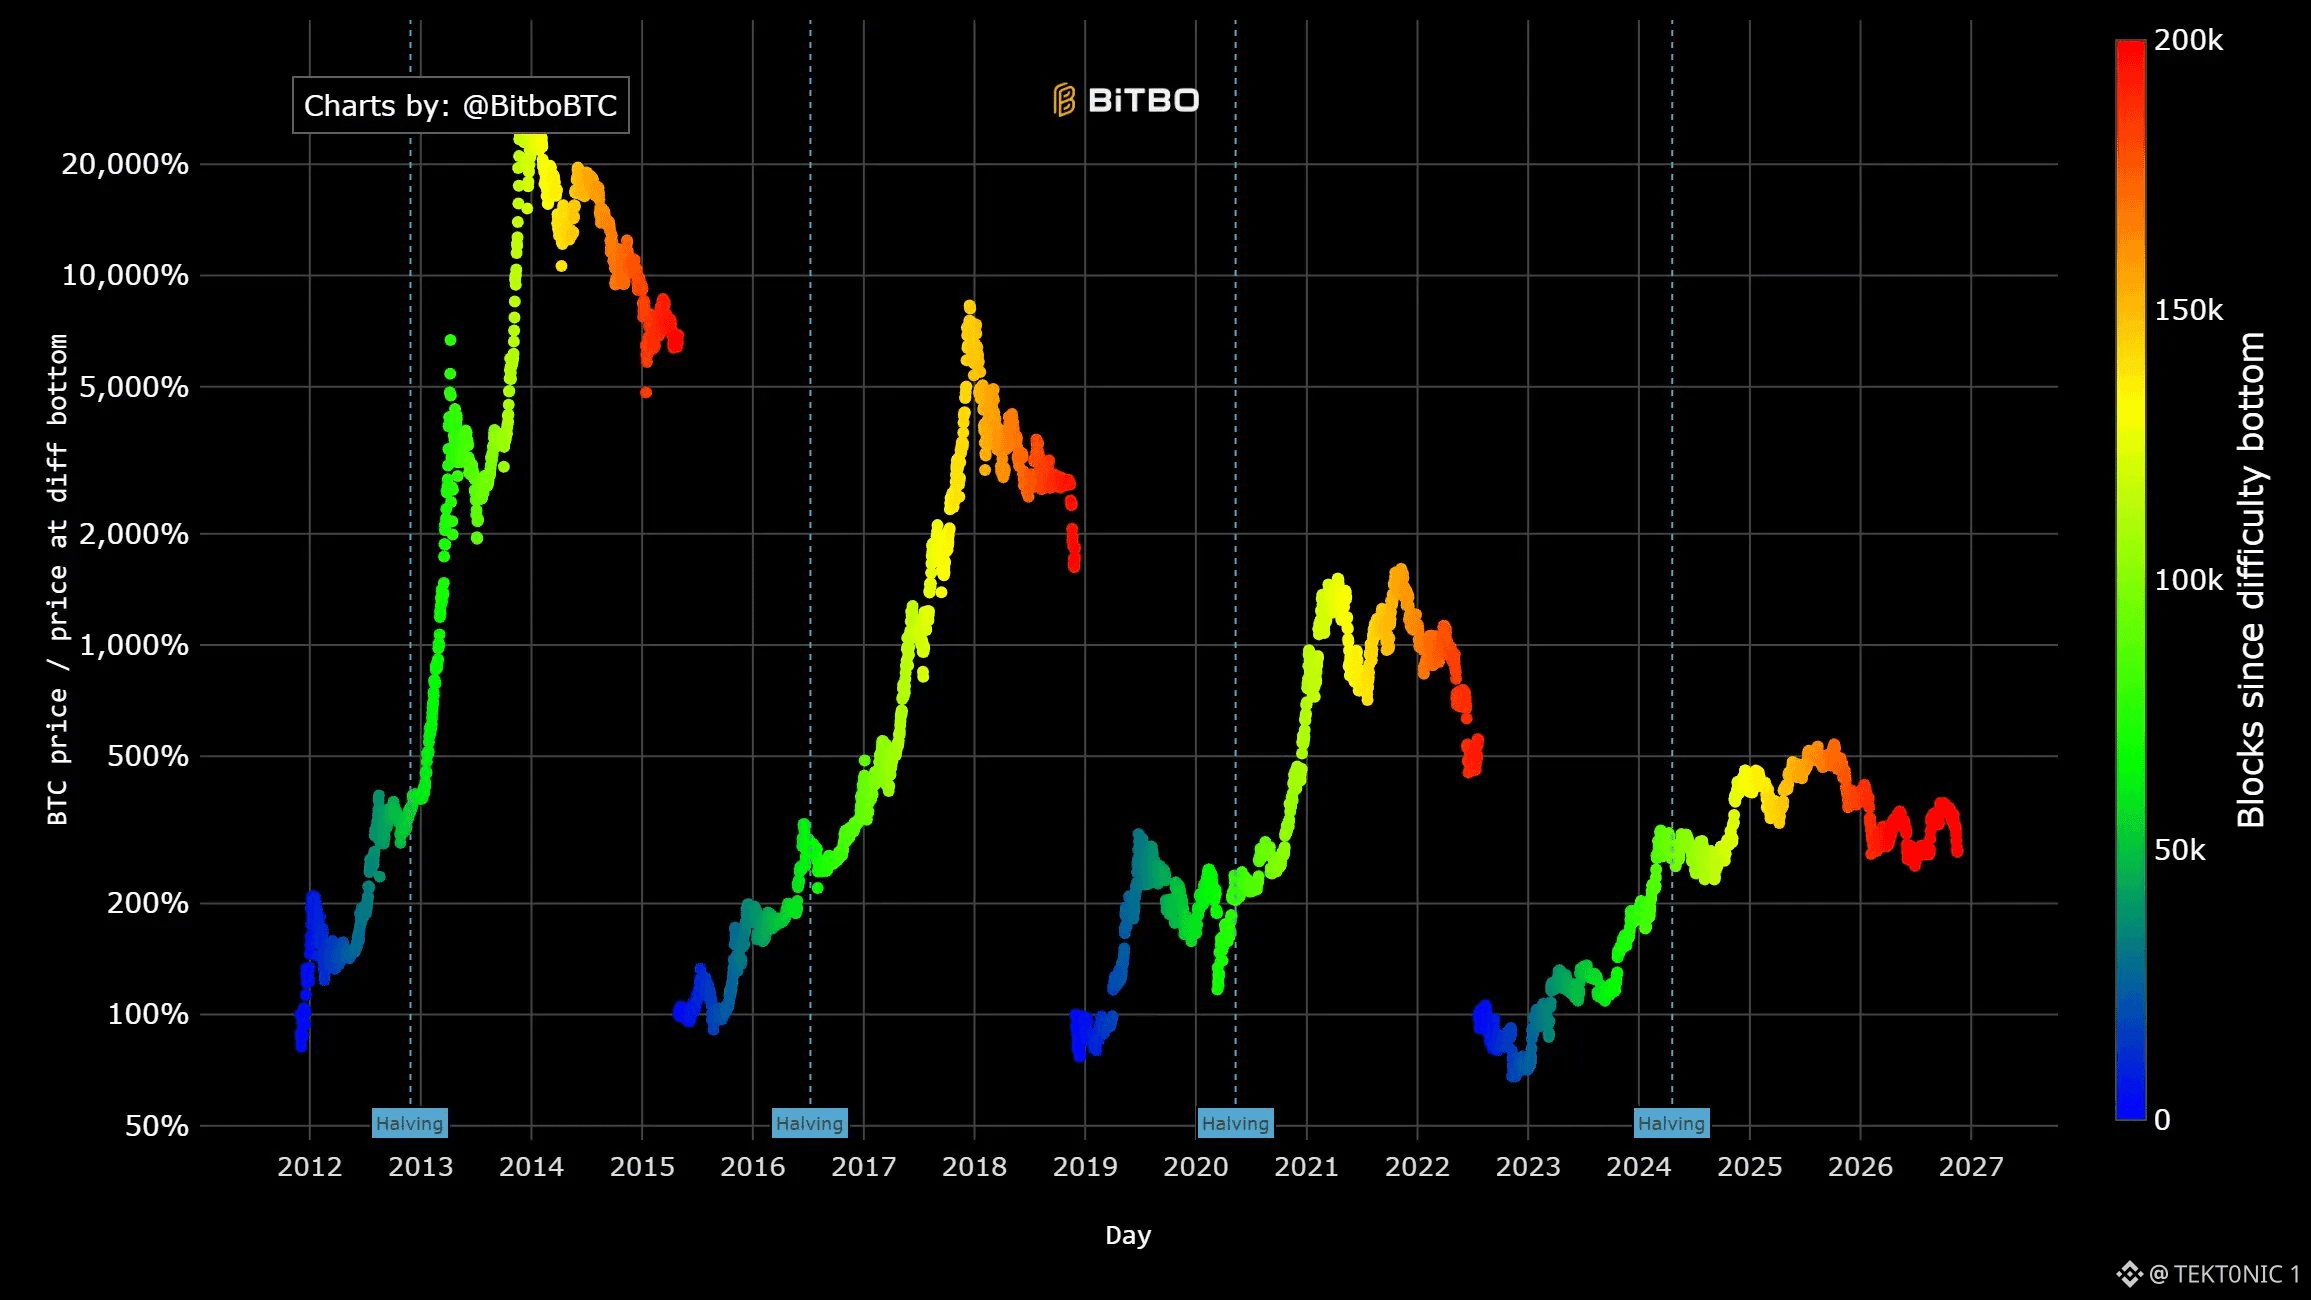
The pressure on bitcoin miners is increasing, and the latest mining data shows why. 👀 bitcoin's mining economics remain weak, with revenue per unit of computing power falling while operating costs continue to squeeze margins. according to Hashrate Index, $BTC hashprice fell 8.7% in the week leading to November 2, dropping from $35.99 to $32.86 per PH/s per day. hashprice measures how much revenue a miner can generate from a given amount of computing power each day. when revenue falls below the cost of electricity and operations, mining becomes unprofitable. less efficient machines and miners paying higher electricity rates are hit first. CoinShares reported that publicly listed bitcoin miners had an average cash cost of approximately $75,500 to produce one $BTC in Q2 2026, while the network's average hashprice reached a record low of $27.70 per PH/s per day in June. this pressure has already forced some operators to switch off older equipment, reduce capacity or redirect resources towards AI and high-performance computing. however, mining is not equally unprofitable for everyone. operators with efficient hardware and access to cheaper electricity can remain profitable even when others are operating at a loss. the chart tracks bitcoin's price relative to the price at a difficulty bottom; it does not directly measure individual miners' profit or loss. the broader mining data, however, shows how difficult the current economics have become. source: BitboBTC chart, Hashrate Index and CoinShares mining report. #BTC Price Analysis# #Bitcoin Price Prediction: What is Bitcoins next move?# #Macro Insights# $ETH
The pressure on bitcoin miners is increasing, and the latest mining data shows why. 👀 bitcoin's mining economics remain weak, with revenue per unit of computing power falling while operating costs continue to squeeze margins. according to Hashrate Index, $BTC hashprice fell 8.7% in the week leading to November 2, dropping from $35.99 to $32.86 per PH/s per day. hashprice measures how much revenue a miner can generate from a given amount of computing power each day. when revenue falls below the cost of electricity and operations, mining becomes unprofitable. less efficient machines and miners paying higher electricity rates are hit first. CoinShares reported that publicly listed bitcoin miners had an average cash cost of approximately $75,500 to produce one $BTC in Q2 2026, while the network's average hashprice reached a record low of $27.70 per PH/s per day in June. this pressure has already forced some operators to switch off older equipment, reduce capacity or redirect resources towards AI and high-performance computing. however, mining is not equally unprofitable for everyone. operators with efficient hardware and access to cheaper electricity can remain profitable even when others are operating at a loss. the chart tracks bitcoin's price relative to the price at a difficulty bottom; it does not directly measure individual miners' profit or loss. the broader mining data, however, shows how difficult the current economics have become. source: BitboBTC chart, Hashrate Index and CoinShares mining report. #BTC Price Analysis# #Bitcoin Price Prediction: What is Bitcoins next move?# #Macro Insights# $ETH
·
--
Переглянути переклад
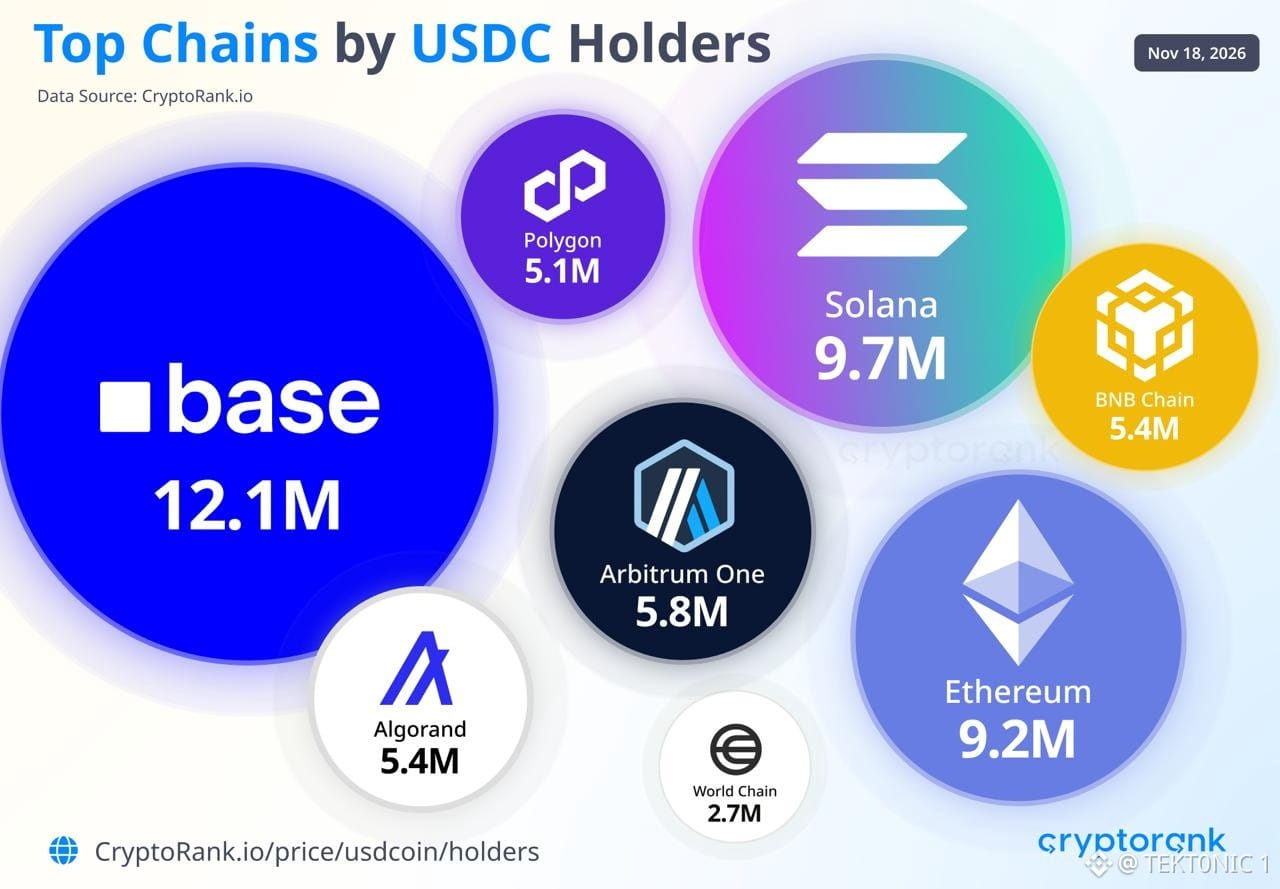
base has overtaken solana and ethereum to become the largest chain by USDC holder count, with approximately 12.1 million holders. 👀 according to CryptoRank, the top networks by USDC holders are: 🥇 base — 12.1m 🥈 solana — 9.7m 🥉 ethereum — 9.2m 4. arbitrum one — 5.8m 5. bnb chain — 5.4m 6. algorand — 5.4m 7. polygon — 5.1m 8. world chain — 2.7m base's lead is notable because it has moved ahead of two of the largest established ecosystems for USDC distribution. this reflects how stablecoin activity is spreading across different blockchain networks. #BASE offers access to ethereum-compatible applications with lower transaction costs, while solana provides a separate high-throughput environment for payments, trading and onchain finance. USDC's role also extends beyond trading. it is used for transfers, payments, DeFi liquidity and settlement, allowing users to move dollar-denominated value without relying entirely on traditional banking rails. Circle's USDC is also MiCA-compliant in the European Union, giving it a regulated position in one of the world's major financial markets. holder counts measure the number of addresses holding USDC, not necessarily unique individuals. one person can hold USDC across multiple wallets and networks. the ranking shows where USDC addresses are distributed, offering a useful view of adoption across competing blockchain ecosystems. source: CryptoRank — cryptorank.io/price/usdcoin/holders #BTC Price Analysis# #Macro Insights# #Bullish $ETH $SOL
base has overtaken solana and ethereum to become the largest chain by USDC holder count, with approximately 12.1 million holders. 👀 according to CryptoRank, the top networks by USDC holders are: 🥇 base — 12.1m 🥈 solana — 9.7m 🥉 ethereum — 9.2m 4. arbitrum one — 5.8m 5. bnb chain — 5.4m 6. algorand — 5.4m 7. polygon — 5.1m 8. world chain — 2.7m base's lead is notable because it has moved ahead of two of the largest established ecosystems for USDC distribution. this reflects how stablecoin activity is spreading across different blockchain networks. #BASE offers access to ethereum-compatible applications with lower transaction costs, while solana provides a separate high-throughput environment for payments, trading and onchain finance. USDC's role also extends beyond trading. it is used for transfers, payments, DeFi liquidity and settlement, allowing users to move dollar-denominated value without relying entirely on traditional banking rails. Circle's USDC is also MiCA-compliant in the European Union, giving it a regulated position in one of the world's major financial markets. holder counts measure the number of addresses holding USDC, not necessarily unique individuals. one person can hold USDC across multiple wallets and networks. the ranking shows where USDC addresses are distributed, offering a useful view of adoption across competing blockchain ecosystems. source: CryptoRank — cryptorank.io/price/usdcoin/holders #BTC Price Analysis# #Macro Insights# #Bullish $ETH $SOL
·
--
Переглянути переклад
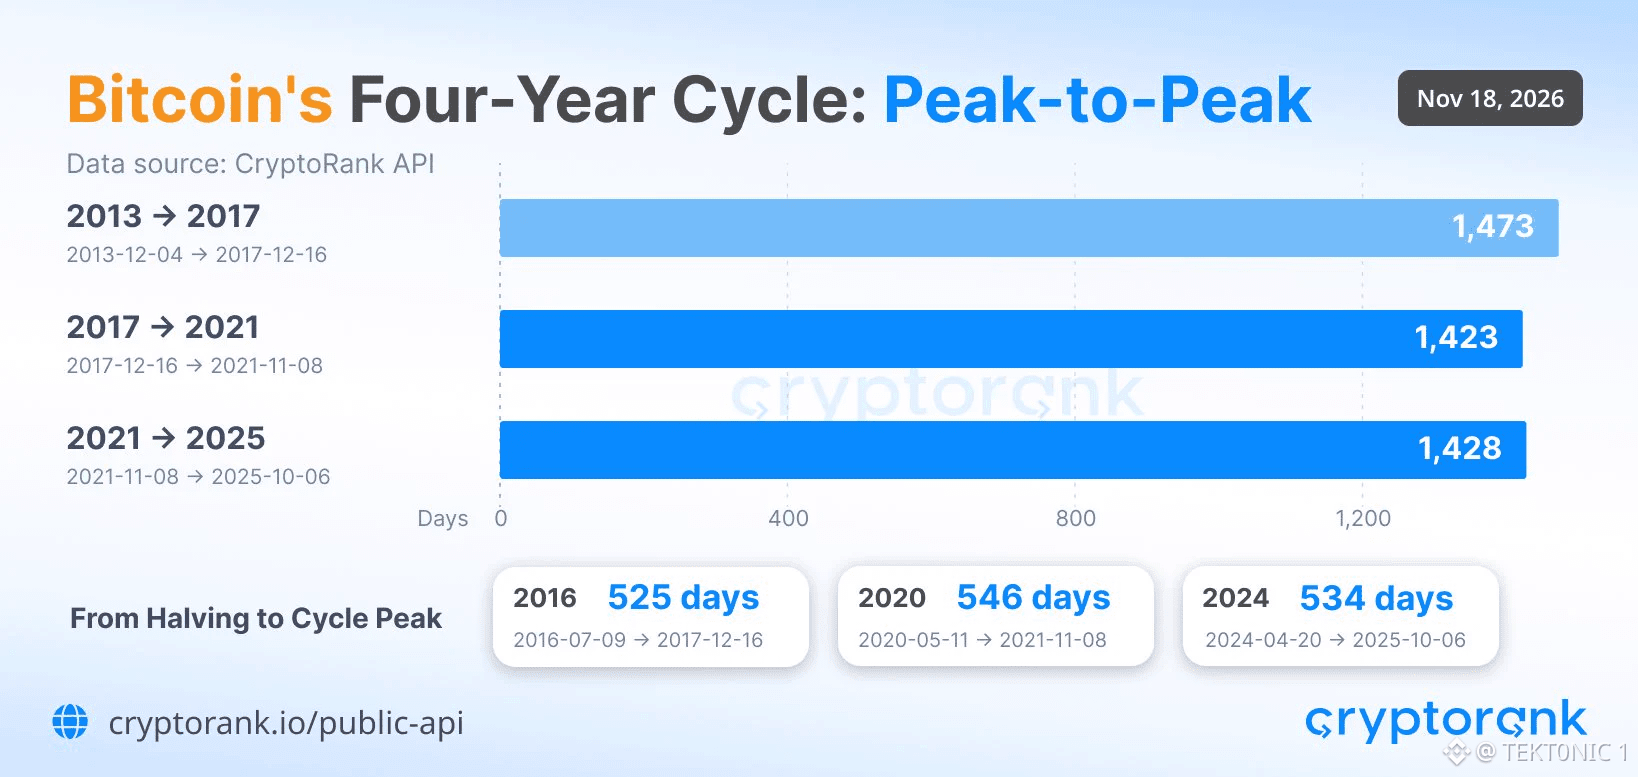
bitcoin's next cycle peak could arrive around september 2029 if its historical four-year timing pattern continues. 👀 data from CryptoRank shows that the time between $BTC major market peaks has remained remarkably consistent across three completed cycles: 2013 → 2017: 1,473 days 2017 → 2021: 1,423 days 2021 → 2025: 1,428 days that's an average of approximately 1,441 days, or just under four years between peaks. the latest cycle peak occurred on october 6, 2025. adding the historical average points to september 16, 2029 as a potential date for the next peak. the timing is also supported by another historical pattern. $BTC 's previous cycle peaks arrived 525 days after the 2016 halving, 546 days after the 2020 halving and 534 days after the 2024 halving. the average is approximately 535 days after a halving. with the next halving expected around april 2028, that points to a similar september 2029 window. however, consistent timing does not guarantee identical market conditions. #Bitcoin 's peak-to-peak returns have already declined across cycles, while spot ETFs, institutional capital and deeper derivatives markets are changing how the market behaves. the historical data gives traders a timeline to watch, not a date they can rely on. the next cycle may follow the same schedule while producing a very different price outcome. #Bitcoin Price Prediction: What is Bitcoins next move?# #BTC Price Analysis# $XRP
bitcoin's next cycle peak could arrive around september 2029 if its historical four-year timing pattern continues. 👀 data from CryptoRank shows that the time between $BTC major market peaks has remained remarkably consistent across three completed cycles: 2013 → 2017: 1,473 days 2017 → 2021: 1,423 days 2021 → 2025: 1,428 days that's an average of approximately 1,441 days, or just under four years between peaks. the latest cycle peak occurred on october 6, 2025. adding the historical average points to september 16, 2029 as a potential date for the next peak. the timing is also supported by another historical pattern. $BTC 's previous cycle peaks arrived 525 days after the 2016 halving, 546 days after the 2020 halving and 534 days after the 2024 halving. the average is approximately 535 days after a halving. with the next halving expected around april 2028, that points to a similar september 2029 window. however, consistent timing does not guarantee identical market conditions. #Bitcoin 's peak-to-peak returns have already declined across cycles, while spot ETFs, institutional capital and deeper derivatives markets are changing how the market behaves. the historical data gives traders a timeline to watch, not a date they can rely on. the next cycle may follow the same schedule while producing a very different price outcome. #Bitcoin Price Prediction: What is Bitcoins next move?# #BTC Price Analysis# $XRP
·
--
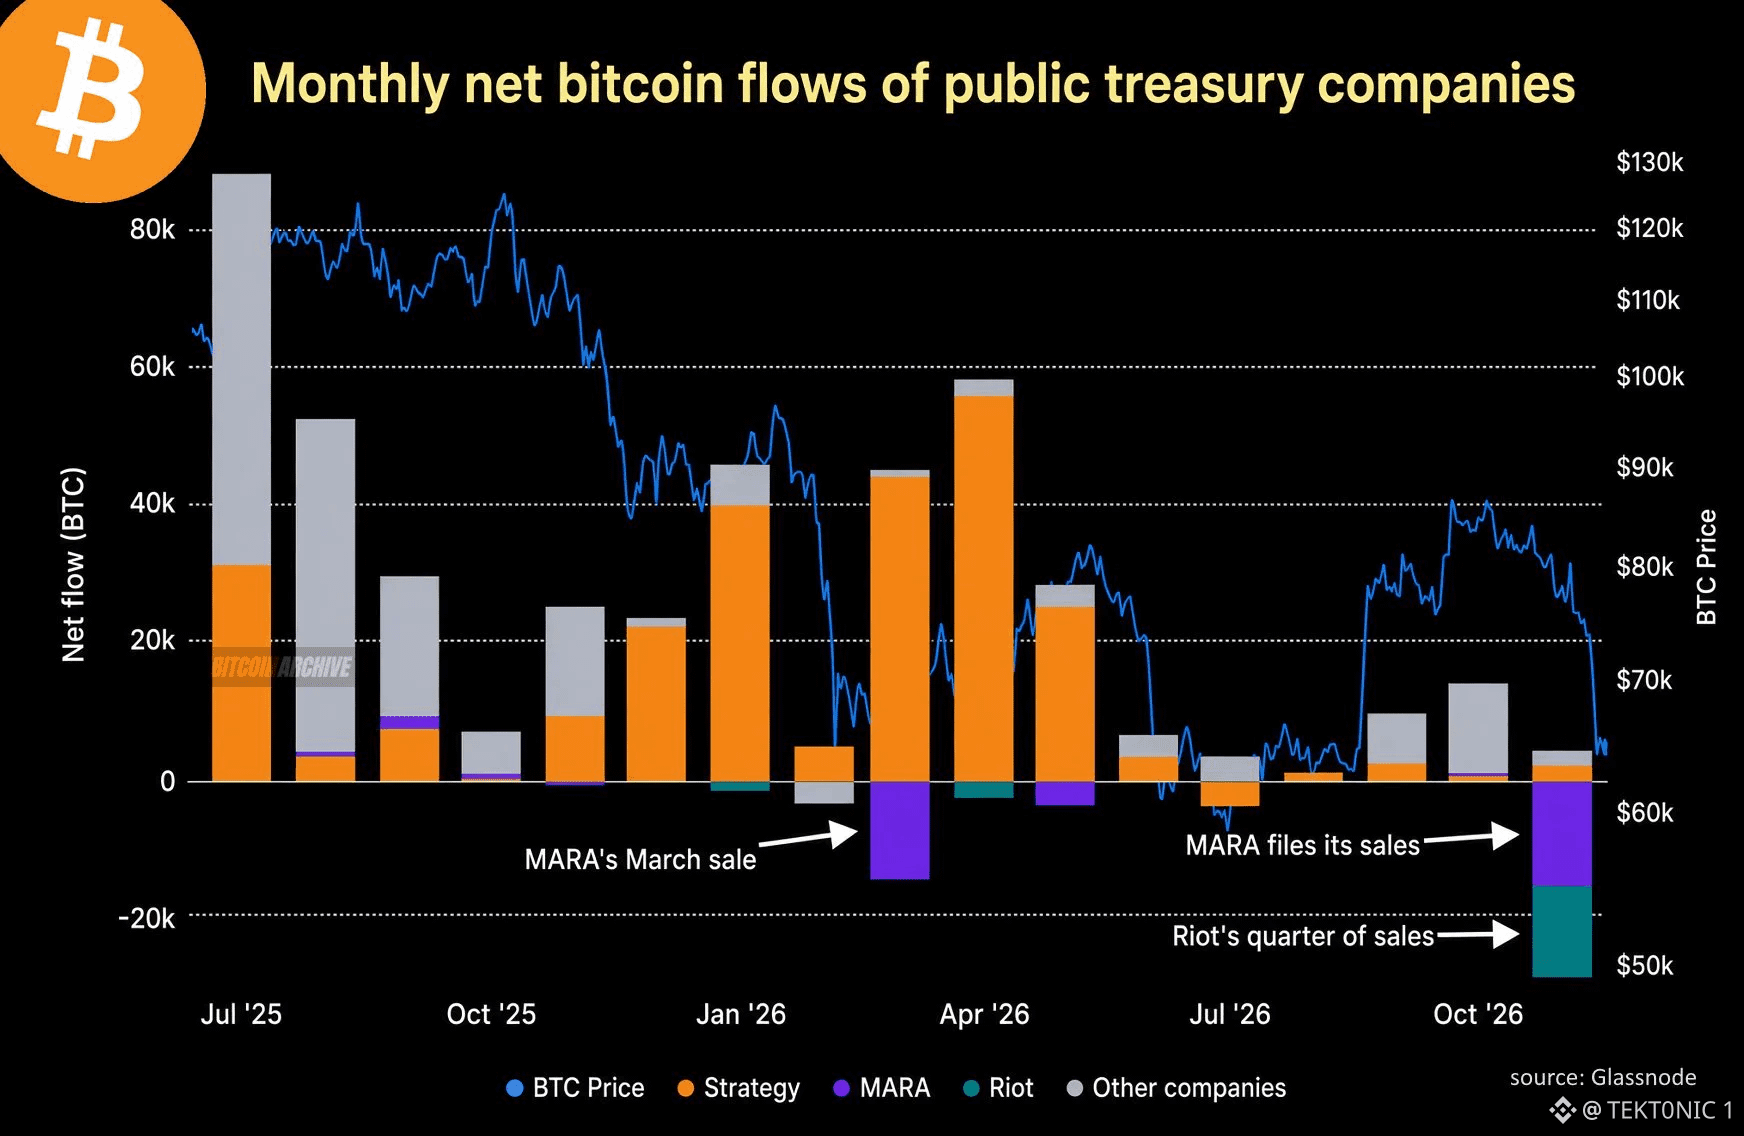
Дані Glassnode свідчать, що за останні місяці MARA і Riot продали загалом 28 000 біткоїнів, на які припала більша частина тиску продажів з боку публічних компаній, тоді як інші компанії з біткоїн-резервами залишалися чистими покупцями. На графіку показано щомісячні чисті потоки біткоїнів за компаніями. Помаранчеві стовпчики Strategy залишалися позитивними протягом більшої частини 2025 і 2026 років, тоді як фіолетові стовпчики MARA та бірюзові стовпчики Riot у березні, а потім знову в останньому кварталі стали негативними. Сукупні продажі двох майнерів обсягом 28 000 $BTC виділяються на тлі сірих стовпчиків інших компаній, обсяги яких були меншими й різноспрямованими. За той самий період ціна біткоїна (синя лінія) знизилася з понад $120 000 до діапазону $60 000–$70 000. Продажі майнерів додають на ринок монети, які мають викупити інші покупці. Strategy та решта компаній із біткоїн-резервами продовжували чисте накопичення, частково компенсуючи відтік від майнерів. На графіку продаж MARA у березні та продажі Riot в останньому кварталі позначені як основні негативні внески. За кілька місяців чистий результат усіх публічних компаній із біткоїн-резервами все ще був позитивним, але продажі майнерів спричинили концентровану пропозицію. Показник у 28 000 $BTC охоплює видимі продажі MARA та Riot. Якщо ці компанії продовжать продавати, а Strategy та інші — купувати, чистий потік від публічних компаній залежатиме від того, яка зі сторін переважить. Дані свідчать, що нещодавній тиск продажів походив переважно від двох майнерів, а не від ширшої групи компаній із біткоїн-резервами. #Аналіз ціни BTC# #Прогноз ціни біткоїна: який наступний крок біткоїна?# #Макроекономічні огляди# $SOL
Дані Glassnode свідчать, що за останні місяці MARA і Riot продали загалом 28 000 біткоїнів, на які припала більша частина тиску продажів з боку публічних компаній, тоді як інші компанії з біткоїн-резервами залишалися чистими покупцями. На графіку показано щомісячні чисті потоки біткоїнів за компаніями. Помаранчеві стовпчики Strategy залишалися позитивними протягом більшої частини 2025 і 2026 років, тоді як фіолетові стовпчики MARA та бірюзові стовпчики Riot у березні, а потім знову в останньому кварталі стали негативними. Сукупні продажі двох майнерів обсягом 28 000 $BTC виділяються на тлі сірих стовпчиків інших компаній, обсяги яких були меншими й різноспрямованими. За той самий період ціна біткоїна (синя лінія) знизилася з понад $120 000 до діапазону $60 000–$70 000. Продажі майнерів додають на ринок монети, які мають викупити інші покупці. Strategy та решта компаній із біткоїн-резервами продовжували чисте накопичення, частково компенсуючи відтік від майнерів. На графіку продаж MARA у березні та продажі Riot в останньому кварталі позначені як основні негативні внески. За кілька місяців чистий результат усіх публічних компаній із біткоїн-резервами все ще був позитивним, але продажі майнерів спричинили концентровану пропозицію. Показник у 28 000 $BTC охоплює видимі продажі MARA та Riot. Якщо ці компанії продовжать продавати, а Strategy та інші — купувати, чистий потік від публічних компаній залежатиме від того, яка зі сторін переважить. Дані свідчать, що нещодавній тиск продажів походив переважно від двох майнерів, а не від ширшої групи компаній із біткоїн-резервами. #Аналіз ціни BTC# #Прогноз ціни біткоїна: який наступний крок біткоїна?# #Макроекономічні огляди# $SOL
2
·
--
Переглянути переклад
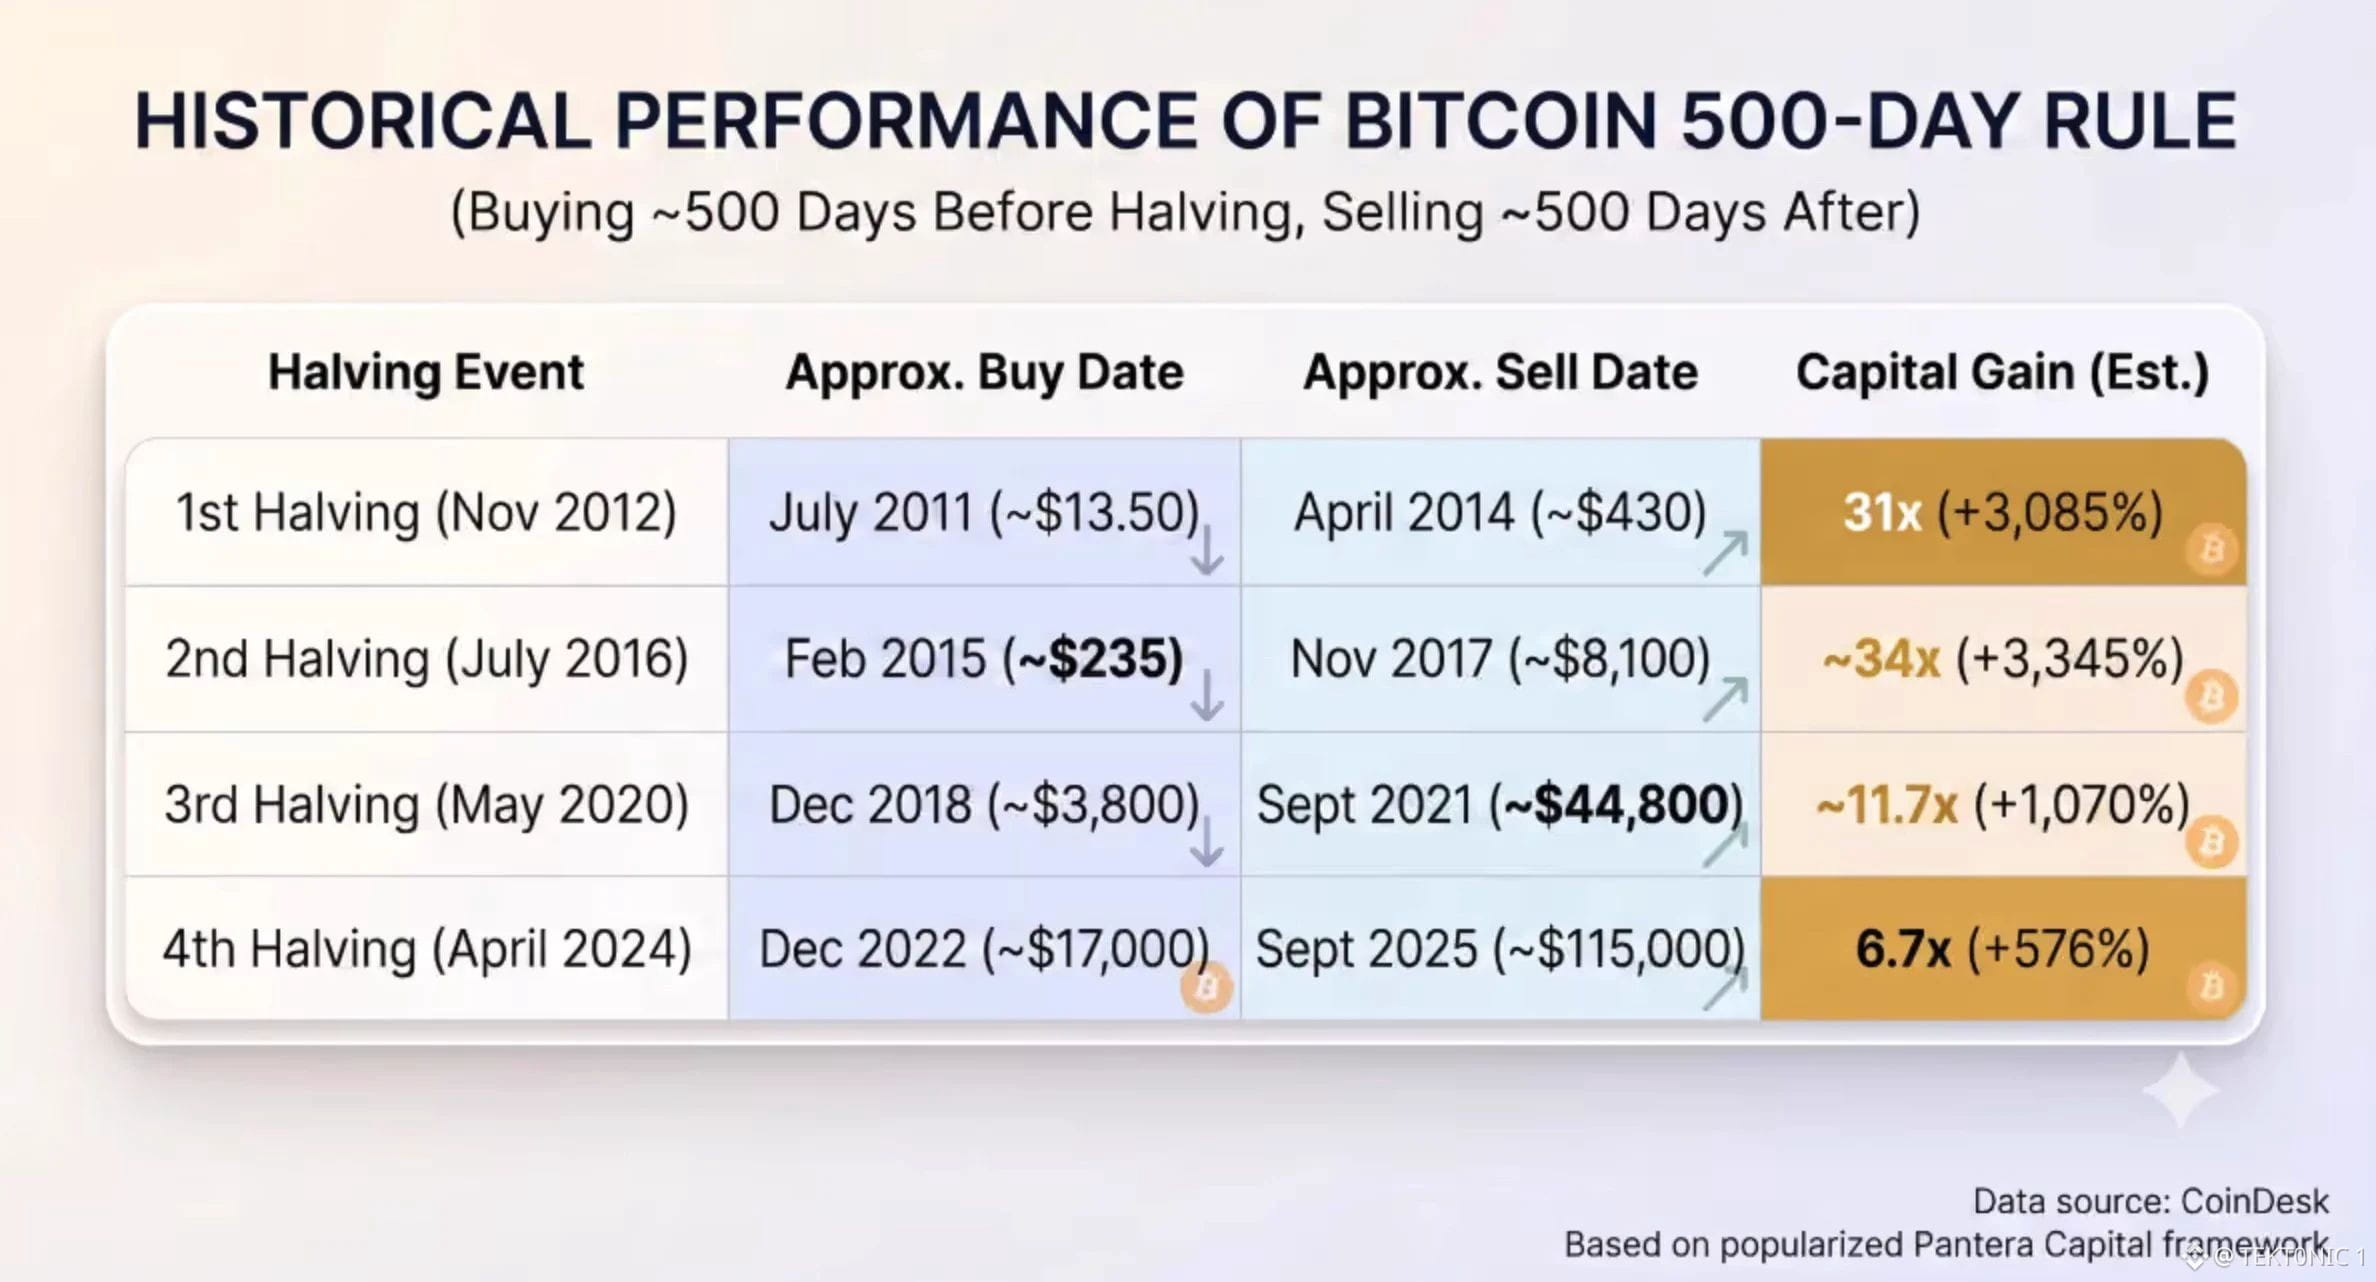
A FEW YEARS AGO, PANTERA CAPITAL PUBLISHED A SIMPLE RULE FOR BITCOIN: BUY ROUGHLY 500 DAYS BEFORE THE HALVING AND SELL 500 DAYS AFTER. ₿ Interestingly, this approach has produced positive returns across all four completed #Bitcoin halving cycles. The historical performance is worth examining: > 2012 cycle: $13.50 → $430 (31x return) > 2016 cycle: $235 → $8,100 (34x return) > 2020 cycle: $3,800 → $44,800 (11.7x return) > 2024 cycle: $17,000 → $115,000 (6.7x return) The pattern is based on Bitcoin's halving, an event that cuts the block reward miners receive in half, reducing the rate at which new $BTC enters circulation. Historically, the market has experienced significant appreciation around these cycles, although the returns have become smaller as Bitcoin's market has matured. The next 500-day buying window is estimated to begin around November 29, 2026, ahead of the projected 2028 halving. However, this strategy has only four completed cycles behind it. Historical returns don't guarantee another repeat, and even the previous cycles experienced periods of significant drawdowns. With the next window approaching, could Bitcoin's halving cycle deliver another strong run, or will this time be different? #BTC Price Analysis# #Bitcoin Price Prediction: What is Bitcoins next move?# $BTC $XRP
A FEW YEARS AGO, PANTERA CAPITAL PUBLISHED A SIMPLE RULE FOR BITCOIN: BUY ROUGHLY 500 DAYS BEFORE THE HALVING AND SELL 500 DAYS AFTER. ₿ Interestingly, this approach has produced positive returns across all four completed #Bitcoin halving cycles. The historical performance is worth examining: > 2012 cycle: $13.50 → $430 (31x return) > 2016 cycle: $235 → $8,100 (34x return) > 2020 cycle: $3,800 → $44,800 (11.7x return) > 2024 cycle: $17,000 → $115,000 (6.7x return) The pattern is based on Bitcoin's halving, an event that cuts the block reward miners receive in half, reducing the rate at which new $BTC enters circulation. Historically, the market has experienced significant appreciation around these cycles, although the returns have become smaller as Bitcoin's market has matured. The next 500-day buying window is estimated to begin around November 29, 2026, ahead of the projected 2028 halving. However, this strategy has only four completed cycles behind it. Historical returns don't guarantee another repeat, and even the previous cycles experienced periods of significant drawdowns. With the next window approaching, could Bitcoin's halving cycle deliver another strong run, or will this time be different? #BTC Price Analysis# #Bitcoin Price Prediction: What is Bitcoins next move?# $BTC $XRP
·
--
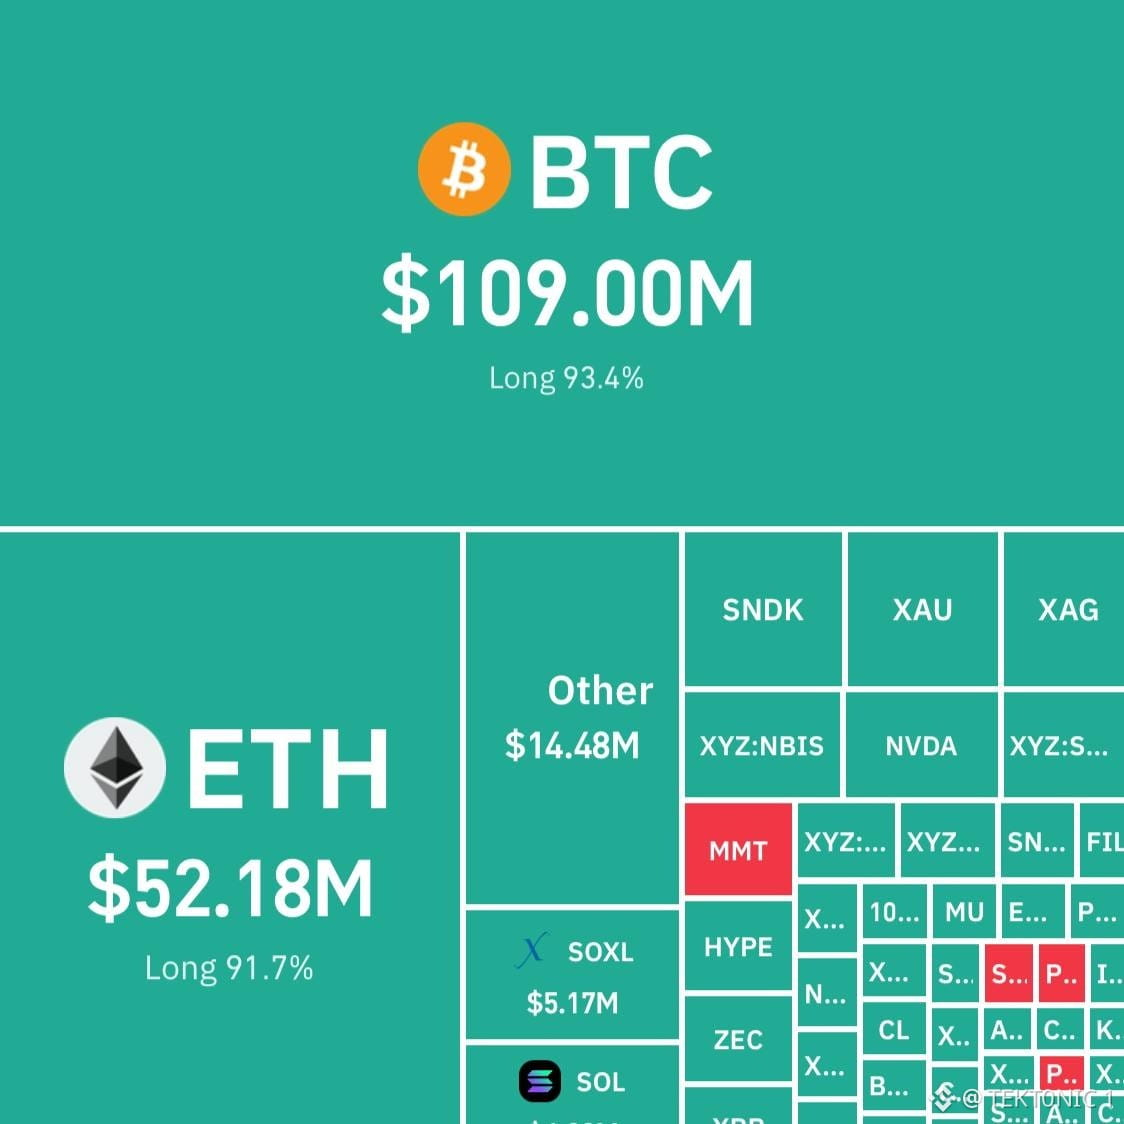
За лише 4 години ліквідовано криптовалютних позицій на суму 237,84 млн доларів, причому найбільша частка припала на біткоїн та ефіріум. 🚨 Згідно з даними про ліквідації, лідирував біткоїн — приблизно 109 млн доларів, а за ним ішов ефіріум — 52,18 млн доларів. Тиск був зосереджений переважно на довгих позиціях із кредитним плечем. На довгі позиції припало 93,4% ліквідацій $BTC та 91,7% ліквідацій $ETH, тобто більшість примусово закритих позицій належала трейдерам, які ставили на зростання цін. Це відбувається, коли трейдери використовують кредитне плече, щоб контролювати позиції, розмір яких перевищує їхній доступний капітал. Коли ціни рухаються проти них і маржі вже недостатньо для підтримки угоди, біржі автоматично закривають їхні позиції. Сукупний обсяг ліквідацій $BTC та $ETH сягнув приблизно 161,18 млн доларів — майже 68% від загального обсягу за чотири години, про який повідомлялося. Це показує, як швидко падіння цін може вплинути на трейдерів, які використовують кредитне плече. Коли надто багато позицій зосереджено в одному напрямку, падіння цін може спричинити примусовий продаж і посилити тиск на ринок. Високі показники ліквідацій не обов’язково означають, що ринок досяг дна. Вони показують, який обсяг позицій із кредитним плечем було ліквідовано за цей період, але не вказують, куди ціни рухатимуться далі. #Аналіз ціни BTC# #Прогноз ціни біткоїна: який буде наступний рух біткоїна?# #Сезон альткоїнів#
За лише 4 години ліквідовано криптовалютних позицій на суму 237,84 млн доларів, причому найбільша частка припала на біткоїн та ефіріум. 🚨 Згідно з даними про ліквідації, лідирував біткоїн — приблизно 109 млн доларів, а за ним ішов ефіріум — 52,18 млн доларів. Тиск був зосереджений переважно на довгих позиціях із кредитним плечем. На довгі позиції припало 93,4% ліквідацій $BTC та 91,7% ліквідацій $ETH, тобто більшість примусово закритих позицій належала трейдерам, які ставили на зростання цін. Це відбувається, коли трейдери використовують кредитне плече, щоб контролювати позиції, розмір яких перевищує їхній доступний капітал. Коли ціни рухаються проти них і маржі вже недостатньо для підтримки угоди, біржі автоматично закривають їхні позиції. Сукупний обсяг ліквідацій $BTC та $ETH сягнув приблизно 161,18 млн доларів — майже 68% від загального обсягу за чотири години, про який повідомлялося. Це показує, як швидко падіння цін може вплинути на трейдерів, які використовують кредитне плече. Коли надто багато позицій зосереджено в одному напрямку, падіння цін може спричинити примусовий продаж і посилити тиск на ринок. Високі показники ліквідацій не обов’язково означають, що ринок досяг дна. Вони показують, який обсяг позицій із кредитним плечем було ліквідовано за цей період, але не вказують, куди ціни рухатимуться далі. #Аналіз ціни BTC# #Прогноз ціни біткоїна: який буде наступний рух біткоїна?# #Сезон альткоїнів#
·
--
Переглянути переклад
binance has secured a court order in abu dhabi to recover crypto frozen after the $6.3 billion hack last month. 👀 according to Reuters, the order was obtained through Abu Dhabi Global Markets (ADGM), where #Binance is regulated, as the exchange continues efforts to recover the stolen assets. the scale of the recovery effort is significant. Binance previously reported that approximately $2.85 billion worth of stolen crypto had been frozen or intercepted by third parties following the attack. freezing crypto and recovering it are two different steps. freezing restricts the movement of assets, while legal orders can help establish the authority needed to return those funds to the rightful party. Binance's deputy general counsel, Dugan Bliss, said the exchange would continue using legal tools to trace, freeze and recover stolen assets, while working with partners to return them where possible. there is also an important distinction: securing the court order does not mean the frozen $2.85 billion has already been returned to Binance. the legal recovery process is still underway. Binance has separately said it has covered 95% of the stolen amount, meaning this recovery effort is about reclaiming assets that were frozen or intercepted, not simply determining whether customers will be reimbursed. the case highlights how crypto recovery increasingly depends on cooperation between exchanges, asset issuers, investigators and courts across jurisdictions. source: Reuters #BTC Price Analysis# #Bitcoin Price Prediction: What is Bitcoins next move?# #Macro Insights# $BTC $XRP
binance has secured a court order in abu dhabi to recover crypto frozen after the $6.3 billion hack last month. 👀 according to Reuters, the order was obtained through Abu Dhabi Global Markets (ADGM), where #Binance is regulated, as the exchange continues efforts to recover the stolen assets. the scale of the recovery effort is significant. Binance previously reported that approximately $2.85 billion worth of stolen crypto had been frozen or intercepted by third parties following the attack. freezing crypto and recovering it are two different steps. freezing restricts the movement of assets, while legal orders can help establish the authority needed to return those funds to the rightful party. Binance's deputy general counsel, Dugan Bliss, said the exchange would continue using legal tools to trace, freeze and recover stolen assets, while working with partners to return them where possible. there is also an important distinction: securing the court order does not mean the frozen $2.85 billion has already been returned to Binance. the legal recovery process is still underway. Binance has separately said it has covered 95% of the stolen amount, meaning this recovery effort is about reclaiming assets that were frozen or intercepted, not simply determining whether customers will be reimbursed. the case highlights how crypto recovery increasingly depends on cooperation between exchanges, asset issuers, investigators and courts across jurisdictions. source: Reuters #BTC Price Analysis# #Bitcoin Price Prediction: What is Bitcoins next move?# #Macro Insights# $BTC $XRP

·
--
Переглянути переклад
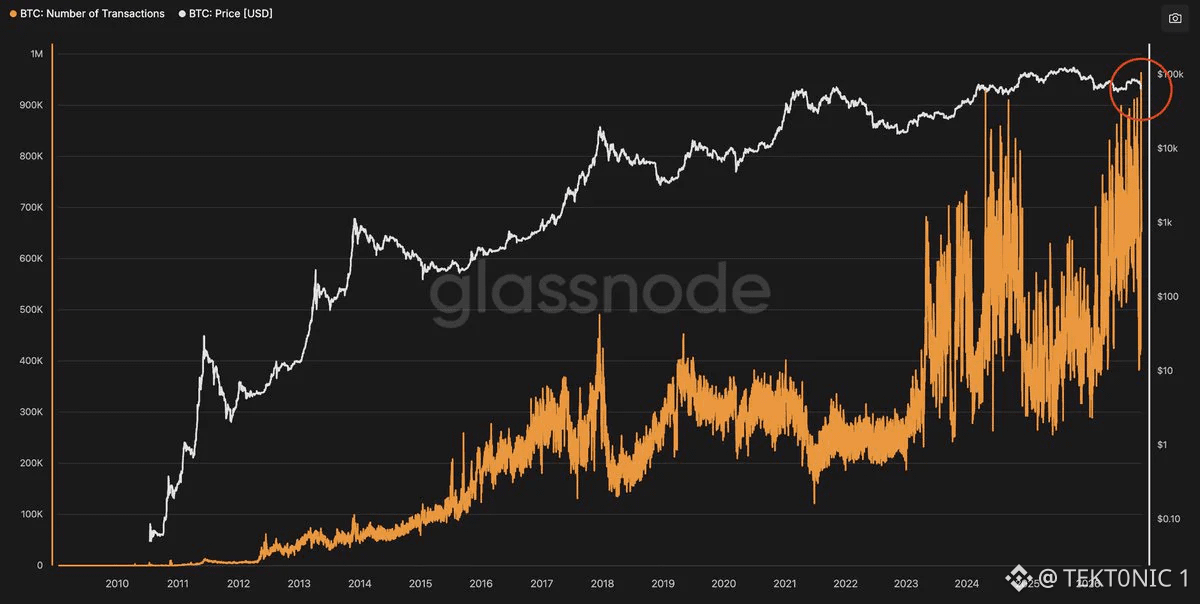
bitcoin just recorded its highest daily transaction count in history, with more than 963,000 transactions confirmed in a single day. 👀 on november 15, 2026, the network processed approximately 963,618 transactions, breaking the previous record set in april 2024. the increase is significant. daily transactions had climbed from roughly 435,000 on november 8 to the new record just seven days later, showing how quickly activity accelerated. however, a record transaction count does not automatically mean more people are using bitcoin or that demand for $BTC is increasing. on the same day, active addresses reportedly fell to 563,721, down 10.4% from the previous day. adjusted on-chain transfer volume was around $12.28 billion, placing it near the 33rd percentile of its 90-day range. this suggests the transaction surge was not matched by a similar increase in the number of participating addresses or the value being transferred. batch payments, wallet reorganizations, UTXO consolidation and inscription-related activity can all increase transaction counts without representing an equivalent rise in new users or economic demand. the distinction matters because transaction count measures how many transactions the network confirms, not how many people are making payments or how much bitcoin is changing hands. $BTC has reached a new record for on-chain transaction activity, but the data needs to be viewed alongside active addresses and transfer volume before treating it as evidence of broader adoption. source: Glassnode, additional activity metrics reported by Alphractal. #BTC Price Analysis# #Bitcoin Price Prediction: What is Bitcoins next move?# #Macro Insights# $ETH
bitcoin just recorded its highest daily transaction count in history, with more than 963,000 transactions confirmed in a single day. 👀 on november 15, 2026, the network processed approximately 963,618 transactions, breaking the previous record set in april 2024. the increase is significant. daily transactions had climbed from roughly 435,000 on november 8 to the new record just seven days later, showing how quickly activity accelerated. however, a record transaction count does not automatically mean more people are using bitcoin or that demand for $BTC is increasing. on the same day, active addresses reportedly fell to 563,721, down 10.4% from the previous day. adjusted on-chain transfer volume was around $12.28 billion, placing it near the 33rd percentile of its 90-day range. this suggests the transaction surge was not matched by a similar increase in the number of participating addresses or the value being transferred. batch payments, wallet reorganizations, UTXO consolidation and inscription-related activity can all increase transaction counts without representing an equivalent rise in new users or economic demand. the distinction matters because transaction count measures how many transactions the network confirms, not how many people are making payments or how much bitcoin is changing hands. $BTC has reached a new record for on-chain transaction activity, but the data needs to be viewed alongside active addresses and transfer volume before treating it as evidence of broader adoption. source: Glassnode, additional activity metrics reported by Alphractal. #BTC Price Analysis# #Bitcoin Price Prediction: What is Bitcoins next move?# #Macro Insights# $ETH
·
--
Переглянути переклад
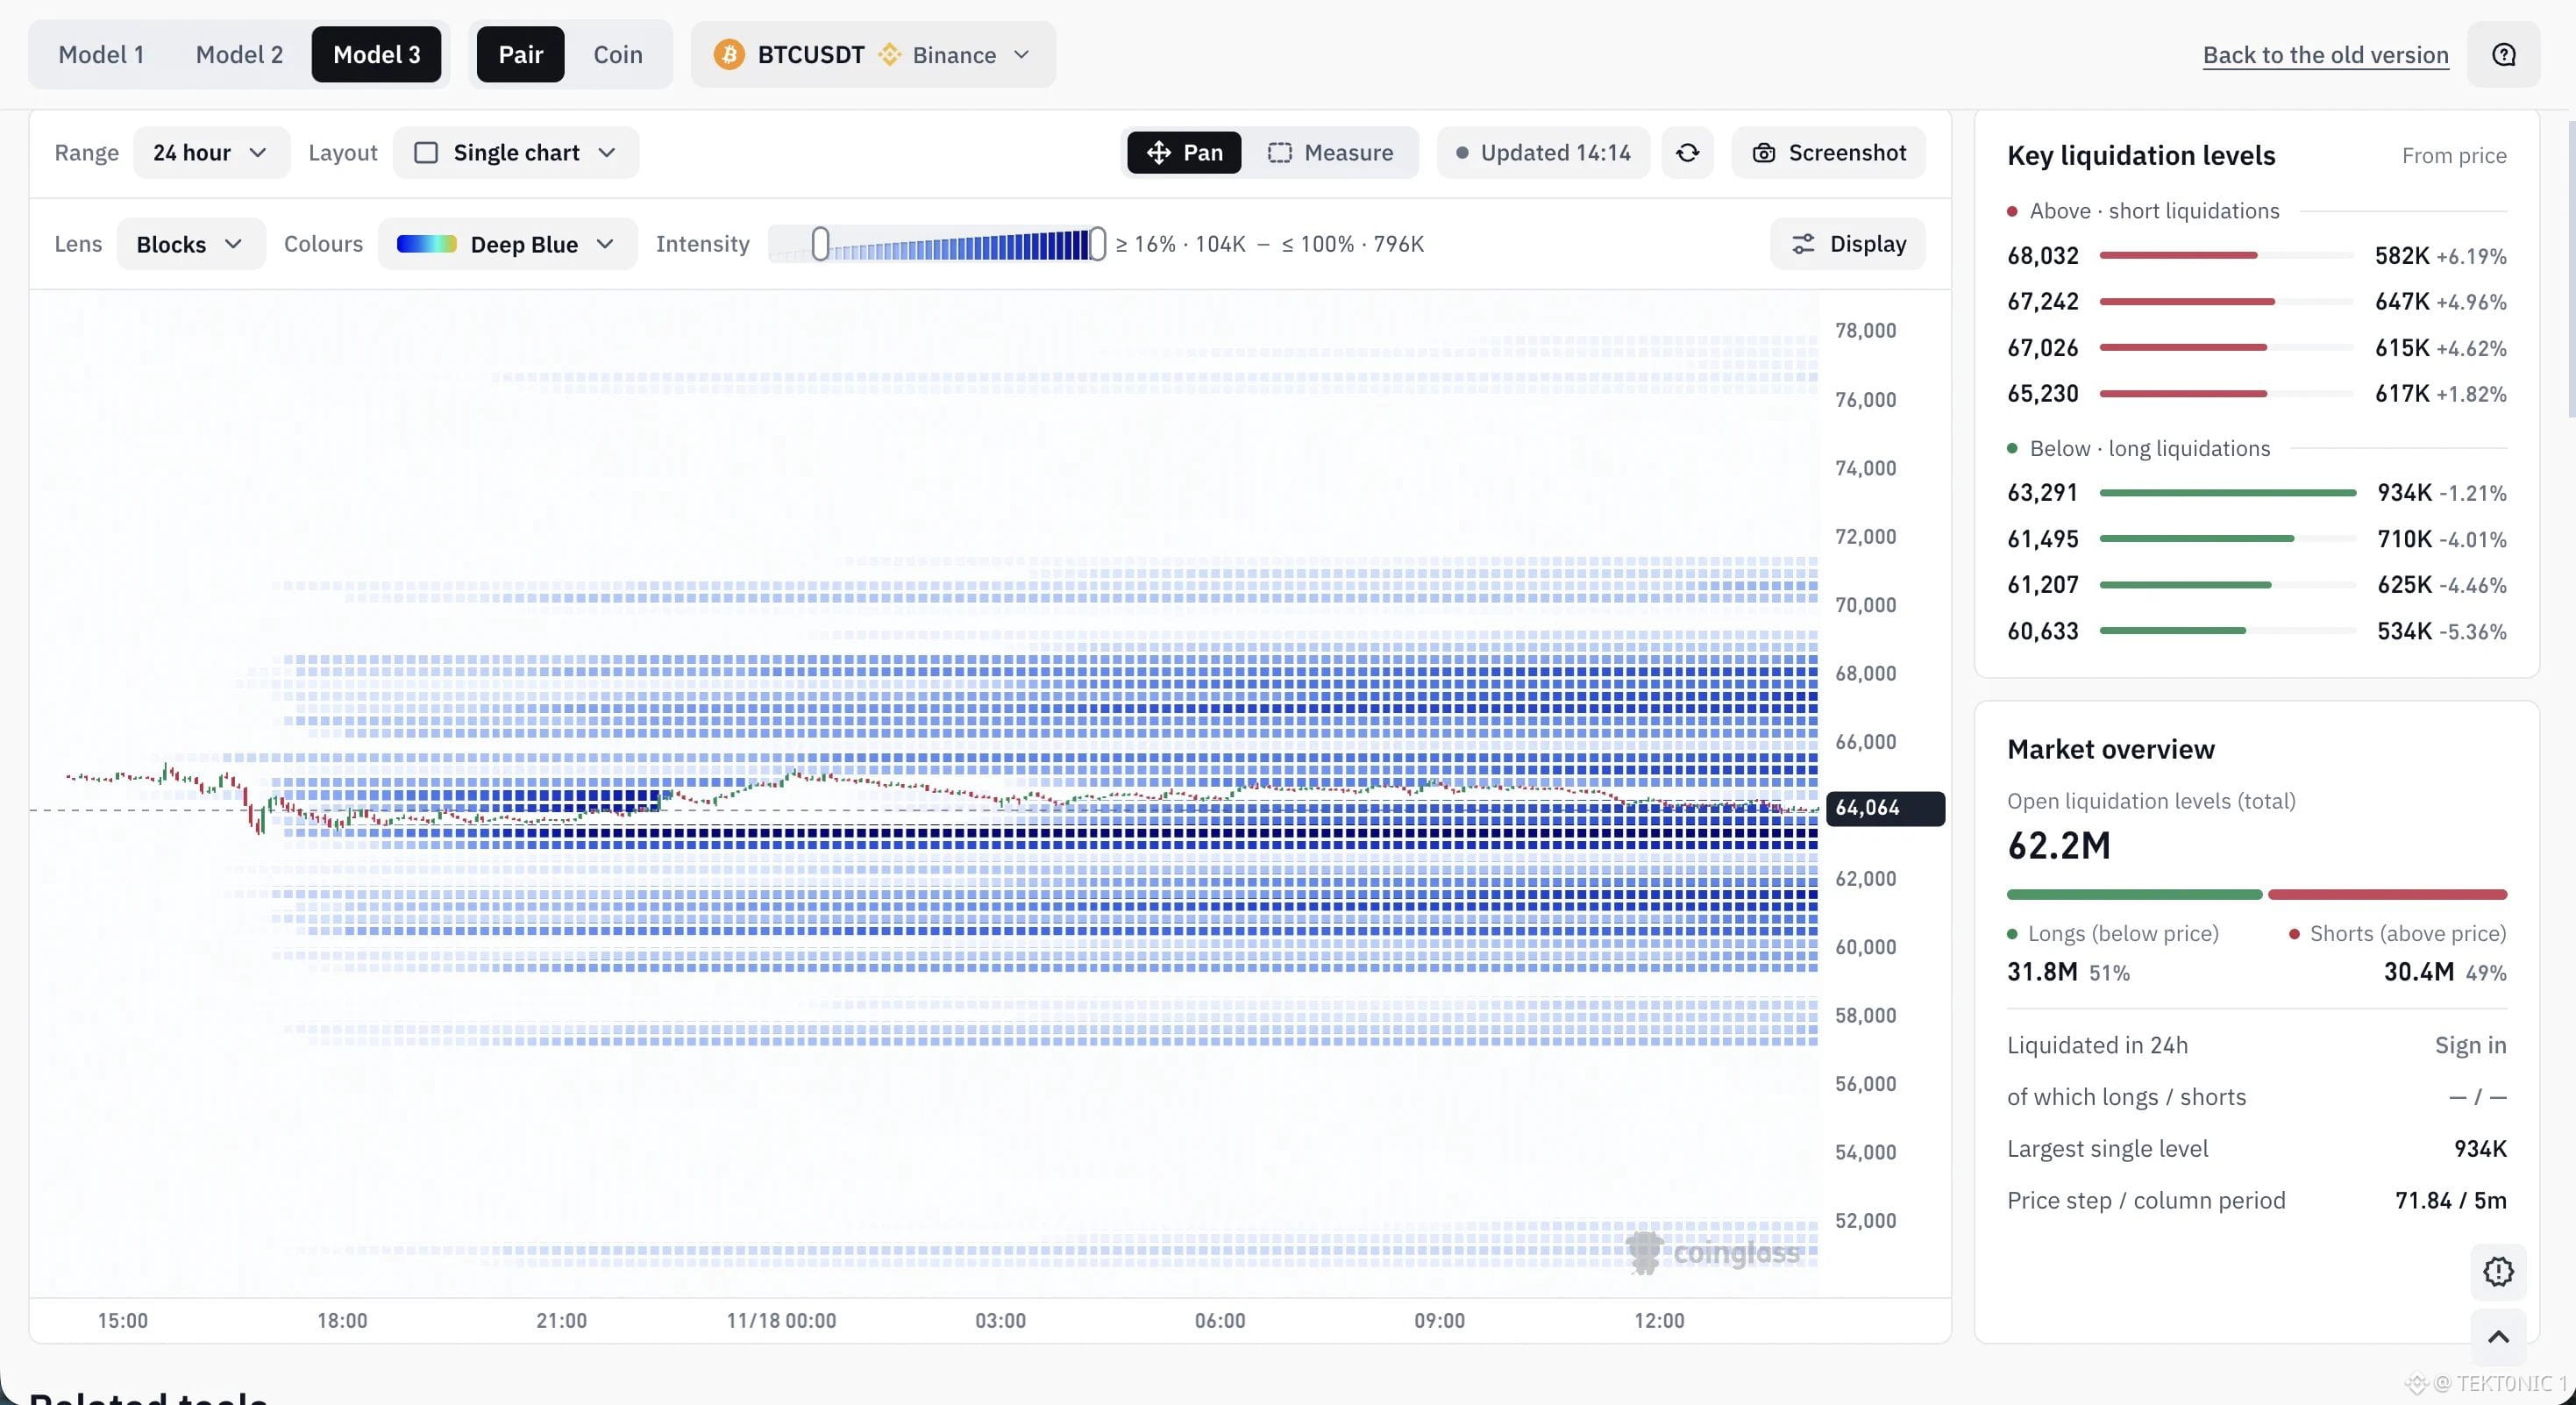
coinglass has launched its new liquidation heatmap, giving traders a clearer view of where leveraged positions could face forced closures. 👀 the tool maps estimated liquidation levels across different price ranges, using colour intensity to show where liquidation liquidity is concentrated. darker areas indicate larger estimated concentrations. in the $BTC USDT 24-hour view shown here, bitcoin is trading around $64,064. the largest visible liquidation cluster below price sits at $63,291, with approximately $934k in estimated long liquidations. above the current price, notable short liquidation levels appear around $65,230, $67,026 and $68,032. these zones show where rising prices could put leveraged short positions under pressure. the heatmap also separates potential long liquidations below the market from short liquidations above it. this helps traders identify areas where a price move could trigger forced position closures and potentially increase volatility. one important distinction: these levels are estimates, not guaranteed liquidation events or exact predictions of where price will move. actual liquidations depend on exchange positions, leverage, margin and changing market conditions. the value is in seeing where leveraged exposure is concentrated, rather than treating every highlighted zone as a price target. source: coinglass liquidation heatmap #BTC Price Analysis# #Bitcoin Price Prediction: What is Bitcoins next move?# $BTC $SOL
coinglass has launched its new liquidation heatmap, giving traders a clearer view of where leveraged positions could face forced closures. 👀 the tool maps estimated liquidation levels across different price ranges, using colour intensity to show where liquidation liquidity is concentrated. darker areas indicate larger estimated concentrations. in the $BTC USDT 24-hour view shown here, bitcoin is trading around $64,064. the largest visible liquidation cluster below price sits at $63,291, with approximately $934k in estimated long liquidations. above the current price, notable short liquidation levels appear around $65,230, $67,026 and $68,032. these zones show where rising prices could put leveraged short positions under pressure. the heatmap also separates potential long liquidations below the market from short liquidations above it. this helps traders identify areas where a price move could trigger forced position closures and potentially increase volatility. one important distinction: these levels are estimates, not guaranteed liquidation events or exact predictions of where price will move. actual liquidations depend on exchange positions, leverage, margin and changing market conditions. the value is in seeing where leveraged exposure is concentrated, rather than treating every highlighted zone as a price target. source: coinglass liquidation heatmap #BTC Price Analysis# #Bitcoin Price Prediction: What is Bitcoins next move?# $BTC $SOL
·
--
Переглянути переклад
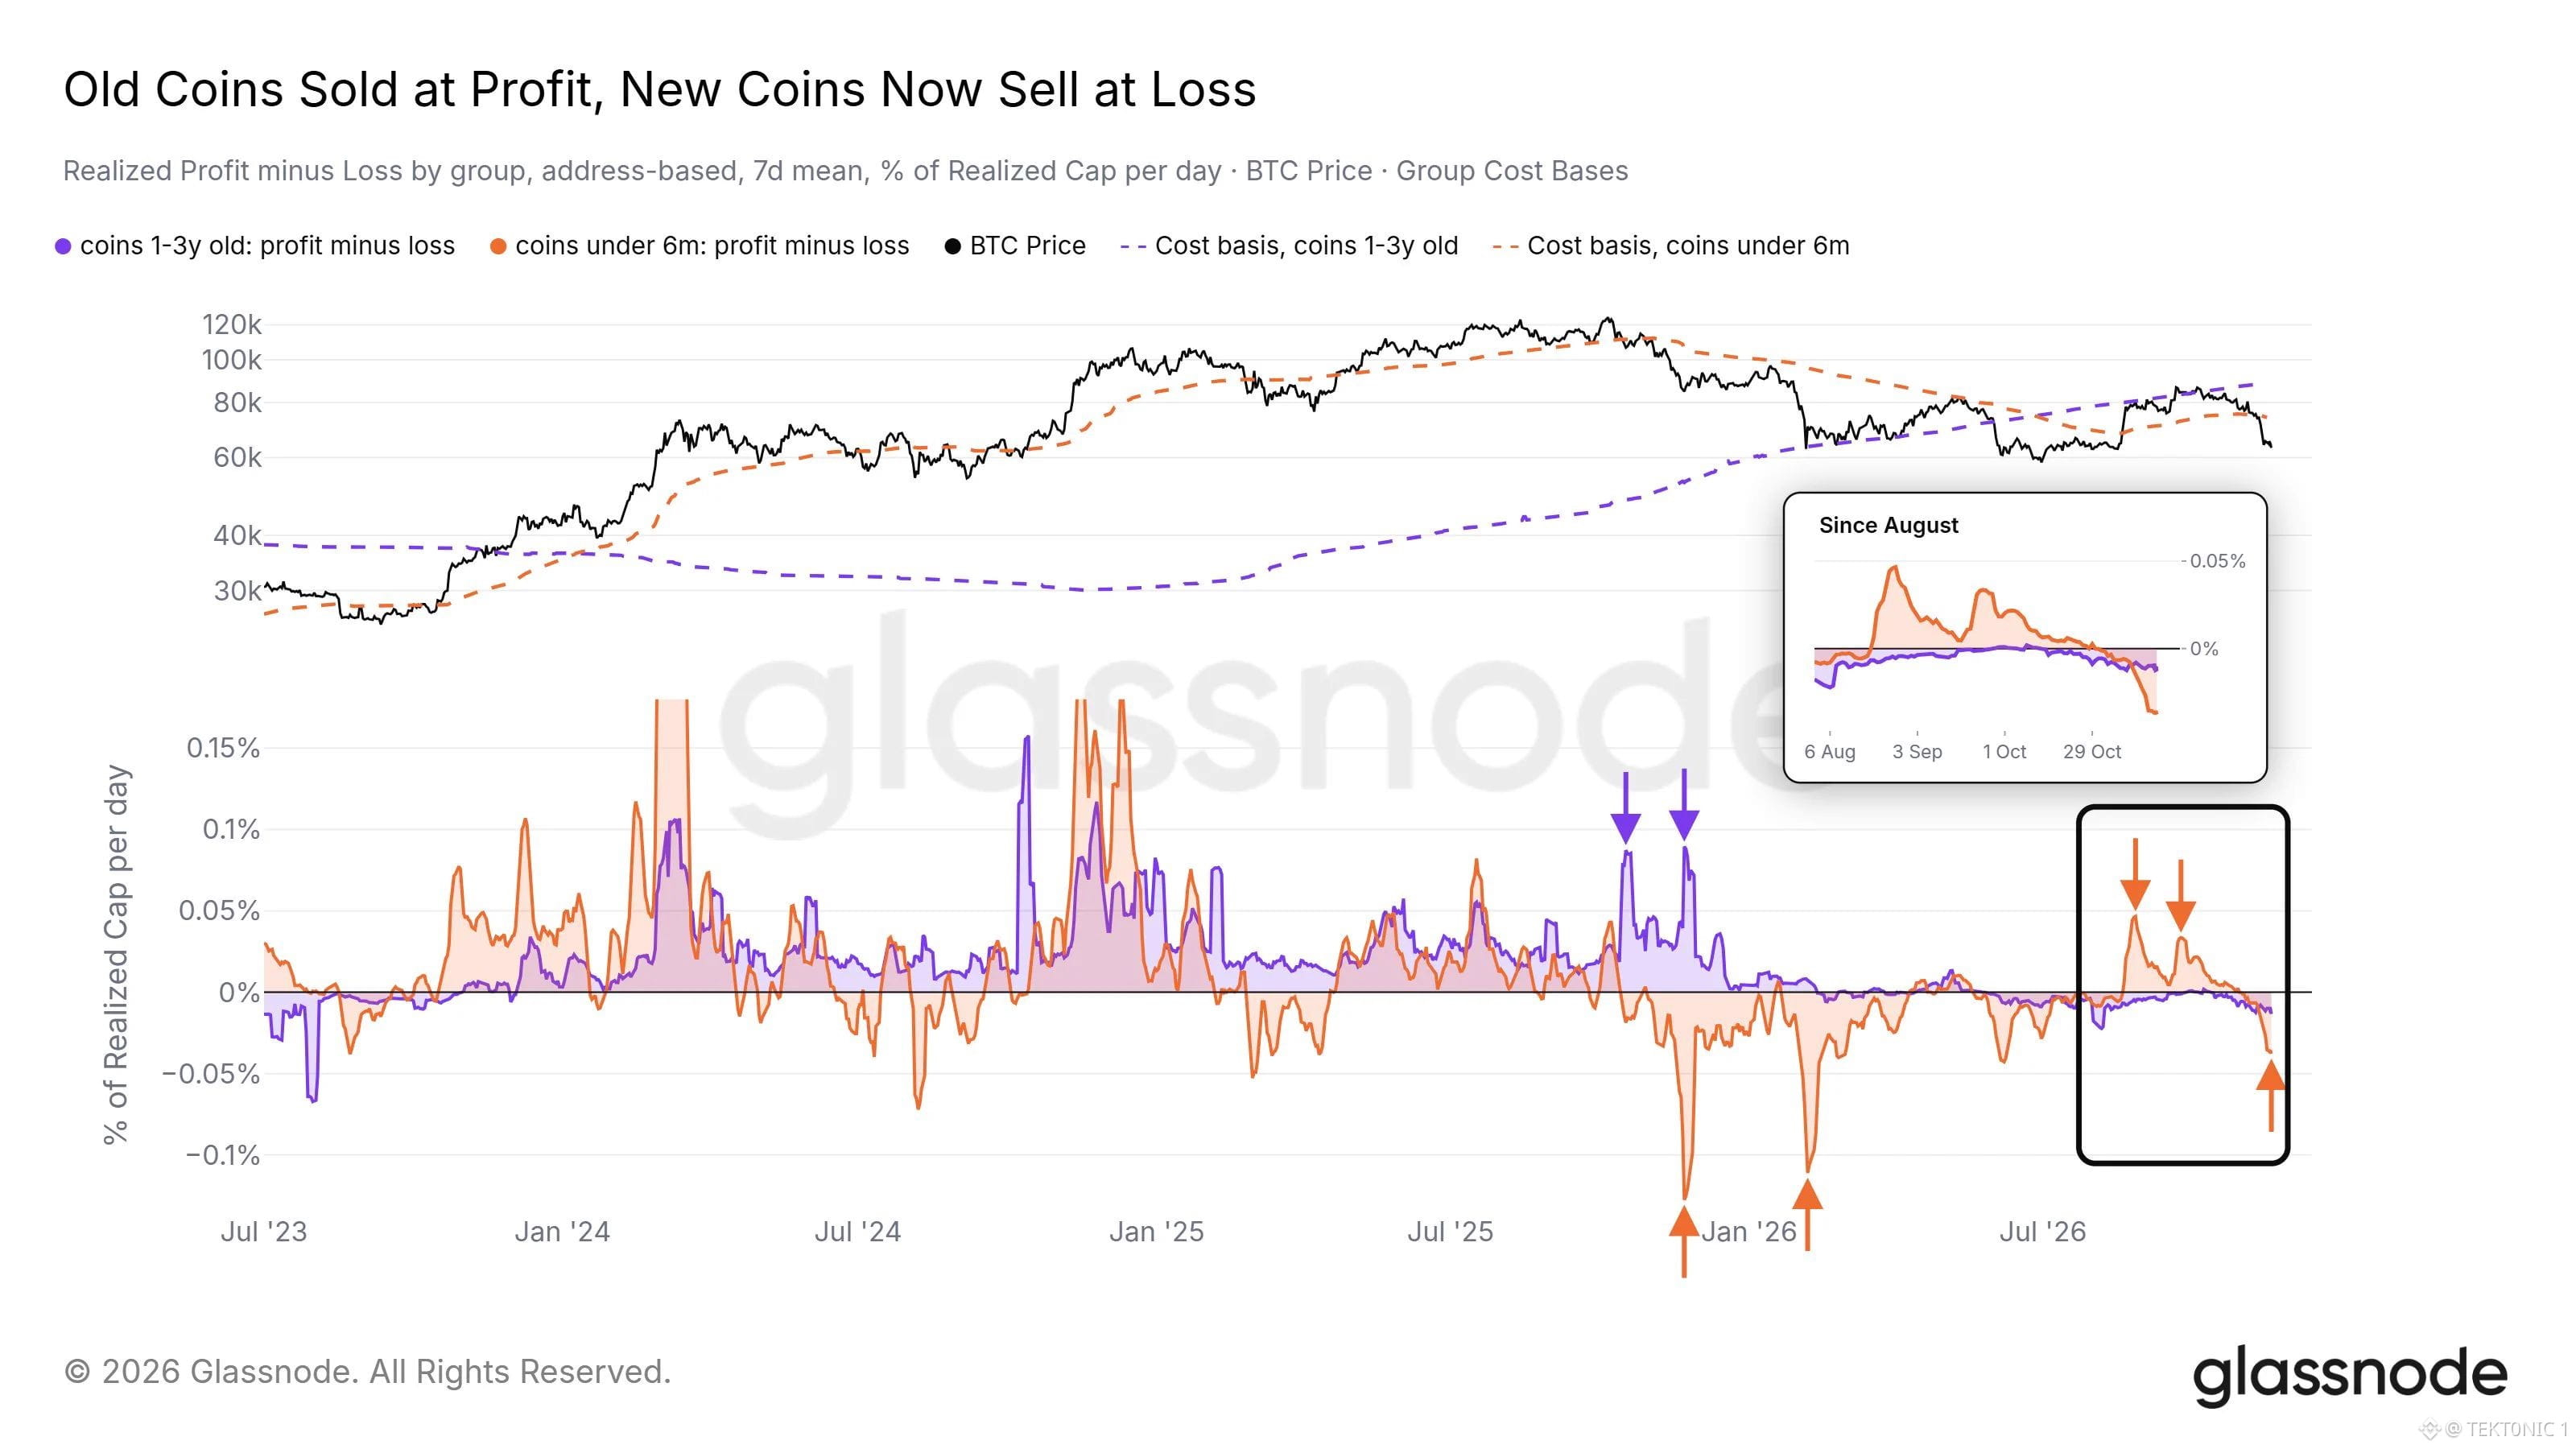
BITCOIN'S NEWEST BUYERS ARE NOW SELLING AT A LOSS AS MARKET PRESSURE BUILDS. 📉 According to Glassnode's latest on-chain data, #Bitcoin investors who acquired their coins within the last six months have shifted from profit-taking to loss-taking. The chart compares realized profit and loss across two investor groups: > Coins under 6 months: Recent buyers have returned to realizing losses after taking profits during the September–October rally. > Coins 1–3 years old: This group has seen much less recent profit-taking, with activity remaining close to neutral. The distinction matters because newer buyers are often more sensitive to price movements. When $BTC falls below their average acquisition price, some may sell to avoid further losses rather than wait for a recovery. Glassnode's report also highlights that Bitcoin is trading below the cost basis of these investor groups, leaving recent buyers underwater. If this continues, their average purchase price could become an important resistance area, as some holders may look to exit when BTC returns to break-even. Will newer Bitcoin buyers continue selling into weakness, or will they hold through the correction and wait for a recovery? #BTC Price Analysis# #Bitcoin Price Prediction: What is Bitcoins next move?# $BTC $XRP
BITCOIN'S NEWEST BUYERS ARE NOW SELLING AT A LOSS AS MARKET PRESSURE BUILDS. 📉 According to Glassnode's latest on-chain data, #Bitcoin investors who acquired their coins within the last six months have shifted from profit-taking to loss-taking. The chart compares realized profit and loss across two investor groups: > Coins under 6 months: Recent buyers have returned to realizing losses after taking profits during the September–October rally. > Coins 1–3 years old: This group has seen much less recent profit-taking, with activity remaining close to neutral. The distinction matters because newer buyers are often more sensitive to price movements. When $BTC falls below their average acquisition price, some may sell to avoid further losses rather than wait for a recovery. Glassnode's report also highlights that Bitcoin is trading below the cost basis of these investor groups, leaving recent buyers underwater. If this continues, their average purchase price could become an important resistance area, as some holders may look to exit when BTC returns to break-even. Will newer Bitcoin buyers continue selling into weakness, or will they hold through the correction and wait for a recovery? #BTC Price Analysis# #Bitcoin Price Prediction: What is Bitcoins next move?# $BTC $XRP
·
--
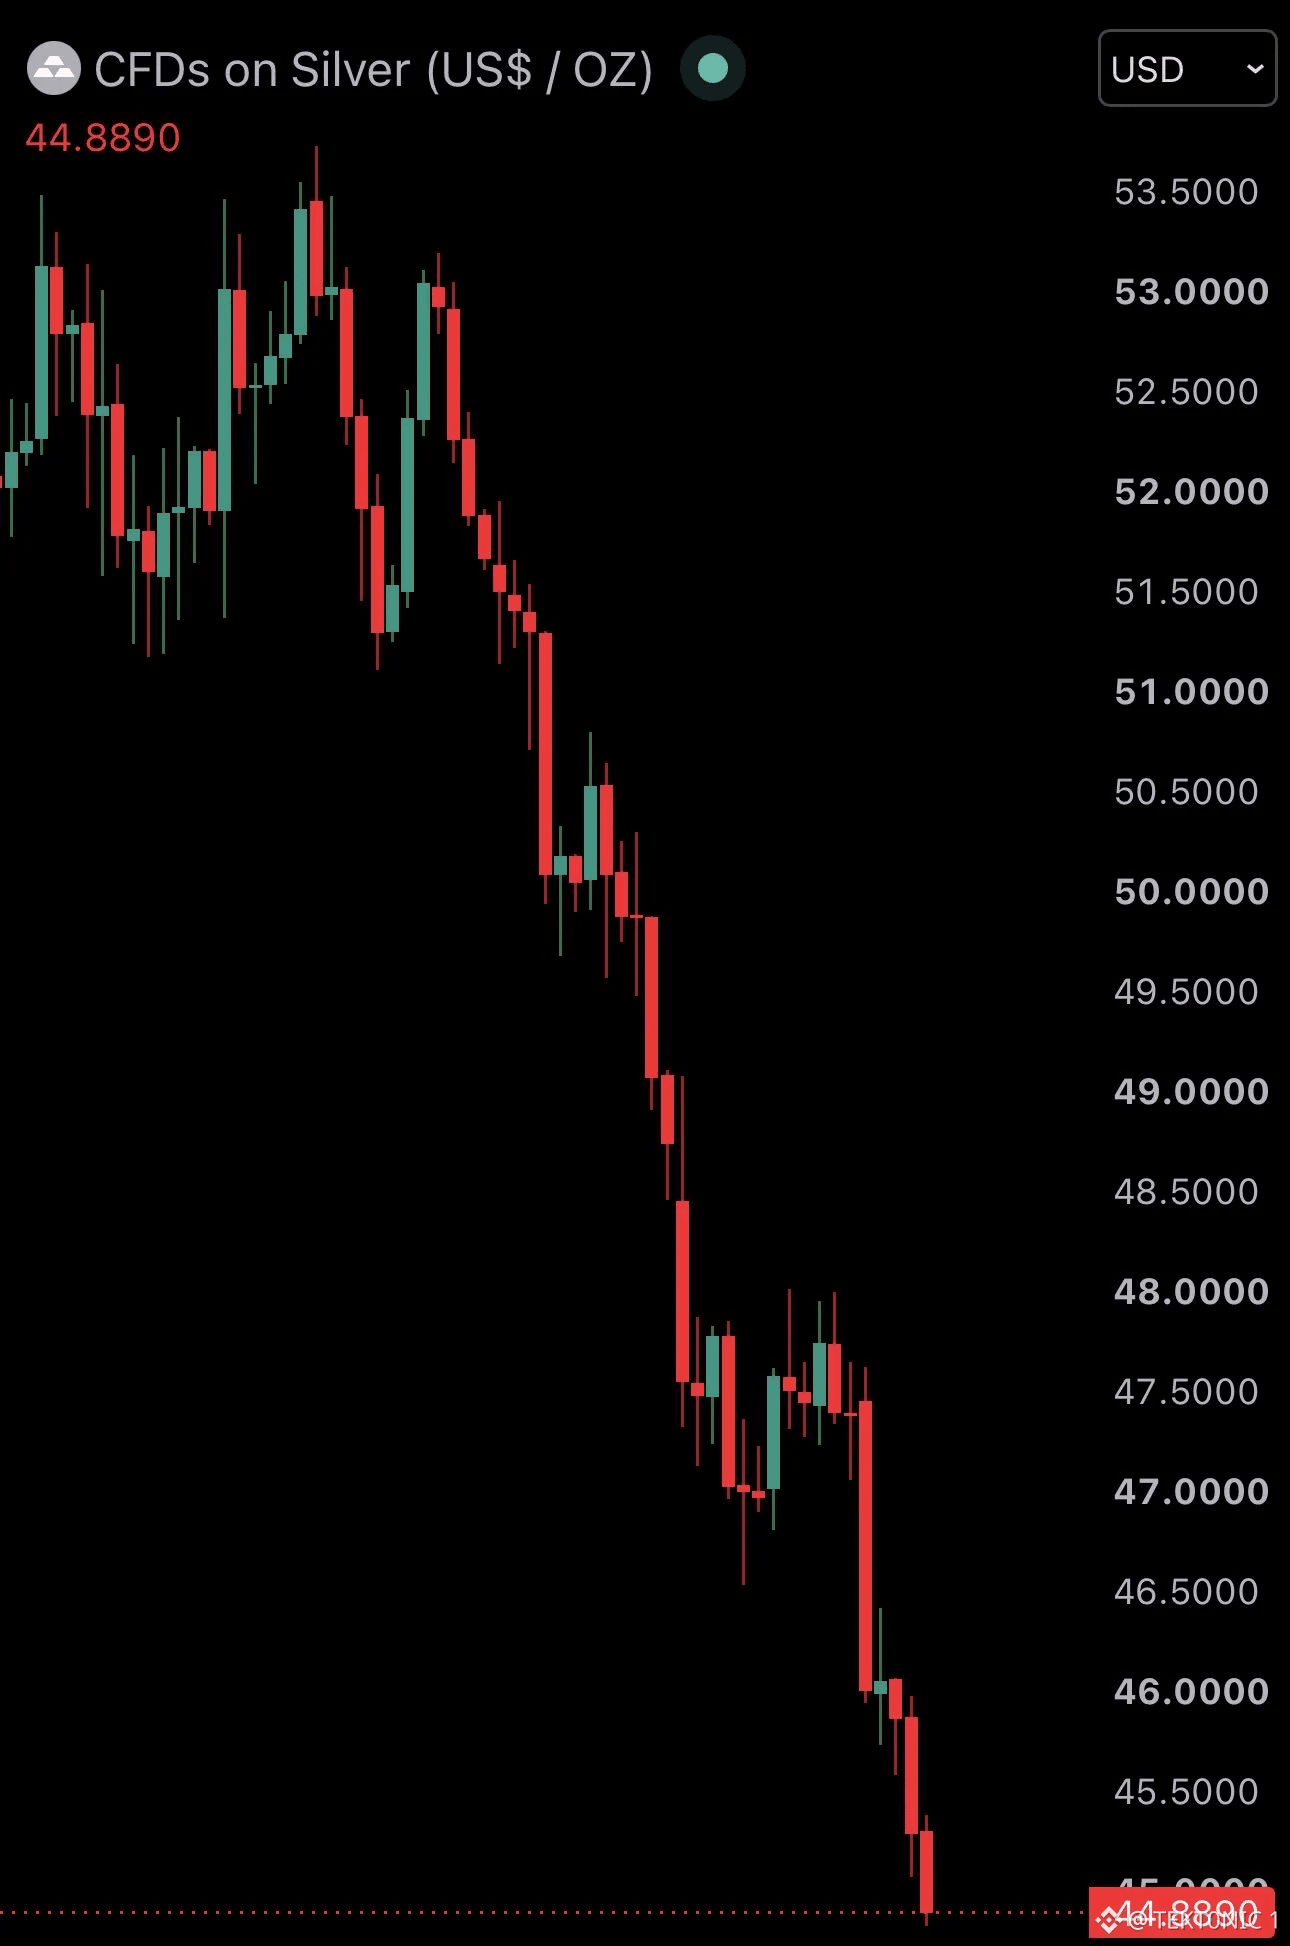
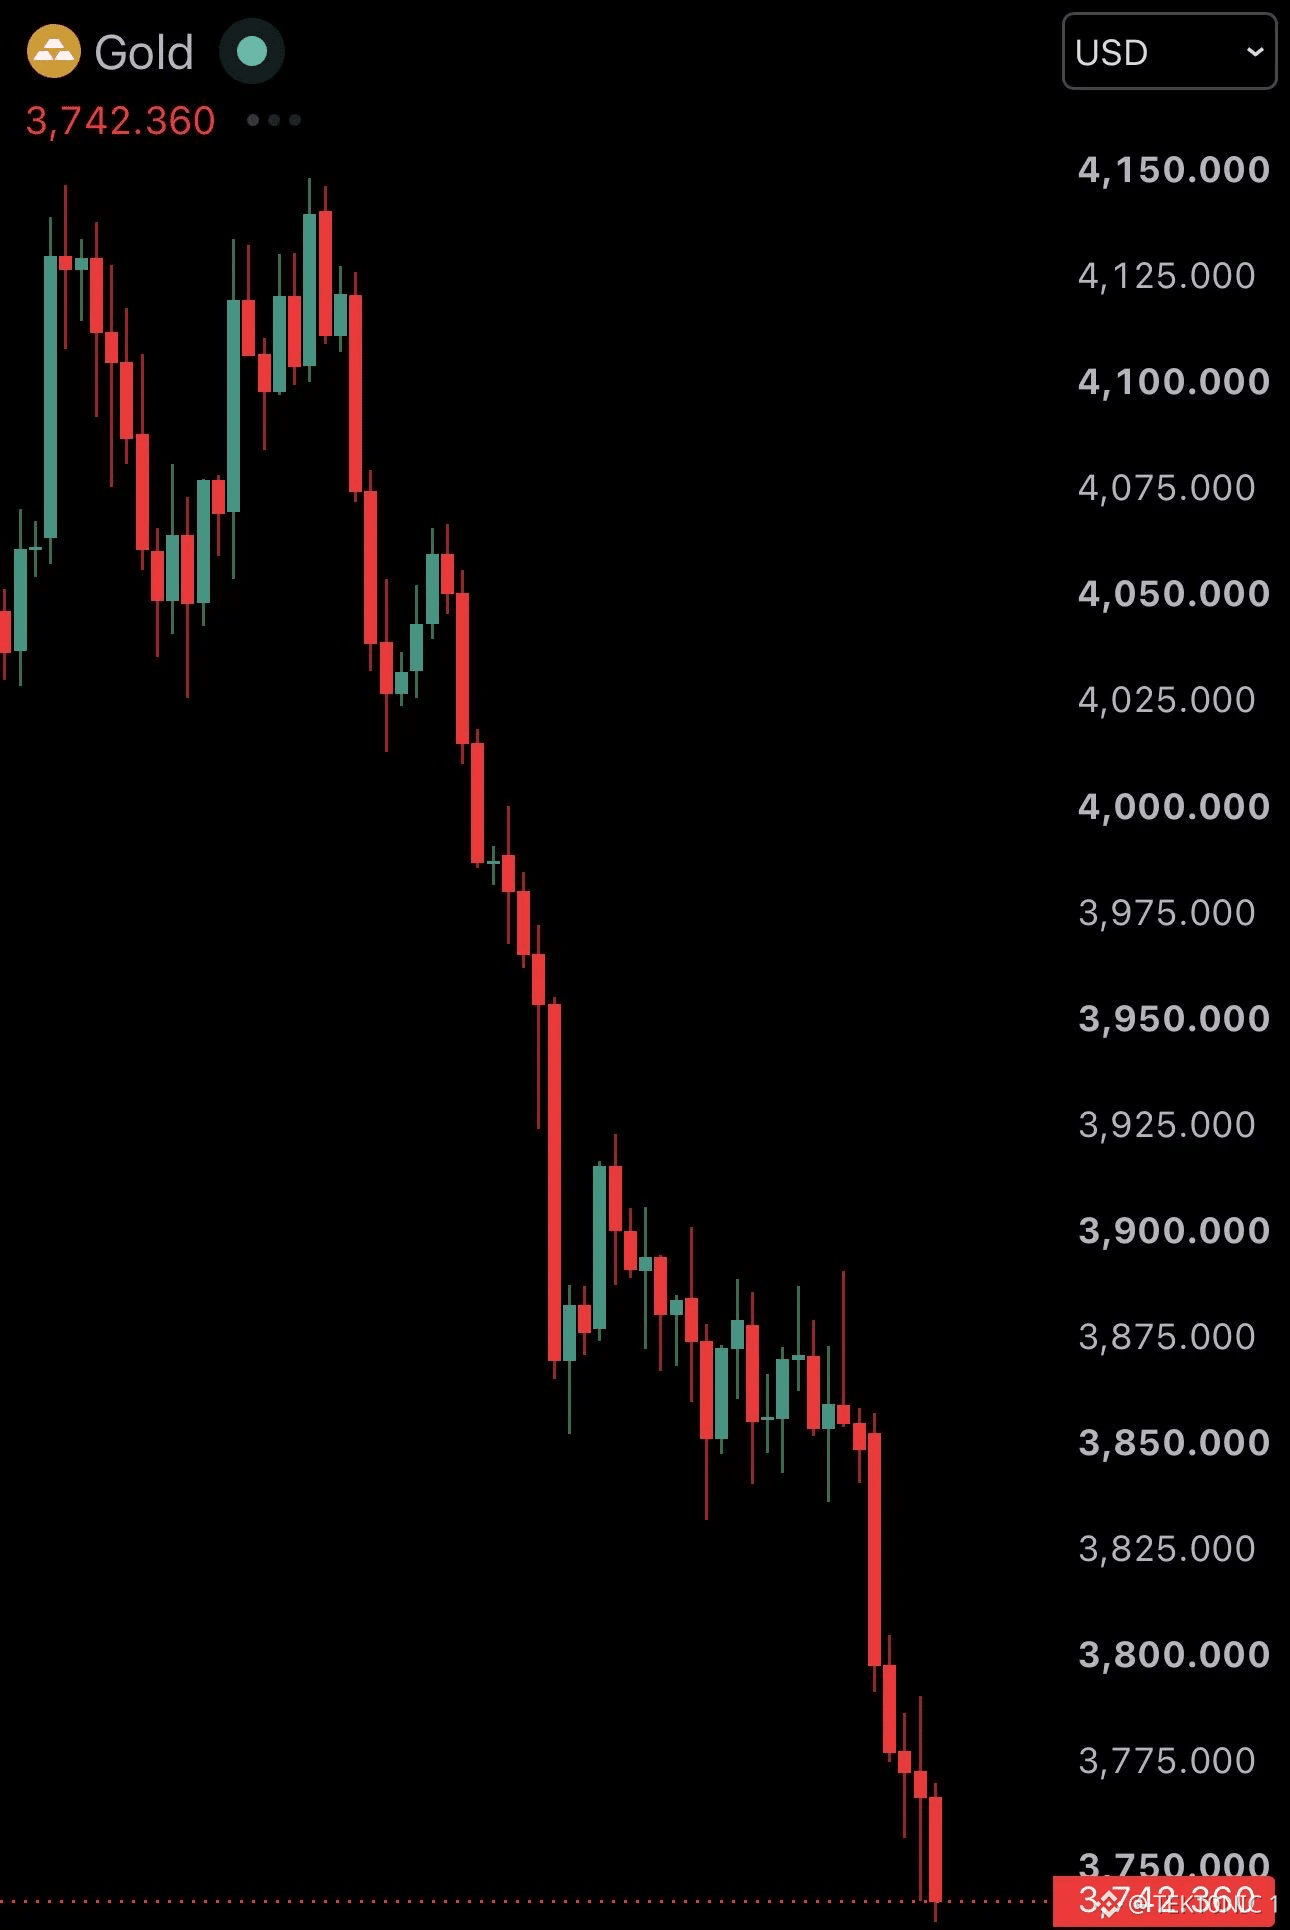
🚨 ЗОЛОТО І СРІБЛО ПІД СИЛЬНИМ ТИСКОМ ПРОДАЖІВ #Золото опустилося нижче $3,800, ненадовго торкнувшись позначки $3,742, тоді як #Срібло подешевшало до близько $45, оскільки інвестори відреагували на зростання очікувань щодо подальшого підвищення ставок Федеральною резервною системою. Повідомляється, що сукупна ринкова вартість двох металів скоротилася більш ніж на $500 мільярдів. Тиск спричинений зміцненням долара США та зростанням дохідності казначейських облігацій. Коли процентні ставки зростають, $XAUt і срібло стають менш привабливими, адже не приносять відсоткового доходу. Натомість інвестори можуть отримати вищу дохідність від активів, що приносять відсотки. Розпродаж також відбувається на тлі ослаблення біткоїна та акцій, що свідчить про скорочення інвесторами вкладень одразу на кількох ринках, а не просто перехід з одного активу в інший. Срібло зазнає додаткового тиску через перспективи промислового попиту, тоді як золото слабшає, попри свою традиційну роль захисного активу. Головне питання тепер — чи це тимчасова корекція, чи початок глибшого перегляду оцінок активів на тлі підготовки ринків до більш жорсткої політики ФРС. #ПрогнозЦіниБіткоїна: який наступний крок біткоїна?# $BTC $XAUt
🚨 ЗОЛОТО І СРІБЛО ПІД СИЛЬНИМ ТИСКОМ ПРОДАЖІВ #Золото опустилося нижче $3,800, ненадовго торкнувшись позначки $3,742, тоді як #Срібло подешевшало до близько $45, оскільки інвестори відреагували на зростання очікувань щодо подальшого підвищення ставок Федеральною резервною системою. Повідомляється, що сукупна ринкова вартість двох металів скоротилася більш ніж на $500 мільярдів. Тиск спричинений зміцненням долара США та зростанням дохідності казначейських облігацій. Коли процентні ставки зростають, $XAUt і срібло стають менш привабливими, адже не приносять відсоткового доходу. Натомість інвестори можуть отримати вищу дохідність від активів, що приносять відсотки. Розпродаж також відбувається на тлі ослаблення біткоїна та акцій, що свідчить про скорочення інвесторами вкладень одразу на кількох ринках, а не просто перехід з одного активу в інший. Срібло зазнає додаткового тиску через перспективи промислового попиту, тоді як золото слабшає, попри свою традиційну роль захисного активу. Головне питання тепер — чи це тимчасова корекція, чи початок глибшого перегляду оцінок активів на тлі підготовки ринків до більш жорсткої політики ФРС. #ПрогнозЦіниБіткоїна: який наступний крок біткоїна?# $BTC $XAUt
2
·
--
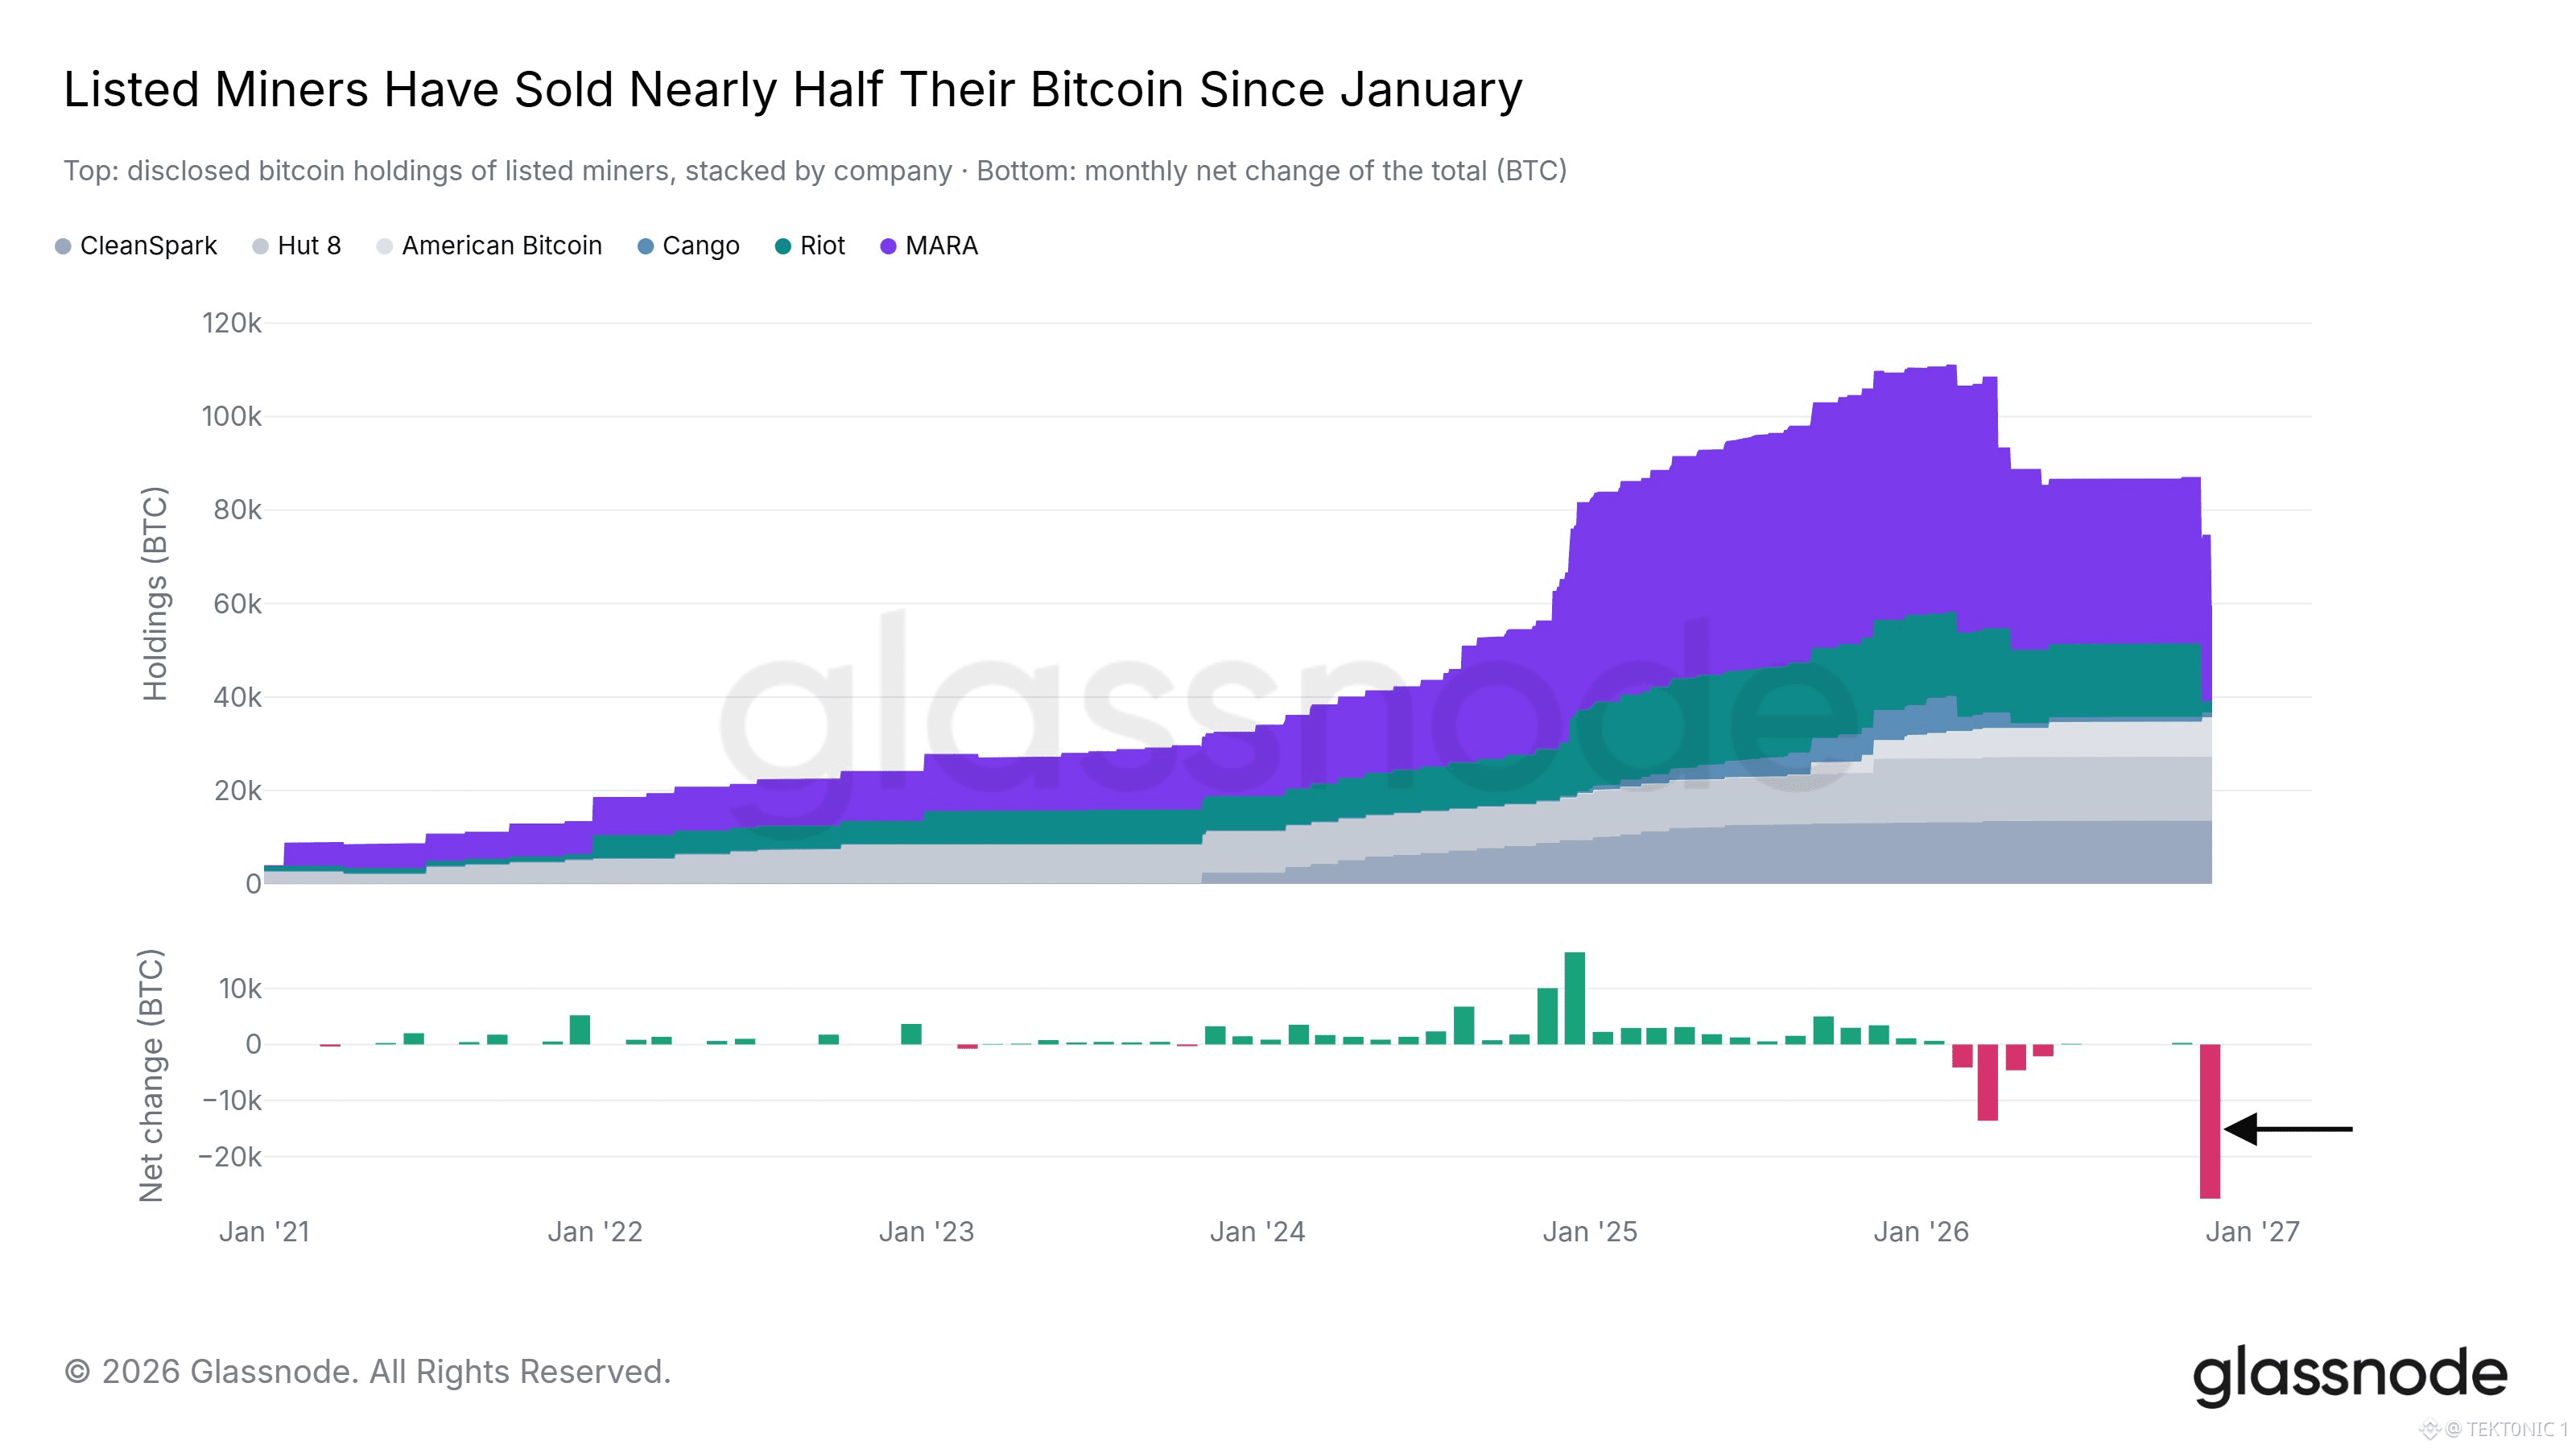
ПУБЛІЧНІ БІТКОЇН-МАЙНЕРИ ПРОДАЛИ МАЙЖЕ ПОЛОВИНУ СВОЇХ ЗАПАСІВ BTC ІЗ СІЧНЯ. 📉 За даними Glassnode за 18 листопада, публічні майнінгові компанії, за якими стежить аналітична фірма, від початку 2026 року продали майже половину своїх сукупних запасів біткоїна. Графік показує розкриті дані про резерви $BTC шести компаній: > CleanSpark > Hut 8 > American Bitcoin > Cango > Riot Platforms > MARA Holdings Роками кілька з цих компаній зберігали видобутий біткоїн, а деякі навіть збільшували свої резерви. Тепер цей підхід змінюється. Головна причина — зростання попиту на інфраструктуру для ШІ. Майнінгові компанії спрямовують капітал на центри обробки даних для ШІ та високопродуктивні обчислення (HPC), використовуючи продаж біткоїнів для фінансування цього переходу. Це свідчить про значні зміни в їхній бізнес-стратегії. Замість того щоб повністю покладатися на майнінг біткоїна та зберігати $BTC як резервний актив, деякі компанії прагнуть отримувати довгостроковий дохід від надання обчислювальної інфраструктури. Однак це не означає, що майнінг біткоїна завершується. Кілька компаній розвивають напрям ШІ, водночас продовжуючи майнінгову діяльність. Головне питання — чи стане інфраструктура для ШІ прибутковішою для цих компаній у довгостроковій перспективі, ніж зберігання та майнінг біткоїна. #Аналіз ціни BTC# #Прогноз ціни біткоїна: який наступний крок біткоїна?# #ШІ $XRP
ПУБЛІЧНІ БІТКОЇН-МАЙНЕРИ ПРОДАЛИ МАЙЖЕ ПОЛОВИНУ СВОЇХ ЗАПАСІВ BTC ІЗ СІЧНЯ. 📉 За даними Glassnode за 18 листопада, публічні майнінгові компанії, за якими стежить аналітична фірма, від початку 2026 року продали майже половину своїх сукупних запасів біткоїна. Графік показує розкриті дані про резерви $BTC шести компаній: > CleanSpark > Hut 8 > American Bitcoin > Cango > Riot Platforms > MARA Holdings Роками кілька з цих компаній зберігали видобутий біткоїн, а деякі навіть збільшували свої резерви. Тепер цей підхід змінюється. Головна причина — зростання попиту на інфраструктуру для ШІ. Майнінгові компанії спрямовують капітал на центри обробки даних для ШІ та високопродуктивні обчислення (HPC), використовуючи продаж біткоїнів для фінансування цього переходу. Це свідчить про значні зміни в їхній бізнес-стратегії. Замість того щоб повністю покладатися на майнінг біткоїна та зберігати $BTC як резервний актив, деякі компанії прагнуть отримувати довгостроковий дохід від надання обчислювальної інфраструктури. Однак це не означає, що майнінг біткоїна завершується. Кілька компаній розвивають напрям ШІ, водночас продовжуючи майнінгову діяльність. Головне питання — чи стане інфраструктура для ШІ прибутковішою для цих компаній у довгостроковій перспективі, ніж зберігання та майнінг біткоїна. #Аналіз ціни BTC# #Прогноз ціни біткоїна: який наступний крок біткоїна?# #ШІ $XRP
1
·
--
Переглянути переклад
🚨 A FED OFFICIAL IS FLOATING A 50-BASIS-POINT RATE HIKE AS BITCOIN'S CORRECTION DEEPENS. Federal Reserve Governor Christopher Waller says the Fed may need to raise interest rates more aggressively to bring inflation under control, even suggesting that policymakers may need to "shock" the economy. His comments come as $BTC has fallen roughly 22% from its recent highs, with markets increasingly concerned that the Fed could reverse course and resume tightening monetary policy. The key proposals being discussed are: > December: A possible 50-basis-point hike instead of the usual 25 basis points. > Further tightening: Waller suggested the Fed may need to reverse previous rate cuts and potentially raise rates further if inflation remains persistent. Higher interest rates generally strengthen the dollar, increase borrowing costs and reduce liquidity available for riskier assets such as Bitcoin and tech stocks. Bitcoin is already facing ETF outflows, weakening risk appetite and pressure from the broader financial markets. A more aggressive Fed could add another layer of selling pressure. However, Waller's comments represent his policy position, not a final decision by the Federal Reserve. Markets are still pricing in a smaller 25-basis-point hike for December. The biggest risk for Bitcoin right now is that inflation forces the Fed to become more hawkish just as crypto markets are struggling to find a bottom. Could this become another major obstacle for $BTC ? #BTC Price Analysis# #Bitcoin Price Prediction: What is Bitcoins next move?# #Macro Insights# $ETH
🚨 A FED OFFICIAL IS FLOATING A 50-BASIS-POINT RATE HIKE AS BITCOIN'S CORRECTION DEEPENS. Federal Reserve Governor Christopher Waller says the Fed may need to raise interest rates more aggressively to bring inflation under control, even suggesting that policymakers may need to "shock" the economy. His comments come as $BTC has fallen roughly 22% from its recent highs, with markets increasingly concerned that the Fed could reverse course and resume tightening monetary policy. The key proposals being discussed are: > December: A possible 50-basis-point hike instead of the usual 25 basis points. > Further tightening: Waller suggested the Fed may need to reverse previous rate cuts and potentially raise rates further if inflation remains persistent. Higher interest rates generally strengthen the dollar, increase borrowing costs and reduce liquidity available for riskier assets such as Bitcoin and tech stocks. Bitcoin is already facing ETF outflows, weakening risk appetite and pressure from the broader financial markets. A more aggressive Fed could add another layer of selling pressure. However, Waller's comments represent his policy position, not a final decision by the Federal Reserve. Markets are still pricing in a smaller 25-basis-point hike for December. The biggest risk for Bitcoin right now is that inflation forces the Fed to become more hawkish just as crypto markets are struggling to find a bottom. Could this become another major obstacle for $BTC ? #BTC Price Analysis# #Bitcoin Price Prediction: What is Bitcoins next move?# #Macro Insights# $ETH
·
--
Переглянути переклад
🚨 BITCOIN DROPS BELOW $63,000 AS SELLING PRESSURE INTENSIFIES. $BTC has fallen below $63K, extending its correction and bringing key support levels closer into focus. The decline is putting pressure on recent buyers, leveraged long positions and corporate Bitcoin holders, while market sentiment remains deep in Extreme Fear. Bitcoin has already recorded six consecutive weekly losses, with liquidations, ETF outflows and shifting interest-rate expectations contributing to the broader sell-off. A break below $62K could expose the $60K psychological level, followed by the June low around $58,500, where additional selling could accelerate. Meanwhile, funding rates have turned negative and traders are increasingly positioning for further downside. The immediate focus is whether $BTC can reclaim $63K and stabilise. If support continues to fail, the market could face another wave of liquidations before buyers regain control. #BTC Price Analysis# #Bitcoin Price Prediction: What is Bitcoins next move?# #BearishSetup $ETH
🚨 BITCOIN DROPS BELOW $63,000 AS SELLING PRESSURE INTENSIFIES. $BTC has fallen below $63K, extending its correction and bringing key support levels closer into focus. The decline is putting pressure on recent buyers, leveraged long positions and corporate Bitcoin holders, while market sentiment remains deep in Extreme Fear. Bitcoin has already recorded six consecutive weekly losses, with liquidations, ETF outflows and shifting interest-rate expectations contributing to the broader sell-off. A break below $62K could expose the $60K psychological level, followed by the June low around $58,500, where additional selling could accelerate. Meanwhile, funding rates have turned negative and traders are increasingly positioning for further downside. The immediate focus is whether $BTC can reclaim $63K and stabilise. If support continues to fail, the market could face another wave of liquidations before buyers regain control. #BTC Price Analysis# #Bitcoin Price Prediction: What is Bitcoins next move?# #BearishSetup $ETH
·
--
STRATEGY МАЙКЛА СЕЙЛОРА ТЕПЕР МАЄ МАЙЖЕ $10 МІЛЬЯРДІВ НЕРЕАЛІЗОВАНИХ ЗБИТКІВ ВІД БІТКОЇНА. Різке падіння ціни біткоїна опустило вартість значного резерву $BTC компанії Strategy набагато нижче за середню ціну придбання. Згідно з останньою звітністю компанії до SEC: > Запаси біткоїна: 850,849 BTC > Загальна вартість придбання: $64.20 мільярда > Середня ціна купівлі: $75,452 за BTC > Поточна ринкова вартість: приблизно $54.6 мільярда > Нереалізований збиток: приблизно $9.6 мільярда Нещодавно Strategy придбала ще 485 BTC за $33.4 мільйона, навіть попри те, що біткоїн продовжував падати нижче за середню ціну придбання. Збиток є нереалізованим, тобто Strategy не продавала свій біткоїн за цими цінами. Вартість її активів просто опустилася нижче за суму, яку компанія за них заплатила. Попри падіння вартості активів, компанія продовжує накопичувати $BTC і зберігає резерви на мільярди доларів, щоб підтримувати свою структуру капіталу та виконувати зобов’язання щодо виплати дивідендів. Переконаність Сейлора не змінилася, але падіння біткоїна дедалі сильніше тисне на його стратегію управління резервами. Питання в тому, наскільки ще може впасти BTC, перш ніж ринок почне ставити під сумнів саму стратегію. #АналізЦіниBTC# #ПрогнозЦіниБіткоїна: Який наступний рух біткоїна?# #МакроекономічнийОгляд# $ETH
STRATEGY МАЙКЛА СЕЙЛОРА ТЕПЕР МАЄ МАЙЖЕ $10 МІЛЬЯРДІВ НЕРЕАЛІЗОВАНИХ ЗБИТКІВ ВІД БІТКОЇНА. Різке падіння ціни біткоїна опустило вартість значного резерву $BTC компанії Strategy набагато нижче за середню ціну придбання. Згідно з останньою звітністю компанії до SEC: > Запаси біткоїна: 850,849 BTC > Загальна вартість придбання: $64.20 мільярда > Середня ціна купівлі: $75,452 за BTC > Поточна ринкова вартість: приблизно $54.6 мільярда > Нереалізований збиток: приблизно $9.6 мільярда Нещодавно Strategy придбала ще 485 BTC за $33.4 мільйона, навіть попри те, що біткоїн продовжував падати нижче за середню ціну придбання. Збиток є нереалізованим, тобто Strategy не продавала свій біткоїн за цими цінами. Вартість її активів просто опустилася нижче за суму, яку компанія за них заплатила. Попри падіння вартості активів, компанія продовжує накопичувати $BTC і зберігає резерви на мільярди доларів, щоб підтримувати свою структуру капіталу та виконувати зобов’язання щодо виплати дивідендів. Переконаність Сейлора не змінилася, але падіння біткоїна дедалі сильніше тисне на його стратегію управління резервами. Питання в тому, наскільки ще може впасти BTC, перш ніж ринок почне ставити під сумнів саму стратегію. #АналізЦіниBTC# #ПрогнозЦіниБіткоїна: Який наступний рух біткоїна?# #МакроекономічнийОгляд# $ETH
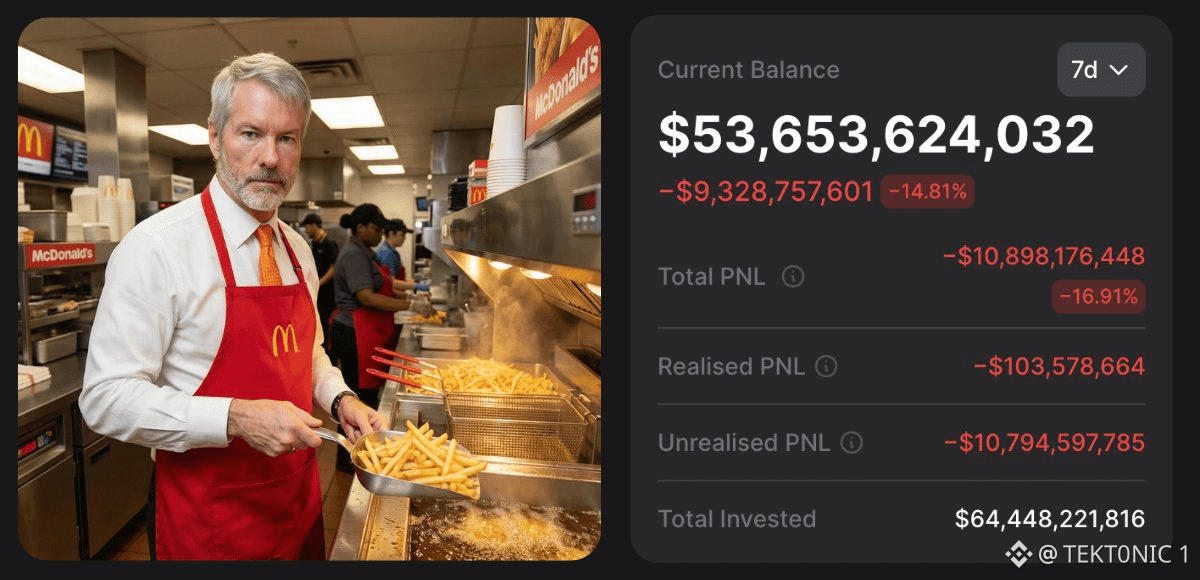
3
·
--
Переглянути переклад
a $129m bitcoin long is sitting just above its liquidation price, with $63.5k marking the level to watch. 👀 data tracking large positions on Hyperliquid shows a roughly $129.5m $BTC long that could face liquidation if bitcoin falls to around $63,500. this is a leveraged position, meaning the trader used borrowed exposure to control a larger market position with less capital. when the market moves against that trade and account margin becomes insufficient, the exchange can automatically close it to limit further losses. with $BTC trading near $64.7k, the liquidation level is roughly 1.9% below the current price. that leaves relatively little room for the position to absorb another downward move. if the level is reached, the exchange may sell the position into the market. that forced selling can add pressure during an already weak move, especially if other leveraged longs are clustered around nearby prices. one important distinction: $129m represents the position's approximate size, not the trader's potential loss. the actual loss depends on the entry price, margin, fees and how the position is closed. this is why large leveraged positions matter beyond the individual trader. when liquidation levels sit close to the market price, a relatively small move can trigger forced exits and potentially accelerate volatility. source: coinglass.com/currencies/BTC #BTC Price Analysis# #Bitcoin Price Prediction: What is Bitcoins next move?# #Macro Insights# $ETH
a $129m bitcoin long is sitting just above its liquidation price, with $63.5k marking the level to watch. 👀 data tracking large positions on Hyperliquid shows a roughly $129.5m $BTC long that could face liquidation if bitcoin falls to around $63,500. this is a leveraged position, meaning the trader used borrowed exposure to control a larger market position with less capital. when the market moves against that trade and account margin becomes insufficient, the exchange can automatically close it to limit further losses. with $BTC trading near $64.7k, the liquidation level is roughly 1.9% below the current price. that leaves relatively little room for the position to absorb another downward move. if the level is reached, the exchange may sell the position into the market. that forced selling can add pressure during an already weak move, especially if other leveraged longs are clustered around nearby prices. one important distinction: $129m represents the position's approximate size, not the trader's potential loss. the actual loss depends on the entry price, margin, fees and how the position is closed. this is why large leveraged positions matter beyond the individual trader. when liquidation levels sit close to the market price, a relatively small move can trigger forced exits and potentially accelerate volatility. source: coinglass.com/currencies/BTC #BTC Price Analysis# #Bitcoin Price Prediction: What is Bitcoins next move?# #Macro Insights# $ETH
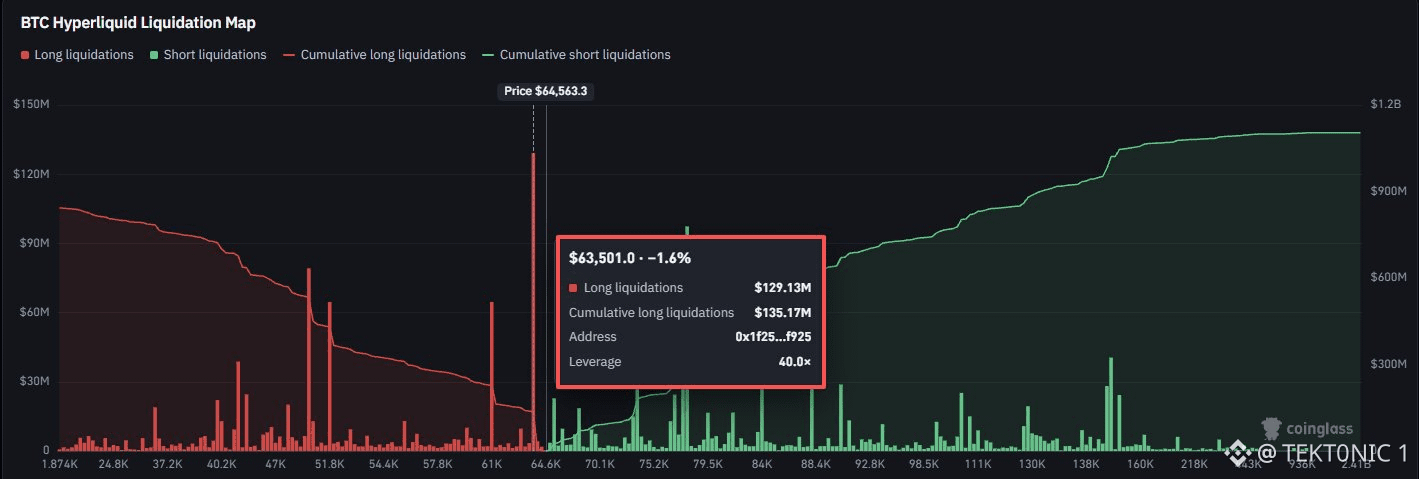
·
--
Переглянути переклад
🚨 THE CRYPTO FEAR & GREED INDEX HAS DROPPED TO 13/100 — EXTREME FEAR. According to CoinMarketCap, market sentiment has deteriorated sharply, with the index falling from 26 last week and 49 a month ago to just 13 today. The current reading puts sentiment close to the yearly low of 5 recorded on February 6, 2026. The index measures overall market sentiment using factors such as price momentum, volatility, trading activity and market trends. Historically, periods of extreme fear have often coincided with significant market corrections, when investors become increasingly pessimistic and sell under pressure. But these conditions can also create opportunities for long-term investors willing to accumulate while sentiment is weak. Extreme fear is not an automatic bottom signal. $BTC can continue falling even when sentiment is already deeply pessimistic. The more important development is what happens next: whether selling pressure begins to fade, Bitcoin stabilises and buyers gradually return. The market is currently in extreme fear. Historically, some of the best accumulation opportunities have emerged when the majority were afraid to buy. #BTC Price Analysis# #Bitcoin Price Prediction: What is Bitcoins next move?# #Altcoin Season# $BTC $XRP
🚨 THE CRYPTO FEAR & GREED INDEX HAS DROPPED TO 13/100 — EXTREME FEAR. According to CoinMarketCap, market sentiment has deteriorated sharply, with the index falling from 26 last week and 49 a month ago to just 13 today. The current reading puts sentiment close to the yearly low of 5 recorded on February 6, 2026. The index measures overall market sentiment using factors such as price momentum, volatility, trading activity and market trends. Historically, periods of extreme fear have often coincided with significant market corrections, when investors become increasingly pessimistic and sell under pressure. But these conditions can also create opportunities for long-term investors willing to accumulate while sentiment is weak. Extreme fear is not an automatic bottom signal. $BTC can continue falling even when sentiment is already deeply pessimistic. The more important development is what happens next: whether selling pressure begins to fade, Bitcoin stabilises and buyers gradually return. The market is currently in extreme fear. Historically, some of the best accumulation opportunities have emerged when the majority were afraid to buy. #BTC Price Analysis# #Bitcoin Price Prediction: What is Bitcoins next move?# #Altcoin Season# $BTC $XRP
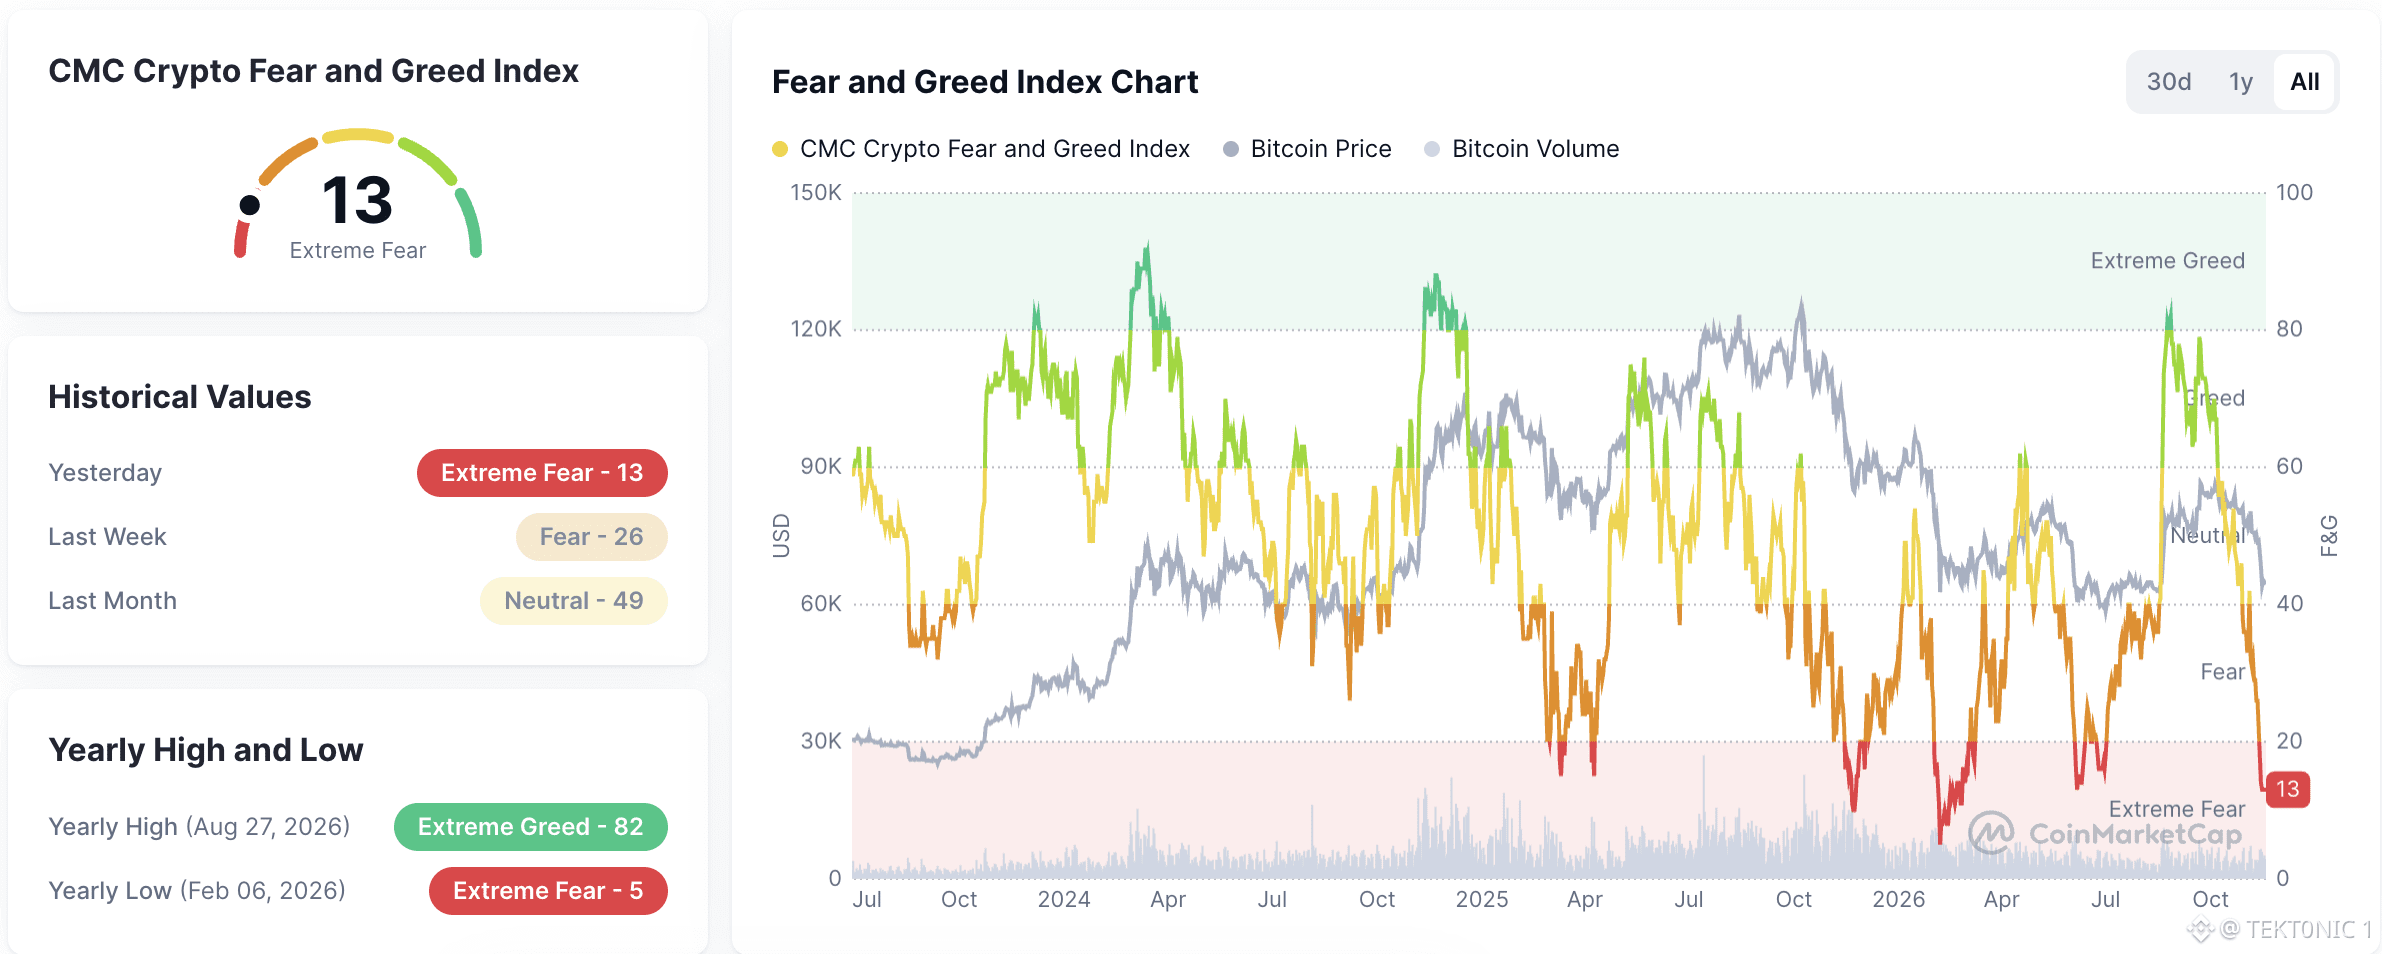
27
Увійдіть, щоб переглянути інший контент
Приєднуйтесь до користувачів криптовалют по всьому світу на Binance Square
⚡️ Отримуйте актуальну та корисну інформацію про криптовалюти.
💬 Приєднуйтесь до найбільшої у світі криптобіржі.
👍 Відкрийте справжні ідеї від перевірених авторів.
Електронна пошта / номер телефону
Трендові теми
fomcвідстеження
126,471 переглядів
556 обговорюють
Думаєте, ШІ-хайп триватиме вічно? ФРС вже починає готуватися до гіршого 👀
VoLoDyMyR7
·10 вподобань
·260 переглядів
AnthropicToDebutAfter$83IPOPricing
15,333 переглядів
150 обговорюють
BTCRemainsUnderPressureAfterHawkishFOMCMinutes
57,463 переглядів
1,229 обговорюють