
Steve Cryptoo 1
369 Публікації

Steve Cryptoo 1
Поскаржитись
Заблокувати користувача
Crypto Advisor| Chart Analyst| Web3 Guru|
0 Підписки
3 Підписники
18 Вподобань
Публікації
Переглянути переклад
BITCOIN UNDER HEAVY SELLING PRESSURE — BEARS ARE IN CONTROL
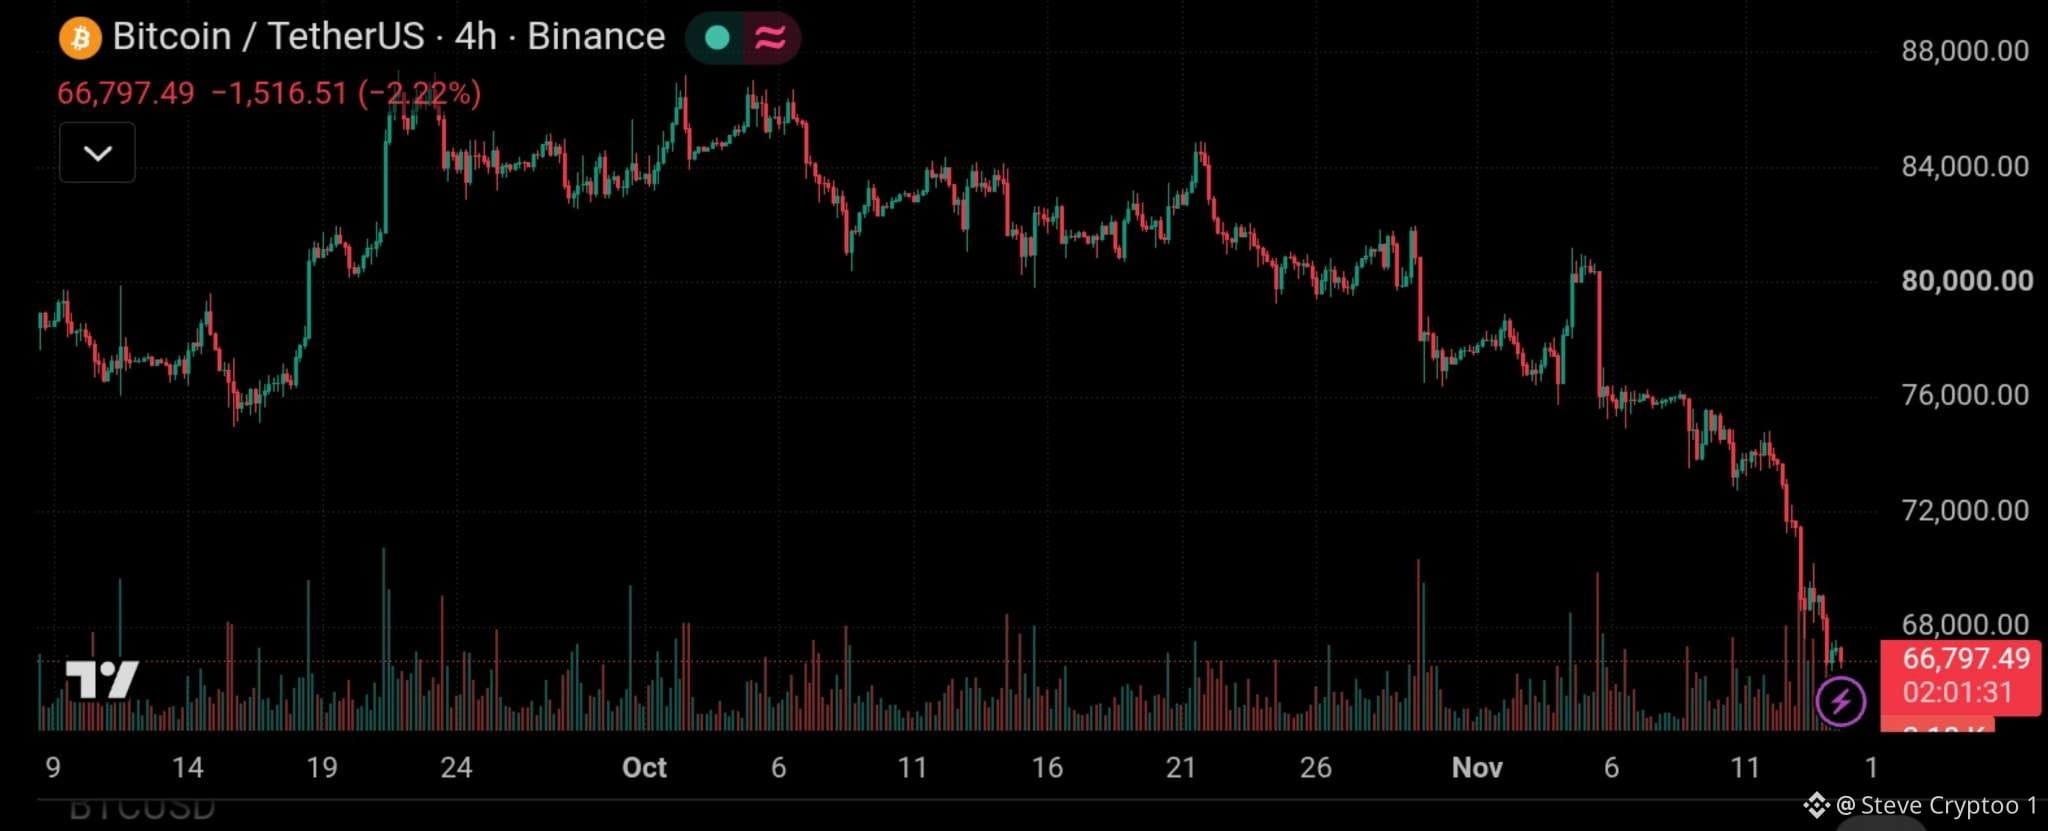
$BTC has taken another sharp hit, dropping to around $66,797 on the 4H chart, down approximately 2.22% at the time of the screenshot.
The technical picture is becoming increasingly bearish.
📉 What the chart tells us:
• BTC continues forming lower highs and lower lows.
• The $72,000 support zone has already given way.
• Price has now slipped below the important $68,000 level.
• Selling volume has increased during the latest breakdown, showing strong bearish pressure.
Key levels to watch:
🔴 Resistance: $68,000 – $72,000
🔴 Next resistance: $76,000
🟢 Immediate area to monitor: $66,000 – $65,000
What comes next?
Bulls need to reclaim $68K and establish support above it to improve the short-term outlook. Otherwise, further downside remains a possibility.
The broader market pressure is also significant, with ETF outflows, heavy liquidations and macroeconomic uncertainty weighing on sentiment.
#Bitcoin #BTC #CryptoMarket
BITCOIN UNDER HEAVY SELLING PRESSURE — BEARS ARE IN CONTROL
$BTC has taken another sharp hit, dropping to around $66,797 on the 4H chart, down approximately 2.22% at the time of the screenshot.
The technical picture is becoming increasingly bearish.
📉 What the chart tells us:
• BTC continues forming lower highs and lower lows.
• The $72,000 support zone has already given way.
• Price has now slipped below the important $68,000 level.
• Selling volume has increased during the latest breakdown, showing strong bearish pressure.
Key levels to watch:
🔴 Resistance: $68,000 – $72,000
🔴 Next resistance: $76,000
🟢 Immediate area to monitor: $66,000 – $65,000
What comes next?
Bulls need to reclaim $68K and establish support above it to improve the short-term outlook. Otherwise, further downside remains a possibility.
The broader market pressure is also significant, with ETF outflows, heavy liquidations and macroeconomic uncertainty weighing on sentiment.
#Bitcoin #BTC #CryptoMarket
$BTC has taken another sharp hit, dropping to around $66,797 on the 4H chart, down approximately 2.22% at the time of the screenshot.
The technical picture is becoming increasingly bearish.
📉 What the chart tells us:
• BTC continues forming lower highs and lower lows.
• The $72,000 support zone has already given way.
• Price has now slipped below the important $68,000 level.
• Selling volume has increased during the latest breakdown, showing strong bearish pressure.
Key levels to watch:
🔴 Resistance: $68,000 – $72,000
🔴 Next resistance: $76,000
🟢 Immediate area to monitor: $66,000 – $65,000
What comes next?
Bulls need to reclaim $68K and establish support above it to improve the short-term outlook. Otherwise, further downside remains a possibility.
The broader market pressure is also significant, with ETF outflows, heavy liquidations and macroeconomic uncertainty weighing on sentiment.
#Bitcoin #BTC #CryptoMarket
66
Переглянути переклад
RLUSD JUST FLIPPED PYUSD!
Ripple is gaining ground in the stablecoin market.
According to DefiLlama, Ripple’s $RLUSD has overtaken PayPal’s $PYUSD to become the 7th-largest stablecoin by market capitalization.
Here's where they stand:
🔹 $RLUSD : $2.70B
🔹 $PYUSD: $2.63B
The gap is relatively small, but the milestone is significant.
Ripple continues to strengthen its position in the stablecoin space, showing how competition is heating up among major financial players.
Stablecoin adoption is growing, and the race is far from over. 👀
#Ripple #Stablecoins #PYUSD
RLUSD JUST FLIPPED PYUSD!
Ripple is gaining ground in the stablecoin market.
According to DefiLlama, Ripple’s $RLUSD has overtaken PayPal’s $PYUSD to become the 7th-largest stablecoin by market capitalization.
Here's where they stand:
🔹 $RLUSD : $2.70B
🔹 $PYUSD: $2.63B
The gap is relatively small, but the milestone is significant.
Ripple continues to strengthen its position in the stablecoin space, showing how competition is heating up among major financial players.
Stablecoin adoption is growing, and the race is far from over. 👀
#Ripple #Stablecoins #PYUSD
Ripple is gaining ground in the stablecoin market.
According to DefiLlama, Ripple’s $RLUSD has overtaken PayPal’s $PYUSD to become the 7th-largest stablecoin by market capitalization.
Here's where they stand:
🔹 $RLUSD : $2.70B
🔹 $PYUSD: $2.63B
The gap is relatively small, but the milestone is significant.
Ripple continues to strengthen its position in the stablecoin space, showing how competition is heating up among major financial players.
Stablecoin adoption is growing, and the race is far from over. 👀
#Ripple #Stablecoins #PYUSD

67
Переглянути переклад
$ERA IS SHOWING SERIOUS BULLISH MOMENTUM! Can Caldera push toward $0.11?
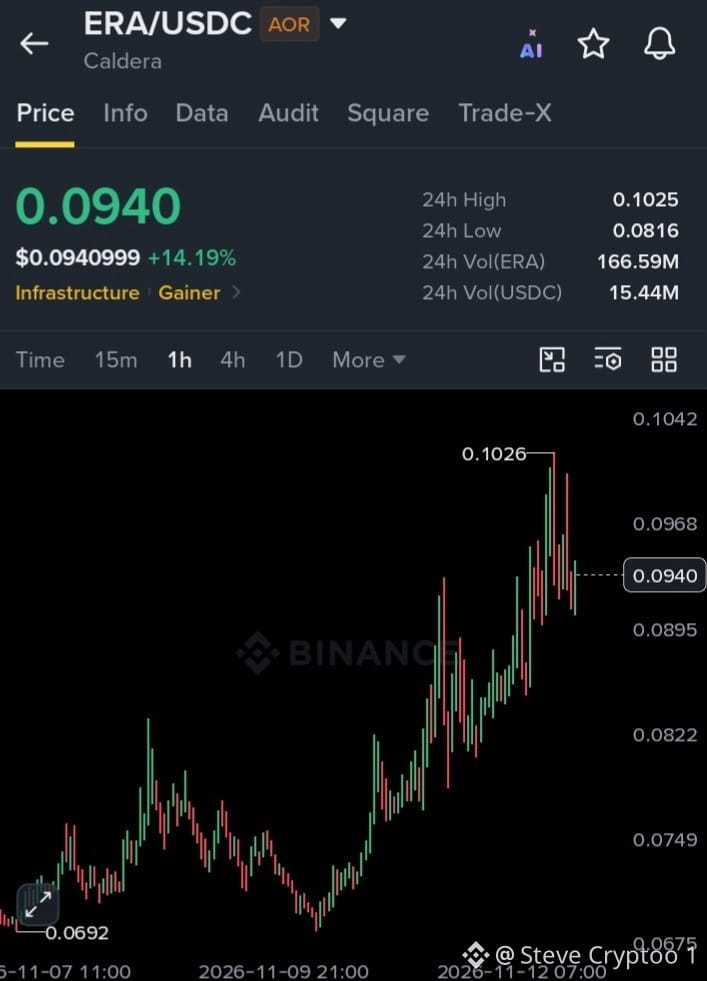
$ERA /USDC is gaining strength, currently trading around $0.0940, up 14.19% in 24 hours.
The 1H chart is showing a clear recovery structure, with higher highs and higher lows.
Buyers are still active, but the next resistance zone will be important.
📊 Key Technical Levels:
🟢 Upside Targets:
TP1: $0.0980
TP2: $0.1025
TP3: $0.1060
TP4: $0.1120
🔴 Important Support Zones:
Support 1: $0.0895
Support 2: $0.0822
Major support: $0.0749
What to Watch Next:
$0.0968 is the first important resistance to watch. A strong 1H close above this level could bring another attempt at $0.1025.
A confirmed breakout above $0.1025 could open the door toward $0.1060 and potentially $0.1120.
#BTC Price Analysis# #Macro Insights#
$ERA IS SHOWING SERIOUS BULLISH MOMENTUM! Can Caldera push toward $0.11?
$ERA /USDC is gaining strength, currently trading around $0.0940, up 14.19% in 24 hours.
The 1H chart is showing a clear recovery structure, with higher highs and higher lows.
Buyers are still active, but the next resistance zone will be important.
📊 Key Technical Levels:
🟢 Upside Targets:
TP1: $0.0980
TP2: $0.1025
TP3: $0.1060
TP4: $0.1120
🔴 Important Support Zones:
Support 1: $0.0895
Support 2: $0.0822
Major support: $0.0749
What to Watch Next:
$0.0968 is the first important resistance to watch. A strong 1H close above this level could bring another attempt at $0.1025.
A confirmed breakout above $0.1025 could open the door toward $0.1060 and potentially $0.1120.
#BTC Price Analysis# #Macro Insights#
$ERA /USDC is gaining strength, currently trading around $0.0940, up 14.19% in 24 hours.
The 1H chart is showing a clear recovery structure, with higher highs and higher lows.
Buyers are still active, but the next resistance zone will be important.
📊 Key Technical Levels:
🟢 Upside Targets:
TP1: $0.0980
TP2: $0.1025
TP3: $0.1060
TP4: $0.1120
🔴 Important Support Zones:
Support 1: $0.0895
Support 2: $0.0822
Major support: $0.0749
What to Watch Next:
$0.0968 is the first important resistance to watch. A strong 1H close above this level could bring another attempt at $0.1025.
A confirmed breakout above $0.1025 could open the door toward $0.1060 and potentially $0.1120.
#BTC Price Analysis# #Macro Insights#
56
Переглянути переклад
$BTC has seen it all, but history keeps teaching the same lesson: volatility is part of the journey. 🟠
Look at Bitcoin’s price on November 11 over the years:
2016: $715 2017: $6,350 2018: $6,375 2019: $8,750 2020: $15,700 2021: $64,900 2022: $17,000 2023: $37,000 2024: $88,000 2025: $103,000 2026: $74,000
Now look at the bigger picture.
Bitcoin has experienced major corrections, painful bear markets, and periods when confidence was low. Yet it has continued to evolve through multiple market cycles.
What about the current chart?
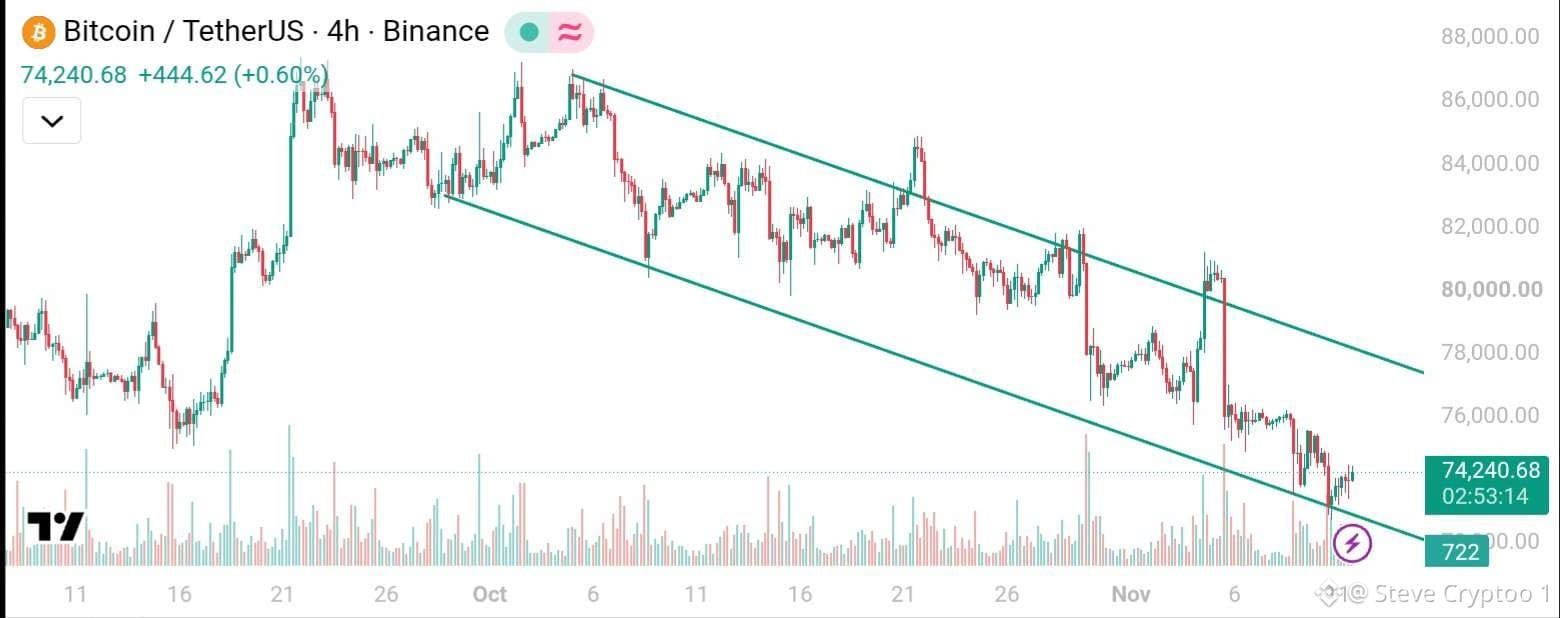
BTC is trading around $74K on the 4H timeframe, moving inside a descending channel. Price is approaching the lower boundary, making this an important technical area to watch.
A sustained bounce could offer a recovery opportunity, while a breakdown may open the door to further downside.
The key is confirmation, not assumptions.
Markets move in cycles. Patience and perspective matter.
Don't let short-term volatility erase the bigger picture.
#BTC Price Analysis# #Macro Insights#
$BTC has seen it all, but history keeps teaching the same lesson: volatility is part of the journey. 🟠
Look at Bitcoin’s price on November 11 over the years:
2016: $715 2017: $6,350 2018: $6,375 2019: $8,750 2020: $15,700 2021: $64,900 2022: $17,000 2023: $37,000 2024: $88,000 2025: $103,000 2026: $74,000
Now look at the bigger picture.
Bitcoin has experienced major corrections, painful bear markets, and periods when confidence was low. Yet it has continued to evolve through multiple market cycles.
What about the current chart?
BTC is trading around $74K on the 4H timeframe, moving inside a descending channel. Price is approaching the lower boundary, making this an important technical area to watch.
A sustained bounce could offer a recovery opportunity, while a breakdown may open the door to further downside.
The key is confirmation, not assumptions.
Markets move in cycles. Patience and perspective matter.
Don't let short-term volatility erase the bigger picture.
#BTC Price Analysis# #Macro Insights#
Look at Bitcoin’s price on November 11 over the years:
2016: $715 2017: $6,350 2018: $6,375 2019: $8,750 2020: $15,700 2021: $64,900 2022: $17,000 2023: $37,000 2024: $88,000 2025: $103,000 2026: $74,000
Now look at the bigger picture.
Bitcoin has experienced major corrections, painful bear markets, and periods when confidence was low. Yet it has continued to evolve through multiple market cycles.
What about the current chart?
BTC is trading around $74K on the 4H timeframe, moving inside a descending channel. Price is approaching the lower boundary, making this an important technical area to watch.
A sustained bounce could offer a recovery opportunity, while a breakdown may open the door to further downside.
The key is confirmation, not assumptions.
Markets move in cycles. Patience and perspective matter.
Don't let short-term volatility erase the bigger picture.
#BTC Price Analysis# #Macro Insights#
76
Переглянути переклад
$XRP THE DIP IS GETTING INTERESTING 👀
$XRP is showing a significant pullback, but the current zone deserves attention.
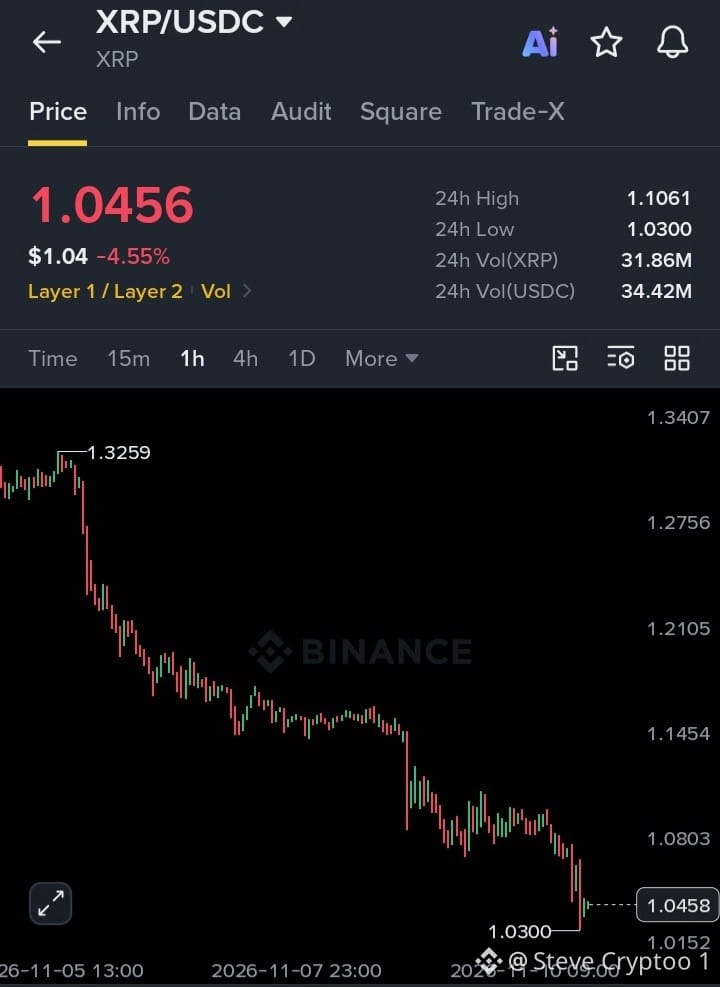
On the 1H chart, XRP has dropped from around $1.3259 to a recent low of $1.0300, putting strong selling pressure on the market.
Here's what I'm watching:
🔹 Key Support: $1.0300 — critical zone for buyers to defend.
🔹 Immediate Resistance: $1.0800 — reclaiming this level could be the first sign of improving momentum.
🔹 Next Resistance: $1.1450 — an important level for a stronger recovery attempt.
🔹 Major Resistance: $1.2100.
My Take:
This could be an interesting dip-buying zone, but catching a falling market without confirmation is risky.
#BTC Price Analysis# #Macro Insights#
$XRP THE DIP IS GETTING INTERESTING 👀
$XRP is showing a significant pullback, but the current zone deserves attention.
On the 1H chart, XRP has dropped from around $1.3259 to a recent low of $1.0300, putting strong selling pressure on the market.
Here's what I'm watching:
🔹 Key Support: $1.0300 — critical zone for buyers to defend.
🔹 Immediate Resistance: $1.0800 — reclaiming this level could be the first sign of improving momentum.
🔹 Next Resistance: $1.1450 — an important level for a stronger recovery attempt.
🔹 Major Resistance: $1.2100.
My Take:
This could be an interesting dip-buying zone, but catching a falling market without confirmation is risky.
#BTC Price Analysis# #Macro Insights#
$XRP is showing a significant pullback, but the current zone deserves attention.
On the 1H chart, XRP has dropped from around $1.3259 to a recent low of $1.0300, putting strong selling pressure on the market.
Here's what I'm watching:
🔹 Key Support: $1.0300 — critical zone for buyers to defend.
🔹 Immediate Resistance: $1.0800 — reclaiming this level could be the first sign of improving momentum.
🔹 Next Resistance: $1.1450 — an important level for a stronger recovery attempt.
🔹 Major Resistance: $1.2100.
My Take:
This could be an interesting dip-buying zone, but catching a falling market without confirmation is risky.
#BTC Price Analysis# #Macro Insights#
76
Переглянути переклад
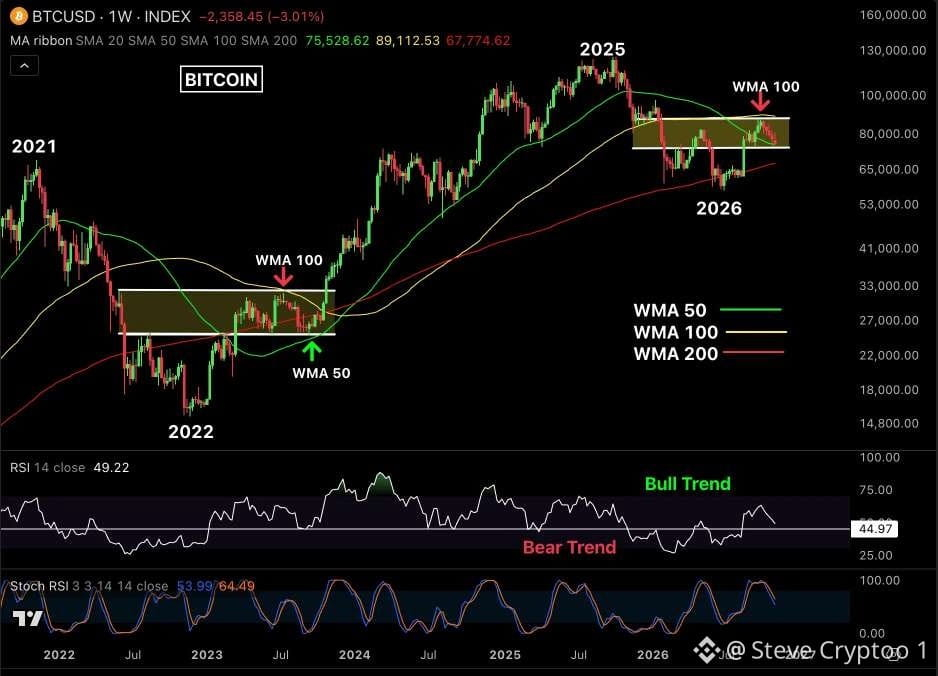
BITCOIN IS REPEATING A FAMILIAR WEEKLY STRUCTURE. IS ANOTHER MAJOR BREAKOUT APPROACHING?
The current $BTC setup is drawing strong similarities to 2023, when Bitcoin consolidated between its weekly MA 50 and MA 100 before breaking out into a powerful rally.
Now, in 2026, a similar structure is developing.
After facing rejection near the weekly MA 100 around $87,400, Bitcoin is once again trading within a critical range.
Key Levels to Watch:
🟢 Support • Weekly MA 50: $75,500 • Weekly MA 200: $67,800
🔴 Resistance • Immediate: $82,000 • Major: $87,400 (Weekly MA 100)
Momentum Check:
• RSI near 50 indicates neutral momentum
• Stochastic RSI is weakening, suggesting potential short-term downside.
• A sustained move above the weekly MA 100 would strengthen the bullish outlook.
My Take:
The 2023 comparison is interesting, but history doesn't guarantee repetition.
Bitcoin needs to defend its key support levels and reclaim the weekly MA 100 with a confirmed weekly close.
A successful breakout could open the door to another significant upside move. However, losing support would weaken the bullish structure.
Patience is key. Let the weekly candles confirm the next direction.
#BTC Price Analysis# #Macro Insights#
BITCOIN IS REPEATING A FAMILIAR WEEKLY STRUCTURE. IS ANOTHER MAJOR BREAKOUT APPROACHING?
The current $BTC setup is drawing strong similarities to 2023, when Bitcoin consolidated between its weekly MA 50 and MA 100 before breaking out into a powerful rally.
Now, in 2026, a similar structure is developing.
After facing rejection near the weekly MA 100 around $87,400, Bitcoin is once again trading within a critical range.
Key Levels to Watch:
🟢 Support • Weekly MA 50: $75,500 • Weekly MA 200: $67,800
🔴 Resistance • Immediate: $82,000 • Major: $87,400 (Weekly MA 100)
Momentum Check:
• RSI near 50 indicates neutral momentum
• Stochastic RSI is weakening, suggesting potential short-term downside.
• A sustained move above the weekly MA 100 would strengthen the bullish outlook.
My Take:
The 2023 comparison is interesting, but history doesn't guarantee repetition.
Bitcoin needs to defend its key support levels and reclaim the weekly MA 100 with a confirmed weekly close.
A successful breakout could open the door to another significant upside move. However, losing support would weaken the bullish structure.
Patience is key. Let the weekly candles confirm the next direction.
#BTC Price Analysis# #Macro Insights#
The current $BTC setup is drawing strong similarities to 2023, when Bitcoin consolidated between its weekly MA 50 and MA 100 before breaking out into a powerful rally.
Now, in 2026, a similar structure is developing.
After facing rejection near the weekly MA 100 around $87,400, Bitcoin is once again trading within a critical range.
Key Levels to Watch:
🟢 Support • Weekly MA 50: $75,500 • Weekly MA 200: $67,800
🔴 Resistance • Immediate: $82,000 • Major: $87,400 (Weekly MA 100)
Momentum Check:
• RSI near 50 indicates neutral momentum
• Stochastic RSI is weakening, suggesting potential short-term downside.
• A sustained move above the weekly MA 100 would strengthen the bullish outlook.
My Take:
The 2023 comparison is interesting, but history doesn't guarantee repetition.
Bitcoin needs to defend its key support levels and reclaim the weekly MA 100 with a confirmed weekly close.
A successful breakout could open the door to another significant upside move. However, losing support would weaken the bullish structure.
Patience is key. Let the weekly candles confirm the next direction.
#BTC Price Analysis# #Macro Insights#
55
Переглянути переклад
The crypto market is full of uncertainty and prediction markets offer an interesting way to follow changing market expectations.
@polymarket brings attention to key questions surrounding major cryptocurrencies:
₿ $BTC — Can Bitcoin maintain its market leadership?
ETH — Will Ethereum regain stronger momentum?
$DOGE — Can Dogecoin attract renewed attention?
✕ $XRP — Will XRP continue building market strength?
Each asset has a different story, but market sentiment, liquidity and upcoming developments will remain important factors.
The interesting part isn't just predicting what comes next, it's understanding why the market expects it.
#Polymarket #BTC Price Analysis# #Macro Insights#
The crypto market is full of uncertainty and prediction markets offer an interesting way to follow changing market expectations.
@polymarket brings attention to key questions surrounding major cryptocurrencies:
₿ $BTC — Can Bitcoin maintain its market leadership?
ETH — Will Ethereum regain stronger momentum?
$DOGE — Can Dogecoin attract renewed attention?
✕ $XRP — Will XRP continue building market strength?
Each asset has a different story, but market sentiment, liquidity and upcoming developments will remain important factors.
The interesting part isn't just predicting what comes next, it's understanding why the market expects it.
#Polymarket #BTC Price Analysis# #Macro Insights#
@polymarket brings attention to key questions surrounding major cryptocurrencies:
₿ $BTC — Can Bitcoin maintain its market leadership?
ETH — Will Ethereum regain stronger momentum?
$DOGE — Can Dogecoin attract renewed attention?
✕ $XRP — Will XRP continue building market strength?
Each asset has a different story, but market sentiment, liquidity and upcoming developments will remain important factors.
The interesting part isn't just predicting what comes next, it's understanding why the market expects it.
#Polymarket #BTC Price Analysis# #Macro Insights#

71
Переглянути переклад
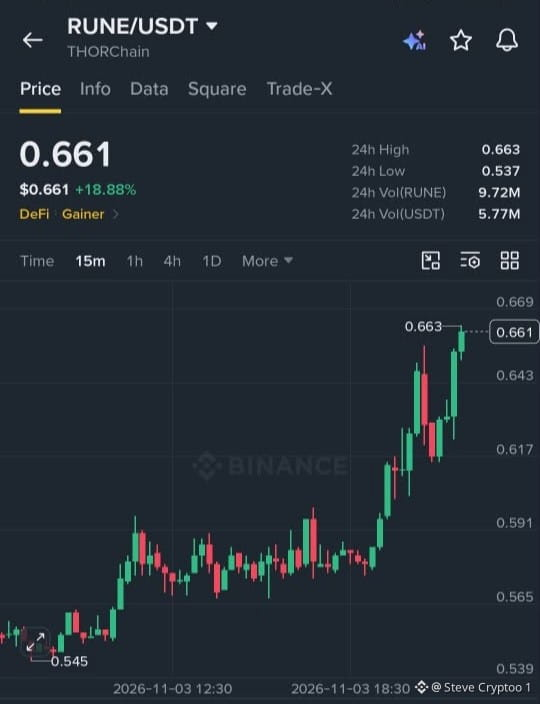
$RUNE Showing Strong Bullish Momentum | Key Resistance Ahead
$RUNE is making an impressive move, currently trading around $0.661 (+18.88%) on the 15-minute chart.
Key Technical Levels:
🔹 Resistance: $0.663–$0.669
🔹 Support 1: $0.643
🔹 Support 2: $0.617
🔹 Major Support: $0.591
What's Next?
A confirmed breakout above $0.663–$0.669, supported by strong volume, could open the door for further upside.
My Take: Momentum is clearly favoring buyers, but confirmation is important. Watch the resistance zone closely.
#BTC Price Analysis# #Macro Insights#
$RUNE Showing Strong Bullish Momentum | Key Resistance Ahead
$RUNE is making an impressive move, currently trading around $0.661 (+18.88%) on the 15-minute chart.
Key Technical Levels:
🔹 Resistance: $0.663–$0.669
🔹 Support 1: $0.643
🔹 Support 2: $0.617
🔹 Major Support: $0.591
What's Next?
A confirmed breakout above $0.663–$0.669, supported by strong volume, could open the door for further upside.
My Take: Momentum is clearly favoring buyers, but confirmation is important. Watch the resistance zone closely.
#BTC Price Analysis# #Macro Insights#
$RUNE is making an impressive move, currently trading around $0.661 (+18.88%) on the 15-minute chart.
Key Technical Levels:
🔹 Resistance: $0.663–$0.669
🔹 Support 1: $0.643
🔹 Support 2: $0.617
🔹 Major Support: $0.591
What's Next?
A confirmed breakout above $0.663–$0.669, supported by strong volume, could open the door for further upside.
My Take: Momentum is clearly favoring buyers, but confirmation is important. Watch the resistance zone closely.
#BTC Price Analysis# #Macro Insights#
73
Переглянути переклад
Big players are making moves while the market keeps everyone guessing.
Strategy added another 811 $BTC worth $65.5 million, bringing its total holdings to an impressive 849,327 $BTC.
Meanwhile, Metaplanet repurchased 96.45 million shares for ¥25.27 billion between October 14 and 31.
Two major moves, one clear takeaway: corporate Bitcoin strategies remain firmly in focus.
The institutional moves are worth watching.
#Bitcoin #Metaplanet #Strategy
Big players are making moves while the market keeps everyone guessing.
Strategy added another 811 $BTC worth $65.5 million, bringing its total holdings to an impressive 849,327 $BTC.
Meanwhile, Metaplanet repurchased 96.45 million shares for ¥25.27 billion between October 14 and 31.
Two major moves, one clear takeaway: corporate Bitcoin strategies remain firmly in focus.
The institutional moves are worth watching.
#Bitcoin #Metaplanet #Strategy
Strategy added another 811 $BTC worth $65.5 million, bringing its total holdings to an impressive 849,327 $BTC.
Meanwhile, Metaplanet repurchased 96.45 million shares for ¥25.27 billion between October 14 and 31.
Two major moves, one clear takeaway: corporate Bitcoin strategies remain firmly in focus.
The institutional moves are worth watching.
#Bitcoin #Metaplanet #Strategy


53
Переглянути переклад
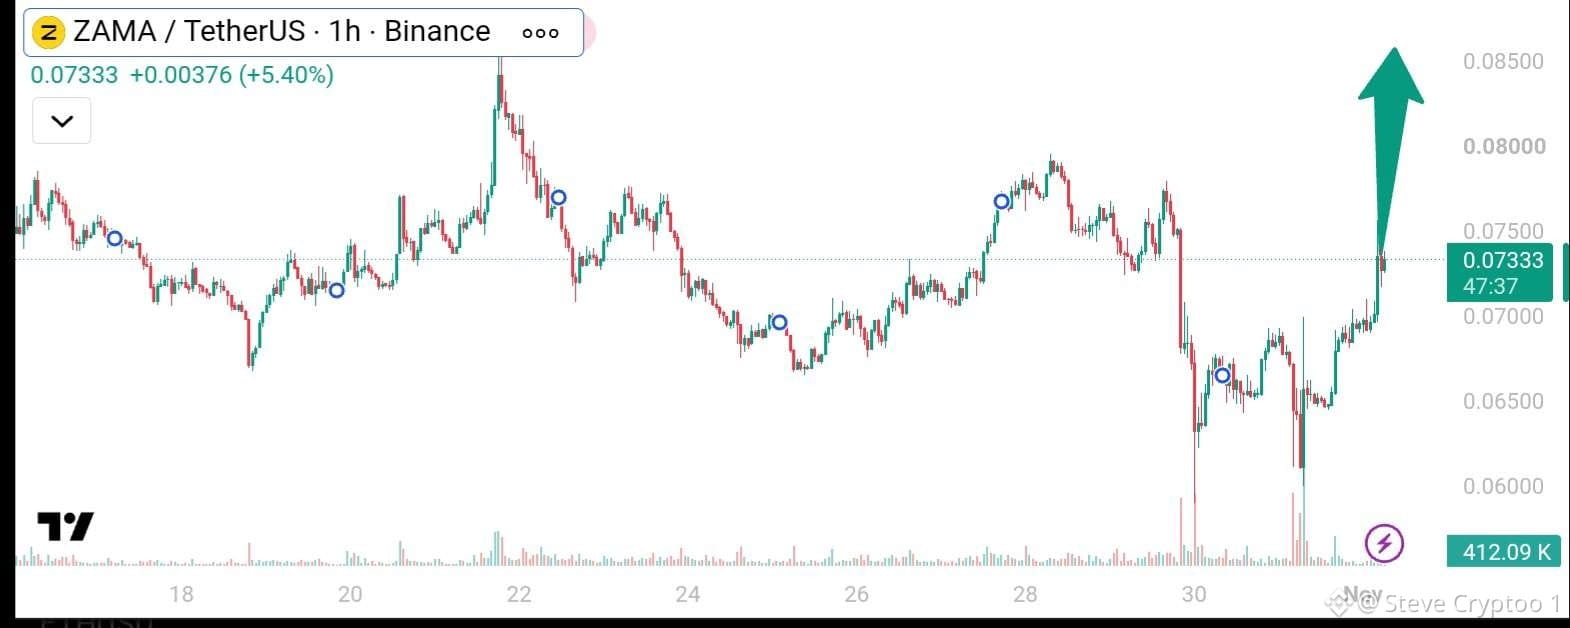
$ZAMA — Bulls Are Regaining Control!
ZAMA is showing a strong recovery on the 1H chart, currently trading around $0.0733 (+5.40%) after rebounding from the $0.061–$0.065 support region.
Key Technical Levels:
Immediate Support: $0.070–$0.071
Major Support: $0.065–$0.067
Resistance: $0.075–$0.078
Upside Targets: $0.080–$0.085
Market Outlook: Buyers are gradually rebuilding momentum, and the latest recovery suggests improving short-term sentiment.
A strong 1H candle close above $0.075–$0.078, supported by increasing volume, could strengthen the bullish structure and open the way toward $0.080 and potentially $0.085.
However, rejection at resistance could trigger another retest of the $0.070 support zone.
#BTC Price Analysis# #Macro Insights#
$ZAMA — Bulls Are Regaining Control!
ZAMA is showing a strong recovery on the 1H chart, currently trading around $0.0733 (+5.40%) after rebounding from the $0.061–$0.065 support region.
Key Technical Levels:
Immediate Support: $0.070–$0.071
Major Support: $0.065–$0.067
Resistance: $0.075–$0.078
Upside Targets: $0.080–$0.085
Market Outlook: Buyers are gradually rebuilding momentum, and the latest recovery suggests improving short-term sentiment.
A strong 1H candle close above $0.075–$0.078, supported by increasing volume, could strengthen the bullish structure and open the way toward $0.080 and potentially $0.085.
However, rejection at resistance could trigger another retest of the $0.070 support zone.
#BTC Price Analysis# #Macro Insights#
ZAMA is showing a strong recovery on the 1H chart, currently trading around $0.0733 (+5.40%) after rebounding from the $0.061–$0.065 support region.
Key Technical Levels:
Immediate Support: $0.070–$0.071
Major Support: $0.065–$0.067
Resistance: $0.075–$0.078
Upside Targets: $0.080–$0.085
Market Outlook: Buyers are gradually rebuilding momentum, and the latest recovery suggests improving short-term sentiment.
A strong 1H candle close above $0.075–$0.078, supported by increasing volume, could strengthen the bullish structure and open the way toward $0.080 and potentially $0.085.
However, rejection at resistance could trigger another retest of the $0.070 support zone.
#BTC Price Analysis# #Macro Insights#
57
Переглянути переклад
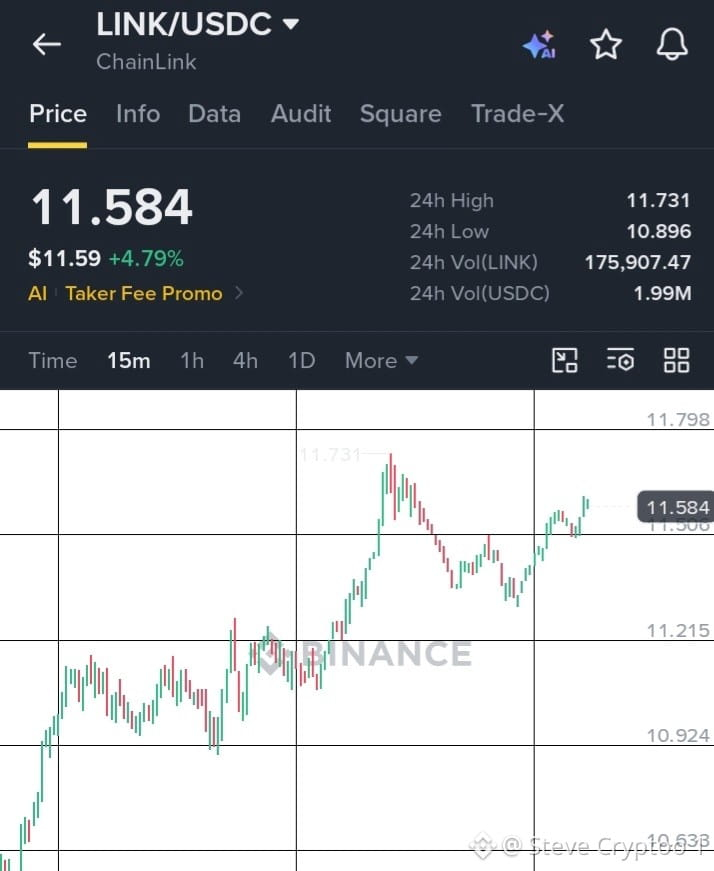
$LINK IS SHOWING STRONG BULLISH MOMENTUM!
Chainlink is trading around $11.58, up 4.79%, with buyers maintaining control on the 15-minute chart.
The structure is showing higher highs and higher lows, suggesting continued short-term strength.
📊 Key Levels to Watch:
Resistance: $11.70–$11.73
Support: $11.50
Lower Support: $11.35–$11.22
Bullish Scenario: A confirmed breakout above $11.73 with strong volume could open the door toward higher levels.
My Take: $LINK looks constructive, but the next breakout needs volume confirmation. Watch the $11.73 level closely.
#BTC Price Analysis# #Macro Insights# #Altcoin Season# #Meme Alpha# #BNBChain#
$LINK IS SHOWING STRONG BULLISH MOMENTUM!
Chainlink is trading around $11.58, up 4.79%, with buyers maintaining control on the 15-minute chart.
The structure is showing higher highs and higher lows, suggesting continued short-term strength.
📊 Key Levels to Watch:
Resistance: $11.70–$11.73
Support: $11.50
Lower Support: $11.35–$11.22
Bullish Scenario: A confirmed breakout above $11.73 with strong volume could open the door toward higher levels.
My Take: $LINK looks constructive, but the next breakout needs volume confirmation. Watch the $11.73 level closely.
#BTC Price Analysis# #Macro Insights# #Altcoin Season# #Meme Alpha# #BNBChain#
Chainlink is trading around $11.58, up 4.79%, with buyers maintaining control on the 15-minute chart.
The structure is showing higher highs and higher lows, suggesting continued short-term strength.
📊 Key Levels to Watch:
Resistance: $11.70–$11.73
Support: $11.50
Lower Support: $11.35–$11.22
Bullish Scenario: A confirmed breakout above $11.73 with strong volume could open the door toward higher levels.
My Take: $LINK looks constructive, but the next breakout needs volume confirmation. Watch the $11.73 level closely.
#BTC Price Analysis# #Macro Insights# #Altcoin Season# #Meme Alpha# #BNBChain#
82
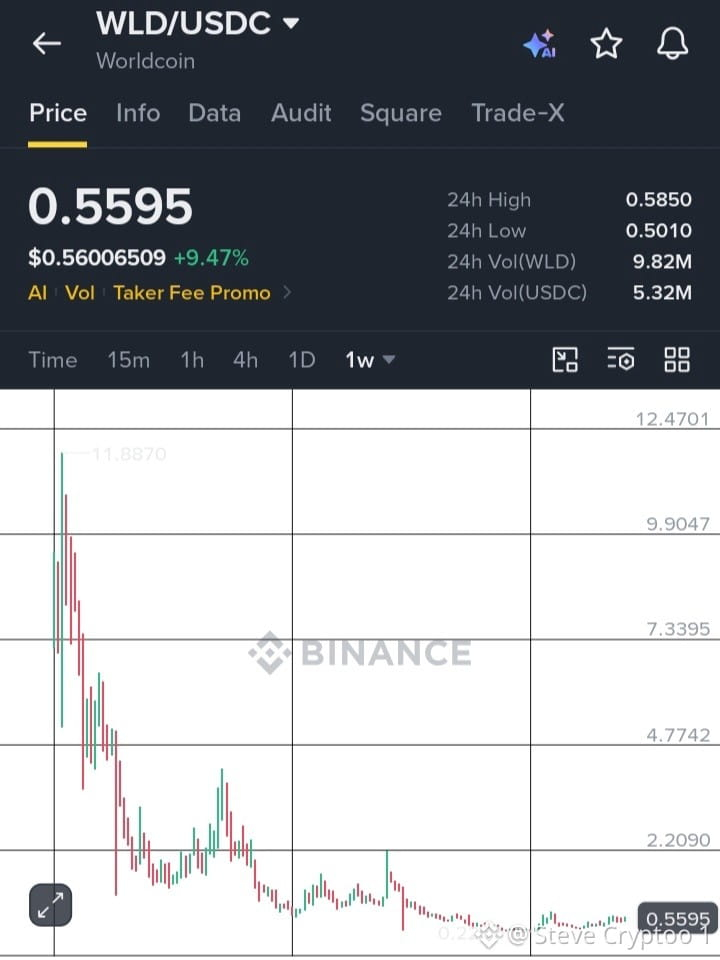
$WLD торгується за ціною $0.5595, що на 9.47% вище за останні 24 години. Це свідчить про короткострокове відновлення після тривалого ведмежого тиску.
🔹 Опір: $0.5850
🔹 Ключова підтримка: $0.5010
📈 Бичачий сценарій: підтверджений прорив вище $0.5850 на значному обсязі торгів може сприяти подальшому відновленню.
📉 Ведмежий сценарій: падіння нижче $0.5010 може відновити тиск продавців.
Прогноз: імпульс поліпшується, але ширший тренд залишається ведмежим. Дочекайтеся підтвердження прориву, перш ніж вважати розворот стійким.
#WLD #Worldcoin #TechnicalAnalysis #CryptoMarkets
$WLD торгується за ціною $0.5595, що на 9.47% вище за останні 24 години. Це свідчить про короткострокове відновлення після тривалого ведмежого тиску.
🔹 Опір: $0.5850
🔹 Ключова підтримка: $0.5010
📈 Бичачий сценарій: підтверджений прорив вище $0.5850 на значному обсязі торгів може сприяти подальшому відновленню.
📉 Ведмежий сценарій: падіння нижче $0.5010 може відновити тиск продавців.
Прогноз: імпульс поліпшується, але ширший тренд залишається ведмежим. Дочекайтеся підтвердження прориву, перш ніж вважати розворот стійким.
#WLD #Worldcoin #TechnicalAnalysis #CryptoMarkets
🔹 Опір: $0.5850
🔹 Ключова підтримка: $0.5010
📈 Бичачий сценарій: підтверджений прорив вище $0.5850 на значному обсязі торгів може сприяти подальшому відновленню.
📉 Ведмежий сценарій: падіння нижче $0.5010 може відновити тиск продавців.
Прогноз: імпульс поліпшується, але ширший тренд залишається ведмежим. Дочекайтеся підтвердження прориву, перш ніж вважати розворот стійким.
#WLD #Worldcoin #TechnicalAnalysis #CryptoMarkets
45
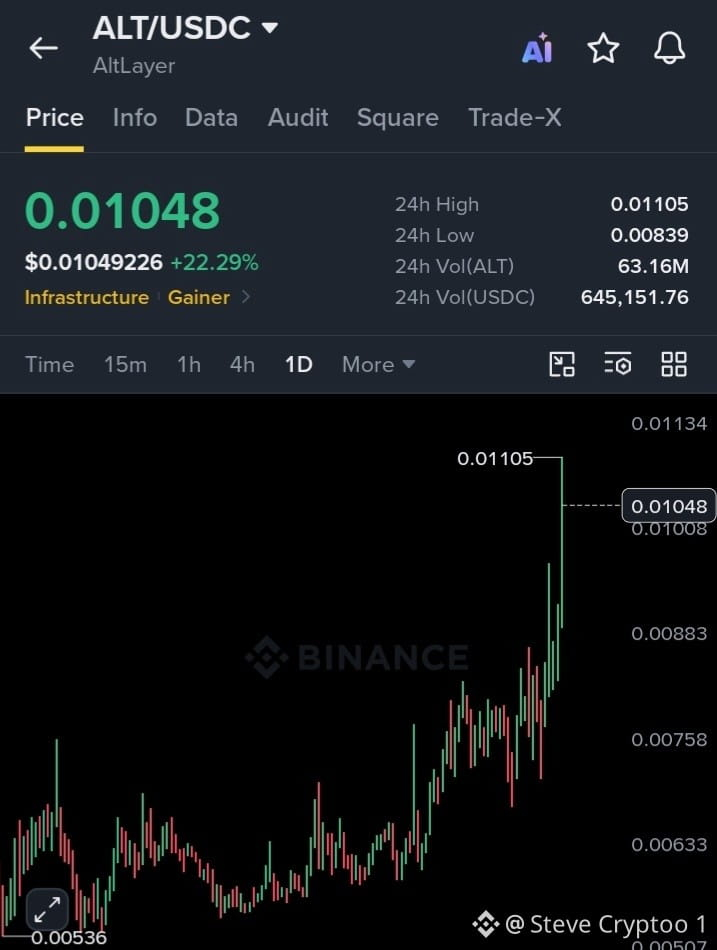
$ALT демонструє сильне зростання, торгуючись на рівні близько $0.01048 і подорожчавши на 22.29% за 24 години, згідно з графіком.
Основні ринкові показники:
💚 Максимум за 24 год: $0.01105
📊 Мінімум за 24 год: $0.00839
⚡ Обсяг за 24 год: 63.16M ALT
📈 Після різкого зростання ціна наближається до важливої зони опору.
🎯 На які рівні звернути увагу:
🔹 Опір: $0.01105–$0.01134
🔹 Підтримка: $0.01000, далі — $0.00883
🔹 Закріплення вище опору може свідчити про подальше посилення зростання, тоді як відбій може спровокувати відкат.
Імпульс бичачий, але після такого стрімкого ралі волатильність і фіксація прибутку залишаються важливими ризиками. Дочекайтеся підтвердження, перш ніж робити висновки.
Чи подолає $ALT позначку $0.01105, чи зробить паузу для консолідації? 👀
#АналізЦіниBTC# #МакроекономічніОгляди#
$ALT демонструє сильне зростання, торгуючись на рівні близько $0.01048 і подорожчавши на 22.29% за 24 години, згідно з графіком.
Основні ринкові показники:
💚 Максимум за 24 год: $0.01105
📊 Мінімум за 24 год: $0.00839
⚡ Обсяг за 24 год: 63.16M ALT
📈 Після різкого зростання ціна наближається до важливої зони опору.
🎯 На які рівні звернути увагу:
🔹 Опір: $0.01105–$0.01134
🔹 Підтримка: $0.01000, далі — $0.00883
🔹 Закріплення вище опору може свідчити про подальше посилення зростання, тоді як відбій може спровокувати відкат.
Імпульс бичачий, але після такого стрімкого ралі волатильність і фіксація прибутку залишаються важливими ризиками. Дочекайтеся підтвердження, перш ніж робити висновки.
Чи подолає $ALT позначку $0.01105, чи зробить паузу для консолідації? 👀
#АналізЦіниBTC# #МакроекономічніОгляди#
Основні ринкові показники:
💚 Максимум за 24 год: $0.01105
📊 Мінімум за 24 год: $0.00839
⚡ Обсяг за 24 год: 63.16M ALT
📈 Після різкого зростання ціна наближається до важливої зони опору.
🎯 На які рівні звернути увагу:
🔹 Опір: $0.01105–$0.01134
🔹 Підтримка: $0.01000, далі — $0.00883
🔹 Закріплення вище опору може свідчити про подальше посилення зростання, тоді як відбій може спровокувати відкат.
Імпульс бичачий, але після такого стрімкого ралі волатильність і фіксація прибутку залишаються важливими ризиками. Дочекайтеся підтвердження, перш ніж робити висновки.
Чи подолає $ALT позначку $0.01105, чи зробить паузу для консолідації? 👀
#АналізЦіниBTC# #МакроекономічніОгляди#
70
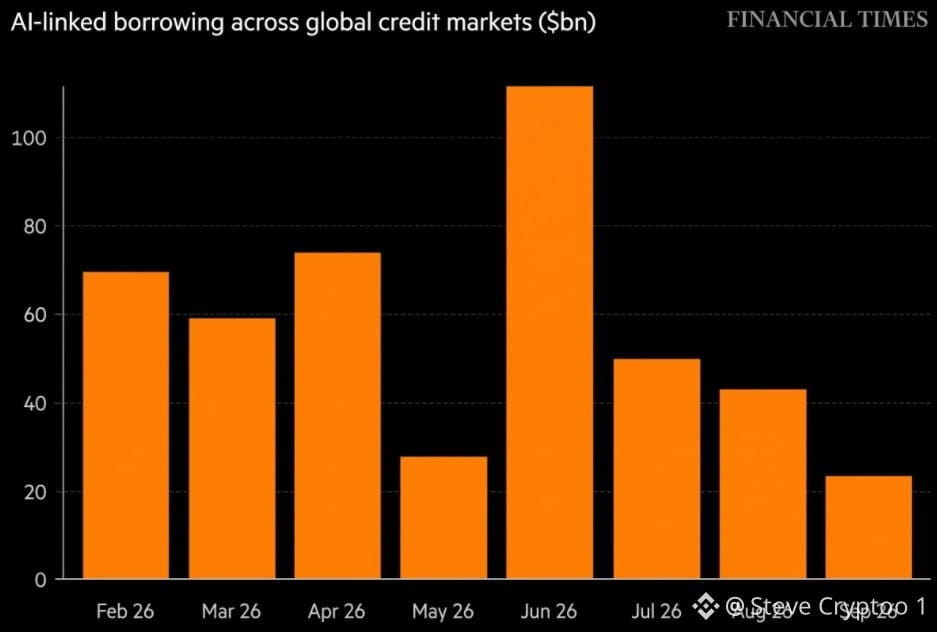
ШІ не втрачає обертів — вартість капіталу зростає.
Запозичення, пов’язані зі ШІ, на світових кредитних ринках розповідають цікаву історію. Після піку в понад $110 млрд у червні обсяги запозичень різко впали й до вересня становили близько $24 млрд.
Але чи означає це, що попит на ШІ згасає? Не обов’язково.
🇺🇸 Зростання державного боргу США та високі дохідності довгострокових казначейських облігацій можуть підвищити витрати на фінансування центрів обробки даних, чипів та інфраструктури ШІ. Коли капітал дорожчає, навіть галузі з високими темпами зростання можуть скоротити витрати й запозичення.
Ключова відмінність: тиск на фінансування не означає автоматично знищення попиту.
За довгостроковою перспективою розвитку ШІ варто стежити, але важливими будуть реалізація проєктів, оцінки компаній і доступ до доступного капіталу.
👀 Стежте за екосистемою інфраструктури ШІ:
🔹 $SNDK — зберігання даних
🔹 $MU — пам’ять і пам’ять із високою пропускною здатністю
🔹 $TAO — децентралізований ШІ
🔹 $NEAR — блокчейн-інфраструктура та розробки, пов’язані зі ШІ
📊 Головне запитання: це тимчасове уповільнення фінансування чи початок масштабнішого перегляду інвестицій у ШІ?
На наступному етапі перевагу можуть отримати фундаментальні показники, а не хайп.
#АналізЦіниBTC# #МакроекономічнийОгляд#
ШІ не втрачає обертів — вартість капіталу зростає.
Запозичення, пов’язані зі ШІ, на світових кредитних ринках розповідають цікаву історію. Після піку в понад $110 млрд у червні обсяги запозичень різко впали й до вересня становили близько $24 млрд.
Але чи означає це, що попит на ШІ згасає? Не обов’язково.
🇺🇸 Зростання державного боргу США та високі дохідності довгострокових казначейських облігацій можуть підвищити витрати на фінансування центрів обробки даних, чипів та інфраструктури ШІ. Коли капітал дорожчає, навіть галузі з високими темпами зростання можуть скоротити витрати й запозичення.
Ключова відмінність: тиск на фінансування не означає автоматично знищення попиту.
За довгостроковою перспективою розвитку ШІ варто стежити, але важливими будуть реалізація проєктів, оцінки компаній і доступ до доступного капіталу.
👀 Стежте за екосистемою інфраструктури ШІ:
🔹 $SNDK — зберігання даних
🔹 $MU — пам’ять і пам’ять із високою пропускною здатністю
🔹 $TAO — децентралізований ШІ
🔹 $NEAR — блокчейн-інфраструктура та розробки, пов’язані зі ШІ
📊 Головне запитання: це тимчасове уповільнення фінансування чи початок масштабнішого перегляду інвестицій у ШІ?
На наступному етапі перевагу можуть отримати фундаментальні показники, а не хайп.
#АналізЦіниBTC# #МакроекономічнийОгляд#
Запозичення, пов’язані зі ШІ, на світових кредитних ринках розповідають цікаву історію. Після піку в понад $110 млрд у червні обсяги запозичень різко впали й до вересня становили близько $24 млрд.
Але чи означає це, що попит на ШІ згасає? Не обов’язково.
🇺🇸 Зростання державного боргу США та високі дохідності довгострокових казначейських облігацій можуть підвищити витрати на фінансування центрів обробки даних, чипів та інфраструктури ШІ. Коли капітал дорожчає, навіть галузі з високими темпами зростання можуть скоротити витрати й запозичення.
Ключова відмінність: тиск на фінансування не означає автоматично знищення попиту.
За довгостроковою перспективою розвитку ШІ варто стежити, але важливими будуть реалізація проєктів, оцінки компаній і доступ до доступного капіталу.
👀 Стежте за екосистемою інфраструктури ШІ:
🔹 $SNDK — зберігання даних
🔹 $MU — пам’ять і пам’ять із високою пропускною здатністю
🔹 $TAO — децентралізований ШІ
🔹 $NEAR — блокчейн-інфраструктура та розробки, пов’язані зі ШІ
📊 Головне запитання: це тимчасове уповільнення фінансування чи початок масштабнішого перегляду інвестицій у ШІ?
На наступному етапі перевагу можуть отримати фундаментальні показники, а не хайп.
#АналізЦіниBTC# #МакроекономічнийОгляд#
86
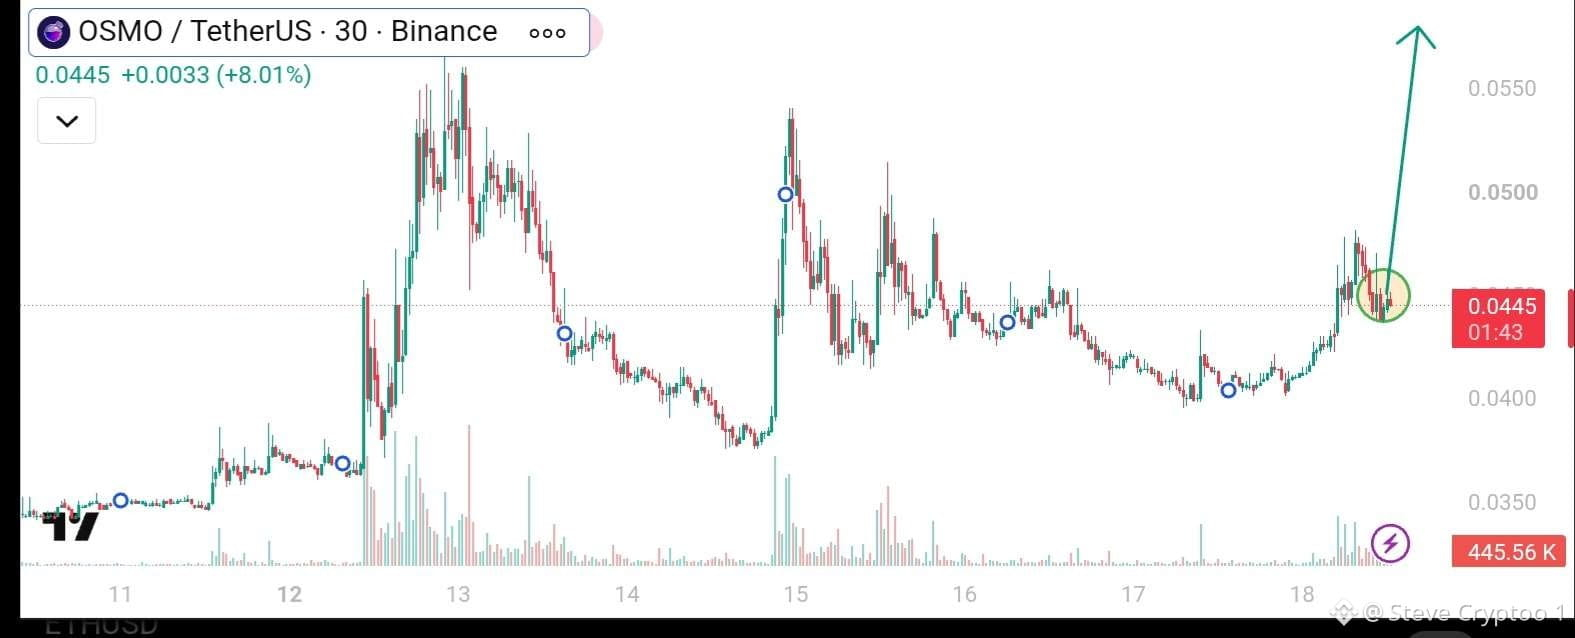
$OSMO торгується на рівні близько $0.0445, піднявшись на 8.01% і демонструючи відновлення інтересу покупців після тривалого періоду консолідації.
📊 Технічний прогноз: після нещодавнього прориву ціна тестує зону $0.0440–$0.0450.
Утримання на цьому рівні може створити підґрунтя для нового руху до $0.0470–$0.0500. Потужний прорив вище $0.0500 може відкрити шлях до $0.0550.
Ключовий ризик: падіння нижче $0.0440 може спричинити відкат до $0.0420–$0.0400.
Моя думка: імпульс виглядає багатообіцяльно, але для підтвердження необхідне стале зростання обсягів купівлі. Уважно стежте за рівнями підтримки та опору.
#Аналіз ціни BTC# #Макроекономічний огляд#
$OSMO торгується на рівні близько $0.0445, піднявшись на 8.01% і демонструючи відновлення інтересу покупців після тривалого періоду консолідації.
📊 Технічний прогноз: після нещодавнього прориву ціна тестує зону $0.0440–$0.0450.
Утримання на цьому рівні може створити підґрунтя для нового руху до $0.0470–$0.0500. Потужний прорив вище $0.0500 може відкрити шлях до $0.0550.
Ключовий ризик: падіння нижче $0.0440 може спричинити відкат до $0.0420–$0.0400.
Моя думка: імпульс виглядає багатообіцяльно, але для підтвердження необхідне стале зростання обсягів купівлі. Уважно стежте за рівнями підтримки та опору.
#Аналіз ціни BTC# #Макроекономічний огляд#
📊 Технічний прогноз: після нещодавнього прориву ціна тестує зону $0.0440–$0.0450.
Утримання на цьому рівні може створити підґрунтя для нового руху до $0.0470–$0.0500. Потужний прорив вище $0.0500 може відкрити шлях до $0.0550.
Ключовий ризик: падіння нижче $0.0440 може спричинити відкат до $0.0420–$0.0400.
Моя думка: імпульс виглядає багатообіцяльно, але для підтвердження необхідне стале зростання обсягів купівлі. Уважно стежте за рівнями підтримки та опору.
#Аналіз ціни BTC# #Макроекономічний огляд#
75
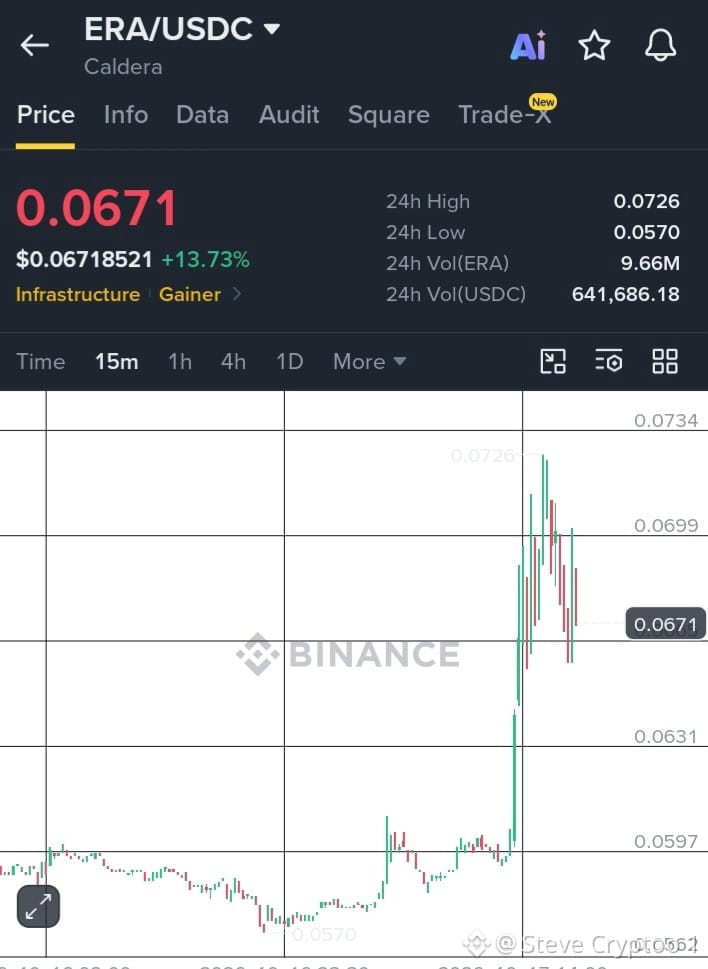
$ERA демонструє вражаючий бичачий імпульс, зростаючи на 13.73%, оскільки покупці підштовхують ціну до $0.0671.
Після консолідації в діапазоні $0.0570–$0.0600 ERA здійснив потужний прорив, досягнувши внутрішньоденного максимуму $0.0726, перш ніж зіткнутися з тиском фіксації прибутку.
💰 Поточна ціна: $0.0671
📈 Зміна за 24 год: +13.73%
🔥 Максимум за 24 год: $0.0726
📉 Мінімум за 24 год: $0.0570
💎 Обсяг торгів: 9.66M ERA
Закріплення вище $0.0699 може відкрити шлях до повторного тестування рівня $0.0726. Подолання цього опору може посилити сценарій подальшого бичачого руху.
Однак падіння нижче $0.0665 може спричинити глибшу корекцію до $0.0631.
Чи готуються бики до нового ривка вгору, чи попереду охолодження?
#Торгівля #АналізЦіниBTC #МакроОгляд
$ERA демонструє вражаючий бичачий імпульс, зростаючи на 13.73%, оскільки покупці підштовхують ціну до $0.0671.
Після консолідації в діапазоні $0.0570–$0.0600 ERA здійснив потужний прорив, досягнувши внутрішньоденного максимуму $0.0726, перш ніж зіткнутися з тиском фіксації прибутку.
💰 Поточна ціна: $0.0671
📈 Зміна за 24 год: +13.73%
🔥 Максимум за 24 год: $0.0726
📉 Мінімум за 24 год: $0.0570
💎 Обсяг торгів: 9.66M ERA
Закріплення вище $0.0699 може відкрити шлях до повторного тестування рівня $0.0726. Подолання цього опору може посилити сценарій подальшого бичачого руху.
Однак падіння нижче $0.0665 може спричинити глибшу корекцію до $0.0631.
Чи готуються бики до нового ривка вгору, чи попереду охолодження?
#Торгівля #АналізЦіниBTC #МакроОгляд
Після консолідації в діапазоні $0.0570–$0.0600 ERA здійснив потужний прорив, досягнувши внутрішньоденного максимуму $0.0726, перш ніж зіткнутися з тиском фіксації прибутку.
💰 Поточна ціна: $0.0671
📈 Зміна за 24 год: +13.73%
🔥 Максимум за 24 год: $0.0726
📉 Мінімум за 24 год: $0.0570
💎 Обсяг торгів: 9.66M ERA
Закріплення вище $0.0699 може відкрити шлях до повторного тестування рівня $0.0726. Подолання цього опору може посилити сценарій подальшого бичачого руху.
Однак падіння нижче $0.0665 може спричинити глибшу корекцію до $0.0631.
Чи готуються бики до нового ривка вгору, чи попереду охолодження?
#Торгівля #АналізЦіниBTC #МакроОгляд
61
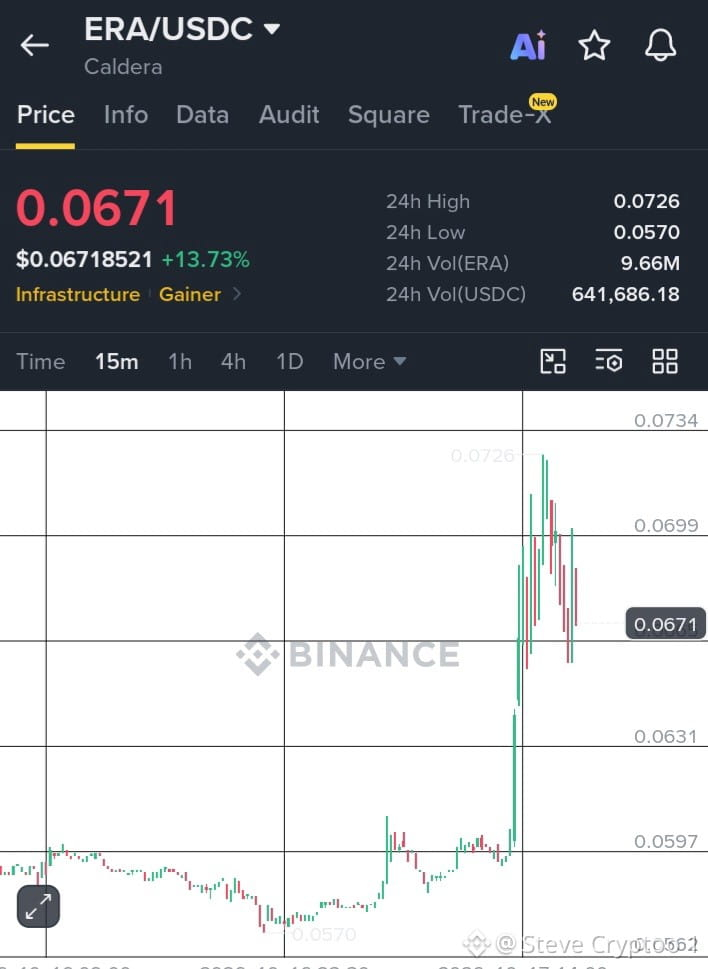
$ERA демонструє вражаючий бичачий імпульс, зростаючи на 13.73%, оскільки покупці штовхають ціну до $0.0671.
Після консолідації в діапазоні $0.0570–$0.0600 ERA здійснив потужний прорив і досяг внутрішньоденного максимуму $0.0726, перш ніж зіткнутися з тиском фіксації прибутку.
💰 Поточна ціна: $0.0671
📈 Зміна за 24 год: +13.73%
🔥 Максимум за 24 год: $0.0726
📉 Мінімум за 24 год: $0.0570
💎 Обсяг торгів: 9.66M ERA
Стійкий прорив вище $0.0699 може відкрити шлях до повторного тестування рівня $0.0726. Подолання цього рівня опору може посилити сценарій подальшого зростання.
Однак падіння нижче $0.0665 може спричинити глибше коригування в напрямку $0.0631.
Чи готуються бики до нового стрибка вгору, чи попереду перепочинок?
#Торгівля #Аналіз ціни BTC# #Макроогляд#
$ERA демонструє вражаючий бичачий імпульс, зростаючи на 13.73%, оскільки покупці штовхають ціну до $0.0671.
Після консолідації в діапазоні $0.0570–$0.0600 ERA здійснив потужний прорив і досяг внутрішньоденного максимуму $0.0726, перш ніж зіткнутися з тиском фіксації прибутку.
💰 Поточна ціна: $0.0671
📈 Зміна за 24 год: +13.73%
🔥 Максимум за 24 год: $0.0726
📉 Мінімум за 24 год: $0.0570
💎 Обсяг торгів: 9.66M ERA
Стійкий прорив вище $0.0699 може відкрити шлях до повторного тестування рівня $0.0726. Подолання цього рівня опору може посилити сценарій подальшого зростання.
Однак падіння нижче $0.0665 може спричинити глибше коригування в напрямку $0.0631.
Чи готуються бики до нового стрибка вгору, чи попереду перепочинок?
#Торгівля #Аналіз ціни BTC# #Макроогляд#
Після консолідації в діапазоні $0.0570–$0.0600 ERA здійснив потужний прорив і досяг внутрішньоденного максимуму $0.0726, перш ніж зіткнутися з тиском фіксації прибутку.
💰 Поточна ціна: $0.0671
📈 Зміна за 24 год: +13.73%
🔥 Максимум за 24 год: $0.0726
📉 Мінімум за 24 год: $0.0570
💎 Обсяг торгів: 9.66M ERA
Стійкий прорив вище $0.0699 може відкрити шлях до повторного тестування рівня $0.0726. Подолання цього рівня опору може посилити сценарій подальшого зростання.
Однак падіння нижче $0.0665 може спричинити глибше коригування в напрямку $0.0631.
Чи готуються бики до нового стрибка вгору, чи попереду перепочинок?
#Торгівля #Аналіз ціни BTC# #Макроогляд#
81
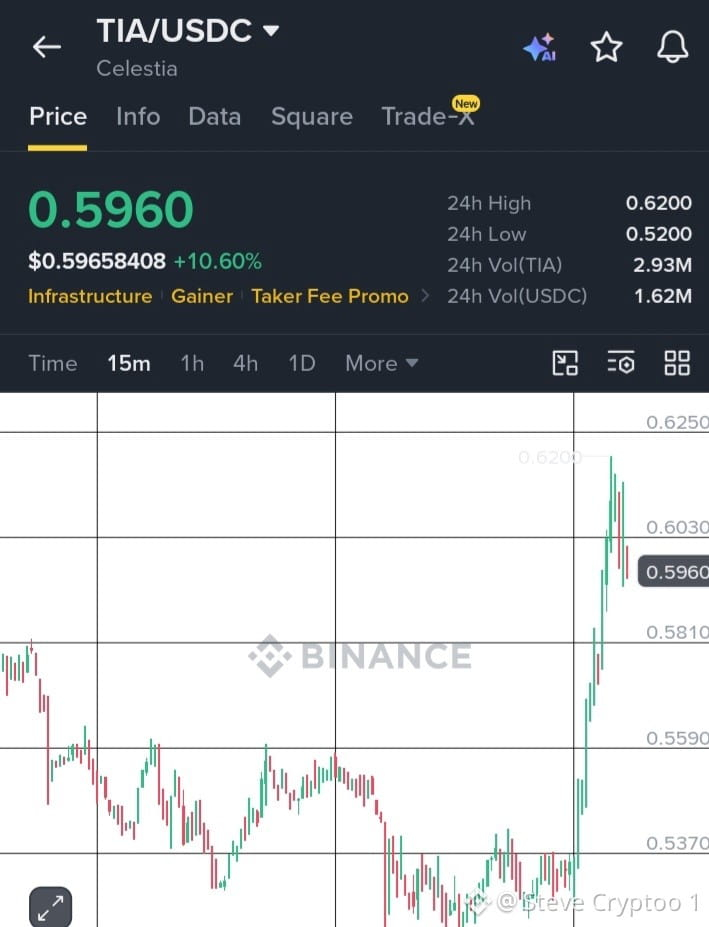
$TIA торгується на рівні $0.5960, піднявшись на 10.60% після потужного прориву на 15-хвилинному графіку.
📊 Ключові рівні, за якими варто стежити:
🟢 Опір: $0.6030 – $0.6200
🔵 Підтримка: $0.5810 – $0.5590
📈 Максимум за 24 год: $0.6200
🔥 Мінімум за 24 год: $0.520
Покупці перехопили контроль після сильного висхідного руху, але за таким стрімким зростанням може послідувати короткострокова консолідація.
Прорив вище $0.6200 може свідчити про подальше зростання, тоді як падіння нижче $0.5810 може вказувати на ослаблення імпульсу.
#АналізЦіниBTC# #МакроОгляд# #СезонАльткоїнів# #АльфаМемкоїнів# #BNBChain#
$TIA торгується на рівні $0.5960, піднявшись на 10.60% після потужного прориву на 15-хвилинному графіку.
📊 Ключові рівні, за якими варто стежити:
🟢 Опір: $0.6030 – $0.6200
🔵 Підтримка: $0.5810 – $0.5590
📈 Максимум за 24 год: $0.6200
🔥 Мінімум за 24 год: $0.520
Покупці перехопили контроль після сильного висхідного руху, але за таким стрімким зростанням може послідувати короткострокова консолідація.
Прорив вище $0.6200 може свідчити про подальше зростання, тоді як падіння нижче $0.5810 може вказувати на ослаблення імпульсу.
#АналізЦіниBTC# #МакроОгляд# #СезонАльткоїнів# #АльфаМемкоїнів# #BNBChain#
📊 Ключові рівні, за якими варто стежити:
🟢 Опір: $0.6030 – $0.6200
🔵 Підтримка: $0.5810 – $0.5590
📈 Максимум за 24 год: $0.6200
🔥 Мінімум за 24 год: $0.520
Покупці перехопили контроль після сильного висхідного руху, але за таким стрімким зростанням може послідувати короткострокова консолідація.
Прорив вище $0.6200 може свідчити про подальше зростання, тоді як падіння нижче $0.5810 може вказувати на ослаблення імпульсу.
#АналізЦіниBTC# #МакроОгляд# #СезонАльткоїнів# #АльфаМемкоїнів# #BNBChain#
73
Що, за прогнозами, чекає на крипторинок?
Polymarket пропонує ймовірності в реальному часі та настрої спільноти щодо майбутніх подій.
📊 Три активи, за якими варто стежити
₿ $BTC — Попереду нові максимуми?
⚡ $XRP — Прорив не за горами?
☀️ $SOL — Попереду подальше зростання?
Прогнози відображають настрої ринку, але не гарантують результатів.
За яким активом стежите ви: BTC, XRP чи SOL? 👇
@polymarket #Polymarket #Макроогляди# #Макроогляди#
Що, за прогнозами, чекає на крипторинок?
Polymarket пропонує ймовірності в реальному часі та настрої спільноти щодо майбутніх подій.
📊 Три активи, за якими варто стежити
₿ $BTC — Попереду нові максимуми?
⚡ $XRP — Прорив не за горами?
☀️ $SOL — Попереду подальше зростання?
Прогнози відображають настрої ринку, але не гарантують результатів.
За яким активом стежите ви: BTC, XRP чи SOL? 👇
@polymarket #Polymarket #Макроогляди# #Макроогляди#
Polymarket пропонує ймовірності в реальному часі та настрої спільноти щодо майбутніх подій.
📊 Три активи, за якими варто стежити
₿ $BTC — Попереду нові максимуми?
⚡ $XRP — Прорив не за горами?
☀️ $SOL — Попереду подальше зростання?
Прогнози відображають настрої ринку, але не гарантують результатів.
За яким активом стежите ви: BTC, XRP чи SOL? 👇
@polymarket #Polymarket #Макроогляди# #Макроогляди#

60
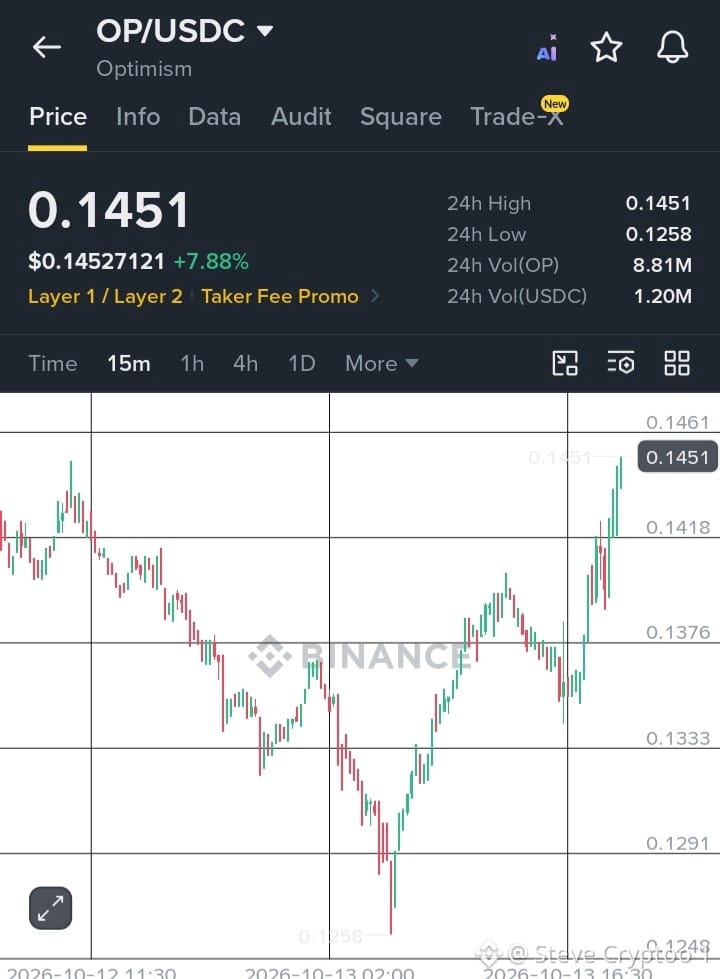
$OP зріс на 7.88% і коштує $0.1451, пробивши рівень $0.1418 на 15-хвилинному графіку.
🎯 Опір: $0.1461
🟢 Підтримка: $0.1418 / $0.1376
📈 Ціль: $0.1500, якщо імпульс збережеться.
Чи зможе $OP утримати пробій, чи продавці втрутяться? 👀
#АналізЦіниBTC# #Макроогляди# #СезонАльткоїнів# #АльфаМемкоїнів# #BNBChain#
$OP зріс на 7.88% і коштує $0.1451, пробивши рівень $0.1418 на 15-хвилинному графіку.
🎯 Опір: $0.1461
🟢 Підтримка: $0.1418 / $0.1376
📈 Ціль: $0.1500, якщо імпульс збережеться.
Чи зможе $OP утримати пробій, чи продавці втрутяться? 👀
#АналізЦіниBTC# #Макроогляди# #СезонАльткоїнів# #АльфаМемкоїнів# #BNBChain#
🎯 Опір: $0.1461
🟢 Підтримка: $0.1418 / $0.1376
📈 Ціль: $0.1500, якщо імпульс збережеться.
Чи зможе $OP утримати пробій, чи продавці втрутяться? 👀
#АналізЦіниBTC# #Макроогляди# #СезонАльткоїнів# #АльфаМемкоїнів# #BNBChain#
76
Увійдіть, щоб переглянути інший контент
Приєднуйтесь до користувачів криптовалют по всьому світу на Binance Square
⚡️ Отримуйте актуальну та корисну інформацію про криптовалюти.
💬 Приєднуйтесь до найбільшої у світі криптобіржі.
👍 Відкрийте справжні ідеї від перевірених авторів.
Електронна пошта / номер телефону
Трендові теми
fomcвідстеження
120,610 переглядів
538 обговорюють
#fomcвідстеження Жовтневий ІСЦ США у центрі уваги: ринки оцінюють перспективи підвищення ставок у грудні
Дані щодо інфляції у США, які мають оприлюднити наступного тижня, будуть під пильною увагою інвесторів, які оцінюватимуть, чи можуть стійкі цінові чинники спонукати Федеральну резервну систему знову підвищити процентні ставки у грудні. Водночас дедалі більші побоювання щодо інвестиційного буму у сфері ШІ та його потенційного впливу на економічне зростання додають невизначеності прогнозам щодо монетарної політики.$AAPLB
SergioDiaz
·1 вподобань
·124 переглядів
USPPIMissMayEaseBTCPressure
334,334 переглядів
2,403 обговорюють
USSpotXRPETFsSeeLargestWeeklyOutflowIn8Months
40,042 переглядів
429 обговорюють