

R3N 1
553 Публікації

R3N 1
Поскаржитись
Заблокувати користувача
Web3 & crypto Analyst || Breaking down market moves || token updates daily ➪NFA!!!
0 Підписки
3 Підписники
3 Вподобань
Публікації
·
--
Переглянути переклад
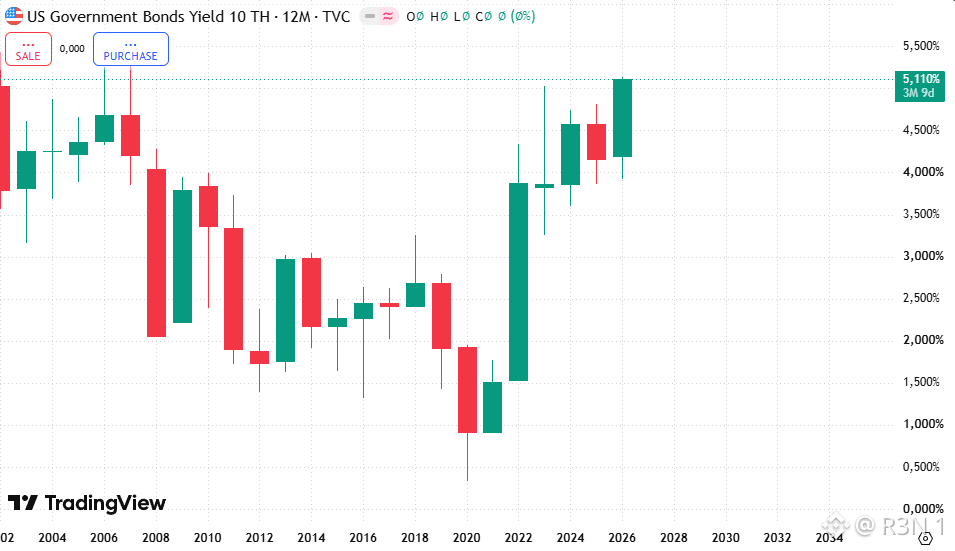
US Treasury yields have surged to the highest since 2007. The 10-year just made its sharpest one-day move in nearly 18 months, and it's happening the same week markets are pricing another Fed hike. That combination is the actual story, not the 2007 comparison alone. The 10-year climbed as high as 5.13% today, the highest since 2007, with the 30-year touching 5.4% and even the 5-year crossing 5% for the first time since before the financial crisis. Not an isolated spike either, yields already hit this same milestone eight days ago on September 15, retreated, and are now breaking fresh highs on top of that. What's driving today specifically is a stack of hawkish inputs landing together. Business activity data came in hotter than expected, the fastest pace in over five years per S&P Global, Fed governor Michael Barr said more hikes are needed, and oil pushed back above $103 a barrel. Trump backing a ban on US diesel exports added to supply concerns. Markets now price a 70% chance of another hike in October. Worth separating structural from acute here. Treasury Secretary Bessent has defended the bond buyback program as limiting how much worse this could've been, and he's running a separate operation propping up the yen specifically to stop Japan selling US debt, which would push yields even higher. Real intervention already happening, not hypothetical. What stands out to me is the mortgage pass-through, the 30-year fixed rate jumped to 7.26% today, highest since January 2025. That's the mechanism connecting a bond market story to actual household costs, and it moves faster than most realize. The open question isn't whether the Fed hikes again in October, close to priced in already. It's whether Treasury's interventions can keep pace with a selloff that's moved this sharply twice in eight trading days, since propping up demand on the margin is a different scale of problem than a one-time spike. #BTC Price Analysis# $BTC #BTC Price Analysis# $XAUt #Meme Alpha#
US Treasury yields have surged to the highest since 2007. The 10-year just made its sharpest one-day move in nearly 18 months, and it's happening the same week markets are pricing another Fed hike. That combination is the actual story, not the 2007 comparison alone. The 10-year climbed as high as 5.13% today, the highest since 2007, with the 30-year touching 5.4% and even the 5-year crossing 5% for the first time since before the financial crisis. Not an isolated spike either, yields already hit this same milestone eight days ago on September 15, retreated, and are now breaking fresh highs on top of that. What's driving today specifically is a stack of hawkish inputs landing together. Business activity data came in hotter than expected, the fastest pace in over five years per S&P Global, Fed governor Michael Barr said more hikes are needed, and oil pushed back above $103 a barrel. Trump backing a ban on US diesel exports added to supply concerns. Markets now price a 70% chance of another hike in October. Worth separating structural from acute here. Treasury Secretary Bessent has defended the bond buyback program as limiting how much worse this could've been, and he's running a separate operation propping up the yen specifically to stop Japan selling US debt, which would push yields even higher. Real intervention already happening, not hypothetical. What stands out to me is the mortgage pass-through, the 30-year fixed rate jumped to 7.26% today, highest since January 2025. That's the mechanism connecting a bond market story to actual household costs, and it moves faster than most realize. The open question isn't whether the Fed hikes again in October, close to priced in already. It's whether Treasury's interventions can keep pace with a selloff that's moved this sharply twice in eight trading days, since propping up demand on the margin is a different scale of problem than a one-time spike. #BTC Price Analysis# $BTC #BTC Price Analysis# $XAUt #Meme Alpha#
24
·
--
Переглянути переклад
BTC is actually down 2.88% today , moving in that direction rather than away from it. Worth updating the read on that alone.
Max pain theory holds that price gravitates toward the strike where the most option contracts expire worthless, benefiting sellers, as market makers hedge their books into expiry. It's a genuinely debated mechanic though, not a reliable predictive tool, and a $10,000 gap this large going in is unusual enough that I'd have treated the pull toward it as weak, until today's move.
What still argues against a full drag toward $75,000 specifically is the standing positioning. BTC call open interest sits at $9.61 billion against $6.52 billion in puts, a put to call ratio around 0.68, genuinely lopsided bullish, with the heaviest call concentration at $90,000 and $100,000, both well above current price. That's a book positioned for continuation, working against the max pain pull, not with it. Today's red candle doesn't erase that positioning, it just means price and options flow are pulling in opposite directions right now.
My honest read: this is genuinely two forces in tension, not a settled direction. Today's decline shows real downward pressure exists, but the option book itself is still betting heavily on upside above $90,000. Large expiries tend to produce real volatility as positions close or roll, the actual settlement direction isn't decided by either force alone.
What I'm watching: whether this pullback continues toward max pain into Friday, or whether it's a temporary dip inside a book still positioned for $90,000 and higher.
$BTC #Bitcoin Price Prediction: What is Bitcoins next move?#
BTC is actually down 2.88% today , moving in that direction rather than away from it. Worth updating the read on that alone.
Max pain theory holds that price gravitates toward the strike where the most option contracts expire worthless, benefiting sellers, as market makers hedge their books into expiry. It's a genuinely debated mechanic though, not a reliable predictive tool, and a $10,000 gap this large going in is unusual enough that I'd have treated the pull toward it as weak, until today's move.
What still argues against a full drag toward $75,000 specifically is the standing positioning. BTC call open interest sits at $9.61 billion against $6.52 billion in puts, a put to call ratio around 0.68, genuinely lopsided bullish, with the heaviest call concentration at $90,000 and $100,000, both well above current price. That's a book positioned for continuation, working against the max pain pull, not with it. Today's red candle doesn't erase that positioning, it just means price and options flow are pulling in opposite directions right now.
My honest read: this is genuinely two forces in tension, not a settled direction. Today's decline shows real downward pressure exists, but the option book itself is still betting heavily on upside above $90,000. Large expiries tend to produce real volatility as positions close or roll, the actual settlement direction isn't decided by either force alone.
What I'm watching: whether this pullback continues toward max pain into Friday, or whether it's a temporary dip inside a book still positioned for $90,000 and higher.
$BTC #Bitcoin Price Prediction: What is Bitcoins next move?#
Max pain theory holds that price gravitates toward the strike where the most option contracts expire worthless, benefiting sellers, as market makers hedge their books into expiry. It's a genuinely debated mechanic though, not a reliable predictive tool, and a $10,000 gap this large going in is unusual enough that I'd have treated the pull toward it as weak, until today's move.
What still argues against a full drag toward $75,000 specifically is the standing positioning. BTC call open interest sits at $9.61 billion against $6.52 billion in puts, a put to call ratio around 0.68, genuinely lopsided bullish, with the heaviest call concentration at $90,000 and $100,000, both well above current price. That's a book positioned for continuation, working against the max pain pull, not with it. Today's red candle doesn't erase that positioning, it just means price and options flow are pulling in opposite directions right now.
My honest read: this is genuinely two forces in tension, not a settled direction. Today's decline shows real downward pressure exists, but the option book itself is still betting heavily on upside above $90,000. Large expiries tend to produce real volatility as positions close or roll, the actual settlement direction isn't decided by either force alone.
What I'm watching: whether this pullback continues toward max pain into Friday, or whether it's a temporary dip inside a book still positioned for $90,000 and higher.
$BTC #Bitcoin Price Prediction: What is Bitcoins next move?#
34
·
--
Переглянути переклад
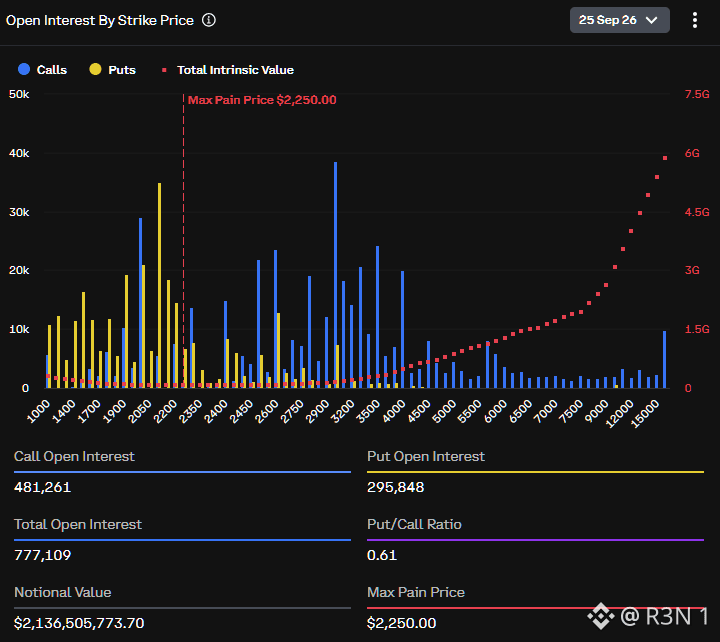
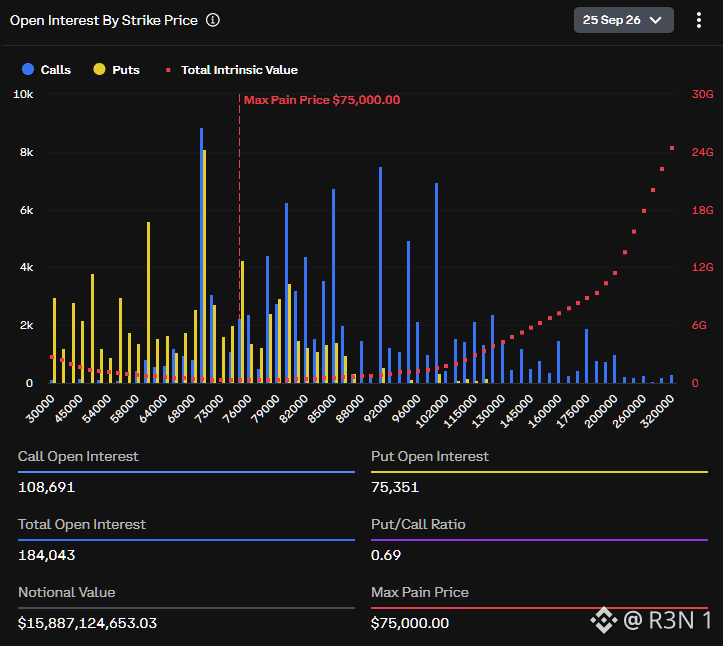
$18.1 billion in BTC and ETH options expire Friday, and BTC is trading nearly $11,000 above the max pain level tied to this event. Worth flagging that gap directly, if max pain is genuinely $75,000 while spot sits at $86,000 plus, that's an unusually wide dislocation, and I'd want that number confirmed before treating it as settled.
The scale itself checks out cleanly. Deribit data puts BTC open interest at $16.13 billion, ETH at $2.16 billion, lining up with Coinbase's own $18.1 billion combined estimate. Positioning is genuinely lopsided toward calls, BTC call open interest sits at $9.61 billion against $6.52 billion in puts, a put to call ratio around 0.68, and that skew has reportedly gotten more pronounced in recent flow, not just the standing book. Call concentration is heaviest at $90,000 and $100,000 on BTC, spread between $3,000 and $4,000 on ETH.
What that positioning tells you matters more than the dollar figure. A call heavy book with strikes clustered above current price reflects traders betting on continuation, not necessarily predicting it. Max pain theory suggests price gravitates toward the strike where the most contracts expire worthless, benefiting option sellers, but it's a debated mechanic, not guaranteed, and large expiries typically bring real volatility as positions get closed or rolled rather than a clean pin to one level.
My honest read: the size and directional skew here are real and well documented, genuine bullish positioning heading into Friday. But I'd want that $75,000 max pain figure specifically verified before repeating it, since it doesn't reconcile with where BTC is actually trading right now.
What I'm watching: how price behaves relative to the $90,000 strike specifically as Friday's settlement approaches, since that's where the heaviest call concentration actually sits.
$BTC #BTC Price Analysis# #Altcoin Season# $ETH
$18.1 billion in BTC and ETH options expire Friday, and BTC is trading nearly $11,000 above the max pain level tied to this event. Worth flagging that gap directly, if max pain is genuinely $75,000 while spot sits at $86,000 plus, that's an unusually wide dislocation, and I'd want that number confirmed before treating it as settled.
The scale itself checks out cleanly. Deribit data puts BTC open interest at $16.13 billion, ETH at $2.16 billion, lining up with Coinbase's own $18.1 billion combined estimate. Positioning is genuinely lopsided toward calls, BTC call open interest sits at $9.61 billion against $6.52 billion in puts, a put to call ratio around 0.68, and that skew has reportedly gotten more pronounced in recent flow, not just the standing book. Call concentration is heaviest at $90,000 and $100,000 on BTC, spread between $3,000 and $4,000 on ETH.
What that positioning tells you matters more than the dollar figure. A call heavy book with strikes clustered above current price reflects traders betting on continuation, not necessarily predicting it. Max pain theory suggests price gravitates toward the strike where the most contracts expire worthless, benefiting option sellers, but it's a debated mechanic, not guaranteed, and large expiries typically bring real volatility as positions get closed or rolled rather than a clean pin to one level.
My honest read: the size and directional skew here are real and well documented, genuine bullish positioning heading into Friday. But I'd want that $75,000 max pain figure specifically verified before repeating it, since it doesn't reconcile with where BTC is actually trading right now.
What I'm watching: how price behaves relative to the $90,000 strike specifically as Friday's settlement approaches, since that's where the heaviest call concentration actually sits.
$BTC #BTC Price Analysis# #Altcoin Season# $ETH
The scale itself checks out cleanly. Deribit data puts BTC open interest at $16.13 billion, ETH at $2.16 billion, lining up with Coinbase's own $18.1 billion combined estimate. Positioning is genuinely lopsided toward calls, BTC call open interest sits at $9.61 billion against $6.52 billion in puts, a put to call ratio around 0.68, and that skew has reportedly gotten more pronounced in recent flow, not just the standing book. Call concentration is heaviest at $90,000 and $100,000 on BTC, spread between $3,000 and $4,000 on ETH.
What that positioning tells you matters more than the dollar figure. A call heavy book with strikes clustered above current price reflects traders betting on continuation, not necessarily predicting it. Max pain theory suggests price gravitates toward the strike where the most contracts expire worthless, benefiting option sellers, but it's a debated mechanic, not guaranteed, and large expiries typically bring real volatility as positions get closed or rolled rather than a clean pin to one level.
My honest read: the size and directional skew here are real and well documented, genuine bullish positioning heading into Friday. But I'd want that $75,000 max pain figure specifically verified before repeating it, since it doesn't reconcile with where BTC is actually trading right now.
What I'm watching: how price behaves relative to the $90,000 strike specifically as Friday's settlement approaches, since that's where the heaviest call concentration actually sits.
$BTC #BTC Price Analysis# #Altcoin Season# $ETH
53
·
--
Переглянути переклад
BlackRock just published a paper arguing AI could be an underappreciated demand driver for crypto, more specific than the headline suggests. Worth flagging first, couldn't find the "$15 trillion" figure or "MASSIVE demand engine" language anywhere in actual coverage, that framing doesn't appear to come from BlackRock itself.
The paper, "The Machine-Native Economy," released September 22, splits into two real threads. First is machine-to-machine payments, as AI agents transact autonomously, buying data, APIs, compute continuously, traditional rails struggle with sub-cent, 24/7 settlement, and stablecoins are structurally better suited. They cite over $11 trillion in adjusted stablecoin volume in 2025 as the existing base, plus real emerging protocols, x402, Stripe/Tempo's Machine Payments Protocol, Stripe/OpenAI's Agentic Commerce Protocol.
Second thread is compute as a tokenizable asset, GPU access as transferable contracts, usable as collateral, tradeable through protocols like MCP and A2A. The $1.1 trillion figure is projected hyperscaler cloud revenue by 2030, a 29% CAGR off 2025 levels, addressable market size, not a crypto-specific number.
What stands out to me is BlackRock's own caveat, tokenization doesn't remove existing requirements, KYC, AML, eligibility rules still apply on-chain. A real hedge against readings that this bypasses regulation.
Worth being direct about the speculative distance here. This is a framework paper, not evidence any of this is happening at scale. Even BlackRock's own framing stays at "could," not "is."
The open question isn't whether AI agents eventually need payment rails, that logic holds. It's whether stablecoins and tokenized compute become the dominant rail, or traditional finance adapts fast enough that crypto isn't necessary to capture this demand.
$BTC #BTC Price Analysis# #Altcoin Season# $ETH
BlackRock just published a paper arguing AI could be an underappreciated demand driver for crypto, more specific than the headline suggests. Worth flagging first, couldn't find the "$15 trillion" figure or "MASSIVE demand engine" language anywhere in actual coverage, that framing doesn't appear to come from BlackRock itself.
The paper, "The Machine-Native Economy," released September 22, splits into two real threads. First is machine-to-machine payments, as AI agents transact autonomously, buying data, APIs, compute continuously, traditional rails struggle with sub-cent, 24/7 settlement, and stablecoins are structurally better suited. They cite over $11 trillion in adjusted stablecoin volume in 2025 as the existing base, plus real emerging protocols, x402, Stripe/Tempo's Machine Payments Protocol, Stripe/OpenAI's Agentic Commerce Protocol.
Second thread is compute as a tokenizable asset, GPU access as transferable contracts, usable as collateral, tradeable through protocols like MCP and A2A. The $1.1 trillion figure is projected hyperscaler cloud revenue by 2030, a 29% CAGR off 2025 levels, addressable market size, not a crypto-specific number.
What stands out to me is BlackRock's own caveat, tokenization doesn't remove existing requirements, KYC, AML, eligibility rules still apply on-chain. A real hedge against readings that this bypasses regulation.
Worth being direct about the speculative distance here. This is a framework paper, not evidence any of this is happening at scale. Even BlackRock's own framing stays at "could," not "is."
The open question isn't whether AI agents eventually need payment rails, that logic holds. It's whether stablecoins and tokenized compute become the dominant rail, or traditional finance adapts fast enough that crypto isn't necessary to capture this demand.
$BTC #BTC Price Analysis# #Altcoin Season# $ETH
The paper, "The Machine-Native Economy," released September 22, splits into two real threads. First is machine-to-machine payments, as AI agents transact autonomously, buying data, APIs, compute continuously, traditional rails struggle with sub-cent, 24/7 settlement, and stablecoins are structurally better suited. They cite over $11 trillion in adjusted stablecoin volume in 2025 as the existing base, plus real emerging protocols, x402, Stripe/Tempo's Machine Payments Protocol, Stripe/OpenAI's Agentic Commerce Protocol.
Second thread is compute as a tokenizable asset, GPU access as transferable contracts, usable as collateral, tradeable through protocols like MCP and A2A. The $1.1 trillion figure is projected hyperscaler cloud revenue by 2030, a 29% CAGR off 2025 levels, addressable market size, not a crypto-specific number.
What stands out to me is BlackRock's own caveat, tokenization doesn't remove existing requirements, KYC, AML, eligibility rules still apply on-chain. A real hedge against readings that this bypasses regulation.
Worth being direct about the speculative distance here. This is a framework paper, not evidence any of this is happening at scale. Even BlackRock's own framing stays at "could," not "is."
The open question isn't whether AI agents eventually need payment rails, that logic holds. It's whether stablecoins and tokenized compute become the dominant rail, or traditional finance adapts fast enough that crypto isn't necessary to capture this demand.
$BTC #BTC Price Analysis# #Altcoin Season# $ETH

69
·
--
Переглянути переклад
$1,500 signup fee, $500 a month, and an AI analyst that reads a hacked inbox to figure out exactly which employee controls the money. That's the actual product EvilTokens was selling, not a phishing kit with AI bolted on, the AI was the business model itself.
This is Microsoft DCU's 40th court-authorized disruption in nearly two decades, but the first specifically against an end-to-end AI-enabled cybercrime service, a real distinction, not just a bigger case number. EvilTokens launched in February 2026 and compromised over 12,000 inboxes across more than 10,000 organizations, hitting wholesale distribution, construction, financial services, real estate, healthcare, and higher education across the US, UK, Canada, Australia, India, and France. It abused Microsoft's OAuth 2.0 device code login flow to steal session tokens directly, bypassing passwords and MFA entirely.
Coinbase's role was tracing the money. Its threat team traced roughly $1.1 million in revenue across four Tron addresses between October 2025 and June 2026, over 1,000 deposits from more than 700 distinct sources. That trail fed the federal court order, 50 websites seized, more than 175 domains disabled. Two men, 32 and 38, were arrested by London's Met Police on September 11, released on bail pending forensic examination.
What stands out to me is the coalition size, Cloudflare, OpenAI, TRM Labs, Health-ISAC, Shadowserver, SpyCloud and Railway all contributed alongside Microsoft and Coinbase. A genuinely broad response to a threat model that's now public knowledge and easy to copy.
What I'm watching: whether similar AI-driven, device-code-exploiting services start appearing now that EvilTokens proved the model works, and how fast platforms tighten device code flow defenses in response.
$BTC #BTC Price Analysis# #Meme Alpha# #BNBChain# $COIN
$1,500 signup fee, $500 a month, and an AI analyst that reads a hacked inbox to figure out exactly which employee controls the money. That's the actual product EvilTokens was selling, not a phishing kit with AI bolted on, the AI was the business model itself.
This is Microsoft DCU's 40th court-authorized disruption in nearly two decades, but the first specifically against an end-to-end AI-enabled cybercrime service, a real distinction, not just a bigger case number. EvilTokens launched in February 2026 and compromised over 12,000 inboxes across more than 10,000 organizations, hitting wholesale distribution, construction, financial services, real estate, healthcare, and higher education across the US, UK, Canada, Australia, India, and France. It abused Microsoft's OAuth 2.0 device code login flow to steal session tokens directly, bypassing passwords and MFA entirely.
Coinbase's role was tracing the money. Its threat team traced roughly $1.1 million in revenue across four Tron addresses between October 2025 and June 2026, over 1,000 deposits from more than 700 distinct sources. That trail fed the federal court order, 50 websites seized, more than 175 domains disabled. Two men, 32 and 38, were arrested by London's Met Police on September 11, released on bail pending forensic examination.
What stands out to me is the coalition size, Cloudflare, OpenAI, TRM Labs, Health-ISAC, Shadowserver, SpyCloud and Railway all contributed alongside Microsoft and Coinbase. A genuinely broad response to a threat model that's now public knowledge and easy to copy.
What I'm watching: whether similar AI-driven, device-code-exploiting services start appearing now that EvilTokens proved the model works, and how fast platforms tighten device code flow defenses in response.
$BTC #BTC Price Analysis# #Meme Alpha# #BNBChain# $COIN
This is Microsoft DCU's 40th court-authorized disruption in nearly two decades, but the first specifically against an end-to-end AI-enabled cybercrime service, a real distinction, not just a bigger case number. EvilTokens launched in February 2026 and compromised over 12,000 inboxes across more than 10,000 organizations, hitting wholesale distribution, construction, financial services, real estate, healthcare, and higher education across the US, UK, Canada, Australia, India, and France. It abused Microsoft's OAuth 2.0 device code login flow to steal session tokens directly, bypassing passwords and MFA entirely.
Coinbase's role was tracing the money. Its threat team traced roughly $1.1 million in revenue across four Tron addresses between October 2025 and June 2026, over 1,000 deposits from more than 700 distinct sources. That trail fed the federal court order, 50 websites seized, more than 175 domains disabled. Two men, 32 and 38, were arrested by London's Met Police on September 11, released on bail pending forensic examination.
What stands out to me is the coalition size, Cloudflare, OpenAI, TRM Labs, Health-ISAC, Shadowserver, SpyCloud and Railway all contributed alongside Microsoft and Coinbase. A genuinely broad response to a threat model that's now public knowledge and easy to copy.
What I'm watching: whether similar AI-driven, device-code-exploiting services start appearing now that EvilTokens proved the model works, and how fast platforms tighten device code flow defenses in response.
$BTC #BTC Price Analysis# #Meme Alpha# #BNBChain# $COIN

·
--
Переглянути переклад
NEAR is the clearest case of a real, specific catalyst. It launched confidential perpetual futures on September 17, powered by Hyperliquid's execution engine, letting traders open positions without publicly linking them to their accounts. That product pulled in $70 million in TVL and triggered a genuine incentive mechanism around a $3.33 threshold. NEAR's recent strength traces to a shipped feature with measurable usage, not just sentiment.
XRP's story is different, largely a catalyst still pending rather than one that's landed. XRP/BTC sits roughly 48% below its January 2025 high and has underperformed BTC across most of 2026, with August the one real exception, a 30% monthly gain against BTC's 25%. The driver analysts keep pointing to is the CLARITY Act, still unresolved after the Senate cloture failure, plus a documented seasonal pattern where XRP has historically averaged 17% gains in September specifically. A real historical tendency, not the same as a confirmed fundamental shift.
DOGE and BCH are the ones I'd treat with the most skepticism. I don't have a specific catalyst tied to either right now, no product launch, no regulatory event, nothing structurally new. That pattern, moving alongside a broad risk on rally without an asset specific driver, is usually beta, price following BTC's strength rather than independent demand.
My honest read: NEAR's move has real substance behind it, XRP's has a plausible but unconfirmed catalyst plus real seasonality, and DOGE and BCH look like they're mostly along for the ride on broader market strength.
What I'm watching: whether NEAR holds its gains once the incentive mechanism clears, and whether XRP actually gets a CLARITY catalyst or ends up relying purely on September seasonality to hold these gains.
#BTC Price Analysis# #Meme Alpha# $XRP $NEAR
NEAR is the clearest case of a real, specific catalyst. It launched confidential perpetual futures on September 17, powered by Hyperliquid's execution engine, letting traders open positions without publicly linking them to their accounts. That product pulled in $70 million in TVL and triggered a genuine incentive mechanism around a $3.33 threshold. NEAR's recent strength traces to a shipped feature with measurable usage, not just sentiment.
XRP's story is different, largely a catalyst still pending rather than one that's landed. XRP/BTC sits roughly 48% below its January 2025 high and has underperformed BTC across most of 2026, with August the one real exception, a 30% monthly gain against BTC's 25%. The driver analysts keep pointing to is the CLARITY Act, still unresolved after the Senate cloture failure, plus a documented seasonal pattern where XRP has historically averaged 17% gains in September specifically. A real historical tendency, not the same as a confirmed fundamental shift.
DOGE and BCH are the ones I'd treat with the most skepticism. I don't have a specific catalyst tied to either right now, no product launch, no regulatory event, nothing structurally new. That pattern, moving alongside a broad risk on rally without an asset specific driver, is usually beta, price following BTC's strength rather than independent demand.
My honest read: NEAR's move has real substance behind it, XRP's has a plausible but unconfirmed catalyst plus real seasonality, and DOGE and BCH look like they're mostly along for the ride on broader market strength.
What I'm watching: whether NEAR holds its gains once the incentive mechanism clears, and whether XRP actually gets a CLARITY catalyst or ends up relying purely on September seasonality to hold these gains.
#BTC Price Analysis# #Meme Alpha# $XRP $NEAR
XRP's story is different, largely a catalyst still pending rather than one that's landed. XRP/BTC sits roughly 48% below its January 2025 high and has underperformed BTC across most of 2026, with August the one real exception, a 30% monthly gain against BTC's 25%. The driver analysts keep pointing to is the CLARITY Act, still unresolved after the Senate cloture failure, plus a documented seasonal pattern where XRP has historically averaged 17% gains in September specifically. A real historical tendency, not the same as a confirmed fundamental shift.
DOGE and BCH are the ones I'd treat with the most skepticism. I don't have a specific catalyst tied to either right now, no product launch, no regulatory event, nothing structurally new. That pattern, moving alongside a broad risk on rally without an asset specific driver, is usually beta, price following BTC's strength rather than independent demand.
My honest read: NEAR's move has real substance behind it, XRP's has a plausible but unconfirmed catalyst plus real seasonality, and DOGE and BCH look like they're mostly along for the ride on broader market strength.
What I'm watching: whether NEAR holds its gains once the incentive mechanism clears, and whether XRP actually gets a CLARITY catalyst or ends up relying purely on September seasonality to hold these gains.
#BTC Price Analysis# #Meme Alpha# $XRP $NEAR
12
·
--
Переглянути переклад
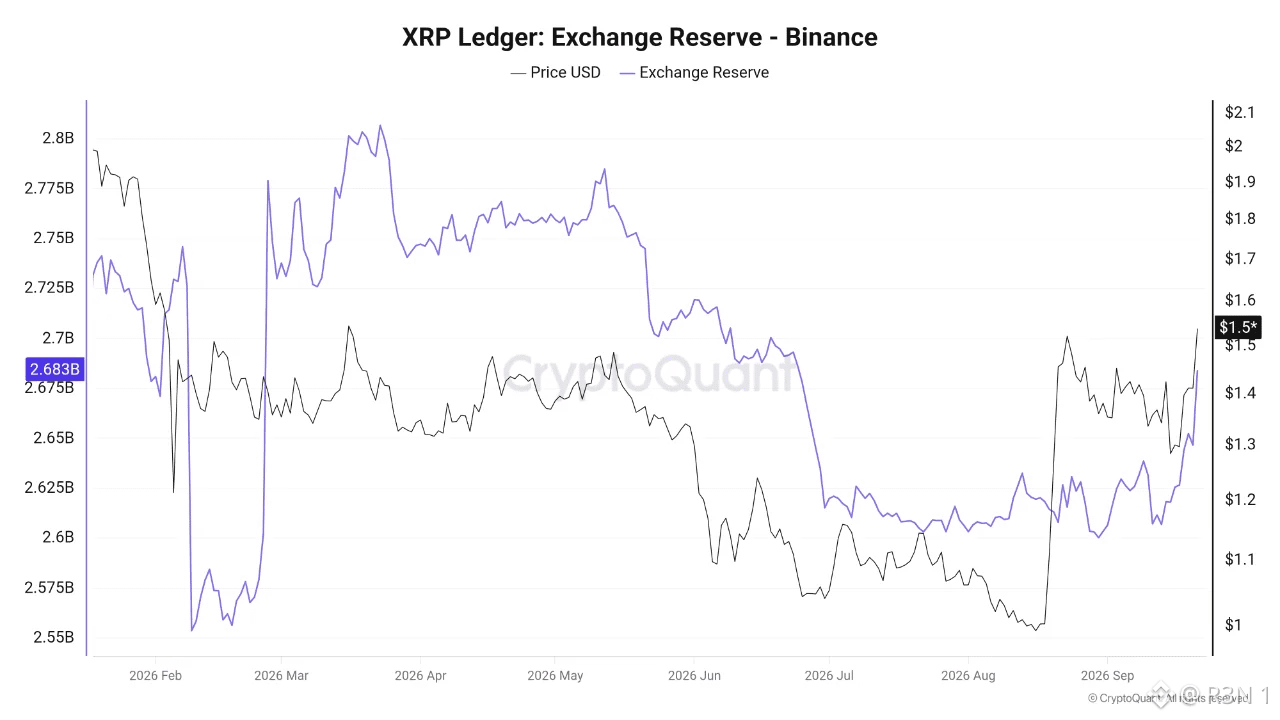
XRP Reserves on Binance Rise to a 3-Month High
Data indicates that XRP reserves on Binance have recently risen to approximately 2.68 billion XRP, coinciding with the price trading near the $1.50 mark. According to the data, reserves have reached their highest level since last June a notable shift following a period of decline observed in previous months.
This increase implies that a larger volume of $XRP is now held on Binance, thereby making a greater portion of the supply available for spot trading on the platform. This movement is particularly significant when compared with the reserve’s recent trajectory, as XRP balances had previously experienced a marked decline before gradually recovering in recent weeks.
From a market dynamics perspective, a rise in reserves does not necessarily mean that XRP holders are preparing for an immediate sell-off; rather, it reflects an increase in the volume of coins held within the trading ecosystem, providing traders with greater liquidity. Consequently, if reserve levels continue to rise alongside increased trading volumes or inflows, this trend could become a significant factor in short-term supply pressure.
Should reserves continue to climb in the coming days, it could signal a gradual shift of a larger portion of XRP onto exchanges, a development worth monitoring alongside net flows, trading volume, and price action. #BTC Price Analysis# #Altcoin Season# #Meme Alpha#
XRP Reserves on Binance Rise to a 3-Month High
Data indicates that XRP reserves on Binance have recently risen to approximately 2.68 billion XRP, coinciding with the price trading near the $1.50 mark. According to the data, reserves have reached their highest level since last June a notable shift following a period of decline observed in previous months.
This increase implies that a larger volume of $XRP is now held on Binance, thereby making a greater portion of the supply available for spot trading on the platform. This movement is particularly significant when compared with the reserve’s recent trajectory, as XRP balances had previously experienced a marked decline before gradually recovering in recent weeks.
From a market dynamics perspective, a rise in reserves does not necessarily mean that XRP holders are preparing for an immediate sell-off; rather, it reflects an increase in the volume of coins held within the trading ecosystem, providing traders with greater liquidity. Consequently, if reserve levels continue to rise alongside increased trading volumes or inflows, this trend could become a significant factor in short-term supply pressure.
Should reserves continue to climb in the coming days, it could signal a gradual shift of a larger portion of XRP onto exchanges, a development worth monitoring alongside net flows, trading volume, and price action. #BTC Price Analysis# #Altcoin Season# #Meme Alpha#
Data indicates that XRP reserves on Binance have recently risen to approximately 2.68 billion XRP, coinciding with the price trading near the $1.50 mark. According to the data, reserves have reached their highest level since last June a notable shift following a period of decline observed in previous months.
This increase implies that a larger volume of $XRP is now held on Binance, thereby making a greater portion of the supply available for spot trading on the platform. This movement is particularly significant when compared with the reserve’s recent trajectory, as XRP balances had previously experienced a marked decline before gradually recovering in recent weeks.
From a market dynamics perspective, a rise in reserves does not necessarily mean that XRP holders are preparing for an immediate sell-off; rather, it reflects an increase in the volume of coins held within the trading ecosystem, providing traders with greater liquidity. Consequently, if reserve levels continue to rise alongside increased trading volumes or inflows, this trend could become a significant factor in short-term supply pressure.
Should reserves continue to climb in the coming days, it could signal a gradual shift of a larger portion of XRP onto exchanges, a development worth monitoring alongside net flows, trading volume, and price action. #BTC Price Analysis# #Altcoin Season# #Meme Alpha#
·
--
Переглянути переклад
Token graduation on TON is one of the most misunderstood mechanics in the ecosystem. Most people know it means a token moves from a bonding curve to a DEX. Few understand what actually happens at each step and why the automation matters. Four major launchpads on TON now route graduated tokens to STONfi, Grambo, Gram Store, Quantum Club, and Stonks. Each has slightly different mechanics but the graduation pipeline follows the same structure. Phase one is the bonding curve. The token launches with a price determined by a mathematical formula based on current supply. Each purchase increases the price automatically. The curve collects the purchase capital into a reserve. No order book. No market makers. The formula is the market. Phase two is the graduation threshold. When the token hits a defined milestone — a specific capital raised amount or token supply sold, the graduation event triggers automatically. No team intervention required. The protocol handles it. Phase three is the liquidity migration. The reserve capital collected during the bonding curve phase moves into a STONfi V2 pool. The token is now tradeable on a standard AMM DEX rather than through the bonding curve. Price discovery transitions from the formula to the market. Phase four is the LP token lock. On Gram Store the LP tokens representing the migrated liquidity lock for six to twelve months. The team cannot remove the liquidity they raised during this period. This is the mechanism that addresses the most common token launch failure mode, teams extracting liquidity immediately after graduation while holders are left with an illiquid position. Every successful graduation on any of these four launchpads brings new liquidity and new trading pairs to STONfi automatically. The pipeline compounds STONfi's pool depth continuously without requiring manual listing decisions. Explore STONfi pools → https://app.ston.fi/pools #BTC Price Analysis# $BTC #Altcoin Season# $ETH
Token graduation on TON is one of the most misunderstood mechanics in the ecosystem. Most people know it means a token moves from a bonding curve to a DEX. Few understand what actually happens at each step and why the automation matters. Four major launchpads on TON now route graduated tokens to STONfi, Grambo, Gram Store, Quantum Club, and Stonks. Each has slightly different mechanics but the graduation pipeline follows the same structure. Phase one is the bonding curve. The token launches with a price determined by a mathematical formula based on current supply. Each purchase increases the price automatically. The curve collects the purchase capital into a reserve. No order book. No market makers. The formula is the market. Phase two is the graduation threshold. When the token hits a defined milestone — a specific capital raised amount or token supply sold, the graduation event triggers automatically. No team intervention required. The protocol handles it. Phase three is the liquidity migration. The reserve capital collected during the bonding curve phase moves into a STONfi V2 pool. The token is now tradeable on a standard AMM DEX rather than through the bonding curve. Price discovery transitions from the formula to the market. Phase four is the LP token lock. On Gram Store the LP tokens representing the migrated liquidity lock for six to twelve months. The team cannot remove the liquidity they raised during this period. This is the mechanism that addresses the most common token launch failure mode, teams extracting liquidity immediately after graduation while holders are left with an illiquid position. Every successful graduation on any of these four launchpads brings new liquidity and new trading pairs to STONfi automatically. The pipeline compounds STONfi's pool depth continuously without requiring manual listing decisions. Explore STONfi pools → https://app.ston.fi/pools #BTC Price Analysis# $BTC #Altcoin Season# $ETH
18
·
--
Переглянути переклад
China imported more gold through August than in all of 2025, and the price context behind it is the counterintuitive part.
Falling international gold prices and a strengthening yuan are the two drivers Bloomberg's citing, not a fear-driven flight to safety. That matters because it means Chinese buyers are treating dips as buying opportunities on cheaper terms, a stronger currency making imports relatively less expensive, rather than piling in during a panic.
What stands out to me is the trajectory this caps off. Imports ran about 692 tons through May, already up 76% year over year at that point. May alone hit 163 tons, the strongest single month since March 2024. This isn't a sudden late-year surge, it's been building consistently across the entire year, and crossing 1,000 tons by August means the pace has held or accelerated through summer rather than fading.
Worth separating retail from official reserves here, since the framing tends to blur them. This 1,000-ton figure is customs import data, commercial and retail-driven bullion flow, distinct from the PBoC's own sovereign reserve additions, which sat around 2,331 tons as of May through separate central bank purchases. Both are rising, but they're different buyers with different motivations, one is households and jewelers, the other is monetary policy.
An analyst quoted in the piece noted domestic prices are holding a slight premium to world benchmarks, which is what's actually pulling imports in, strong enough local demand that gold costs more inside China than outside it, creating an incentive to bring more in.
The open question is whether this pace holds into Q4. A yuan that weakens again or a rebound in international gold prices would remove both tailwinds simultaneously, and this kind of import surge has cooled before once the price and currency setup that enabled it shifted.
#Macro Insights# #BTC Price Analysis# $BTC
$XAUt
China imported more gold through August than in all of 2025, and the price context behind it is the counterintuitive part.
Falling international gold prices and a strengthening yuan are the two drivers Bloomberg's citing, not a fear-driven flight to safety. That matters because it means Chinese buyers are treating dips as buying opportunities on cheaper terms, a stronger currency making imports relatively less expensive, rather than piling in during a panic.
What stands out to me is the trajectory this caps off. Imports ran about 692 tons through May, already up 76% year over year at that point. May alone hit 163 tons, the strongest single month since March 2024. This isn't a sudden late-year surge, it's been building consistently across the entire year, and crossing 1,000 tons by August means the pace has held or accelerated through summer rather than fading.
Worth separating retail from official reserves here, since the framing tends to blur them. This 1,000-ton figure is customs import data, commercial and retail-driven bullion flow, distinct from the PBoC's own sovereign reserve additions, which sat around 2,331 tons as of May through separate central bank purchases. Both are rising, but they're different buyers with different motivations, one is households and jewelers, the other is monetary policy.
An analyst quoted in the piece noted domestic prices are holding a slight premium to world benchmarks, which is what's actually pulling imports in, strong enough local demand that gold costs more inside China than outside it, creating an incentive to bring more in.
The open question is whether this pace holds into Q4. A yuan that weakens again or a rebound in international gold prices would remove both tailwinds simultaneously, and this kind of import surge has cooled before once the price and currency setup that enabled it shifted.
#Macro Insights# #BTC Price Analysis# $BTC
$XAUt
Falling international gold prices and a strengthening yuan are the two drivers Bloomberg's citing, not a fear-driven flight to safety. That matters because it means Chinese buyers are treating dips as buying opportunities on cheaper terms, a stronger currency making imports relatively less expensive, rather than piling in during a panic.
What stands out to me is the trajectory this caps off. Imports ran about 692 tons through May, already up 76% year over year at that point. May alone hit 163 tons, the strongest single month since March 2024. This isn't a sudden late-year surge, it's been building consistently across the entire year, and crossing 1,000 tons by August means the pace has held or accelerated through summer rather than fading.
Worth separating retail from official reserves here, since the framing tends to blur them. This 1,000-ton figure is customs import data, commercial and retail-driven bullion flow, distinct from the PBoC's own sovereign reserve additions, which sat around 2,331 tons as of May through separate central bank purchases. Both are rising, but they're different buyers with different motivations, one is households and jewelers, the other is monetary policy.
An analyst quoted in the piece noted domestic prices are holding a slight premium to world benchmarks, which is what's actually pulling imports in, strong enough local demand that gold costs more inside China than outside it, creating an incentive to bring more in.
The open question is whether this pace holds into Q4. A yuan that weakens again or a rebound in international gold prices would remove both tailwinds simultaneously, and this kind of import surge has cooled before once the price and currency setup that enabled it shifted.
#Macro Insights# #BTC Price Analysis# $BTC
$XAUt


36
·
--
Переглянути переклад
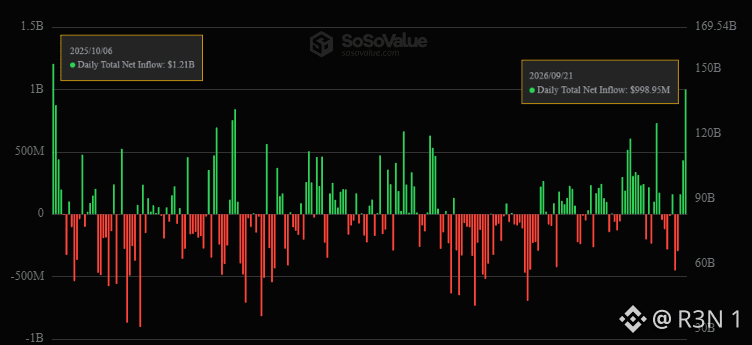
$999 million into Bitcoin ETFs in a single day, and the fund-level breakdown tells you this wasn't one whale allocator, it was broad institutional demand across multiple products at once.
IBIT led with $381.4 million, but ARKB pulled in $289.1 million and FBTC added $238.8 million, three separate issuers all drawing real size on the same day, plus smaller inflows across MSTR, BITB, GBTC and BTC. That's meaningfully different from a single-fund spike, it's demand spread across the entire product landscape simultaneously.
What stands out to me is the price action lining up almost too cleanly with the flow data. BTC above $86K and ETH above $2.7K, both eight-month highs, arriving the same day as the biggest ETF inflow in a year isn't coincidence, it's the mechanism working as designed, ETF buying converts directly into spot demand pressure on both assets.
Worth being precise about the comparison being drawn here though. October's inflow wave, the one this is being measured against, preceded the October 10 crash rather than causing strength that held. Big single-day inflows on their own haven't historically been the tell, what happened in the weeks after has mattered more. That's not a reason to discount today's number, just a reason not to treat one record day as confirmation of a trend by itself.
The open question isn't whether institutional demand showed up today, the fund-level data confirms it clearly did. It's whether this is the start of a sustained inflow run like the one that carried BTC from $63K to $78K over four weeks in August, or a single outsized day that cools fast the way some of September's earlier prints did after initial strength faded.
$BTC #BTC Price Analysis# #Altcoin Season# $ETH
$999 million into Bitcoin ETFs in a single day, and the fund-level breakdown tells you this wasn't one whale allocator, it was broad institutional demand across multiple products at once.
IBIT led with $381.4 million, but ARKB pulled in $289.1 million and FBTC added $238.8 million, three separate issuers all drawing real size on the same day, plus smaller inflows across MSTR, BITB, GBTC and BTC. That's meaningfully different from a single-fund spike, it's demand spread across the entire product landscape simultaneously.
What stands out to me is the price action lining up almost too cleanly with the flow data. BTC above $86K and ETH above $2.7K, both eight-month highs, arriving the same day as the biggest ETF inflow in a year isn't coincidence, it's the mechanism working as designed, ETF buying converts directly into spot demand pressure on both assets.
Worth being precise about the comparison being drawn here though. October's inflow wave, the one this is being measured against, preceded the October 10 crash rather than causing strength that held. Big single-day inflows on their own haven't historically been the tell, what happened in the weeks after has mattered more. That's not a reason to discount today's number, just a reason not to treat one record day as confirmation of a trend by itself.
The open question isn't whether institutional demand showed up today, the fund-level data confirms it clearly did. It's whether this is the start of a sustained inflow run like the one that carried BTC from $63K to $78K over four weeks in August, or a single outsized day that cools fast the way some of September's earlier prints did after initial strength faded.
$BTC #BTC Price Analysis# #Altcoin Season# $ETH
IBIT led with $381.4 million, but ARKB pulled in $289.1 million and FBTC added $238.8 million, three separate issuers all drawing real size on the same day, plus smaller inflows across MSTR, BITB, GBTC and BTC. That's meaningfully different from a single-fund spike, it's demand spread across the entire product landscape simultaneously.
What stands out to me is the price action lining up almost too cleanly with the flow data. BTC above $86K and ETH above $2.7K, both eight-month highs, arriving the same day as the biggest ETF inflow in a year isn't coincidence, it's the mechanism working as designed, ETF buying converts directly into spot demand pressure on both assets.
Worth being precise about the comparison being drawn here though. October's inflow wave, the one this is being measured against, preceded the October 10 crash rather than causing strength that held. Big single-day inflows on their own haven't historically been the tell, what happened in the weeks after has mattered more. That's not a reason to discount today's number, just a reason not to treat one record day as confirmation of a trend by itself.
The open question isn't whether institutional demand showed up today, the fund-level data confirms it clearly did. It's whether this is the start of a sustained inflow run like the one that carried BTC from $63K to $78K over four weeks in August, or a single outsized day that cools fast the way some of September's earlier prints did after initial strength faded.
$BTC #BTC Price Analysis# #Altcoin Season# $ETH
37
·
--
Переглянути переклад
STONfi's cross-chain network now covers ten chains. Choosing between them for any specific swap is a practical decision that most content never addresses clearly. Here is the framework I actually use.
The first question is what you need the assets for after arrival. This determines the destination chain more directly than any other factor. If you need to deploy into DeFi yield opportunities TRON and Ethereum have the deepest stablecoin liquidity.
If you need access to low-cost frequent transactions Base, BNB Chain, and Polygon are more economical. If you need tokenized stock exposure Robinhood Chain is the most purpose-built for that use case. If you need AI-agent-native infrastructure X Layer was designed for it.
The second question is source chain gas cost. Starting from TON means approximately $0.06 to $0.13 per transaction regardless of destination. Starting from Ethereum mainnet adds significant gas cost that changes the economics for smaller amounts. If your assets are distributed across multiple chains the starting chain choice affects total cost more than the route itself.
The third question is which stablecoin you hold and which is available at the destination. Each chain in the network has specific supported stablecoins. USDT on TON. USDT and USDC on Ethereum and BNB Chain. USDC and USDT0 on Arbitrum. PUSD and USDC on Polygon. USDG on Robinhood Chain. USDC and USDT0 on X Layer. Verify the live interface before confirming because supported assets update as the network evolves.
The fourth question is transaction size versus the current $1,000 per transaction limit on newer chain additions. For amounts above the limit multiple transactions are required.
These four questions answer the chain selection decision for most cross-chain moves.
Try cross-chain swaps →https://app.ston.fi/swap?mode=cross-chain
$BTC #BTC Price Analysis# #Altcoin Season# $PI
STONfi's cross-chain network now covers ten chains. Choosing between them for any specific swap is a practical decision that most content never addresses clearly. Here is the framework I actually use.
The first question is what you need the assets for after arrival. This determines the destination chain more directly than any other factor. If you need to deploy into DeFi yield opportunities TRON and Ethereum have the deepest stablecoin liquidity.
If you need access to low-cost frequent transactions Base, BNB Chain, and Polygon are more economical. If you need tokenized stock exposure Robinhood Chain is the most purpose-built for that use case. If you need AI-agent-native infrastructure X Layer was designed for it.
The second question is source chain gas cost. Starting from TON means approximately $0.06 to $0.13 per transaction regardless of destination. Starting from Ethereum mainnet adds significant gas cost that changes the economics for smaller amounts. If your assets are distributed across multiple chains the starting chain choice affects total cost more than the route itself.
The third question is which stablecoin you hold and which is available at the destination. Each chain in the network has specific supported stablecoins. USDT on TON. USDT and USDC on Ethereum and BNB Chain. USDC and USDT0 on Arbitrum. PUSD and USDC on Polygon. USDG on Robinhood Chain. USDC and USDT0 on X Layer. Verify the live interface before confirming because supported assets update as the network evolves.
The fourth question is transaction size versus the current $1,000 per transaction limit on newer chain additions. For amounts above the limit multiple transactions are required.
These four questions answer the chain selection decision for most cross-chain moves.
Try cross-chain swaps →https://app.ston.fi/swap?mode=cross-chain
$BTC #BTC Price Analysis# #Altcoin Season# $PI
The first question is what you need the assets for after arrival. This determines the destination chain more directly than any other factor. If you need to deploy into DeFi yield opportunities TRON and Ethereum have the deepest stablecoin liquidity.
If you need access to low-cost frequent transactions Base, BNB Chain, and Polygon are more economical. If you need tokenized stock exposure Robinhood Chain is the most purpose-built for that use case. If you need AI-agent-native infrastructure X Layer was designed for it.
The second question is source chain gas cost. Starting from TON means approximately $0.06 to $0.13 per transaction regardless of destination. Starting from Ethereum mainnet adds significant gas cost that changes the economics for smaller amounts. If your assets are distributed across multiple chains the starting chain choice affects total cost more than the route itself.
The third question is which stablecoin you hold and which is available at the destination. Each chain in the network has specific supported stablecoins. USDT on TON. USDT and USDC on Ethereum and BNB Chain. USDC and USDT0 on Arbitrum. PUSD and USDC on Polygon. USDG on Robinhood Chain. USDC and USDT0 on X Layer. Verify the live interface before confirming because supported assets update as the network evolves.
The fourth question is transaction size versus the current $1,000 per transaction limit on newer chain additions. For amounts above the limit multiple transactions are required.
These four questions answer the chain selection decision for most cross-chain moves.
Try cross-chain swaps →https://app.ston.fi/swap?mode=cross-chain
$BTC #BTC Price Analysis# #Altcoin Season# $PI

52
·
--
Переглянути переклад
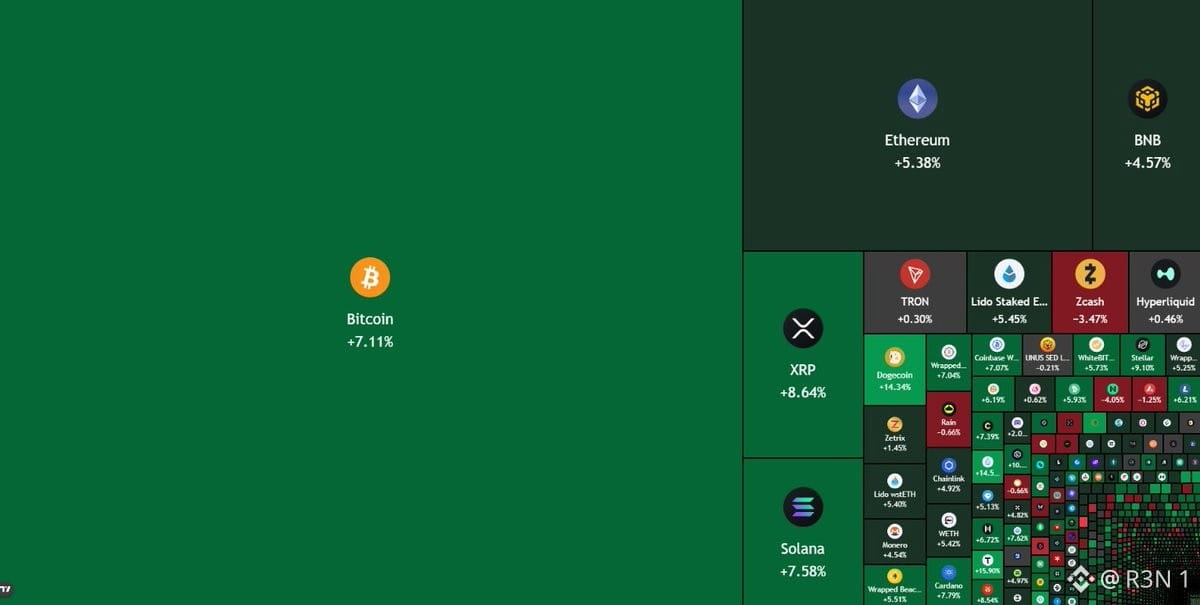
CLARITY Act failed the Senate on September 15. Bitcoin dropped to $74,900 that same day, over $600 million in long liquidations. Six days later it's at $86,000, an eight month high. That sequence is the actual story, not a straight line from failure to rally.
The initial reaction was bearish, exactly what you'd expect. But the recovery that followed wasn't really about CLARITY at all, it came from BTC clearing technical resistance at $78,000, then again at $82,000, each breakout triggering fresh short liquidations that fed the next leg up. CoinGlass data shows roughly $750 million in bearish positions wiped out as $82,000 gave way today alone. Layer on top of that around $15.6 billion in Fed Treasury bill purchases that started settling September 18, and you get a market that recovered despite the regulatory setback, not because of it.
Worth being careful with the framing here. Calling this a CLARITY driven surge skips over the actual week, a real selloff, then a separate technical and liquidity driven recovery that happened to land in the same stretch. Scott Melker's read on this seems closer to accurate, bad news simply stopped moving price lower, which is a different claim than good news pushing it higher.
Open interest is up roughly $2 billion since the $82,000 breakout too, meaning fresh leverage is building back into this rally rather than the move being purely a short covering event at this point.
My honest read: the price action is real and the bear liquidations are real, but attributing this specifically to CLARITY's failure gets the causality backwards. This looks more like a market that priced in worse news than what happened, then kept climbing on its own momentum.
What I'm watching: whether $86,000 to $90,000 holds with fresh leverage building, or whether this starts looking overextended the way rallies built on rebuilding open interest sometimes do.
$BTC #BTC Price Analysis# #Altcoin Season# $ETH
CLARITY Act failed the Senate on September 15. Bitcoin dropped to $74,900 that same day, over $600 million in long liquidations. Six days later it's at $86,000, an eight month high. That sequence is the actual story, not a straight line from failure to rally.
The initial reaction was bearish, exactly what you'd expect. But the recovery that followed wasn't really about CLARITY at all, it came from BTC clearing technical resistance at $78,000, then again at $82,000, each breakout triggering fresh short liquidations that fed the next leg up. CoinGlass data shows roughly $750 million in bearish positions wiped out as $82,000 gave way today alone. Layer on top of that around $15.6 billion in Fed Treasury bill purchases that started settling September 18, and you get a market that recovered despite the regulatory setback, not because of it.
Worth being careful with the framing here. Calling this a CLARITY driven surge skips over the actual week, a real selloff, then a separate technical and liquidity driven recovery that happened to land in the same stretch. Scott Melker's read on this seems closer to accurate, bad news simply stopped moving price lower, which is a different claim than good news pushing it higher.
Open interest is up roughly $2 billion since the $82,000 breakout too, meaning fresh leverage is building back into this rally rather than the move being purely a short covering event at this point.
My honest read: the price action is real and the bear liquidations are real, but attributing this specifically to CLARITY's failure gets the causality backwards. This looks more like a market that priced in worse news than what happened, then kept climbing on its own momentum.
What I'm watching: whether $86,000 to $90,000 holds with fresh leverage building, or whether this starts looking overextended the way rallies built on rebuilding open interest sometimes do.
$BTC #BTC Price Analysis# #Altcoin Season# $ETH
The initial reaction was bearish, exactly what you'd expect. But the recovery that followed wasn't really about CLARITY at all, it came from BTC clearing technical resistance at $78,000, then again at $82,000, each breakout triggering fresh short liquidations that fed the next leg up. CoinGlass data shows roughly $750 million in bearish positions wiped out as $82,000 gave way today alone. Layer on top of that around $15.6 billion in Fed Treasury bill purchases that started settling September 18, and you get a market that recovered despite the regulatory setback, not because of it.
Worth being careful with the framing here. Calling this a CLARITY driven surge skips over the actual week, a real selloff, then a separate technical and liquidity driven recovery that happened to land in the same stretch. Scott Melker's read on this seems closer to accurate, bad news simply stopped moving price lower, which is a different claim than good news pushing it higher.
Open interest is up roughly $2 billion since the $82,000 breakout too, meaning fresh leverage is building back into this rally rather than the move being purely a short covering event at this point.
My honest read: the price action is real and the bear liquidations are real, but attributing this specifically to CLARITY's failure gets the causality backwards. This looks more like a market that priced in worse news than what happened, then kept climbing on its own momentum.
What I'm watching: whether $86,000 to $90,000 holds with fresh leverage building, or whether this starts looking overextended the way rallies built on rebuilding open interest sometimes do.
$BTC #BTC Price Analysis# #Altcoin Season# $ETH

73
·
--
Переглянути переклад
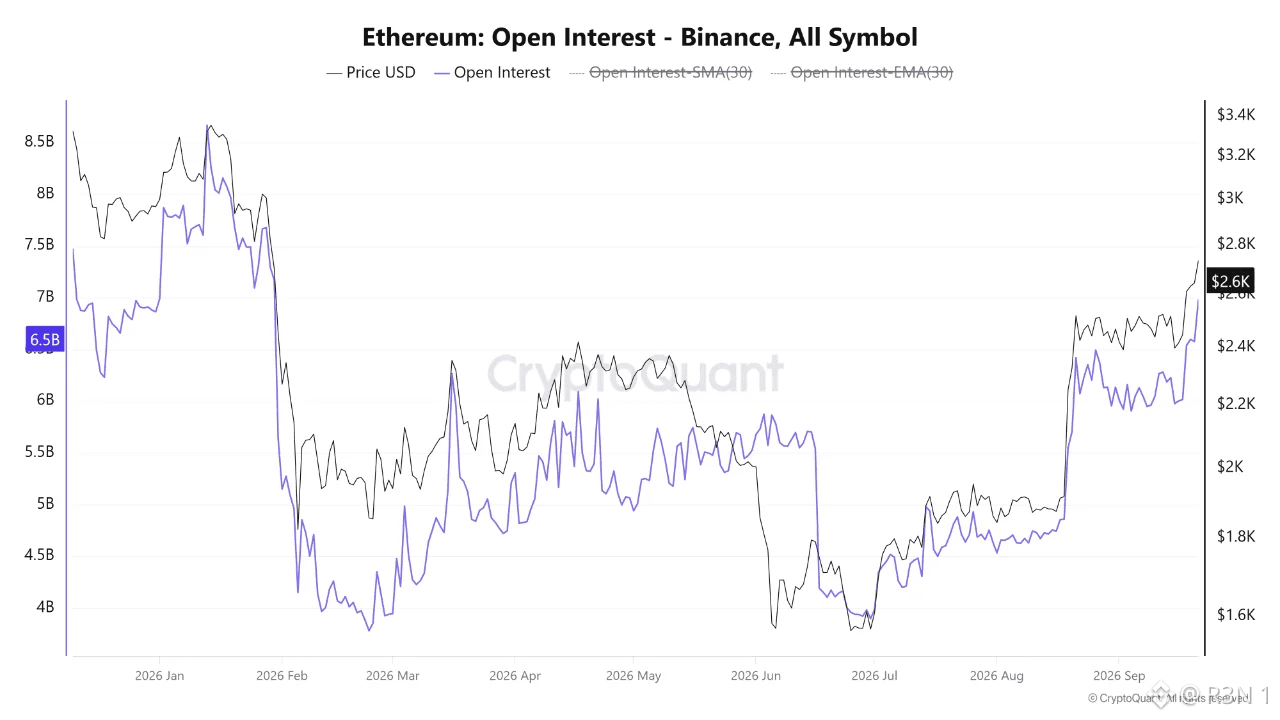
ETH open interest on Binance just hit a nine-month high, and whether that's bullish confirmation or leverage risk depends entirely on a detail this data alone can't answer. Open interest climbed from around $4.8 billion in late August to roughly $6.58 billion now, a genuine acceleration through September, not a slow drift. That coincided with ETH climbing to about $2,644, price and open positions rising together. Here's the part I'd push back on in how this usually gets framed. Rising OI alongside rising price gets read as automatically bullish, more capital, more participation, stronger conviction. That's true as far as it goes, but it's incomplete without knowing the mix. Rising OI can mean fresh longs entering with real conviction, or it can mean shorts getting trapped and adding to losing positions before eventually capitulating, or some combination of both happening at once. The dollar figure alone doesn't distinguish between those scenarios. What would actually settle this is funding rates and the long/short ratio over the same window, neither of which is in this dataset. Elevated positive funding alongside this OI climb would support the "genuine bullish participation" read. Funding staying flat or negative while OI expands this fast would suggest a more contested market, sellers pressing against a rally rather than buyers driving it cleanly. Worth being direct about the risk side too, regardless of which scenario this turns out to be. A nine-month high in open interest means more leveraged capital sitting exposed to price swings than at any point since January. That cuts both ways, it can fuel continuation if the move holds, or accelerate a reversal fast if price turns and forces liquidations on the side that's overextended. The open question isn't whether participation increased, the OI number confirms that plainly. It's which side actually added that exposure, and that's the piece this specific report leaves out. #BTC Price Analysis# $ETH
ETH open interest on Binance just hit a nine-month high, and whether that's bullish confirmation or leverage risk depends entirely on a detail this data alone can't answer. Open interest climbed from around $4.8 billion in late August to roughly $6.58 billion now, a genuine acceleration through September, not a slow drift. That coincided with ETH climbing to about $2,644, price and open positions rising together. Here's the part I'd push back on in how this usually gets framed. Rising OI alongside rising price gets read as automatically bullish, more capital, more participation, stronger conviction. That's true as far as it goes, but it's incomplete without knowing the mix. Rising OI can mean fresh longs entering with real conviction, or it can mean shorts getting trapped and adding to losing positions before eventually capitulating, or some combination of both happening at once. The dollar figure alone doesn't distinguish between those scenarios. What would actually settle this is funding rates and the long/short ratio over the same window, neither of which is in this dataset. Elevated positive funding alongside this OI climb would support the "genuine bullish participation" read. Funding staying flat or negative while OI expands this fast would suggest a more contested market, sellers pressing against a rally rather than buyers driving it cleanly. Worth being direct about the risk side too, regardless of which scenario this turns out to be. A nine-month high in open interest means more leveraged capital sitting exposed to price swings than at any point since January. That cuts both ways, it can fuel continuation if the move holds, or accelerate a reversal fast if price turns and forces liquidations on the side that's overextended. The open question isn't whether participation increased, the OI number confirms that plainly. It's which side actually added that exposure, and that's the piece this specific report leaves out. #BTC Price Analysis# $ETH
27
·
--
Переглянути переклад
100 million POL sounds like a big number until you check it against actual circulating supply, and the mechanism itself has a detail worth flagging.
The burn is 83% of the 121 million POL sitting in Polygon's base-fee collector, and Sandeep Nailwal says it'll be permissionless, anyone can trigger it once it clears mainnet, not just the foundation. Against total supply though, it's about 0.93% of the 10.716 billion POL circulating, per Blockscout, real but modest, not the kind of number that mechanically forces a price move on its own.
What stands out to me is the revenue claim riding alongside this. Nailwal cited $24.5 million in 2026 revenue, ahead of Arbitrum's $8.41 million and NEAR's $5.6 million, but attributed that comparison to "my analyst at ChatGPT" with no dataset or methodology named. Worth being direct about that, an unsourced claim shouldn't get the same confidence as the burn mechanics, which are independently confirmed and already on testnet.
The structural piece that matters more than either number is what happens after this burn.
Not a one-time cut, it establishes a permissionless quarterly mechanism where accumulated base fees get burned going forward, turning network activity directly into deflationary pressure. Nailwal says POL's been net deflationary since January 2026 under the current setup, this formalizes and makes public what was reportedly already happening internally.
Worth being clear where this stands, the burn hasn't happened yet. Contracts are on testnet, awaiting final Security Council signatures before mainnet, a confirmed plan, not a done deal.
The open question isn't whether the first burn goes through, that looks close to certain. It's whether the quarterly mechanism generates enough recurring fee volume to matter at scale, since a collector refilling slowly is a very different story than one headline number.
$POL #Macro Insights# #Macro Insights#
100 million POL sounds like a big number until you check it against actual circulating supply, and the mechanism itself has a detail worth flagging.
The burn is 83% of the 121 million POL sitting in Polygon's base-fee collector, and Sandeep Nailwal says it'll be permissionless, anyone can trigger it once it clears mainnet, not just the foundation. Against total supply though, it's about 0.93% of the 10.716 billion POL circulating, per Blockscout, real but modest, not the kind of number that mechanically forces a price move on its own.
What stands out to me is the revenue claim riding alongside this. Nailwal cited $24.5 million in 2026 revenue, ahead of Arbitrum's $8.41 million and NEAR's $5.6 million, but attributed that comparison to "my analyst at ChatGPT" with no dataset or methodology named. Worth being direct about that, an unsourced claim shouldn't get the same confidence as the burn mechanics, which are independently confirmed and already on testnet.
The structural piece that matters more than either number is what happens after this burn.
Not a one-time cut, it establishes a permissionless quarterly mechanism where accumulated base fees get burned going forward, turning network activity directly into deflationary pressure. Nailwal says POL's been net deflationary since January 2026 under the current setup, this formalizes and makes public what was reportedly already happening internally.
Worth being clear where this stands, the burn hasn't happened yet. Contracts are on testnet, awaiting final Security Council signatures before mainnet, a confirmed plan, not a done deal.
The open question isn't whether the first burn goes through, that looks close to certain. It's whether the quarterly mechanism generates enough recurring fee volume to matter at scale, since a collector refilling slowly is a very different story than one headline number.
$POL #Macro Insights# #Macro Insights#
The burn is 83% of the 121 million POL sitting in Polygon's base-fee collector, and Sandeep Nailwal says it'll be permissionless, anyone can trigger it once it clears mainnet, not just the foundation. Against total supply though, it's about 0.93% of the 10.716 billion POL circulating, per Blockscout, real but modest, not the kind of number that mechanically forces a price move on its own.
What stands out to me is the revenue claim riding alongside this. Nailwal cited $24.5 million in 2026 revenue, ahead of Arbitrum's $8.41 million and NEAR's $5.6 million, but attributed that comparison to "my analyst at ChatGPT" with no dataset or methodology named. Worth being direct about that, an unsourced claim shouldn't get the same confidence as the burn mechanics, which are independently confirmed and already on testnet.
The structural piece that matters more than either number is what happens after this burn.
Not a one-time cut, it establishes a permissionless quarterly mechanism where accumulated base fees get burned going forward, turning network activity directly into deflationary pressure. Nailwal says POL's been net deflationary since January 2026 under the current setup, this formalizes and makes public what was reportedly already happening internally.
Worth being clear where this stands, the burn hasn't happened yet. Contracts are on testnet, awaiting final Security Council signatures before mainnet, a confirmed plan, not a done deal.
The open question isn't whether the first burn goes through, that looks close to certain. It's whether the quarterly mechanism generates enough recurring fee volume to matter at scale, since a collector refilling slowly is a very different story than one headline number.
$POL #Macro Insights# #Macro Insights#



1
367
·
--
Переглянути переклад
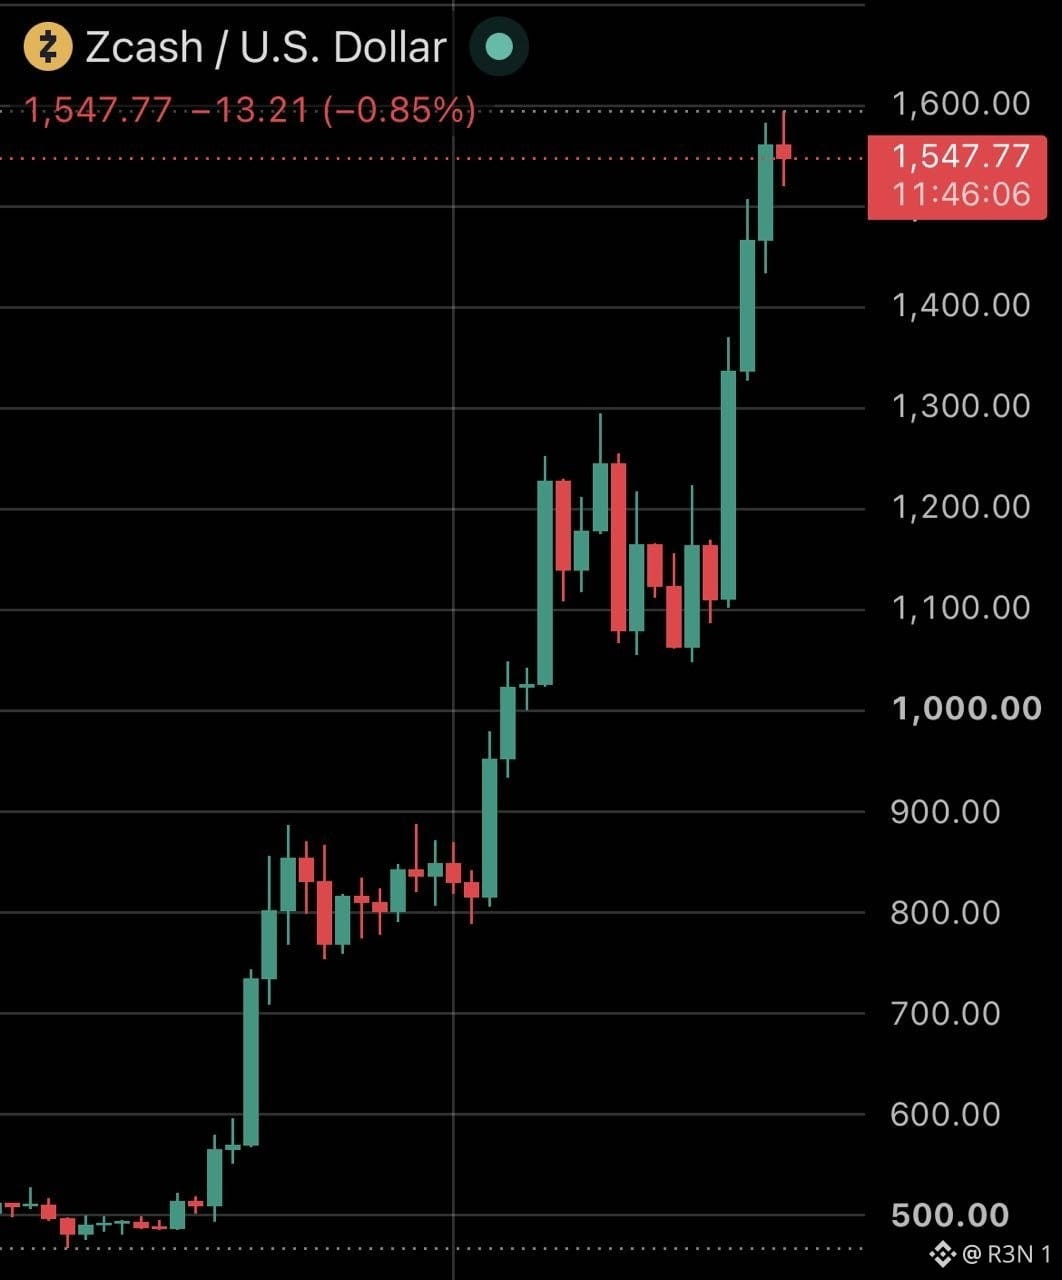
The same trader who made $11.24 million shorting ZEC after June's selloff just gave back more than triple that on the next attempt. That's the actual arc here, not just today's number.
Garrett Jin, former BitForex CEO, rebuilt his ZEC short in June with an initial 11,780 ZEC position worth about $4.92 million, then kept adding as Zcash climbed, eventually growing it to around 40,000 ZEC before closing 38,000 of it today via market orders over roughly 90 minutes. The exit itself briefly pushed ZEC up 2.7%, from $1,490 to $1,530, and spiked Hyperliquid's funding rate above 170% annualized in the process. Reported loss figures vary slightly by source, $35.44 million per Lookonchain and TechFlow, $36.13 million per Phemex, worth noting that spread rather than picking one number as precise to the dollar.
Context matters here. ZEC is up roughly 178% over the past month, and Zcash ETFs pulled in $98.2 million last week alone, the most of any of the 14 products in that category. Jin wasn't the only short holder getting run over either, per BeInCrypto, other tracked wallets were sitting $10 to $12 million underwater on smaller ZEC shorts around the same window. Jin still holds 202,078 ZEC in spot, worth roughly $309 million, with an estimated $221 million unrealized profit on that position, alongside a separate 1,330 BTC long worth about $107.77 million.
My honest read: the realized loss on the short doesn't erase what's still a massive net position in his favor overall, this reads as one specific trade going badly wrong inside a portfolio that's still deeply profitable.
What I'm watching: whether Jin re-enters a ZEC short at a new level, given his track record of doing exactly that after past losses, or steps back from the position entirely.
$ZEC #BTC Price Analysis# #Macro Insights# #BNBChain#
The same trader who made $11.24 million shorting ZEC after June's selloff just gave back more than triple that on the next attempt. That's the actual arc here, not just today's number.
Garrett Jin, former BitForex CEO, rebuilt his ZEC short in June with an initial 11,780 ZEC position worth about $4.92 million, then kept adding as Zcash climbed, eventually growing it to around 40,000 ZEC before closing 38,000 of it today via market orders over roughly 90 minutes. The exit itself briefly pushed ZEC up 2.7%, from $1,490 to $1,530, and spiked Hyperliquid's funding rate above 170% annualized in the process. Reported loss figures vary slightly by source, $35.44 million per Lookonchain and TechFlow, $36.13 million per Phemex, worth noting that spread rather than picking one number as precise to the dollar.
Context matters here. ZEC is up roughly 178% over the past month, and Zcash ETFs pulled in $98.2 million last week alone, the most of any of the 14 products in that category. Jin wasn't the only short holder getting run over either, per BeInCrypto, other tracked wallets were sitting $10 to $12 million underwater on smaller ZEC shorts around the same window. Jin still holds 202,078 ZEC in spot, worth roughly $309 million, with an estimated $221 million unrealized profit on that position, alongside a separate 1,330 BTC long worth about $107.77 million.
My honest read: the realized loss on the short doesn't erase what's still a massive net position in his favor overall, this reads as one specific trade going badly wrong inside a portfolio that's still deeply profitable.
What I'm watching: whether Jin re-enters a ZEC short at a new level, given his track record of doing exactly that after past losses, or steps back from the position entirely.
$ZEC #BTC Price Analysis# #Macro Insights# #BNBChain#
Garrett Jin, former BitForex CEO, rebuilt his ZEC short in June with an initial 11,780 ZEC position worth about $4.92 million, then kept adding as Zcash climbed, eventually growing it to around 40,000 ZEC before closing 38,000 of it today via market orders over roughly 90 minutes. The exit itself briefly pushed ZEC up 2.7%, from $1,490 to $1,530, and spiked Hyperliquid's funding rate above 170% annualized in the process. Reported loss figures vary slightly by source, $35.44 million per Lookonchain and TechFlow, $36.13 million per Phemex, worth noting that spread rather than picking one number as precise to the dollar.
Context matters here. ZEC is up roughly 178% over the past month, and Zcash ETFs pulled in $98.2 million last week alone, the most of any of the 14 products in that category. Jin wasn't the only short holder getting run over either, per BeInCrypto, other tracked wallets were sitting $10 to $12 million underwater on smaller ZEC shorts around the same window. Jin still holds 202,078 ZEC in spot, worth roughly $309 million, with an estimated $221 million unrealized profit on that position, alongside a separate 1,330 BTC long worth about $107.77 million.
My honest read: the realized loss on the short doesn't erase what's still a massive net position in his favor overall, this reads as one specific trade going badly wrong inside a portfolio that's still deeply profitable.
What I'm watching: whether Jin re-enters a ZEC short at a new level, given his track record of doing exactly that after past losses, or steps back from the position entirely.
$ZEC #BTC Price Analysis# #Macro Insights# #BNBChain#


47
·
--
Переглянути переклад
Over $235,000 gone from hundreds of wallets in 48 hours, and nobody's actually named the malware doing it. That gap between the dollar figure and the missing details is the real story here.
The mechanics being described are straightforward enough, a remote access trojan harvesting credentials and hijacking active sessions to bypass authentication entirely, letting attackers piggyback on a victim's already logged in state rather than needing to steal a password and log in separately.
That's a real, well understood attack pattern. What's missing is everything that would normally accompany a claim like this, no named malware family, no malicious domains, no file hashes, no command and control infrastructure, no security researchers attached to the findings.
There's a real on chain trail behind it though. An Ethereum address tied to this activity showed up in a Russian language Telegram post two days before the wider "malware" framing spread, describing it as a new drainer wallet and claiming similar addresses were pulling in at least $200,000 a day. That claim hasn't been independently verified either, but it's the closest thing to hard evidence attached to any of this so far.
My honest take: something real is happening, hundreds of victims and a documented wallet aren't nothing. But right now this is a wallet balance with a headline attached, not a mapped out malware campaign. Calling it a confirmed RAT operation with known mechanics gets ahead of what's actually been shown.
What I'd want before treating this as settled: an actual security report naming the strain and how it's spreading, since that's the one piece every version of this story is still missing.
$BTC #Altcoin Season# $ETH #BTC Price Analysis#
Over $235,000 gone from hundreds of wallets in 48 hours, and nobody's actually named the malware doing it. That gap between the dollar figure and the missing details is the real story here.
The mechanics being described are straightforward enough, a remote access trojan harvesting credentials and hijacking active sessions to bypass authentication entirely, letting attackers piggyback on a victim's already logged in state rather than needing to steal a password and log in separately.
That's a real, well understood attack pattern. What's missing is everything that would normally accompany a claim like this, no named malware family, no malicious domains, no file hashes, no command and control infrastructure, no security researchers attached to the findings.
There's a real on chain trail behind it though. An Ethereum address tied to this activity showed up in a Russian language Telegram post two days before the wider "malware" framing spread, describing it as a new drainer wallet and claiming similar addresses were pulling in at least $200,000 a day. That claim hasn't been independently verified either, but it's the closest thing to hard evidence attached to any of this so far.
My honest take: something real is happening, hundreds of victims and a documented wallet aren't nothing. But right now this is a wallet balance with a headline attached, not a mapped out malware campaign. Calling it a confirmed RAT operation with known mechanics gets ahead of what's actually been shown.
What I'd want before treating this as settled: an actual security report naming the strain and how it's spreading, since that's the one piece every version of this story is still missing.
$BTC #Altcoin Season# $ETH #BTC Price Analysis#
The mechanics being described are straightforward enough, a remote access trojan harvesting credentials and hijacking active sessions to bypass authentication entirely, letting attackers piggyback on a victim's already logged in state rather than needing to steal a password and log in separately.
That's a real, well understood attack pattern. What's missing is everything that would normally accompany a claim like this, no named malware family, no malicious domains, no file hashes, no command and control infrastructure, no security researchers attached to the findings.
There's a real on chain trail behind it though. An Ethereum address tied to this activity showed up in a Russian language Telegram post two days before the wider "malware" framing spread, describing it as a new drainer wallet and claiming similar addresses were pulling in at least $200,000 a day. That claim hasn't been independently verified either, but it's the closest thing to hard evidence attached to any of this so far.
My honest take: something real is happening, hundreds of victims and a documented wallet aren't nothing. But right now this is a wallet balance with a headline attached, not a mapped out malware campaign. Calling it a confirmed RAT operation with known mechanics gets ahead of what's actually been shown.
What I'd want before treating this as settled: an actual security report naming the strain and how it's spreading, since that's the one piece every version of this story is still missing.
$BTC #Altcoin Season# $ETH #BTC Price Analysis#
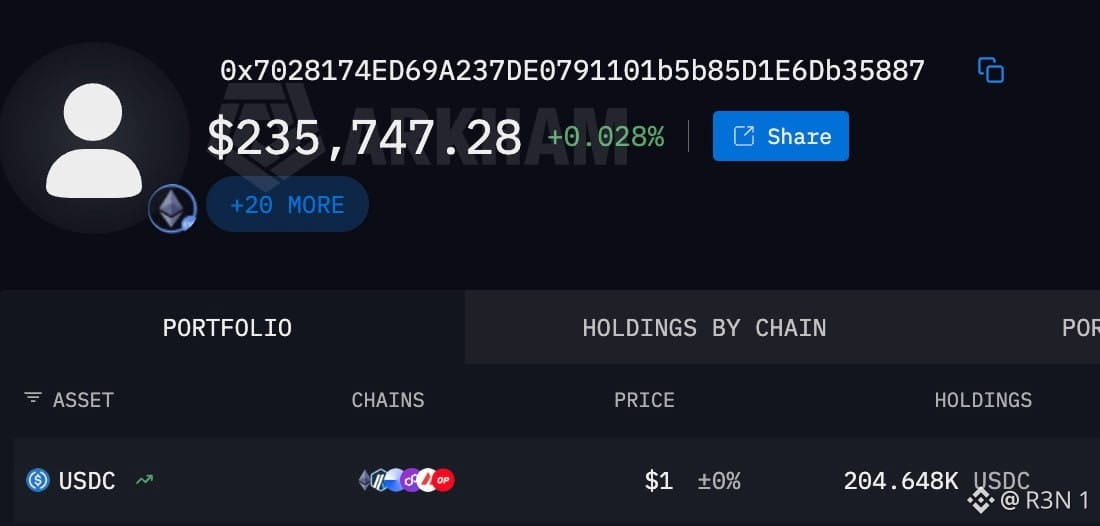
60
·
--
Переглянути переклад
NEAR is up 80.95% over the past seven days, climbing from roughly $2.30 to $4.16, one of the sharper weekly moves in the market right now. Market cap alone jumped from $4.51B to $5.61B in a little over a day recently, on $4.31B in volume.
The catalyst behind it is real and shipped, not just narrative. NEAR launched confidential perpetual futures on September 17, powered by Hyperliquid's execution engine, letting traders open positions without publicly linking them to their accounts.
Funding stays private, settlement stays on a public order book. That's a meaningful design choice, most decentralized perp venues, Hyperliquid's own native interface included, keep account activity fully traceable. TVL in this product hit $70 million, triggering an incentive program unlocking 333,333 tokens once the three day volume weighted average price holds at or above $3.33. 24 hour trading volume reportedly spiked over 120% alongside the move.
What I find genuinely interesting here is the structural choice, NEAR outsourced execution entirely to Hyperliquid rather than building its own order book from scratch, tapping into roughly $240 billion in Hyperliquid's own monthly perp volume instead of bootstrapping liquidity from nothing.
My honest read: this rally has real fundamentals behind it, a shipped product with actual TVL, not just narrative. But weekly RSI is reportedly sitting above 70, overbought territory, and a chunk of this move is tied to that incentive threshold specifically, which creates its own kind of reflexive pressure around $3.33.
What I'm watching: whether NEAR holds above that incentive threshold once the token unlock event passes, or whether this fades once the mechanical demand behind it clears.
#BTC Price Analysis# #Macro Insights# $NEAR
NEAR is up 80.95% over the past seven days, climbing from roughly $2.30 to $4.16, one of the sharper weekly moves in the market right now. Market cap alone jumped from $4.51B to $5.61B in a little over a day recently, on $4.31B in volume.
The catalyst behind it is real and shipped, not just narrative. NEAR launched confidential perpetual futures on September 17, powered by Hyperliquid's execution engine, letting traders open positions without publicly linking them to their accounts.
Funding stays private, settlement stays on a public order book. That's a meaningful design choice, most decentralized perp venues, Hyperliquid's own native interface included, keep account activity fully traceable. TVL in this product hit $70 million, triggering an incentive program unlocking 333,333 tokens once the three day volume weighted average price holds at or above $3.33. 24 hour trading volume reportedly spiked over 120% alongside the move.
What I find genuinely interesting here is the structural choice, NEAR outsourced execution entirely to Hyperliquid rather than building its own order book from scratch, tapping into roughly $240 billion in Hyperliquid's own monthly perp volume instead of bootstrapping liquidity from nothing.
My honest read: this rally has real fundamentals behind it, a shipped product with actual TVL, not just narrative. But weekly RSI is reportedly sitting above 70, overbought territory, and a chunk of this move is tied to that incentive threshold specifically, which creates its own kind of reflexive pressure around $3.33.
What I'm watching: whether NEAR holds above that incentive threshold once the token unlock event passes, or whether this fades once the mechanical demand behind it clears.
#BTC Price Analysis# #Macro Insights# $NEAR
The catalyst behind it is real and shipped, not just narrative. NEAR launched confidential perpetual futures on September 17, powered by Hyperliquid's execution engine, letting traders open positions without publicly linking them to their accounts.
Funding stays private, settlement stays on a public order book. That's a meaningful design choice, most decentralized perp venues, Hyperliquid's own native interface included, keep account activity fully traceable. TVL in this product hit $70 million, triggering an incentive program unlocking 333,333 tokens once the three day volume weighted average price holds at or above $3.33. 24 hour trading volume reportedly spiked over 120% alongside the move.
What I find genuinely interesting here is the structural choice, NEAR outsourced execution entirely to Hyperliquid rather than building its own order book from scratch, tapping into roughly $240 billion in Hyperliquid's own monthly perp volume instead of bootstrapping liquidity from nothing.
My honest read: this rally has real fundamentals behind it, a shipped product with actual TVL, not just narrative. But weekly RSI is reportedly sitting above 70, overbought territory, and a chunk of this move is tied to that incentive threshold specifically, which creates its own kind of reflexive pressure around $3.33.
What I'm watching: whether NEAR holds above that incentive threshold once the token unlock event passes, or whether this fades once the mechanical demand behind it clears.
#BTC Price Analysis# #Macro Insights# $NEAR
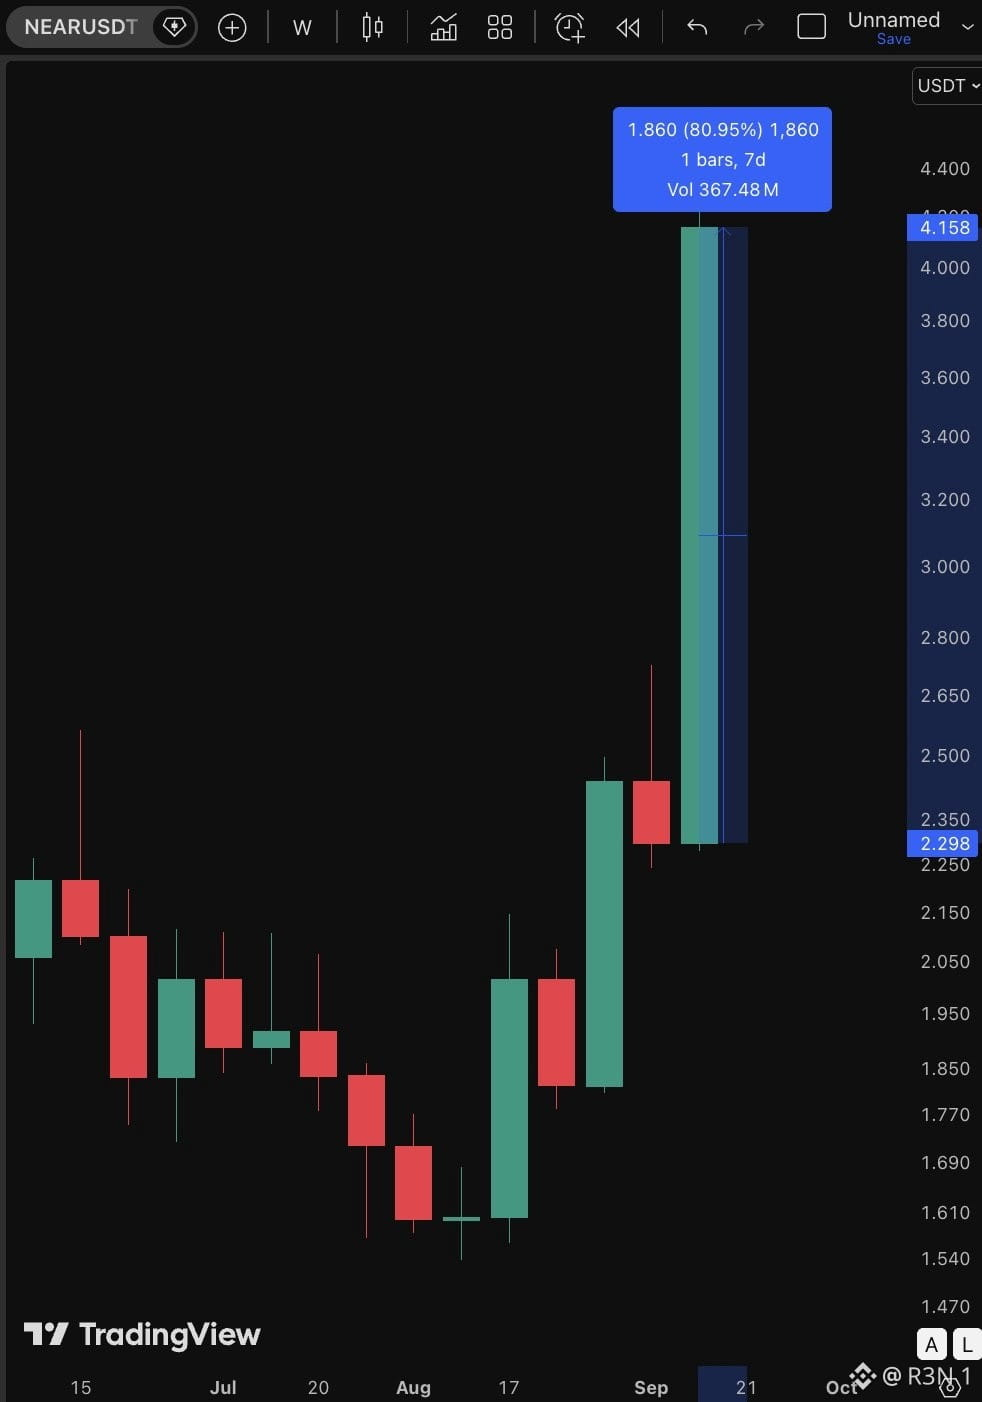
26
·
--
Трохи більше помаранчевого." Це й весь допис — жодної суми, жодного підрахунку BTC; лише Сейлор ділиться трекером біткоїна від Strategy у соцмережі X сьогодні. Ринки все одно читають це як сигнал до купівлі, і історично це трактування спрацьовувало частіше, ніж ні.
Остання підтверджена купівля Strategy була 31 серпня: 4,603 BTC за середньою ціною $80,318, що довело її холдинги приблизно до 846,060 BTC загалом за 114 покупок — досі найбільша корпоративна позиція в біткоїнах із дуже відчутним відривом. Відтоді компанія стала тихішою в плані накопичення: натомість фокусується на викупі своїх привілейованих акцій STRC, вартість яких відкотилася до $98.51 — майже до номіналу $100 після того, як у якийсь момент цього року вона падала аж до $75.
Варто бути чесним щодо цього трек-рекорду, а не сприймати кожну підказку як гарантований результат. Криптографічні (криптонаповнені) дописи Сейлора — «Ми ₿ack», «Помаранчевий чи зелений», а тепер «Трохи більше помаранчевого» — передували фактичним купівлям не раз, але AMBCrypto зокрема зазначало, що кілька нещодавніх натяків передували розпродажам BTC, а не ралі. Підтвердженої транзакції ще немає — це розпізнавання патернів за соцмережевими дописами публічної фігури, а не оголошена покупка.
Моя чесна оцінка: базова ймовірність того, що такі дописи призведуть до реальної купівлі протягом кількох днів, справді висока з огляду на історію Strategy — це не «нуль». Але називати це підтвердженим сигналом до того, як фактично надійде 8-K або пресреліз, — означає перебільшувати те, що реально говорить вам двослівний допис.
За чим я стежу: чи подасть Strategy у найближчі кілька днів фактичне повідомлення про купівлю, і якщо так — за якою ціною, зважаючи на власну волатильність BTC на тлі новин навколо сьогоднішніх засідань ФРС та заголовків CLARITY.
$BTC #BTC Price Analysis# #Bitcoin Price Prediction: What is Bitcoins next move?#
Трохи більше помаранчевого." Це й весь допис — жодної суми, жодного підрахунку BTC; лише Сейлор ділиться трекером біткоїна від Strategy у соцмережі X сьогодні. Ринки все одно читають це як сигнал до купівлі, і історично це трактування спрацьовувало частіше, ніж ні.
Остання підтверджена купівля Strategy була 31 серпня: 4,603 BTC за середньою ціною $80,318, що довело її холдинги приблизно до 846,060 BTC загалом за 114 покупок — досі найбільша корпоративна позиція в біткоїнах із дуже відчутним відривом. Відтоді компанія стала тихішою в плані накопичення: натомість фокусується на викупі своїх привілейованих акцій STRC, вартість яких відкотилася до $98.51 — майже до номіналу $100 після того, як у якийсь момент цього року вона падала аж до $75.
Варто бути чесним щодо цього трек-рекорду, а не сприймати кожну підказку як гарантований результат. Криптографічні (криптонаповнені) дописи Сейлора — «Ми ₿ack», «Помаранчевий чи зелений», а тепер «Трохи більше помаранчевого» — передували фактичним купівлям не раз, але AMBCrypto зокрема зазначало, що кілька нещодавніх натяків передували розпродажам BTC, а не ралі. Підтвердженої транзакції ще немає — це розпізнавання патернів за соцмережевими дописами публічної фігури, а не оголошена покупка.
Моя чесна оцінка: базова ймовірність того, що такі дописи призведуть до реальної купівлі протягом кількох днів, справді висока з огляду на історію Strategy — це не «нуль». Але називати це підтвердженим сигналом до того, як фактично надійде 8-K або пресреліз, — означає перебільшувати те, що реально говорить вам двослівний допис.
За чим я стежу: чи подасть Strategy у найближчі кілька днів фактичне повідомлення про купівлю, і якщо так — за якою ціною, зважаючи на власну волатильність BTC на тлі новин навколо сьогоднішніх засідань ФРС та заголовків CLARITY.
$BTC #BTC Price Analysis# #Bitcoin Price Prediction: What is Bitcoins next move?#
Остання підтверджена купівля Strategy була 31 серпня: 4,603 BTC за середньою ціною $80,318, що довело її холдинги приблизно до 846,060 BTC загалом за 114 покупок — досі найбільша корпоративна позиція в біткоїнах із дуже відчутним відривом. Відтоді компанія стала тихішою в плані накопичення: натомість фокусується на викупі своїх привілейованих акцій STRC, вартість яких відкотилася до $98.51 — майже до номіналу $100 після того, як у якийсь момент цього року вона падала аж до $75.
Варто бути чесним щодо цього трек-рекорду, а не сприймати кожну підказку як гарантований результат. Криптографічні (криптонаповнені) дописи Сейлора — «Ми ₿ack», «Помаранчевий чи зелений», а тепер «Трохи більше помаранчевого» — передували фактичним купівлям не раз, але AMBCrypto зокрема зазначало, що кілька нещодавніх натяків передували розпродажам BTC, а не ралі. Підтвердженої транзакції ще немає — це розпізнавання патернів за соцмережевими дописами публічної фігури, а не оголошена покупка.
Моя чесна оцінка: базова ймовірність того, що такі дописи призведуть до реальної купівлі протягом кількох днів, справді висока з огляду на історію Strategy — це не «нуль». Але називати це підтвердженим сигналом до того, як фактично надійде 8-K або пресреліз, — означає перебільшувати те, що реально говорить вам двослівний допис.
За чим я стежу: чи подасть Strategy у найближчі кілька днів фактичне повідомлення про купівлю, і якщо так — за якою ціною, зважаючи на власну волатильність BTC на тлі новин навколо сьогоднішніх засідань ФРС та заголовків CLARITY.
$BTC #BTC Price Analysis# #Bitcoin Price Prediction: What is Bitcoins next move?#
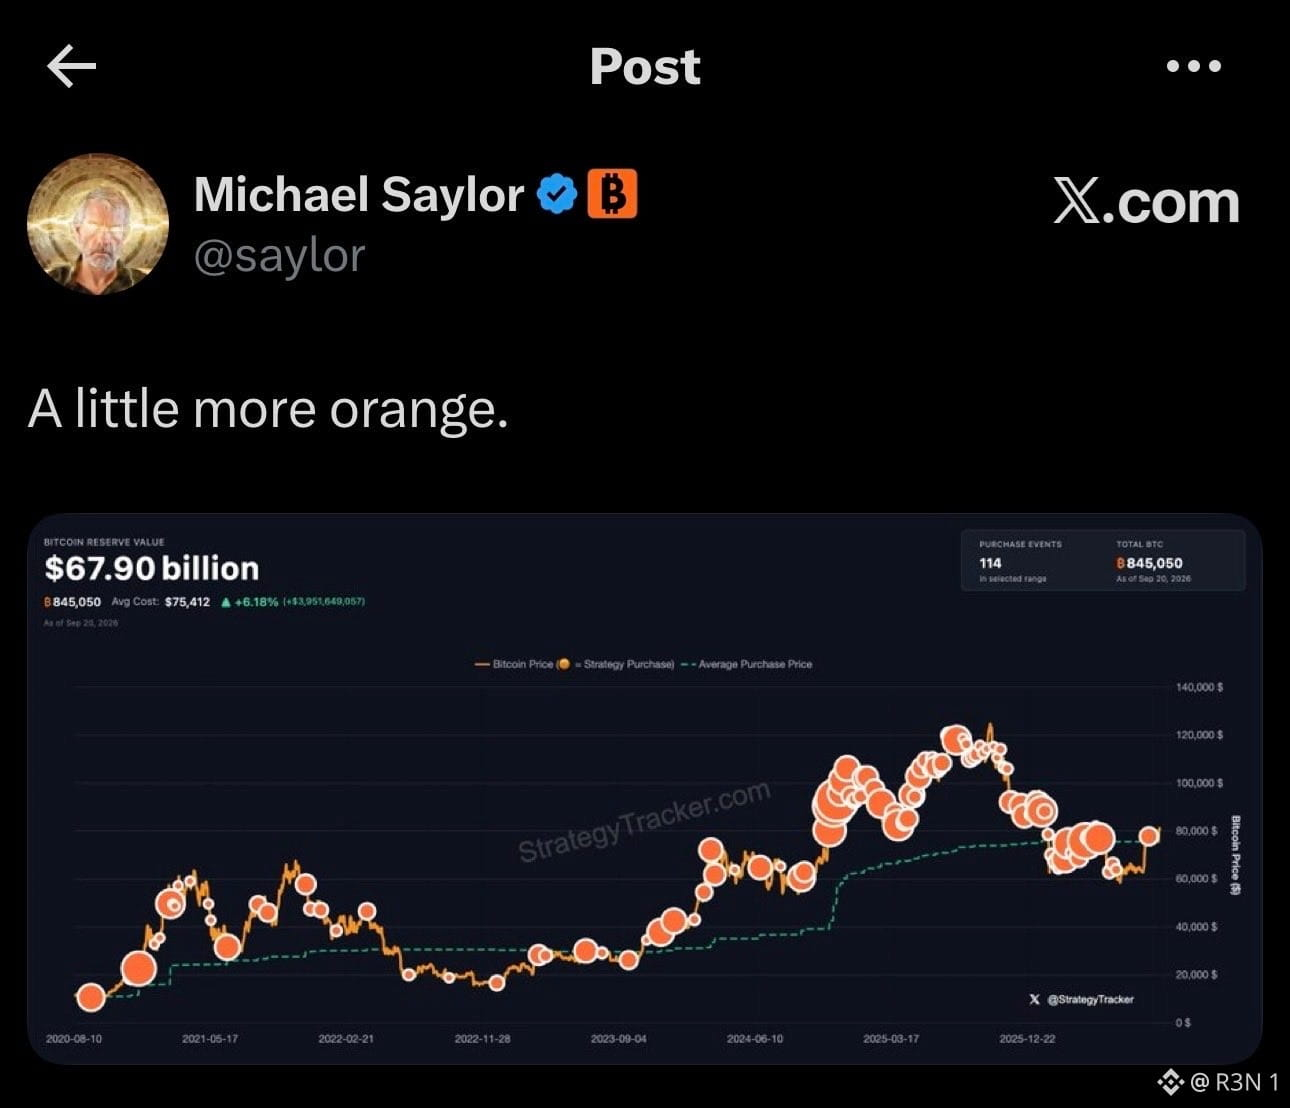
84
·
--
Переглянути переклад
Sui just crossed 16 billion lifetime transactions and is closing in on 18 billion, and the more useful comparison here isn't the raw total, it's the acceleration curve underneath it.
SuiVision data put the count at roughly 16.17 billion about a week ago. If it's now near 16.44 billion and pushing toward 18 billion, that's a real, sustained pace of growth, not a one-off spike from a single event or airdrop farming wave.
What stands out to me is how this compares to Sui's own recent stress tests. The network demonstrated a peak of over 6 million TPS in a controlled July experiment using offchain programmable payment tunnels, a number that's explicitly not comparable to routine daily throughput, since it settled batched activity rather than reflecting sustained on-chain load. The 80.3 TPS figure, whatever its refresh status, is the more honest read on what typical network activity actually looks like day to day.
Context that matters for interpreting the transaction count itself, Sui's architecture processes simple transfers with minimal consensus overhead, which structurally inflates raw transaction counts relative to chains where every action goes through full consensus. That's not a criticism, it's a design choice that makes Sui's transaction totals genuinely hard to compare apples-to-apples against other L1s without adjusting for what counts as a "transaction" in each system.
The open question isn't whether Sui hits 18 billion, the trajectory suggests it will. It's whether that growth reflects durable usage, stablecoin settlement, the Hashi Bitcoin collateral protocol, real application activity, or whether a meaningful share is low-value, high-frequency transfers that inflate the count without reflecting proportional economic activity on the network.
#BTC Price Analysis# #Macro Insights# #Macro Insights# $SUI
Sui just crossed 16 billion lifetime transactions and is closing in on 18 billion, and the more useful comparison here isn't the raw total, it's the acceleration curve underneath it.
SuiVision data put the count at roughly 16.17 billion about a week ago. If it's now near 16.44 billion and pushing toward 18 billion, that's a real, sustained pace of growth, not a one-off spike from a single event or airdrop farming wave.
What stands out to me is how this compares to Sui's own recent stress tests. The network demonstrated a peak of over 6 million TPS in a controlled July experiment using offchain programmable payment tunnels, a number that's explicitly not comparable to routine daily throughput, since it settled batched activity rather than reflecting sustained on-chain load. The 80.3 TPS figure, whatever its refresh status, is the more honest read on what typical network activity actually looks like day to day.
Context that matters for interpreting the transaction count itself, Sui's architecture processes simple transfers with minimal consensus overhead, which structurally inflates raw transaction counts relative to chains where every action goes through full consensus. That's not a criticism, it's a design choice that makes Sui's transaction totals genuinely hard to compare apples-to-apples against other L1s without adjusting for what counts as a "transaction" in each system.
The open question isn't whether Sui hits 18 billion, the trajectory suggests it will. It's whether that growth reflects durable usage, stablecoin settlement, the Hashi Bitcoin collateral protocol, real application activity, or whether a meaningful share is low-value, high-frequency transfers that inflate the count without reflecting proportional economic activity on the network.
#BTC Price Analysis# #Macro Insights# #Macro Insights# $SUI
SuiVision data put the count at roughly 16.17 billion about a week ago. If it's now near 16.44 billion and pushing toward 18 billion, that's a real, sustained pace of growth, not a one-off spike from a single event or airdrop farming wave.
What stands out to me is how this compares to Sui's own recent stress tests. The network demonstrated a peak of over 6 million TPS in a controlled July experiment using offchain programmable payment tunnels, a number that's explicitly not comparable to routine daily throughput, since it settled batched activity rather than reflecting sustained on-chain load. The 80.3 TPS figure, whatever its refresh status, is the more honest read on what typical network activity actually looks like day to day.
Context that matters for interpreting the transaction count itself, Sui's architecture processes simple transfers with minimal consensus overhead, which structurally inflates raw transaction counts relative to chains where every action goes through full consensus. That's not a criticism, it's a design choice that makes Sui's transaction totals genuinely hard to compare apples-to-apples against other L1s without adjusting for what counts as a "transaction" in each system.
The open question isn't whether Sui hits 18 billion, the trajectory suggests it will. It's whether that growth reflects durable usage, stablecoin settlement, the Hashi Bitcoin collateral protocol, real application activity, or whether a meaningful share is low-value, high-frequency transfers that inflate the count without reflecting proportional economic activity on the network.
#BTC Price Analysis# #Macro Insights# #Macro Insights# $SUI
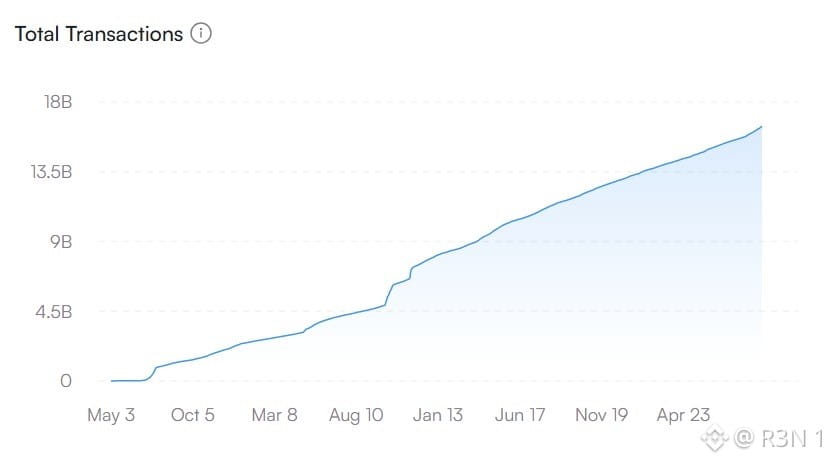
52
·
--
Переглянути переклад
MSTR beat the second place Nasdaq 100 finisher by more than double. Meta gained 21.9% over the same month, Strategy gained 47.7 to 48%, depending on the exact source, making it the single best performer in the entire index.
The stock closed at $153.92 on September 18 after a 16.39% single session surge alone. Two forces are driving this together, per multiple reports. Bitcoin's own push back toward $80,000 is the obvious one, MSTR trades as a high beta proxy for BTC given its balance sheet. The second is regulatory, the House Financial Services Committee advancing a Strategic Bitcoin Reserve bill, and the SEC granting a separate exemption tied to tokenized stock trading, both landing in the same window and adding a policy tailwind on top of the price move.
Worth being direct about what MSTR actually is at this point. It's functionally a one asset company, the software business still exists on paper, but it's a rounding error next to the Bitcoin holdings dominating the balance sheet. That's the entire investment thesis either way, MSTR gives regulated brokerage access to concentrated BTC exposure, no wallets or custody involved, but the stock's fate is tied almost entirely to Bitcoin's own price action, with leverage baked into the balance sheet structure.
My honest read: this is a legitimate, well documented outperformance, not an isolated anomaly, it tracks cleanly with BTC's own move and real regulatory catalysts landing at the same time. But the concentration risk cuts both ways, the same structure that produced 48% in a month when BTC rallied would produce an equally onsized move if BTC reverses.
What I'm watching: whether MSTR's premium to its actual Bitcoin holdings expands or compresses from here, since that spread matters as much as BTC's price itself for how this stock trades next.
$BTC #Altcoin Season# #BTC Price Analysis# $XAUt
MSTR beat the second place Nasdaq 100 finisher by more than double. Meta gained 21.9% over the same month, Strategy gained 47.7 to 48%, depending on the exact source, making it the single best performer in the entire index.
The stock closed at $153.92 on September 18 after a 16.39% single session surge alone. Two forces are driving this together, per multiple reports. Bitcoin's own push back toward $80,000 is the obvious one, MSTR trades as a high beta proxy for BTC given its balance sheet. The second is regulatory, the House Financial Services Committee advancing a Strategic Bitcoin Reserve bill, and the SEC granting a separate exemption tied to tokenized stock trading, both landing in the same window and adding a policy tailwind on top of the price move.
Worth being direct about what MSTR actually is at this point. It's functionally a one asset company, the software business still exists on paper, but it's a rounding error next to the Bitcoin holdings dominating the balance sheet. That's the entire investment thesis either way, MSTR gives regulated brokerage access to concentrated BTC exposure, no wallets or custody involved, but the stock's fate is tied almost entirely to Bitcoin's own price action, with leverage baked into the balance sheet structure.
My honest read: this is a legitimate, well documented outperformance, not an isolated anomaly, it tracks cleanly with BTC's own move and real regulatory catalysts landing at the same time. But the concentration risk cuts both ways, the same structure that produced 48% in a month when BTC rallied would produce an equally onsized move if BTC reverses.
What I'm watching: whether MSTR's premium to its actual Bitcoin holdings expands or compresses from here, since that spread matters as much as BTC's price itself for how this stock trades next.
$BTC #Altcoin Season# #BTC Price Analysis# $XAUt
The stock closed at $153.92 on September 18 after a 16.39% single session surge alone. Two forces are driving this together, per multiple reports. Bitcoin's own push back toward $80,000 is the obvious one, MSTR trades as a high beta proxy for BTC given its balance sheet. The second is regulatory, the House Financial Services Committee advancing a Strategic Bitcoin Reserve bill, and the SEC granting a separate exemption tied to tokenized stock trading, both landing in the same window and adding a policy tailwind on top of the price move.
Worth being direct about what MSTR actually is at this point. It's functionally a one asset company, the software business still exists on paper, but it's a rounding error next to the Bitcoin holdings dominating the balance sheet. That's the entire investment thesis either way, MSTR gives regulated brokerage access to concentrated BTC exposure, no wallets or custody involved, but the stock's fate is tied almost entirely to Bitcoin's own price action, with leverage baked into the balance sheet structure.
My honest read: this is a legitimate, well documented outperformance, not an isolated anomaly, it tracks cleanly with BTC's own move and real regulatory catalysts landing at the same time. But the concentration risk cuts both ways, the same structure that produced 48% in a month when BTC rallied would produce an equally onsized move if BTC reverses.
What I'm watching: whether MSTR's premium to its actual Bitcoin holdings expands or compresses from here, since that spread matters as much as BTC's price itself for how this stock trades next.
$BTC #Altcoin Season# #BTC Price Analysis# $XAUt
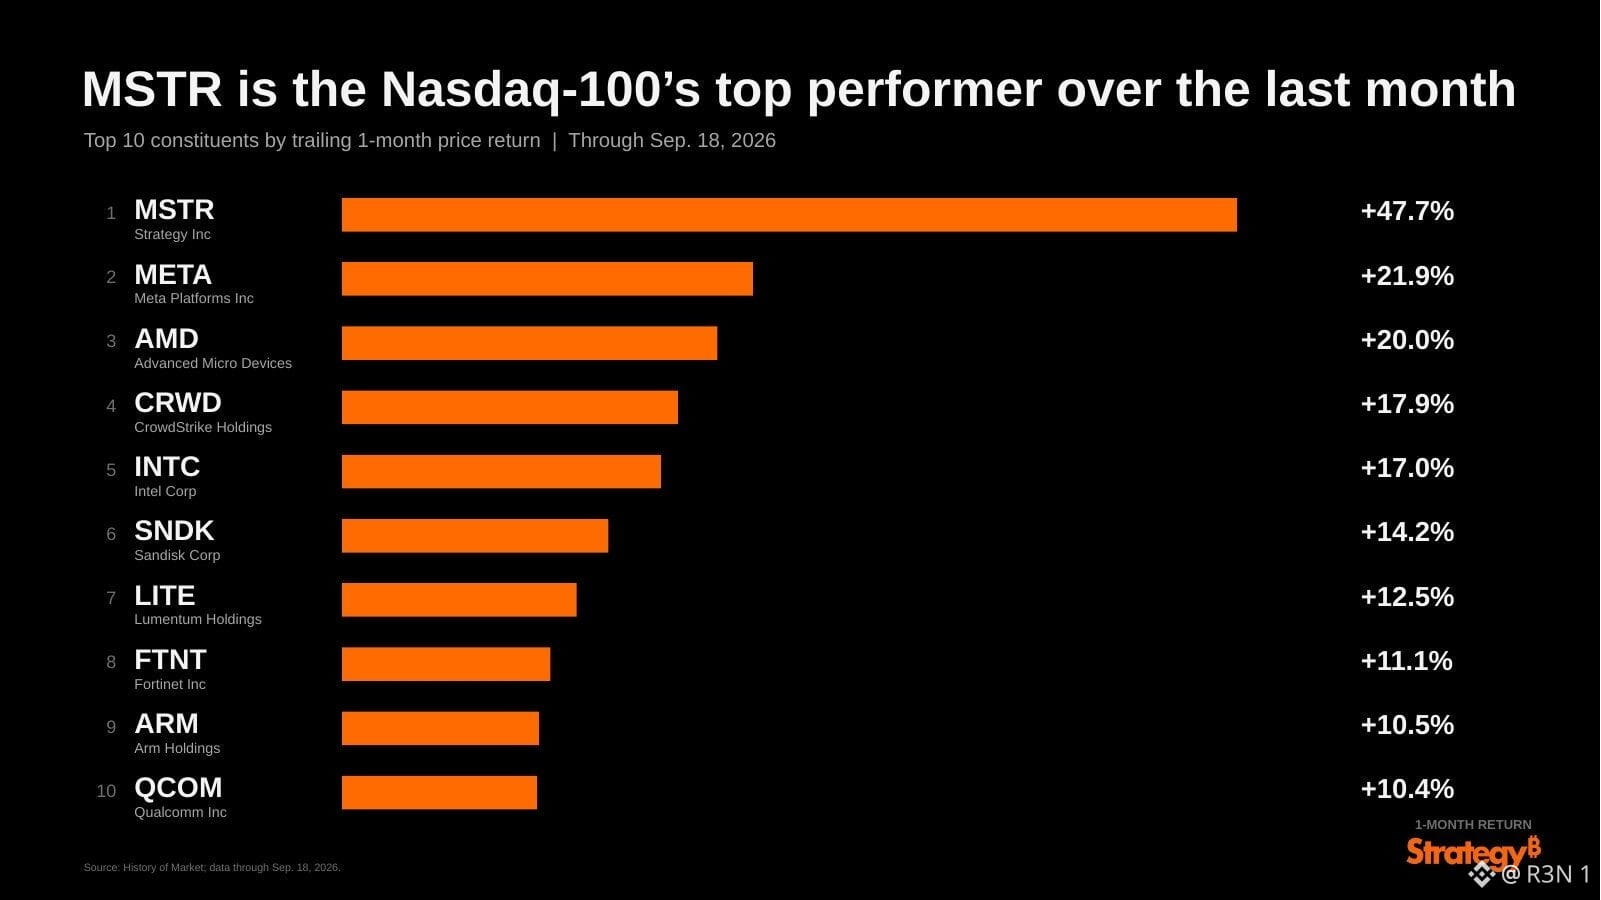
58
Увійдіть, щоб переглянути інший контент
Приєднуйтесь до користувачів криптовалют по всьому світу на Binance Square
⚡️ Отримуйте актуальну та корисну інформацію про криптовалюти.
💬 Приєднуйтесь до найбільшої у світі криптобіржі.
👍 Відкрийте справжні ідеї від перевірених авторів.
Електронна пошта / номер телефону
Трендові теми
fomcвідстеження
30,684 переглядів
317 обговорюють
📉 ФРС підвищує, а ринок святкує?
коротко по фактах:
🔸 16 вересня ставка +25 б.п., тепер 3.75%-4.00%
🔸 голосування 12-0
🔸 16 з 18 учасників FOMC за dot plot чекають ще одного підвищення
🔸 CME FedWatch: 73% на підвищення в жовтні
а $BTC за тиждень +10.2%. купують так, ніби цикл уже закінчився і гроші от-от подешевшають. за добу правда вже -2.8%, хтось таки почав читати точки)
хз яку логіку тут бачать. 16 людей з 18 прямим текстом пишуть "ще"
я на свічки зара не дивлюсь. до 27-28 жовтня сиджу в стейблах, нічого не докуповую і не шорчу
крч, у жовтні пропустять чи піднімуть ще раз? маякніть в коментах, хто на якій стороні
#fomcвідстеження
abobka
·4 вподобань
·747 переглядів
BinanceWillListHyperliquid(HYPE)
96,515 переглядів
2,124 обговорюють
FedOctoberRateHikeOddsRiseTo69.7%
24,636 переглядів
822 обговорюють