
Birendra Adhikari
4 Публікації

Birendra Adhikari
Поскаржитись
Заблокувати користувача
Only Believe In Bitcoin.
Перейти до торгівлі

Холдер BTC
Частий трейдер
5.2 р.
1 Підписки
0 Підписники
0 Вподобань
Публікації
Портфель
Усі
Відео
Переглянути переклад
$BTC Daily Update: Dipped Below $75K, Bounced Back 👀
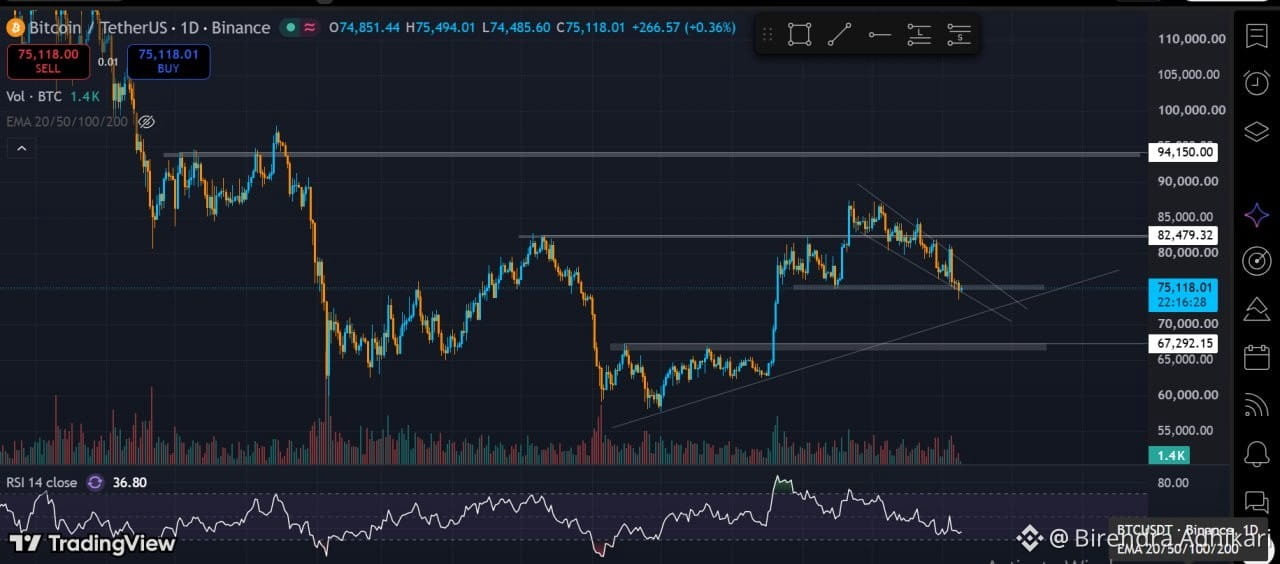
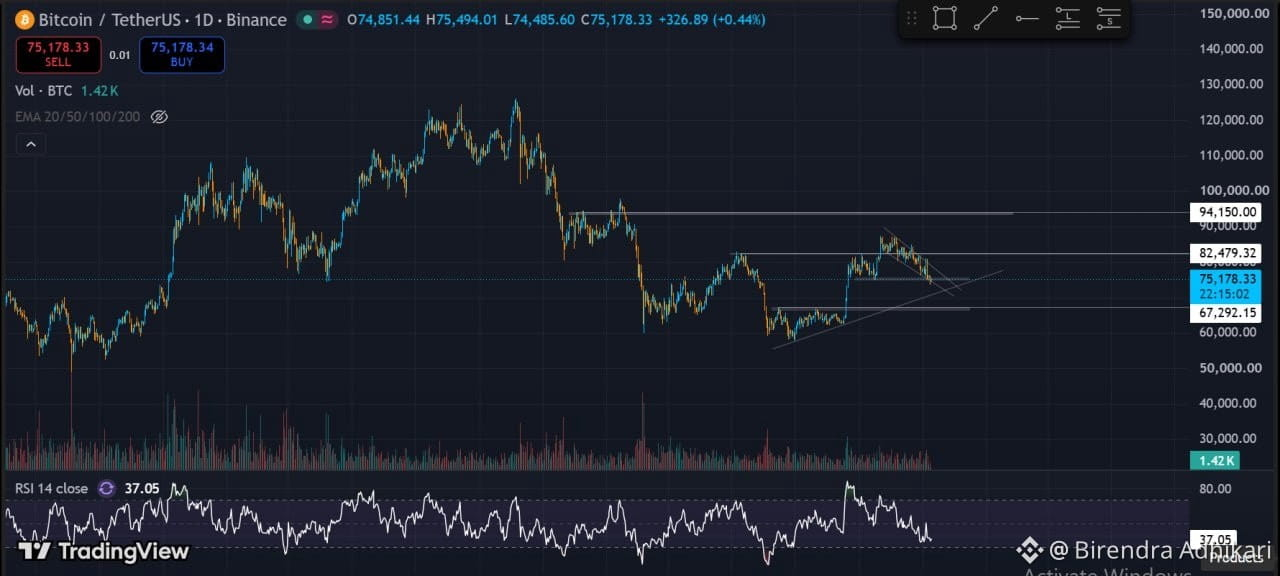
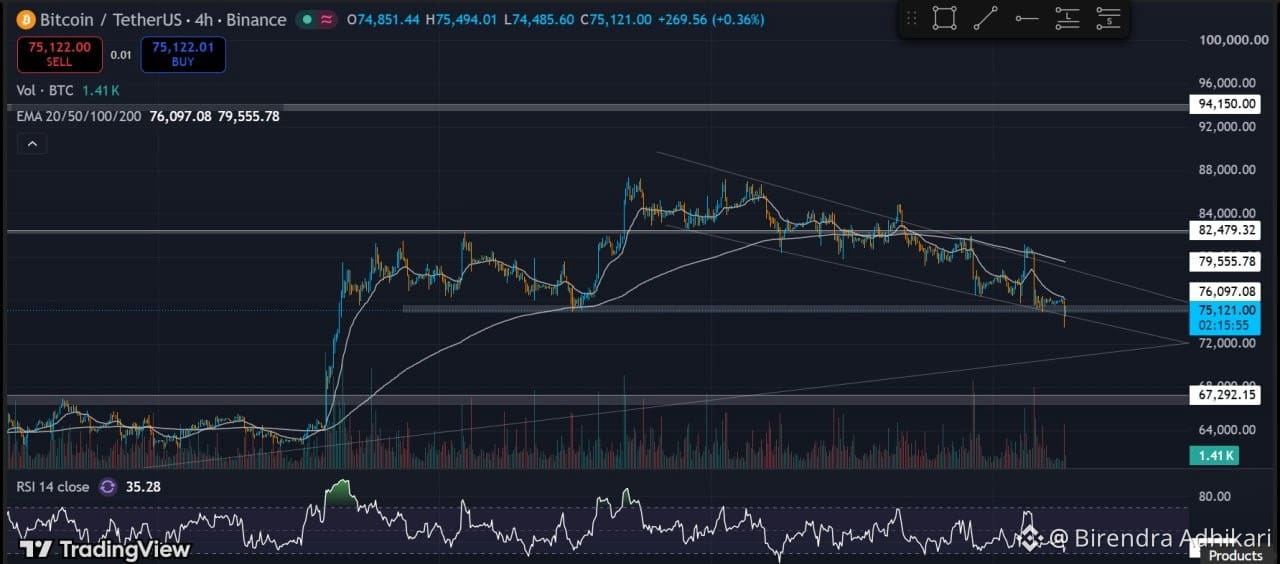
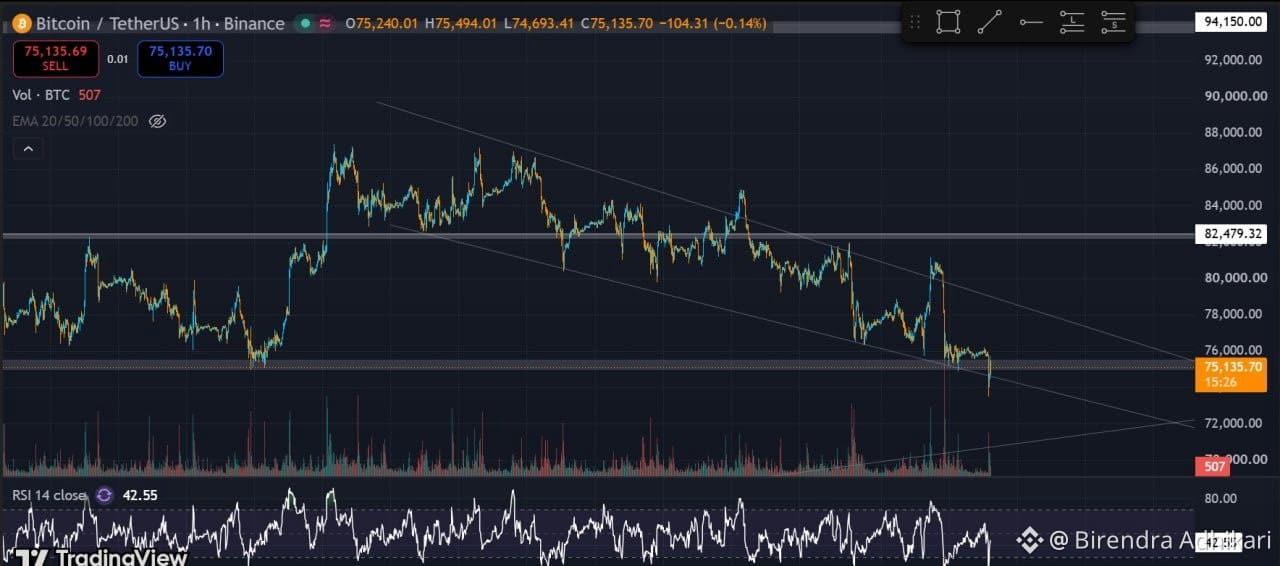
BTC is trading around $75,100 on the 1D chart. Yesterday closed near $74,850, and today price dipped to $74,485 before bouncing back above $75K.
Key levels:
🟢 Support: $75K zone, then trendline $70–71K
🔴 Resistance: $76K (4H EMA), $80K, then $82,479
⚠️ Major support: $67,292
📉 RSI: 37 (1D), 35 (4H), nearing oversold
🗓 CPI tomorrow, Nov 10 at 8:30 AM ET (7:15 PM Nepal time). Expect volatility.
My view: if $75K holds and BTC reclaims $76K, a bounce toward $80K is po
ssible. A daily close below $74.5K opens the way to $70–71K.
What's your level, bounce or breakdown? 👇
Not financial advice. Do your own research.
#BTC #Bitcoin #CryptoAnalysis #BinanceSquare
{spot}(BTCUSDT)
$BTC Daily Update: Dipped Below $75K, Bounced Back 👀
BTC is trading around $75,100 on the 1D chart. Yesterday closed near $74,850, and today price dipped to $74,485 before bouncing back above $75K.
Key levels:
🟢 Support: $75K zone, then trendline $70–71K
🔴 Resistance: $76K (4H EMA), $80K, then $82,479
⚠️ Major support: $67,292
📉 RSI: 37 (1D), 35 (4H), nearing oversold
🗓 CPI tomorrow, Nov 10 at 8:30 AM ET (7:15 PM Nepal time). Expect volatility.
My view: if $75K holds and BTC reclaims $76K, a bounce toward $80K is po
ssible. A daily close below $74.5K opens the way to $70–71K.
What's your level, bounce or breakdown? 👇
Not financial advice. Do your own research.
#BTC #Bitcoin #CryptoAnalysis #BinanceSquare
BTC is trading around $75,100 on the 1D chart. Yesterday closed near $74,850, and today price dipped to $74,485 before bouncing back above $75K.
Key levels:
🟢 Support: $75K zone, then trendline $70–71K
🔴 Resistance: $76K (4H EMA), $80K, then $82,479
⚠️ Major support: $67,292
📉 RSI: 37 (1D), 35 (4H), nearing oversold
🗓 CPI tomorrow, Nov 10 at 8:30 AM ET (7:15 PM Nepal time). Expect volatility.
My view: if $75K holds and BTC reclaims $76K, a bounce toward $80K is po
ssible. A daily close below $74.5K opens the way to $70–71K.
What's your level, bounce or breakdown? 👇
Not financial advice. Do your own research.
#BTC #Bitcoin #CryptoAnalysis #BinanceSquare
75
$BTC Щотижневий прогноз: чи втримаються $75 тис.? | 8 листопада 2026 року
$BTC Щотижневий прогноз: чи втримаються $75 тис.? | 8 листопада 2026 року
127
Верифіковано
Стаття
Переглянути переклад
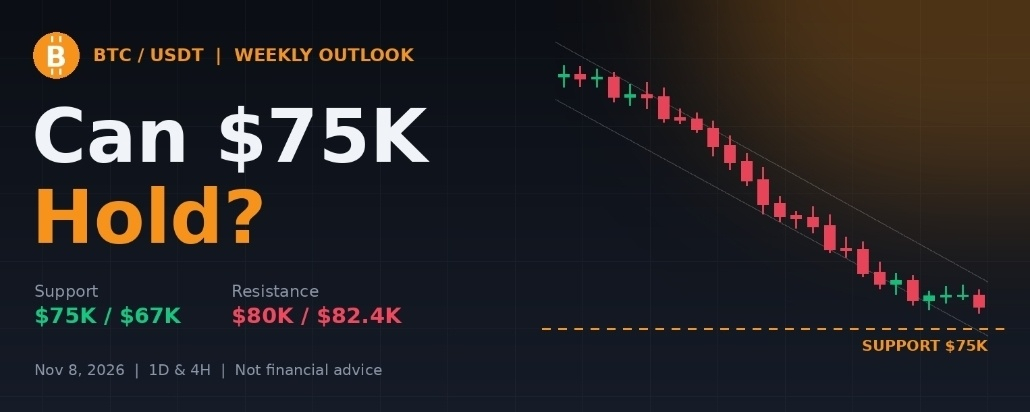
$BTC Weekly Outlook: Can $75K Hold Into a Heavy News Week? 08 November 2026📊Weekly analysis | November 8, 2026 | BTC/USDT, 1D and 4H charts
Market Overview
$BTC is trading near $75,900 after a difficult month. October closed about 7.3% lower, near $77,500, as credit conditions tightened and a record $6.3B hack hit Binance in the last days of the month. This week price dipped under $76K on Nov 5, bounced from around $75,200, and is down about 2% on the week. Despite heavy headlines, price has held the $75K zone.
Daily Chart (1D)
- 🟢 Support: $75K zone, tested again this week. Analysts also point to a cluster of long-term averages around $75.8K–76.2K.
- 📈 Rising trendline: around $70–71K
- ⚠️ Major support: $67,292
- 🔴 Resistance: EMAs near $76.5K and $78.6K, then $80K (channel top), $82,479 and $94,150
- 📉 RSI: 38, so momentum is weak but not oversold
- 📊 Volume: light during the sideways bounce, so buyers are not rushing in yet
4-Hour Chart (4H)
Price is moving sideways just above $75K, below the 4H EMAs (about $76.4K and $79.7K). RSI is near 40. This looks like a pause, not a reversal.
News to Watch
- 🏦 Fed and inflation: The Fed held in late October with no sign of easing. October CPI comes out Tuesday, Nov 10 at 8:30 AM ET. Economists expect +0.3% for the month and 3.7% year over year. A hotter number could pressure BTC, and a cooler one could help.
- 📉 ETF flows: ETFs saw roughly $290M of net outflows in October. I want to see inflows return.
- 🔐 Binance: Withdrawals reopened on Nov 1, and Binance says it has replaced about 95% of the stolen assets. Smooth completion of withdrawals matters for trust.
- 🏢 MSCI, Nov 11: The index provider decides which bitcoin treasury companies, such as Strategy, may be removed from its indices. This could affect sentiment.
Scenarios
🟢 Bullish: $75K holds, CPI is calm, and BTC breaks above $78.6K and then $80K with rising volume. Next targets are $82.4K, then the top of the range.
🔴 Bearish: $75K breaks on a hot CPI or weak flows. The next stops are the trendline at $70–71K, then $67.3K.
My Takeaway
$75K is the line this week. I'm waiting for confirmation instead of guessing, and I'll be careful around CPI day. Patience matters more than speed here.
What's your view this week: bounce or breakdown? 👇
📚 Sources
Price levels, RSI, EMAs and volume come from my own TradingView charts. The news comes from public reports:
- Charts: TradingView, BTC/USDT on Binance (1D and 4H)
- October recap, Binance hack, Fed, MSCI date: 21Shares, "Bitcoin post-Binance hack: What recovery needs in November" (Nov 3, 2026)
- This week's price move: 24/7 Wall St, "Best Crypto to Buy in November 2026" (Nov 7, 2026)
- CPI date: US Bureau of Labor Statistics release schedule
- CPI expectations: Economic Weekly (Nov 6, 2026)
Disclaimer: This is my personal analysis for education only, not financial advice. Crypto is high risk. Do your own research and manage your risk.
#BTC #Bitcoin #WeeklyOutlook #CryptoAnalysis #BinanceSquare
$BTC Weekly Outlook: Can $75K Hold Into a Heavy News Week? 08 November 2026📊
Weekly analysis | November 8, 2026 | BTC/USDT, 1D and 4H charts
Market Overview
$BTC is trading near $75,900 after a difficult month. October closed about 7.3% lower, near $77,500, as credit conditions tightened and a record $6.3B hack hit Binance in the last days of the month. This week price dipped under $76K on Nov 5, bounced from around $75,200, and is down about 2% on the week. Despite heavy headlines, price has held the $75K zone.
Daily Chart (1D)
- 🟢 Support: $75K zone, tested again this week. Analysts also point to a cluster of long-term averages around $75.8K–76.2K.
- 📈 Rising trendline: around $70–71K
- ⚠️ Major support: $67,292
- 🔴 Resistance: EMAs near $76.5K and $78.6K, then $80K (channel top), $82,479 and $94,150
- 📉 RSI: 38, so momentum is weak but not oversold
- 📊 Volume: light during the sideways bounce, so buyers are not rushing in yet
4-Hour Chart (4H)
Price is moving sideways just above $75K, below the 4H EMAs (about $76.4K and $79.7K). RSI is near 40. This looks like a pause, not a reversal.
News to Watch
- 🏦 Fed and inflation: The Fed held in late October with no sign of easing. October CPI comes out Tuesday, Nov 10 at 8:30 AM ET. Economists expect +0.3% for the month and 3.7% year over year. A hotter number could pressure BTC, and a cooler one could help.
- 📉 ETF flows: ETFs saw roughly $290M of net outflows in October. I want to see inflows return.
- 🔐 Binance: Withdrawals reopened on Nov 1, and Binance says it has replaced about 95% of the stolen assets. Smooth completion of withdrawals matters for trust.
- 🏢 MSCI, Nov 11: The index provider decides which bitcoin treasury companies, such as Strategy, may be removed from its indices. This could affect sentiment.
Scenarios
🟢 Bullish: $75K holds, CPI is calm, and BTC breaks above $78.6K and then $80K with rising volume. Next targets are $82.4K, then the top of the range.
🔴 Bearish: $75K breaks on a hot CPI or weak flows. The next stops are the trendline at $70–71K, then $67.3K.
My Takeaway
$75K is the line this week. I'm waiting for confirmation instead of guessing, and I'll be careful around CPI day. Patience matters more than speed here.
What's your view this week: bounce or breakdown? 👇
📚 Sources
Price levels, RSI, EMAs and volume come from my own TradingView charts. The news comes from public reports:
- Charts: TradingView, BTC/USDT on Binance (1D and 4H)
- October recap, Binance hack, Fed, MSCI date: 21Shares, "Bitcoin post-Binance hack: What recovery needs in November" (Nov 3, 2026)
- This week's price move: 24/7 Wall St, "Best Crypto to Buy in November 2026" (Nov 7, 2026)
- CPI date: US Bureau of Labor Statistics release schedule
- CPI expectations: Economic Weekly (Nov 6, 2026)
Disclaimer: This is my personal analysis for education only, not financial advice. Crypto is high risk. Do your own research and manage your risk.
#BTC #Bitcoin #WeeklyOutlook #CryptoAnalysis #BinanceSquare
Market Overview
$BTC is trading near $75,900 after a difficult month. October closed about 7.3% lower, near $77,500, as credit conditions tightened and a record $6.3B hack hit Binance in the last days of the month. This week price dipped under $76K on Nov 5, bounced from around $75,200, and is down about 2% on the week. Despite heavy headlines, price has held the $75K zone.
Daily Chart (1D)
- 🟢 Support: $75K zone, tested again this week. Analysts also point to a cluster of long-term averages around $75.8K–76.2K.
- 📈 Rising trendline: around $70–71K
- ⚠️ Major support: $67,292
- 🔴 Resistance: EMAs near $76.5K and $78.6K, then $80K (channel top), $82,479 and $94,150
- 📉 RSI: 38, so momentum is weak but not oversold
- 📊 Volume: light during the sideways bounce, so buyers are not rushing in yet
4-Hour Chart (4H)
Price is moving sideways just above $75K, below the 4H EMAs (about $76.4K and $79.7K). RSI is near 40. This looks like a pause, not a reversal.
News to Watch
- 🏦 Fed and inflation: The Fed held in late October with no sign of easing. October CPI comes out Tuesday, Nov 10 at 8:30 AM ET. Economists expect +0.3% for the month and 3.7% year over year. A hotter number could pressure BTC, and a cooler one could help.
- 📉 ETF flows: ETFs saw roughly $290M of net outflows in October. I want to see inflows return.
- 🔐 Binance: Withdrawals reopened on Nov 1, and Binance says it has replaced about 95% of the stolen assets. Smooth completion of withdrawals matters for trust.
- 🏢 MSCI, Nov 11: The index provider decides which bitcoin treasury companies, such as Strategy, may be removed from its indices. This could affect sentiment.
Scenarios
🟢 Bullish: $75K holds, CPI is calm, and BTC breaks above $78.6K and then $80K with rising volume. Next targets are $82.4K, then the top of the range.
🔴 Bearish: $75K breaks on a hot CPI or weak flows. The next stops are the trendline at $70–71K, then $67.3K.
My Takeaway
$75K is the line this week. I'm waiting for confirmation instead of guessing, and I'll be careful around CPI day. Patience matters more than speed here.
What's your view this week: bounce or breakdown? 👇
📚 Sources
Price levels, RSI, EMAs and volume come from my own TradingView charts. The news comes from public reports:
- Charts: TradingView, BTC/USDT on Binance (1D and 4H)
- October recap, Binance hack, Fed, MSCI date: 21Shares, "Bitcoin post-Binance hack: What recovery needs in November" (Nov 3, 2026)
- This week's price move: 24/7 Wall St, "Best Crypto to Buy in November 2026" (Nov 7, 2026)
- CPI date: US Bureau of Labor Statistics release schedule
- CPI expectations: Economic Weekly (Nov 6, 2026)
Disclaimer: This is my personal analysis for education only, not financial advice. Crypto is high risk. Do your own research and manage your risk.
#BTC #Bitcoin #WeeklyOutlook #CryptoAnalysis #BinanceSquare
266
$BTC Щоденне оновлення: підтримка на рівні $75K утримується 👀
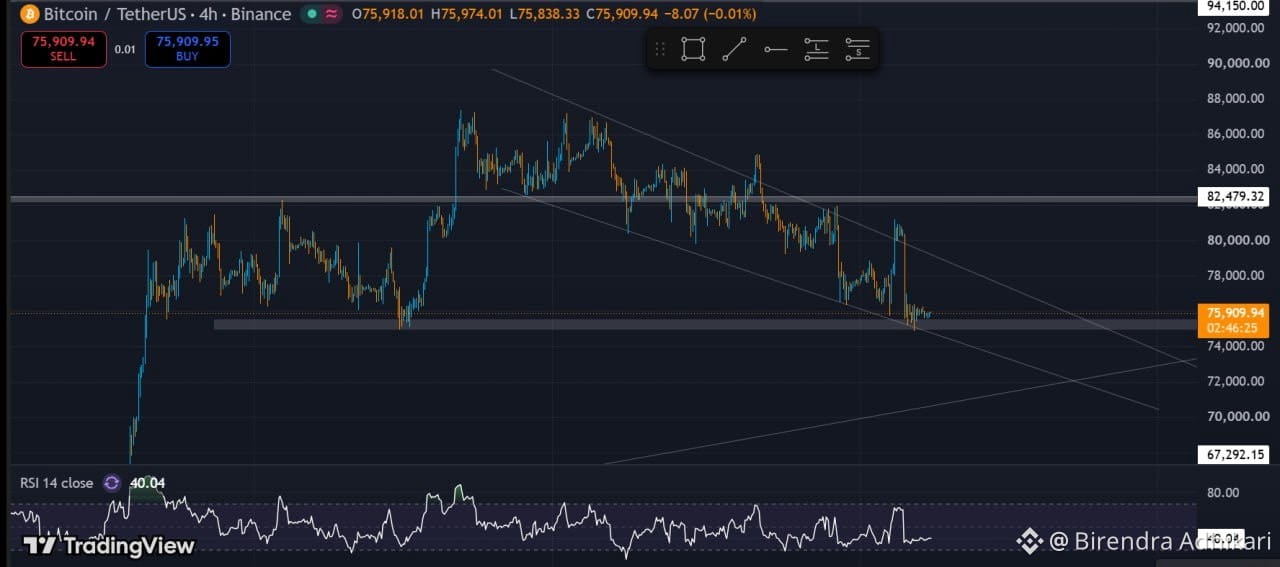
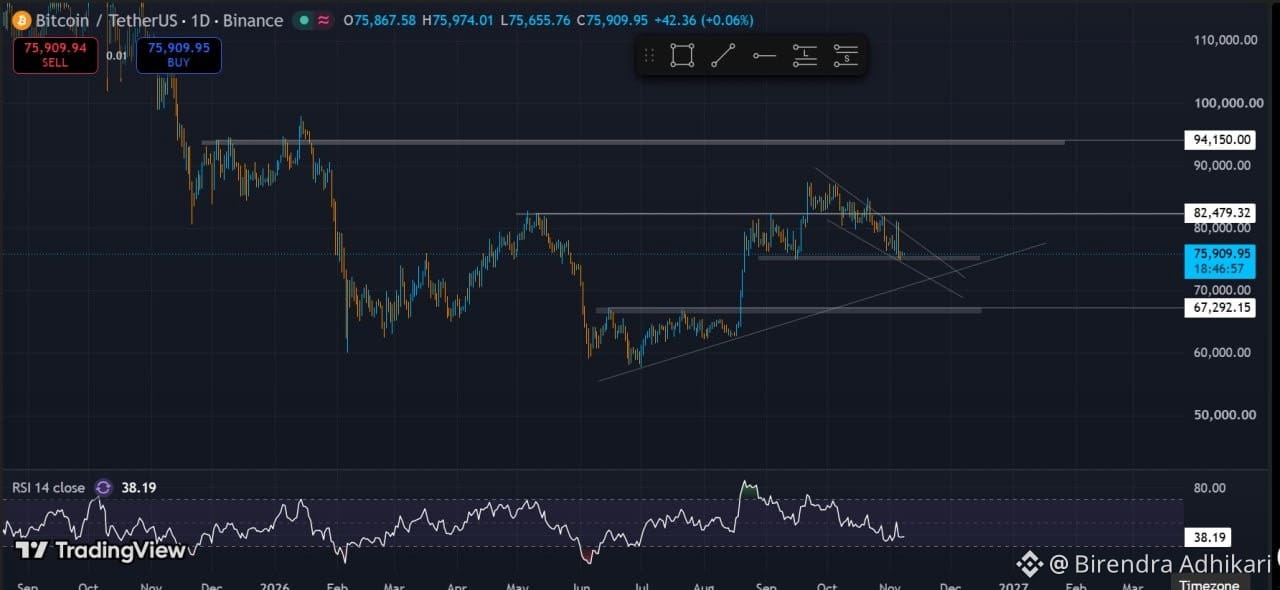
На денному графіку BTC торгується близько $75,900, тримаючись прямо на рівні підтримки після відкату всередину низхідного каналу. На графіку 4H ціна рухається вбік, що може означати паузу перед наступним рухом.
Ключові рівні:
🟢 Підтримка: зона $75K
📈 Підтримка лінії тренду: близько $70K–71K
⚠️ Основна підтримка: $67,292
🔴 Опір: $80K (верхня межа каналу), далі $82,479
🎯 Наступний сильний опір: $94,150
📉 RSI: 38 на денному графіку та 40 на графіку 4H, тож імпульс слабкий, але тиск продажів сповільнюється
Моя думка: якщо рівень $75K утримається, а BTC проб'є $80K, можливий рух до $82K. Якщо $75K буде пробито вниз, стежитиму за лінією тренду біля $70K–71K, а далі — за $67K.
Який ваш рівень — відскок чи пробій вниз? 👇
Це не фінансова порада. Проведіть власне дослідження.
#BTC #Bitcoin #CryptoAnalysis #BinanceSquare
$BTC Щоденне оновлення: підтримка на рівні $75K утримується 👀
На денному графіку BTC торгується близько $75,900, тримаючись прямо на рівні підтримки після відкату всередину низхідного каналу. На графіку 4H ціна рухається вбік, що може означати паузу перед наступним рухом.
Ключові рівні:
🟢 Підтримка: зона $75K
📈 Підтримка лінії тренду: близько $70K–71K
⚠️ Основна підтримка: $67,292
🔴 Опір: $80K (верхня межа каналу), далі $82,479
🎯 Наступний сильний опір: $94,150
📉 RSI: 38 на денному графіку та 40 на графіку 4H, тож імпульс слабкий, але тиск продажів сповільнюється
Моя думка: якщо рівень $75K утримається, а BTC проб'є $80K, можливий рух до $82K. Якщо $75K буде пробито вниз, стежитиму за лінією тренду біля $70K–71K, а далі — за $67K.
Який ваш рівень — відскок чи пробій вниз? 👇
Це не фінансова порада. Проведіть власне дослідження.
#BTC #Bitcoin #CryptoAnalysis #BinanceSquare
На денному графіку BTC торгується близько $75,900, тримаючись прямо на рівні підтримки після відкату всередину низхідного каналу. На графіку 4H ціна рухається вбік, що може означати паузу перед наступним рухом.
Ключові рівні:
🟢 Підтримка: зона $75K
📈 Підтримка лінії тренду: близько $70K–71K
⚠️ Основна підтримка: $67,292
🔴 Опір: $80K (верхня межа каналу), далі $82,479
🎯 Наступний сильний опір: $94,150
📉 RSI: 38 на денному графіку та 40 на графіку 4H, тож імпульс слабкий, але тиск продажів сповільнюється
Моя думка: якщо рівень $75K утримається, а BTC проб'є $80K, можливий рух до $82K. Якщо $75K буде пробито вниз, стежитиму за лінією тренду біля $70K–71K, а далі — за $67K.
Який ваш рівень — відскок чи пробій вниз? 👇
Це не фінансова порада. Проведіть власне дослідження.
#BTC #Bitcoin #CryptoAnalysis #BinanceSquare
116
Увійдіть, щоб переглянути інший контент
Приєднуйтесь до користувачів криптовалют по всьому світу на Binance Square
⚡️ Отримуйте актуальну та корисну інформацію про криптовалюти.
💬 Приєднуйтесь до найбільшої у світі криптобіржі.
👍 Відкрийте справжні ідеї від перевірених авторів.
Електронна пошта / номер телефону
Трендові теми
fomcвідстеження
111,210 переглядів
523 обговорюють
#fomcвідстеження Жовтневий ІСЦ США у центрі уваги: ринки оцінюють перспективи підвищення ставок у грудні
Дані щодо інфляції у США, які мають оприлюднити наступного тижня, будуть під пильною увагою інвесторів, які оцінюватимуть, чи можуть стійкі цінові чинники спонукати Федеральну резервну систему знову підвищити процентні ставки у грудні. Водночас дедалі більші побоювання щодо інвестиційного буму у сфері ШІ та його потенційного впливу на економічне зростання додають невизначеності прогнозам щодо монетарної політики.$AAPLB
SergioDiaz
·1 вподобань
·108 переглядів
NvidiaInvestigatesAfterHuang’sAffairApology
20,201 переглядів
278 обговорюють
BitcoinFiveWeeklyLosses
34,572 переглядів
705 обговорюють