
beeple-1
154 Публікації

beeple-1
Поскаржитись
Заблокувати користувача
0 Підписки
3 Підписники
2 Вподобань
Публікації
·
--
Переглянути переклад
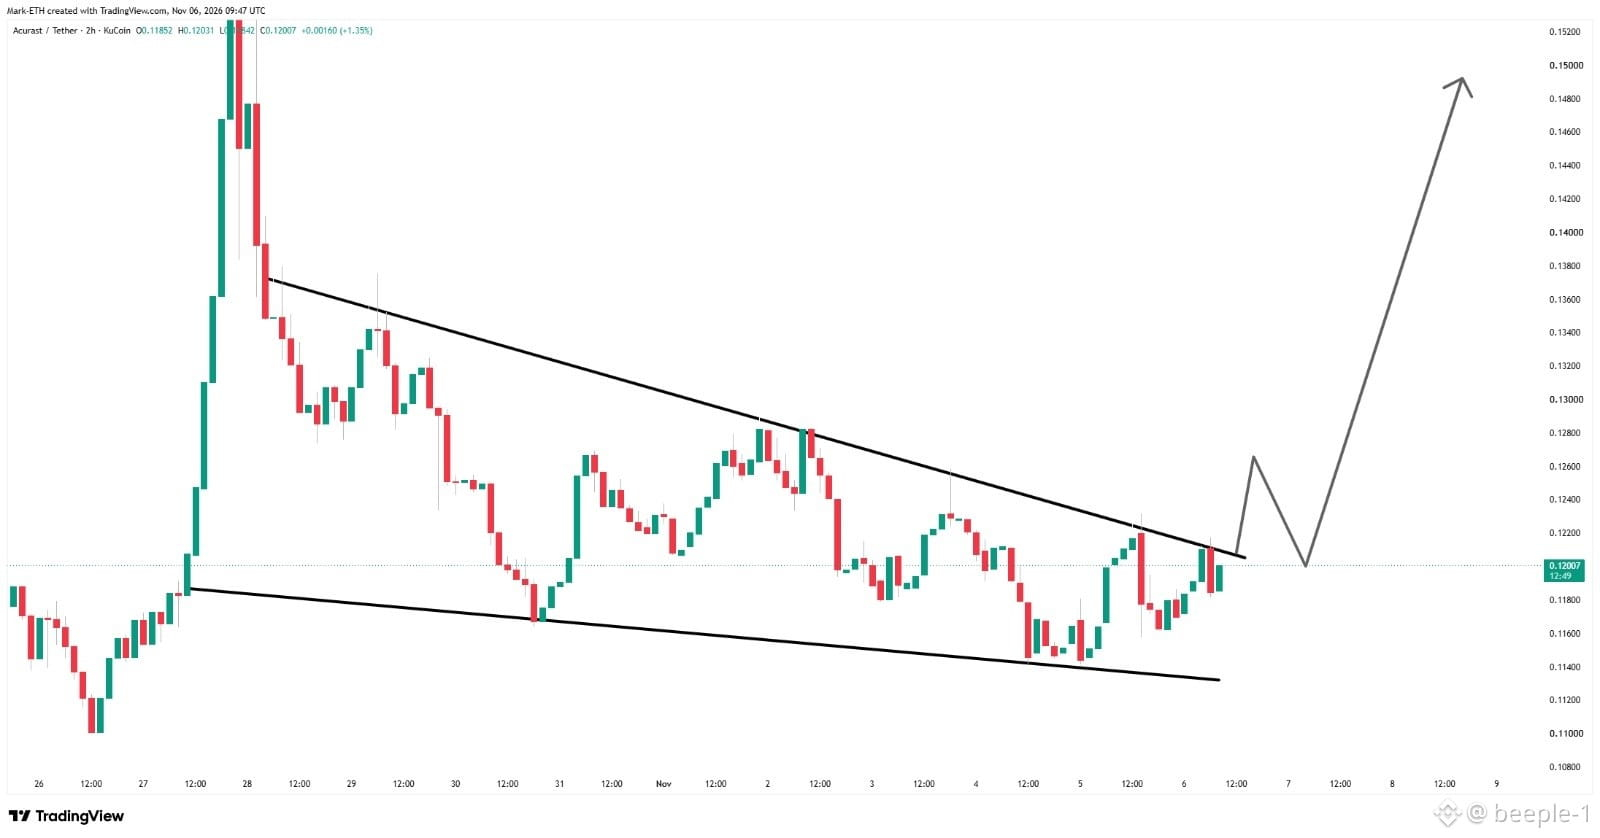
Still waiting for $ACU to break the upper trendline of its descending channel around $0.120.
A clean breakout could open the way toward $0.126 and $0.150. Rejection may bring another test of $0.115 support.
Watching for confirmation before getting bullish.
Take a closer look from my refferal:ns2dj
#ACU #acurast
Still waiting for $ACU to break the upper trendline of its descending channel around $0.120.
A clean breakout could open the way toward $0.126 and $0.150. Rejection may bring another test of $0.115 support.
Watching for confirmation before getting bullish.
Take a closer look from my refferal:ns2dj
#ACU #acurast
A clean breakout could open the way toward $0.126 and $0.150. Rejection may bring another test of $0.115 support.
Watching for confirmation before getting bullish.
Take a closer look from my refferal:ns2dj
#ACU #acurast
·
--
Переглянути переклад
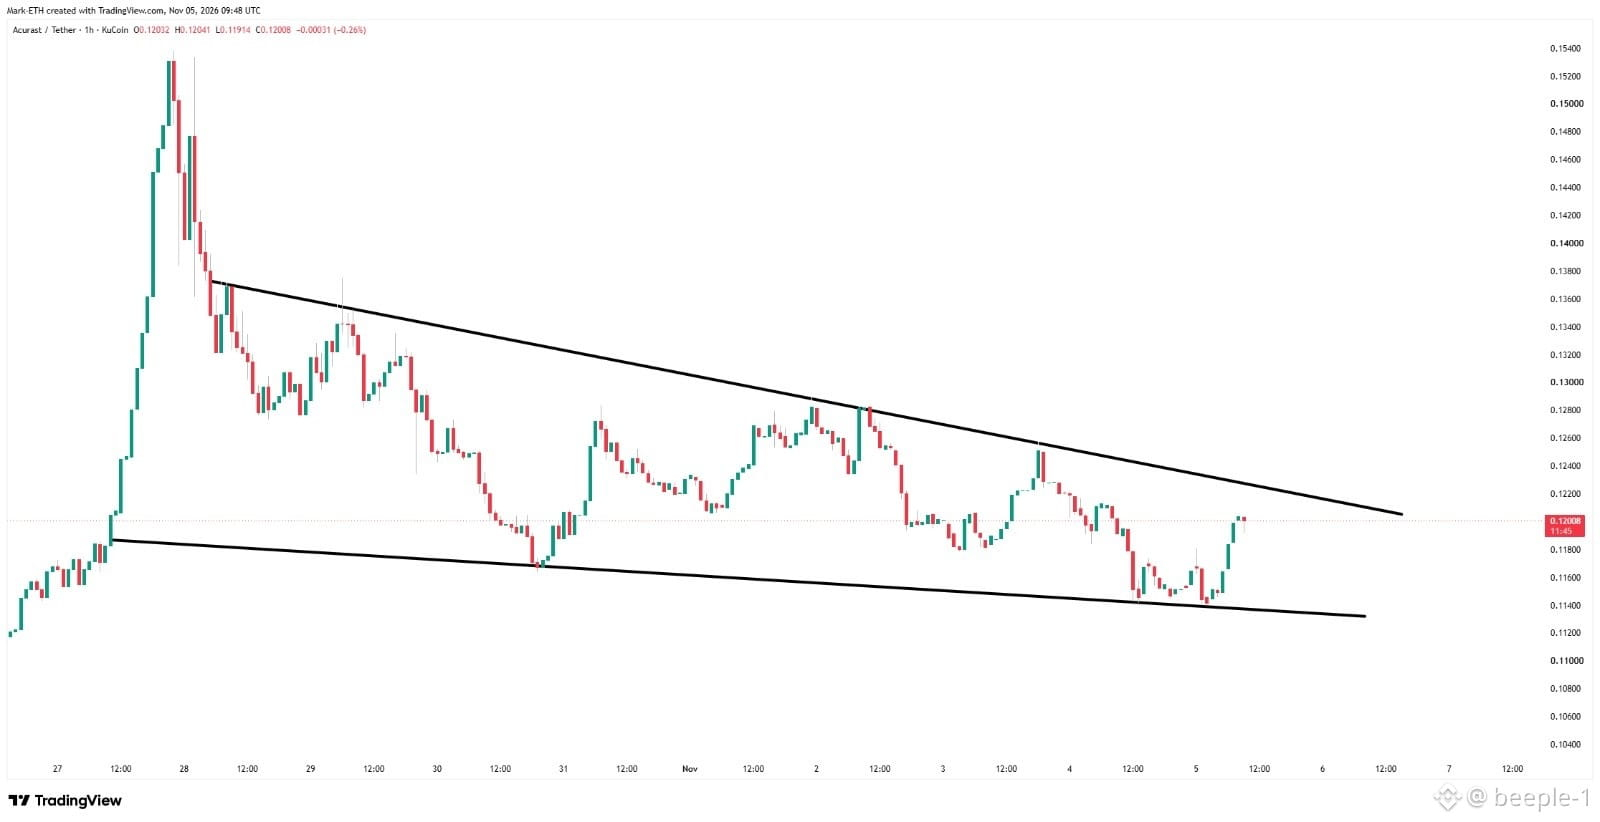
$ACU is bouncing off the lower trendline, but the descending channel is still in control.
A reclaim of $0.122–$0.124 could open the door for a move toward $0.128.
If support fails, another downside test is on the table.
Watching for a breakout, not chasing the bounce.
#acurast #acu
$ACU is bouncing off the lower trendline, but the descending channel is still in control.
A reclaim of $0.122–$0.124 could open the door for a move toward $0.128.
If support fails, another downside test is on the table.
Watching for a breakout, not chasing the bounce.
#acurast #acu
A reclaim of $0.122–$0.124 could open the door for a move toward $0.128.
If support fails, another downside test is on the table.
Watching for a breakout, not chasing the bounce.
#acurast #acu
·
--
Переглянути переклад
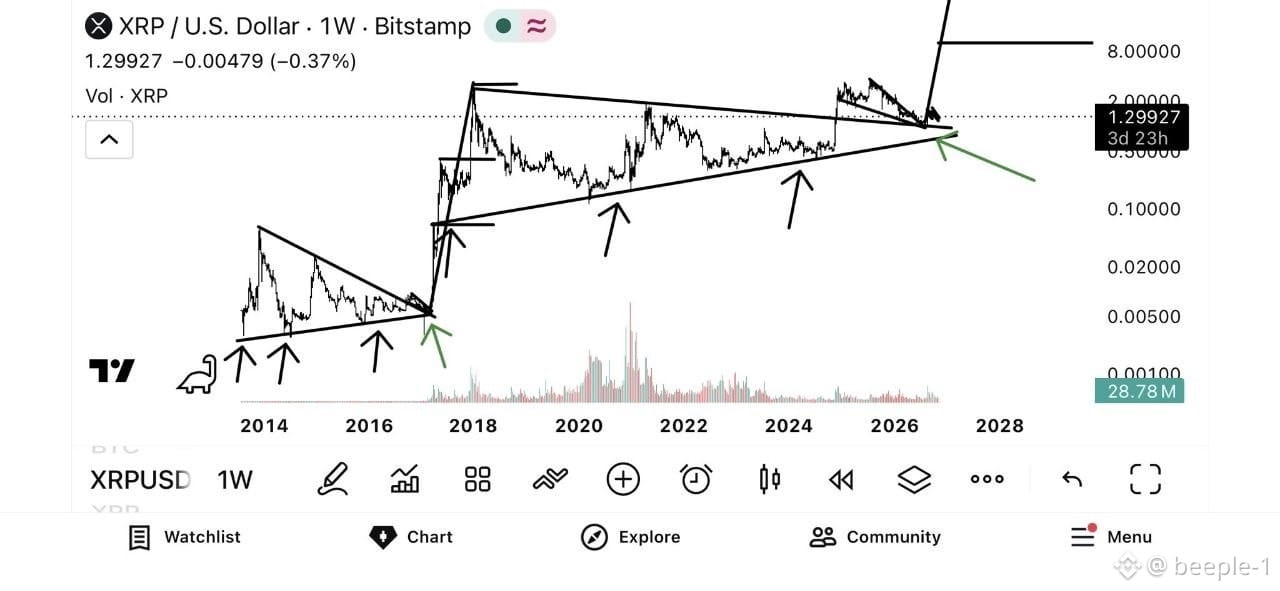
$XRP is approaching a make-or-break moment on the weekly chart. 👀
Years of price action have compressed into a massive symmetrical triangle, with resistance descending and support rising
.
Now price is testing the apex near $1.30.
A clean breakout could open the door toward $2 and potentially $8 in the long run.
But lose the rising support, and the structure could fail.
The next weekly move could define XRP’s bigger trend.
#BTC Price Analysis# #Macro Insights# #Altcoin Season# #Meme Alpha# #BNBChain#
$XRP is approaching a make-or-break moment on the weekly chart. 👀
Years of price action have compressed into a massive symmetrical triangle, with resistance descending and support rising
.
Now price is testing the apex near $1.30.
A clean breakout could open the door toward $2 and potentially $8 in the long run.
But lose the rising support, and the structure could fail.
The next weekly move could define XRP’s bigger trend.
#BTC Price Analysis# #Macro Insights# #Altcoin Season# #Meme Alpha# #BNBChain#
Years of price action have compressed into a massive symmetrical triangle, with resistance descending and support rising
.
Now price is testing the apex near $1.30.
A clean breakout could open the door toward $2 and potentially $8 in the long run.
But lose the rising support, and the structure could fail.
The next weekly move could define XRP’s bigger trend.
#BTC Price Analysis# #Macro Insights# #Altcoin Season# #Meme Alpha# #BNBChain#
58
·
--
Переглянути переклад
$ACU is bringing decentralized compute to another level.
Over 353K phones onboarded, 1.1B on-chain transactions, and now a Bithumb listing.
Acurast is turning everyday smartphones into a global compute network. This is real infrastructure with growing adoption.
Another big step for the DePIN space. 🚀
#Acurast #ACU
$ACU is bringing decentralized compute to another level.
Over 353K phones onboarded, 1.1B on-chain transactions, and now a Bithumb listing.
Acurast is turning everyday smartphones into a global compute network. This is real infrastructure with growing adoption.
Another big step for the DePIN space. 🚀
#Acurast #ACU
Over 353K phones onboarded, 1.1B on-chain transactions, and now a Bithumb listing.
Acurast is turning everyday smartphones into a global compute network. This is real infrastructure with growing adoption.
Another big step for the DePIN space. 🚀
#Acurast #ACU

·
--
Переглянути переклад
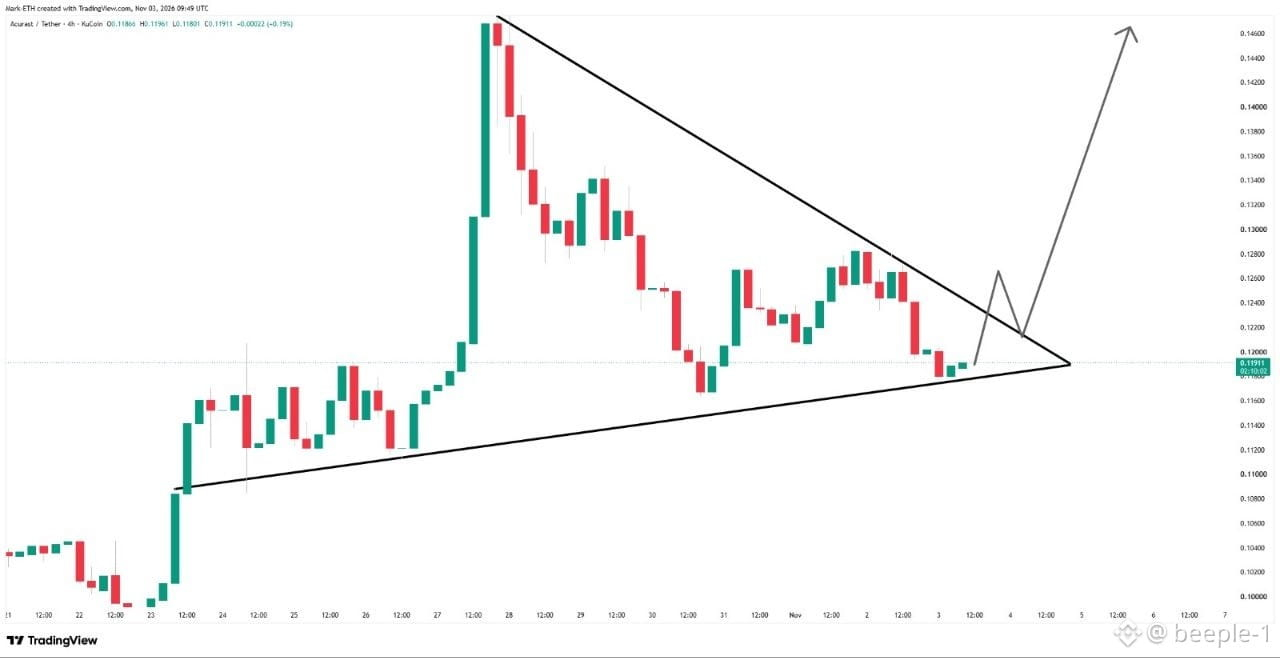
$ACU is tightening inside a symmetrical triangle. 👀
A breakout above the trendline could open a move toward $0.135–$0.145.
Acurast’s smartphone-powered DePIN vision makes this setup worth watching.
Patience for confirmation, no chasing.
$ACU is tightening inside a symmetrical triangle. 👀
A breakout above the trendline could open a move toward $0.135–$0.145.
Acurast’s smartphone-powered DePIN vision makes this setup worth watching.
Patience for confirmation, no chasing.
A breakout above the trendline could open a move toward $0.135–$0.145.
Acurast’s smartphone-powered DePIN vision makes this setup worth watching.
Patience for confirmation, no chasing.
·
--
Переглянути переклад
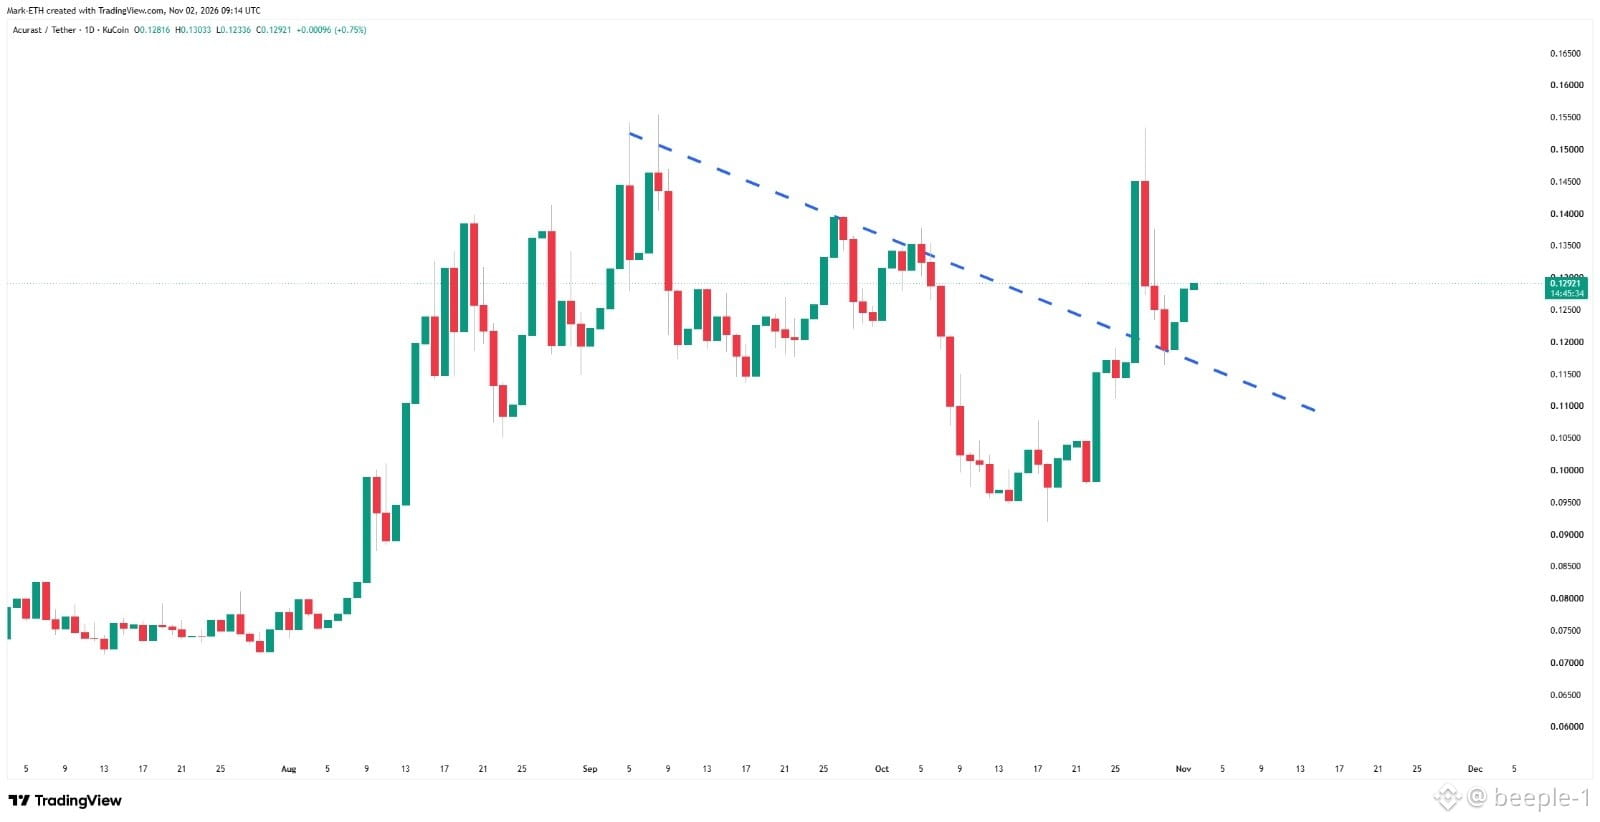
$ACU is showing signs of a trend reversal on the 1D chart.
Price has broken above a multi-month descending trendline and is now retesting it as potential support.
The key is holding $0.125–$0.128.
A successful hold could open the path toward $0.140, followed by $0.150–$0.155.
Lose this zone, and the breakout risks turning into a bull trap.
Watching the daily close for confirmation.
Join with my code: ns2dj
#BTC Price Analysis# #Macro Insights# #Altcoin Season# #Meme Alpha# #BNBChain#
$ACU is showing signs of a trend reversal on the 1D chart.
Price has broken above a multi-month descending trendline and is now retesting it as potential support.
The key is holding $0.125–$0.128.
A successful hold could open the path toward $0.140, followed by $0.150–$0.155.
Lose this zone, and the breakout risks turning into a bull trap.
Watching the daily close for confirmation.
Join with my code: ns2dj
#BTC Price Analysis# #Macro Insights# #Altcoin Season# #Meme Alpha# #BNBChain#
Price has broken above a multi-month descending trendline and is now retesting it as potential support.
The key is holding $0.125–$0.128.
A successful hold could open the path toward $0.140, followed by $0.150–$0.155.
Lose this zone, and the breakout risks turning into a bull trap.
Watching the daily close for confirmation.
Join with my code: ns2dj
#BTC Price Analysis# #Macro Insights# #Altcoin Season# #Meme Alpha# #BNBChain#
67
·
--
Переглянути переклад
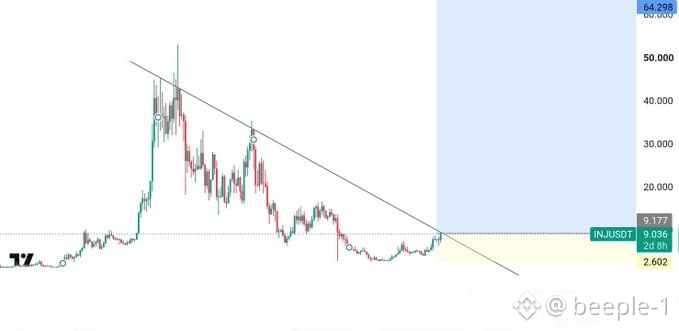
$INJ is squeezing into a major resistance zone 👀
One decisive move could change the whole chart.
#BTC Price Analysis# #Macro Insights# #Altcoin Season# #Meme Alpha# #BNBChain#
$INJ is squeezing into a major resistance zone 👀
One decisive move could change the whole chart.
#BTC Price Analysis# #Macro Insights# #Altcoin Season# #Meme Alpha# #BNBChain#
One decisive move could change the whole chart.
#BTC Price Analysis# #Macro Insights# #Altcoin Season# #Meme Alpha# #BNBChain#
66
·
--
Переглянути переклад
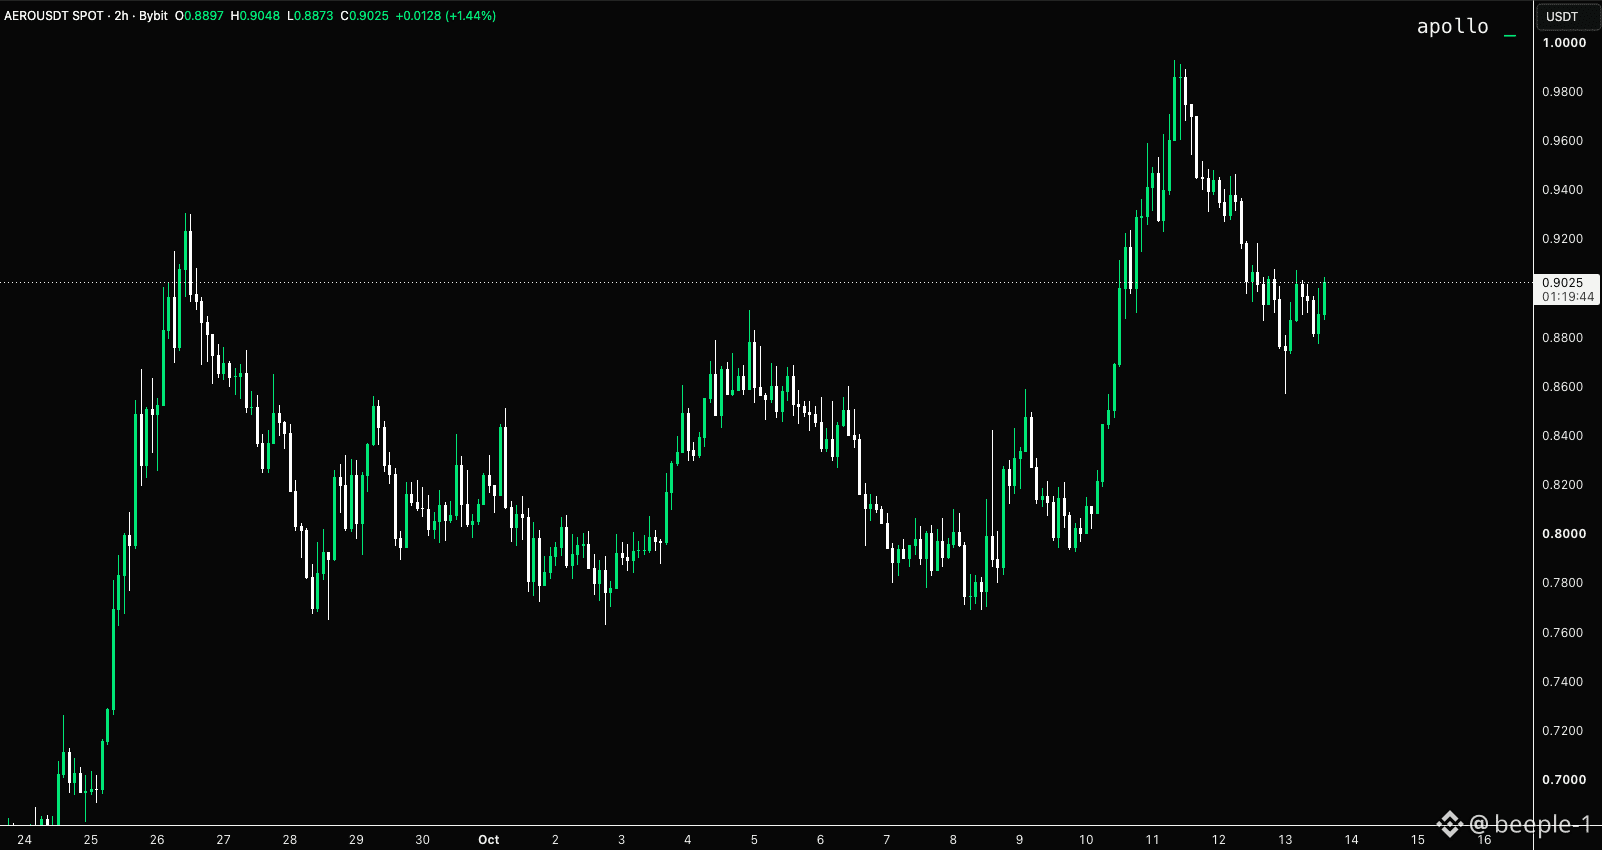
$AERO is cooling off after a strong rally, but buyers haven’t fully disappeared. 👀
Price is holding around $0.88–$0.90 after rejecting near $0.99.
Reclaim $0.94 and the next push toward $0.98–$1.00 gets interesting. Lose $0.88, and a deeper pullback could follow.
Watching the next move, not chasing the last one.
#BTC Price Analysis# #Macro Insights# #Altcoin Season# #Meme Alpha# #BNBChain#
$AERO is cooling off after a strong rally, but buyers haven’t fully disappeared. 👀
Price is holding around $0.88–$0.90 after rejecting near $0.99.
Reclaim $0.94 and the next push toward $0.98–$1.00 gets interesting. Lose $0.88, and a deeper pullback could follow.
Watching the next move, not chasing the last one.
#BTC Price Analysis# #Macro Insights# #Altcoin Season# #Meme Alpha# #BNBChain#
Price is holding around $0.88–$0.90 after rejecting near $0.99.
Reclaim $0.94 and the next push toward $0.98–$1.00 gets interesting. Lose $0.88, and a deeper pullback could follow.
Watching the next move, not chasing the last one.
#BTC Price Analysis# #Macro Insights# #Altcoin Season# #Meme Alpha# #BNBChain#
68
·
--
Переглянути переклад
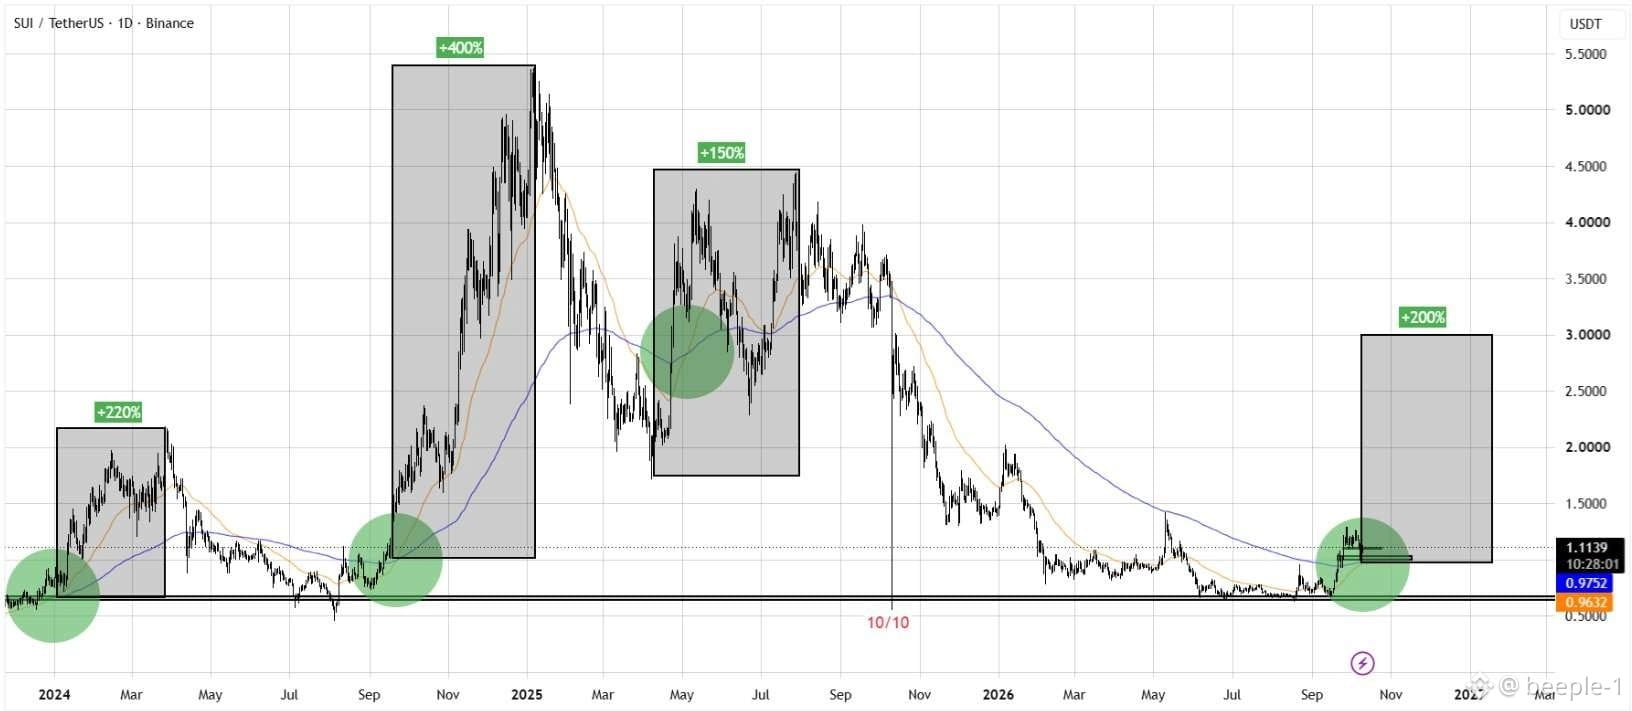
$SUI might be setting up for another big move.
Every major rally started near a similar base. Now price is back at that zone, trying to build momentum again.
History doesn’t guarantee a repeat, but this is a level worth watching.
If the pattern plays out, $SUI could surprise a lot of people.
#BTC Price Analysis# #Macro Insights# #Altcoin Season# #Meme Alpha# #BNBChain#
$SUI might be setting up for another big move.
Every major rally started near a similar base. Now price is back at that zone, trying to build momentum again.
History doesn’t guarantee a repeat, but this is a level worth watching.
If the pattern plays out, $SUI could surprise a lot of people.
#BTC Price Analysis# #Macro Insights# #Altcoin Season# #Meme Alpha# #BNBChain#
Every major rally started near a similar base. Now price is back at that zone, trying to build momentum again.
History doesn’t guarantee a repeat, but this is a level worth watching.
If the pattern plays out, $SUI could surprise a lot of people.
#BTC Price Analysis# #Macro Insights# #Altcoin Season# #Meme Alpha# #BNBChain#
85
·
--
$ZEC
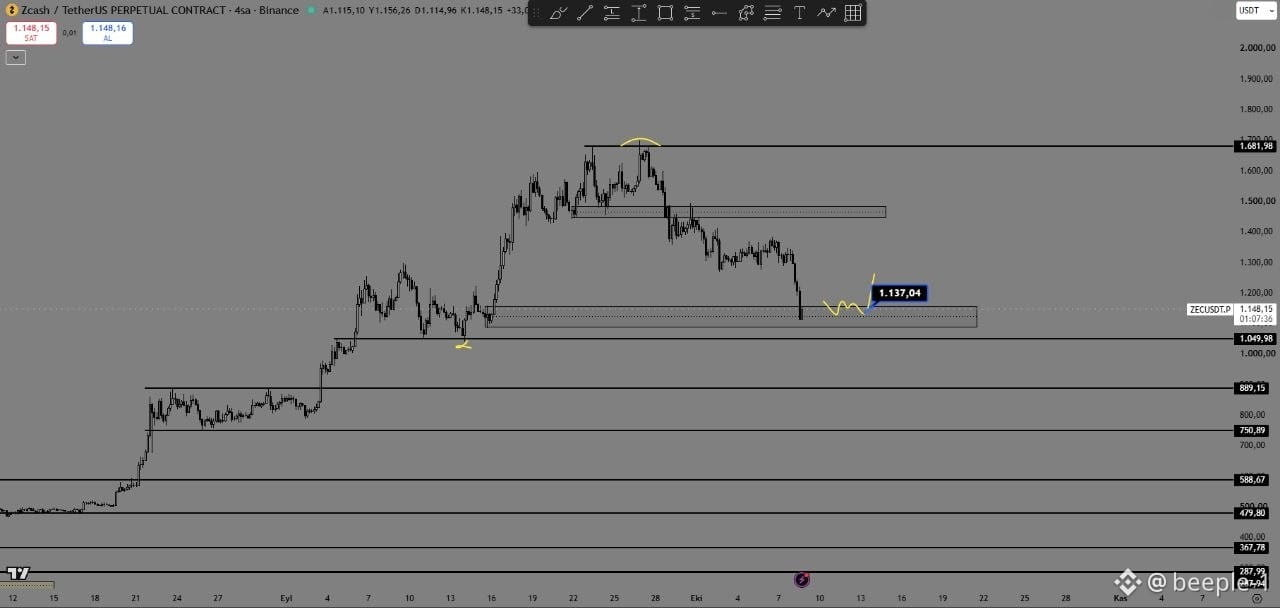
Цей відкат якраз опинився там, де я й хотів.
$1,050–$1,100 — ключова зона попиту. Якщо покупці втримають її та повернуть ціну вище $1,137, я насамперед стежитиму за рівнем $1,450, а згодом — за зоною історичного максимуму $1,680.
Простий сетап. Нехай ціна його підтвердить.
#АналізЦіниBTC# #МакроОгляди# #СезонАльткоїнів# #АльфаМемкоїнів# #BNBChain#
$ZEC
Цей відкат якраз опинився там, де я й хотів.
$1,050–$1,100 — ключова зона попиту. Якщо покупці втримають її та повернуть ціну вище $1,137, я насамперед стежитиму за рівнем $1,450, а згодом — за зоною історичного максимуму $1,680.
Простий сетап. Нехай ціна його підтвердить.
#АналізЦіниBTC# #МакроОгляди# #СезонАльткоїнів# #АльфаМемкоїнів# #BNBChain#
Цей відкат якраз опинився там, де я й хотів.
$1,050–$1,100 — ключова зона попиту. Якщо покупці втримають її та повернуть ціну вище $1,137, я насамперед стежитиму за рівнем $1,450, а згодом — за зоною історичного максимуму $1,680.
Простий сетап. Нехай ціна його підтвердить.
#АналізЦіниBTC# #МакроОгляди# #СезонАльткоїнів# #АльфаМемкоїнів# #BNBChain#
67
·
--
$DOGE починає виглядати цікаво на старших таймфреймах.
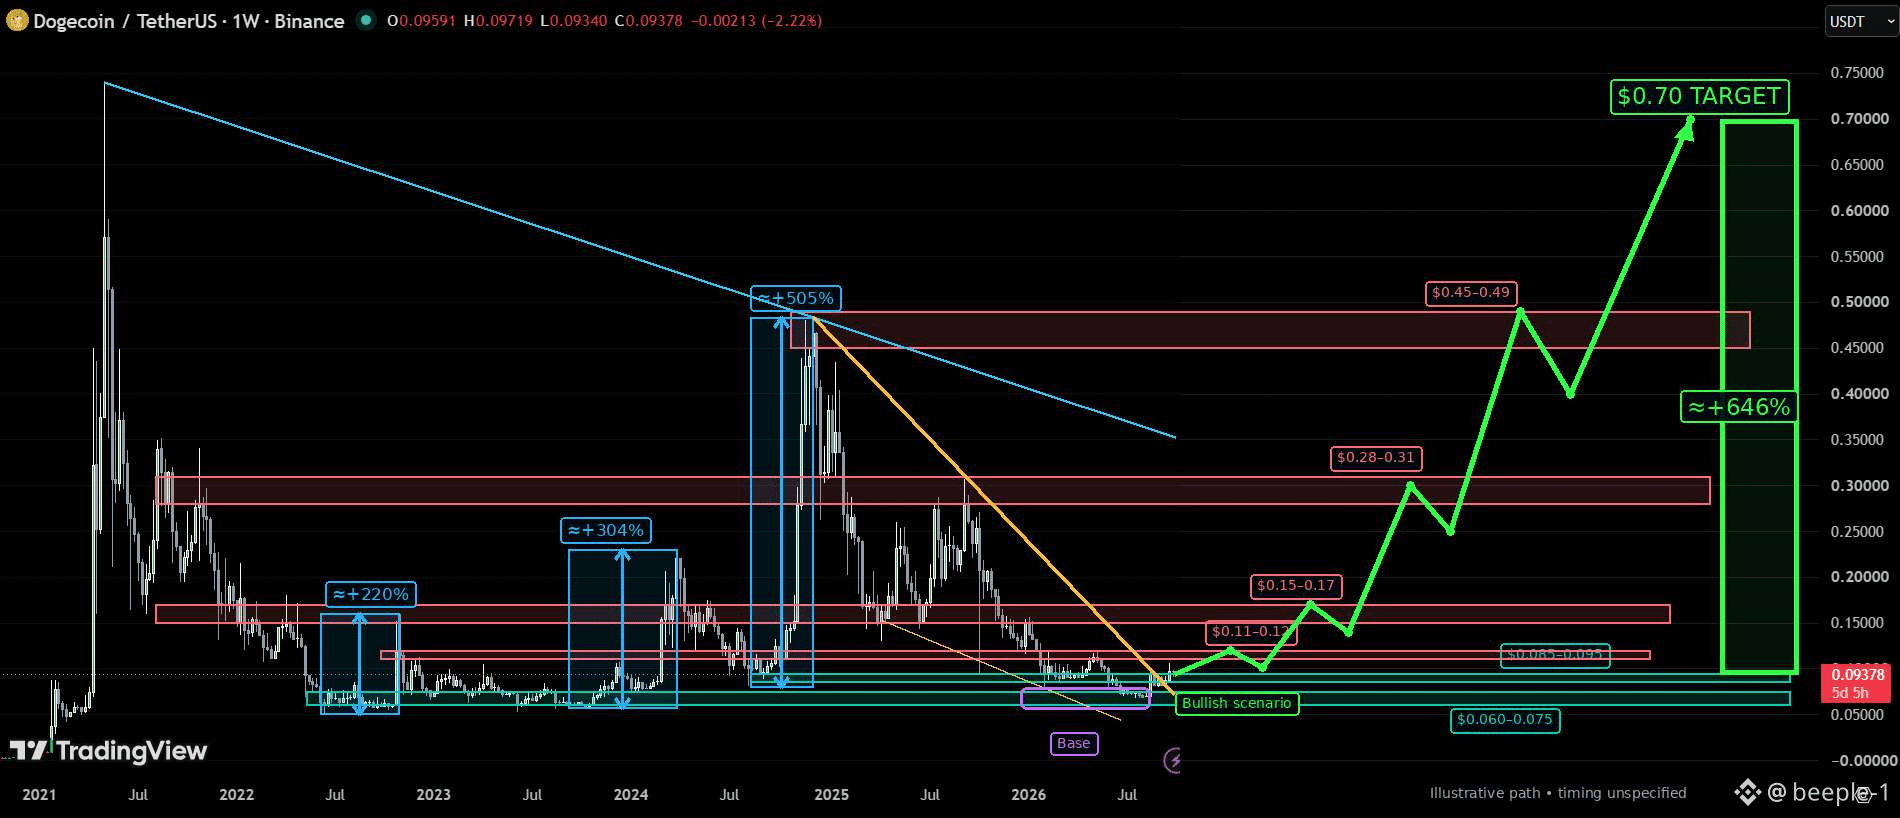
Тижневий графік показує мені фактично одне: DOGE перебуває поблизу важливої бази, а колишній низхідний тренд проходить перевірку.
Стежу за такими рівнями:
• $0.06–0.075 → важлива зона попиту/база
• $0.11–0.13 → перший опір
• $0.15–0.17 → наступна зона пробою
• $0.28–0.31 → важливий опір
• $0.45–0.49 → головний рівень
Якщо DOGE зможе послідовно повернути ці зони, структура стане дуже цікавою.
І так, на графіку є довгострокова ціль $0.70, але я не розраховую на прямолінійний рух до неї.
Для мене підтвердження просте:
база втримується → опір стає підтримкою → формуються вищі максимуми.
Поки цього не сталося, я стежу за цим сценарієм, а не женуся за ним.
#АналізЦіниBTC# #МакроОгляди# #СезонАльткоїнів# #МемАльфа# #МережаBNB#
$DOGE починає виглядати цікаво на старших таймфреймах.
Тижневий графік показує мені фактично одне: DOGE перебуває поблизу важливої бази, а колишній низхідний тренд проходить перевірку.
Стежу за такими рівнями:
• $0.06–0.075 → важлива зона попиту/база
• $0.11–0.13 → перший опір
• $0.15–0.17 → наступна зона пробою
• $0.28–0.31 → важливий опір
• $0.45–0.49 → головний рівень
Якщо DOGE зможе послідовно повернути ці зони, структура стане дуже цікавою.
І так, на графіку є довгострокова ціль $0.70, але я не розраховую на прямолінійний рух до неї.
Для мене підтвердження просте:
база втримується → опір стає підтримкою → формуються вищі максимуми.
Поки цього не сталося, я стежу за цим сценарієм, а не женуся за ним.
#АналізЦіниBTC# #МакроОгляди# #СезонАльткоїнів# #МемАльфа# #МережаBNB#
Тижневий графік показує мені фактично одне: DOGE перебуває поблизу важливої бази, а колишній низхідний тренд проходить перевірку.
Стежу за такими рівнями:
• $0.06–0.075 → важлива зона попиту/база
• $0.11–0.13 → перший опір
• $0.15–0.17 → наступна зона пробою
• $0.28–0.31 → важливий опір
• $0.45–0.49 → головний рівень
Якщо DOGE зможе послідовно повернути ці зони, структура стане дуже цікавою.
І так, на графіку є довгострокова ціль $0.70, але я не розраховую на прямолінійний рух до неї.
Для мене підтвердження просте:
база втримується → опір стає підтримкою → формуються вищі максимуми.
Поки цього не сталося, я стежу за цим сценарієм, а не женуся за ним.
#АналізЦіниBTC# #МакроОгляди# #СезонАльткоїнів# #МемАльфа# #МережаBNB#
70
·
--
$ETH тихо формує одну з найчіткіших структур на графіку.
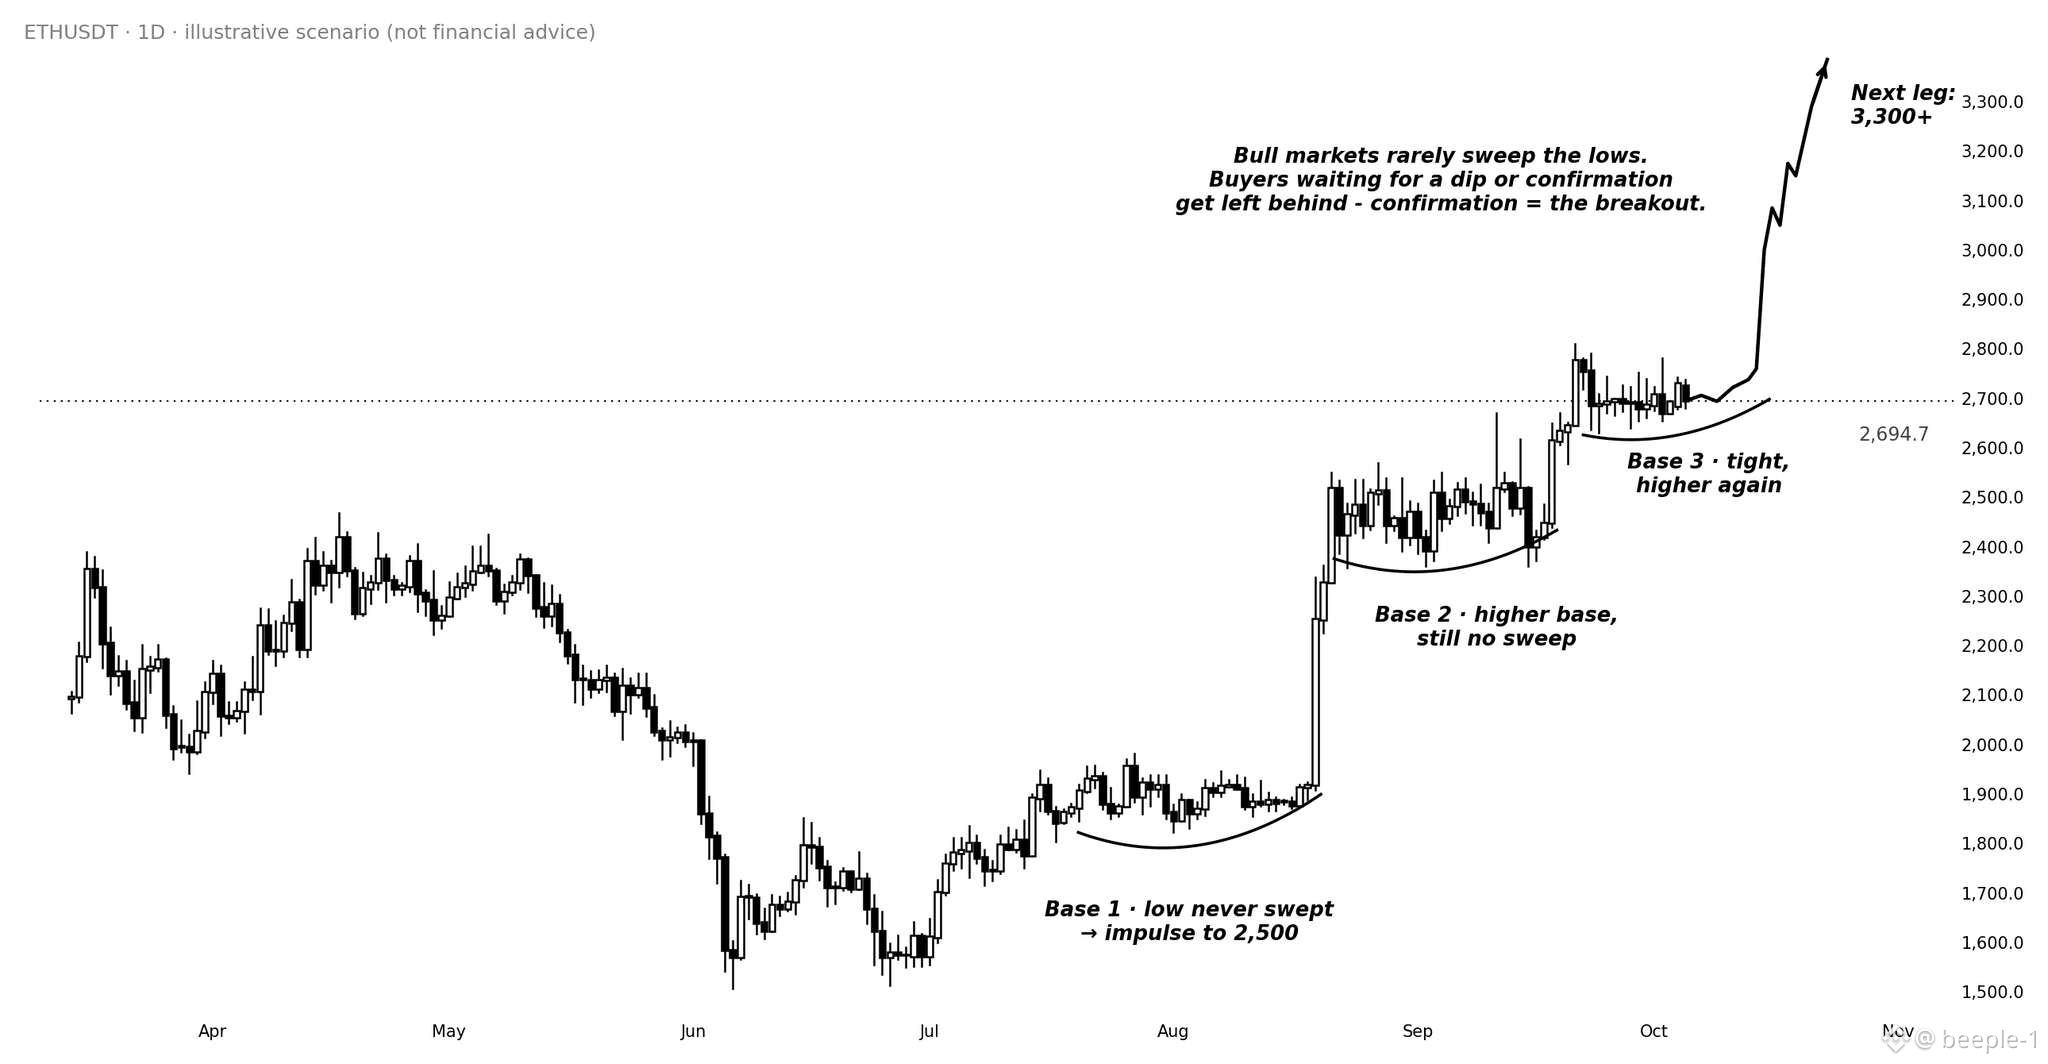
Три бази.
Три вищі мінімуми.
Жодного справжнього зняття ліквідності з попередніх мінімумів.
Це свідчить про те, що продавцям важко штовхнути ETH нижче.
Якщо рівень $2.7K втримається, а імпульс посилиться, спершу стежитиму за зоною $3K, а потім — за $3.3K.
Сетап простий: вища база → прорив угору.
#АналізЦіниBTC #МакроОгляди #СезонАльткоїнів #МемАльфа #BNBChain#
$ETH тихо формує одну з найчіткіших структур на графіку.
Три бази.
Три вищі мінімуми.
Жодного справжнього зняття ліквідності з попередніх мінімумів.
Це свідчить про те, що продавцям важко штовхнути ETH нижче.
Якщо рівень $2.7K втримається, а імпульс посилиться, спершу стежитиму за зоною $3K, а потім — за $3.3K.
Сетап простий: вища база → прорив угору.
#АналізЦіниBTC #МакроОгляди #СезонАльткоїнів #МемАльфа #BNBChain#
Три бази.
Три вищі мінімуми.
Жодного справжнього зняття ліквідності з попередніх мінімумів.
Це свідчить про те, що продавцям важко штовхнути ETH нижче.
Якщо рівень $2.7K втримається, а імпульс посилиться, спершу стежитиму за зоною $3K, а потім — за $3.3K.
Сетап простий: вища база → прорив угору.
#АналізЦіниBTC #МакроОгляди #СезонАльткоїнів #МемАльфа #BNBChain#
71
·
--
$DEBIT нарешті, схоже, прокидається.
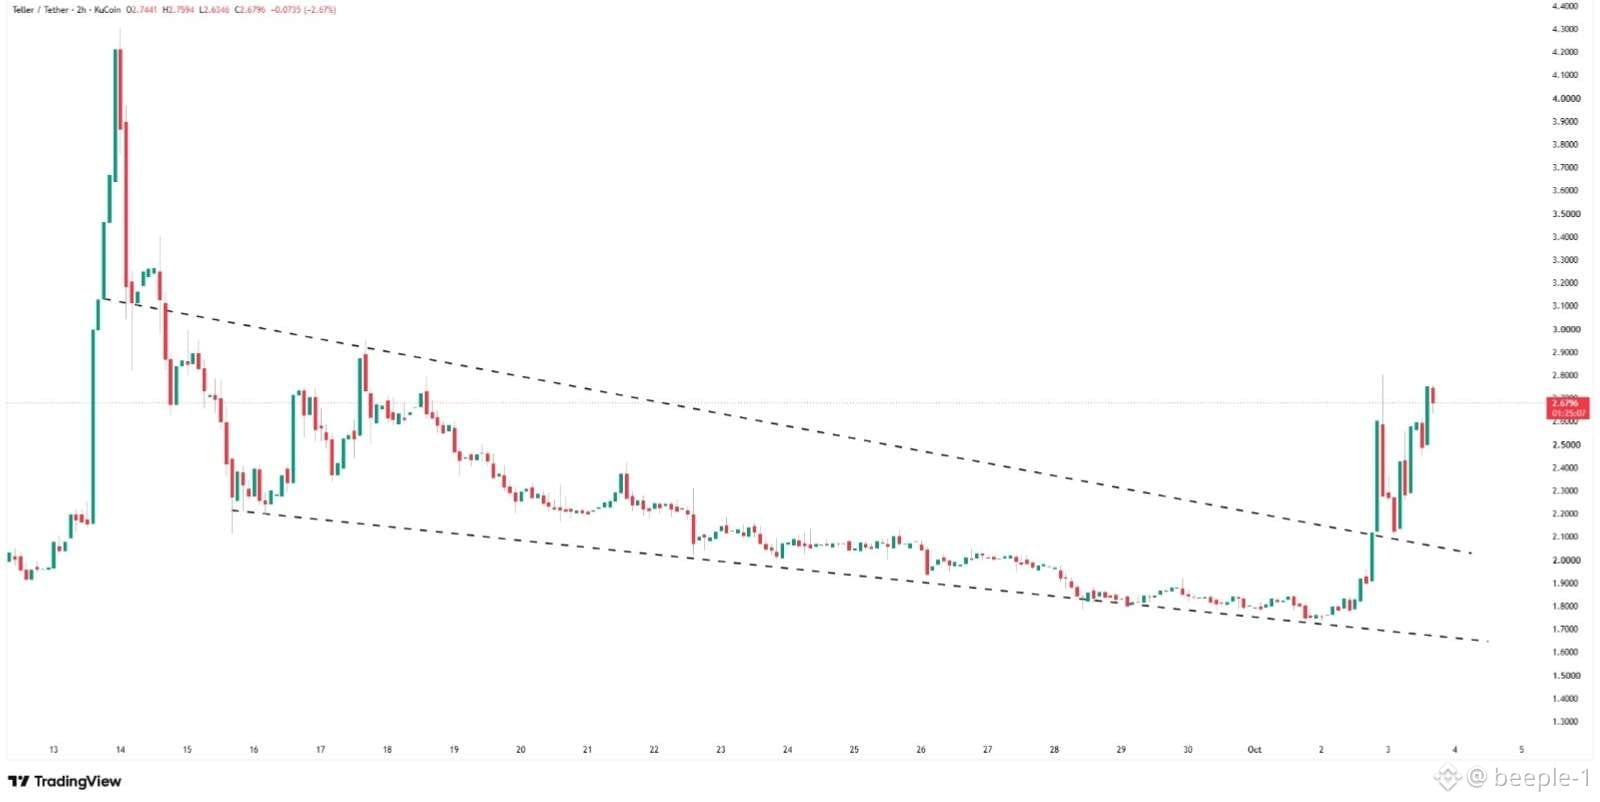
Після кількох тижнів консолідації в низхідному каналі ціна пробила лінію тренду й тепер тестує зону $2.75–$2.80.
Якщо прорив утримається, далі я стежитиму за рівнями $3.00 → $3.20.
Цікава тут не лише графічна картина: Debit створює інтерфейс на базі ШІ для ончейн-обмінів, міжмережевих переказів, позик і керування портфелем.
Прорив відбувся. Тепер хочу побачити, чи втримається рівень під час повторного тестування.
#АналізЦіниBTC# #МакроОгляд# #АльфаМемкоїнів# #BNBChain#
$DEBIT нарешті, схоже, прокидається.
Після кількох тижнів консолідації в низхідному каналі ціна пробила лінію тренду й тепер тестує зону $2.75–$2.80.
Якщо прорив утримається, далі я стежитиму за рівнями $3.00 → $3.20.
Цікава тут не лише графічна картина: Debit створює інтерфейс на базі ШІ для ончейн-обмінів, міжмережевих переказів, позик і керування портфелем.
Прорив відбувся. Тепер хочу побачити, чи втримається рівень під час повторного тестування.
#АналізЦіниBTC# #МакроОгляд# #АльфаМемкоїнів# #BNBChain#
Після кількох тижнів консолідації в низхідному каналі ціна пробила лінію тренду й тепер тестує зону $2.75–$2.80.
Якщо прорив утримається, далі я стежитиму за рівнями $3.00 → $3.20.
Цікава тут не лише графічна картина: Debit створює інтерфейс на базі ШІ для ончейн-обмінів, міжмережевих переказів, позик і керування портфелем.
Прорив відбувся. Тепер хочу побачити, чи втримається рівень під час повторного тестування.
#АналізЦіниBTC# #МакроОгляд# #АльфаМемкоїнів# #BNBChain#
82
·
--
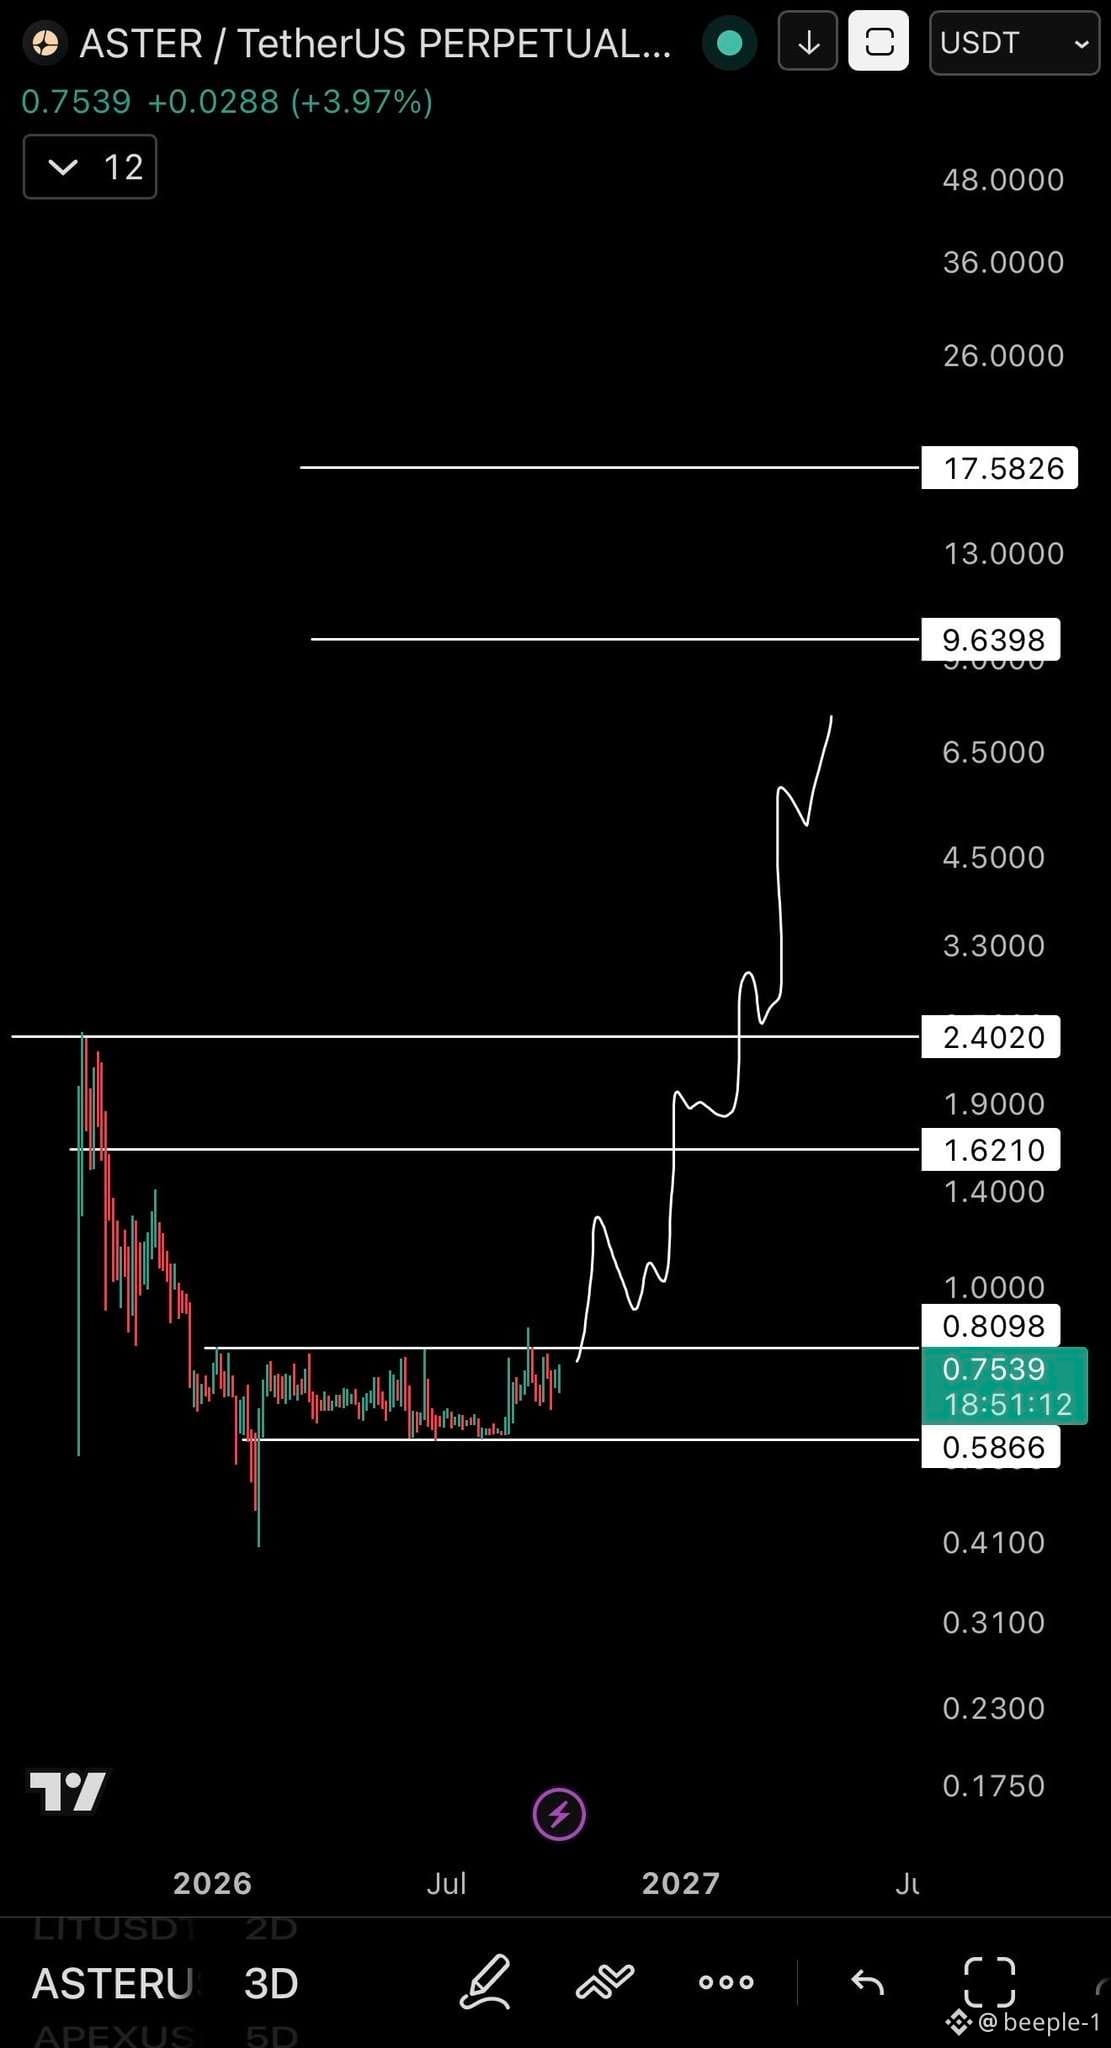
$ASTER нарешті подає ознаки життя після кількох місяців консолідації.
Зараз ціна тестує зону пробою на рівні $0.81.
Якщо покупцям вдасться перетворити $0.81 на рівень підтримки, наступні рівні, за якими я стежу:
→ $1.62
→ $2.40
→ $9.64
Структура стає цікавою, але головне просте: утримати рівень пробою, а далі дати ціні довести свою спроможність.
Це не фінансова порада.
#Аналіз ціни BTC# #Макроогляд# #Сезон альткоїнів# #Мем-альфа# #BNBChain#
$ASTER нарешті подає ознаки життя після кількох місяців консолідації.
Зараз ціна тестує зону пробою на рівні $0.81.
Якщо покупцям вдасться перетворити $0.81 на рівень підтримки, наступні рівні, за якими я стежу:
→ $1.62
→ $2.40
→ $9.64
Структура стає цікавою, але головне просте: утримати рівень пробою, а далі дати ціні довести свою спроможність.
Це не фінансова порада.
#Аналіз ціни BTC# #Макроогляд# #Сезон альткоїнів# #Мем-альфа# #BNBChain#
Зараз ціна тестує зону пробою на рівні $0.81.
Якщо покупцям вдасться перетворити $0.81 на рівень підтримки, наступні рівні, за якими я стежу:
→ $1.62
→ $2.40
→ $9.64
Структура стає цікавою, але головне просте: утримати рівень пробою, а далі дати ціні довести свою спроможність.
Це не фінансова порада.
#Аналіз ціни BTC# #Макроогляд# #Сезон альткоїнів# #Мем-альфа# #BNBChain#
70
·
--
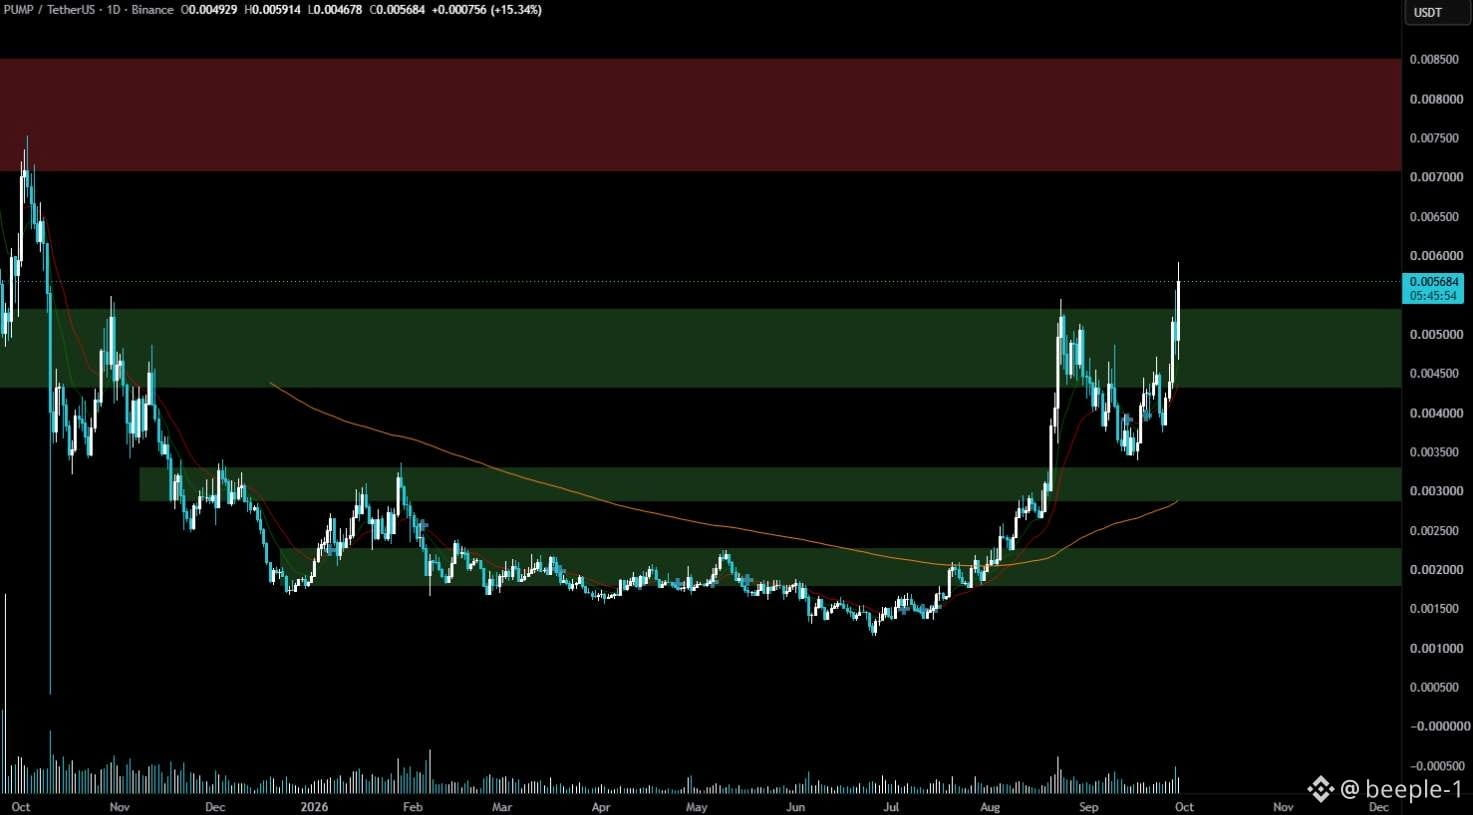
$PUMP нарешті демонструє реальну силу.
Ціна щойно пробила рівень $0.0053 після повернення в попередню зону попиту, а імпульс явно посилюється.
Зараз уважно стежу за діапазоном $0.0057–$0.0060. Упевнений пробій там може знову відкрити шлях до зони пропозиції $0.0070–$0.0085.
Поки що структура виглядає сильною, але я волів би побачити повторний тест, а не гнатися за свічкою.
#АналізЦіниBTC# #МакроОгляд# #СезонАльткоїнів# #МемАльфа# #BNBChain#
$PUMP нарешті демонструє реальну силу.
Ціна щойно пробила рівень $0.0053 після повернення в попередню зону попиту, а імпульс явно посилюється.
Зараз уважно стежу за діапазоном $0.0057–$0.0060. Упевнений пробій там може знову відкрити шлях до зони пропозиції $0.0070–$0.0085.
Поки що структура виглядає сильною, але я волів би побачити повторний тест, а не гнатися за свічкою.
#АналізЦіниBTC# #МакроОгляд# #СезонАльткоїнів# #МемАльфа# #BNBChain#
Ціна щойно пробила рівень $0.0053 після повернення в попередню зону попиту, а імпульс явно посилюється.
Зараз уважно стежу за діапазоном $0.0057–$0.0060. Упевнений пробій там може знову відкрити шлях до зони пропозиції $0.0070–$0.0085.
Поки що структура виглядає сильною, але я волів би побачити повторний тест, а не гнатися за свічкою.
#АналізЦіниBTC# #МакроОгляд# #СезонАльткоїнів# #МемАльфа# #BNBChain#
67
·
--
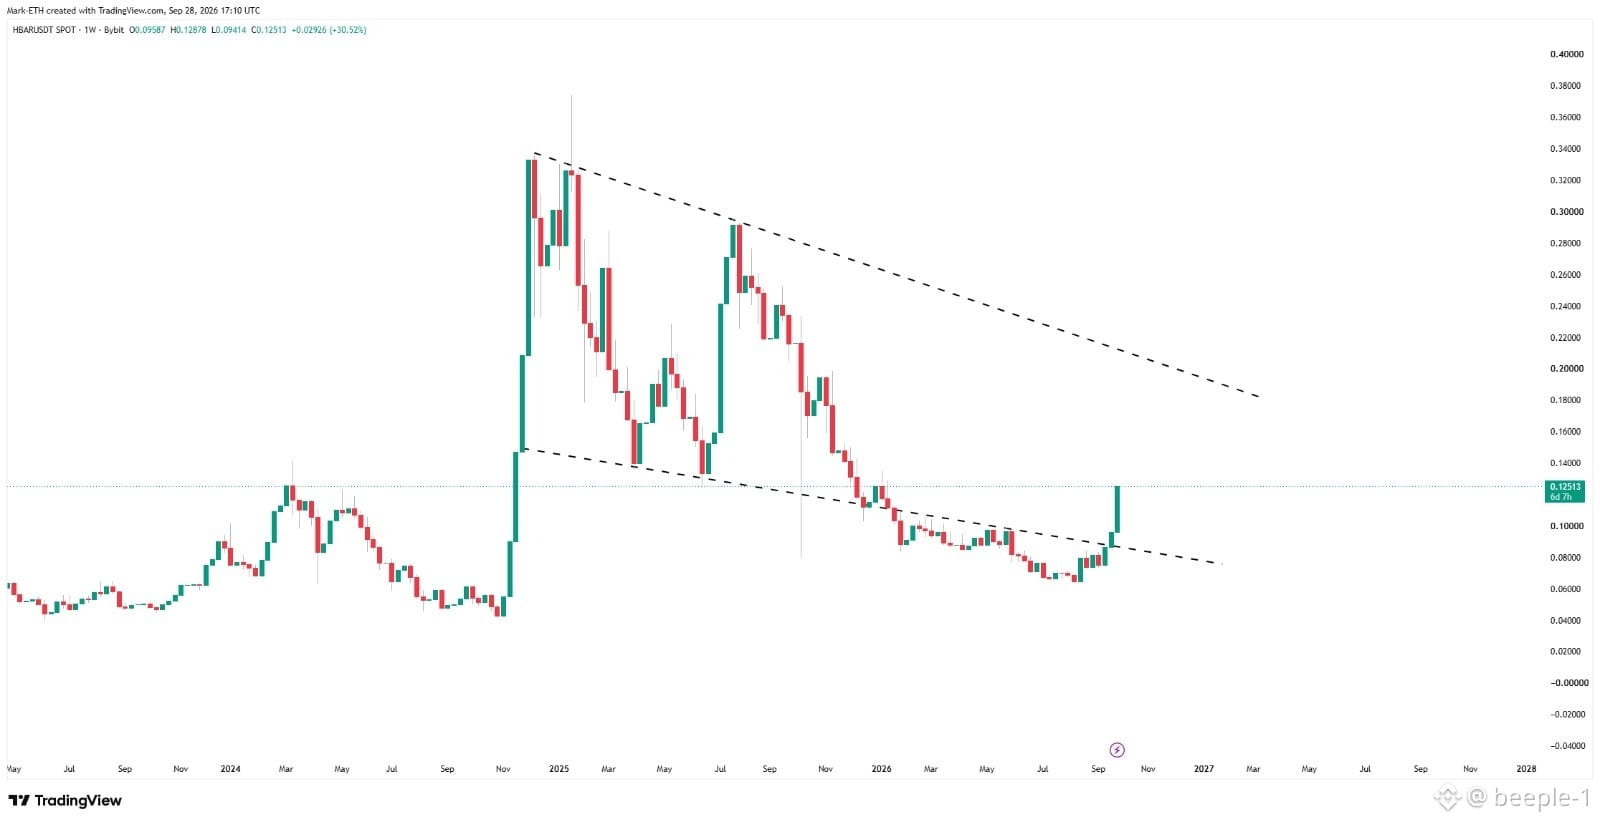
$HBAR нарешті виглядає цікаво.
На тижневому графіку ціна щойно пробила довгострокову низхідну лінію тренду, здійснивши потужний рух на +30%.
Тепер стежу за зоною ретесту $0.12–$0.125 — це ключовий рівень.
Утримається → у фокусі будуть $0.15 → $0.20.
Не потрібно гнатися за пампом. Нехай пробій підтвердиться.
#BTC Аналіз ціни# #Макроогляд# #BNBChain# #Альфа мемів#
$HBAR нарешті виглядає цікаво.
На тижневому графіку ціна щойно пробила довгострокову низхідну лінію тренду, здійснивши потужний рух на +30%.
Тепер стежу за зоною ретесту $0.12–$0.125 — це ключовий рівень.
Утримається → у фокусі будуть $0.15 → $0.20.
Не потрібно гнатися за пампом. Нехай пробій підтвердиться.
#BTC Аналіз ціни# #Макроогляд# #BNBChain# #Альфа мемів#
На тижневому графіку ціна щойно пробила довгострокову низхідну лінію тренду, здійснивши потужний рух на +30%.
Тепер стежу за зоною ретесту $0.12–$0.125 — це ключовий рівень.
Утримається → у фокусі будуть $0.15 → $0.20.
Не потрібно гнатися за пампом. Нехай пробій підтвердиться.
#BTC Аналіз ціни# #Макроогляд# #BNBChain# #Альфа мемів#
90
·
--
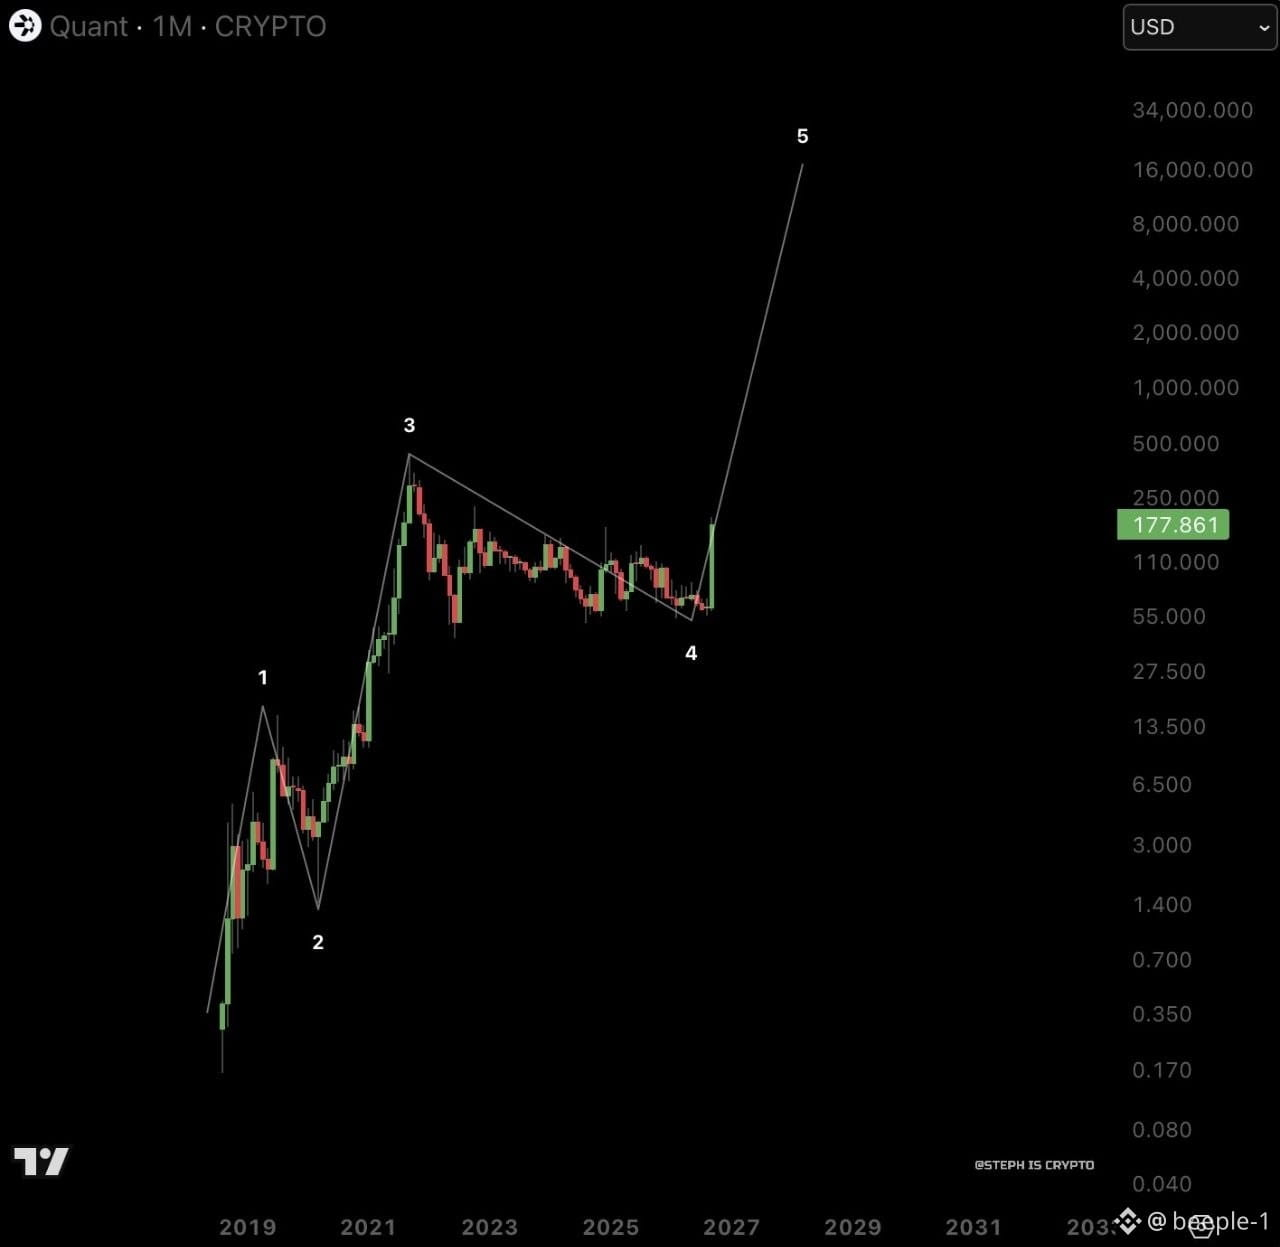
$QNT виглядає неймовірно перспективно 📈
$200 вже на підході ⏳
#АналізЦіниBTC# #МакроІнсайти# #СезонАльткоїнів# #МемАльфа# #BNBChain#
$QNT виглядає неймовірно перспективно 📈
$200 вже на підході ⏳
#АналізЦіниBTC# #МакроІнсайти# #СезонАльткоїнів# #МемАльфа# #BNBChain#
$200 вже на підході ⏳
#АналізЦіниBTC# #МакроІнсайти# #СезонАльткоїнів# #МемАльфа# #BNBChain#
71
·
--
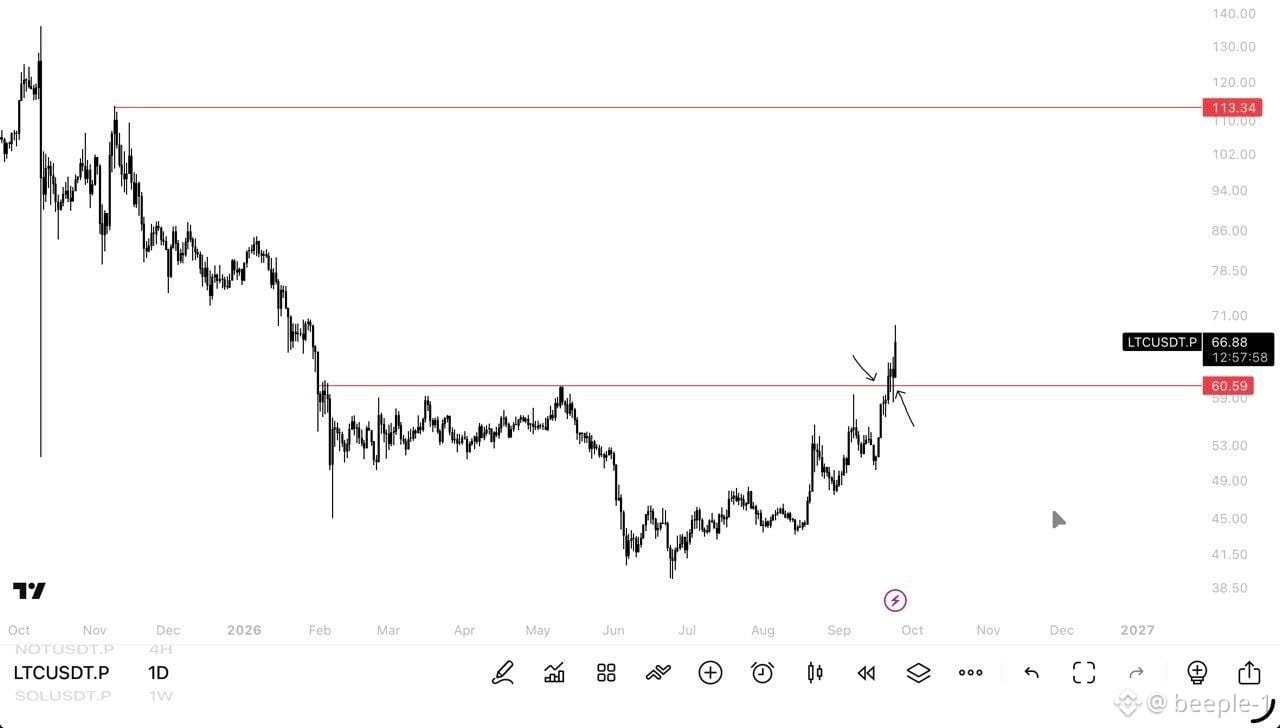
$LTC нарешті демонструє силу. 👀
Після кількох місяців нижче рівня $60.59 LTC пробив його й тепер утримується вище зони прориву.
Тепер усе просто:
$60.59 → підтримка
$66–67 → найближча зона
$113.34 → сильніший опір
Якщо $60.59 перетвориться на надійну підтримку, цей прорив стане набагато цікавішим.
#АналізЦіниBTC# #МакроОгляд# #СезонАльткоїнів# #BNBChain# #МемАльфа#
$LTC нарешті демонструє силу. 👀
Після кількох місяців нижче рівня $60.59 LTC пробив його й тепер утримується вище зони прориву.
Тепер усе просто:
$60.59 → підтримка
$66–67 → найближча зона
$113.34 → сильніший опір
Якщо $60.59 перетвориться на надійну підтримку, цей прорив стане набагато цікавішим.
#АналізЦіниBTC# #МакроОгляд# #СезонАльткоїнів# #BNBChain# #МемАльфа#
Після кількох місяців нижче рівня $60.59 LTC пробив його й тепер утримується вище зони прориву.
Тепер усе просто:
$60.59 → підтримка
$66–67 → найближча зона
$113.34 → сильніший опір
Якщо $60.59 перетвориться на надійну підтримку, цей прорив стане набагато цікавішим.
#АналізЦіниBTC# #МакроОгляд# #СезонАльткоїнів# #BNBChain# #МемАльфа#
60
·
--
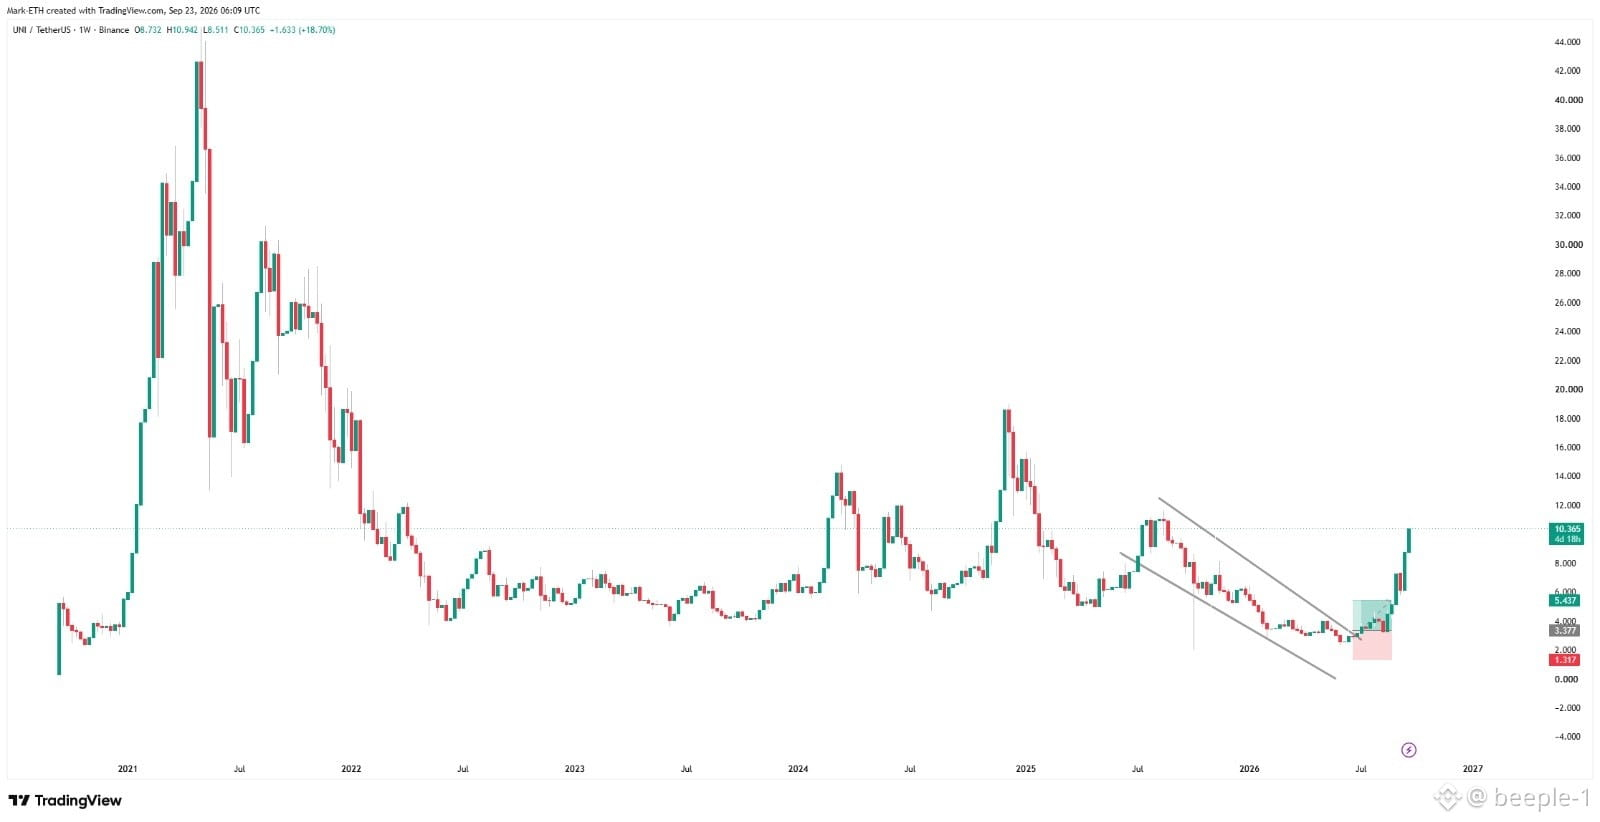
$UNI щойно вирвався з низхідного каналу, який тривав кілька місяців.
Структура нарешті змінюється: прорив + сильний імпульс.
Якщо $UNI утримається вище рівня прориву, наступною зоною, за якою я стежитиму, стане діапазон $12–$14.
Цей рух стає цікавим.
#Аналіз ціни BTC# #Макроінсайти# #Альфа мемкоїнів# #BNBChain#
$UNI щойно вирвався з низхідного каналу, який тривав кілька місяців.
Структура нарешті змінюється: прорив + сильний імпульс.
Якщо $UNI утримається вище рівня прориву, наступною зоною, за якою я стежитиму, стане діапазон $12–$14.
Цей рух стає цікавим.
#Аналіз ціни BTC# #Макроінсайти# #Альфа мемкоїнів# #BNBChain#
Структура нарешті змінюється: прорив + сильний імпульс.
Якщо $UNI утримається вище рівня прориву, наступною зоною, за якою я стежитиму, стане діапазон $12–$14.
Цей рух стає цікавим.
#Аналіз ціни BTC# #Макроінсайти# #Альфа мемкоїнів# #BNBChain#
55
·
--
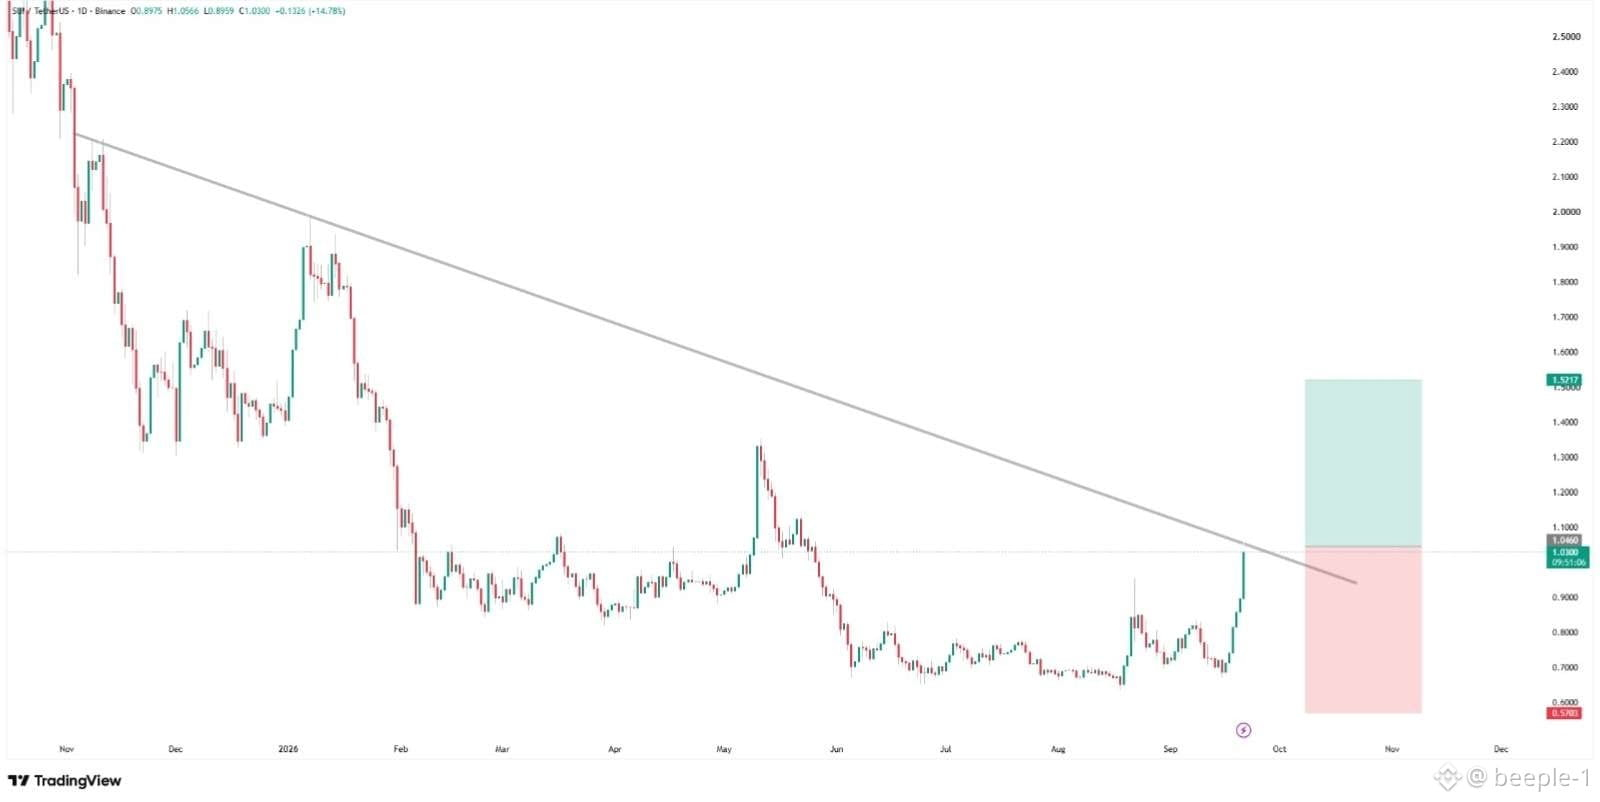
$SUI намагається пробити довгий низхідний канал.
Якщо це вдасться, наступною ціллю бачу $2.
#BTC АналізЦіни# #МакроОгляд# #СезонАльткоїнів# #АльфаМемів#
$SUI намагається пробити довгий низхідний канал.
Якщо це вдасться, наступною ціллю бачу $2.
#BTC АналізЦіни# #МакроОгляд# #СезонАльткоїнів# #АльфаМемів#
Якщо це вдасться, наступною ціллю бачу $2.
#BTC АналізЦіни# #МакроОгляд# #СезонАльткоїнів# #АльфаМемів#
71
Увійдіть, щоб переглянути інший контент
Приєднуйтесь до користувачів криптовалют по всьому світу на Binance Square
⚡️ Отримуйте актуальну та корисну інформацію про криптовалюти.
💬 Приєднуйтесь до найбільшої у світі криптобіржі.
👍 Відкрийте справжні ідеї від перевірених авторів.
Електронна пошта / номер телефону
Трендові теми
fomcвідстеження
108,713 переглядів
514 обговорюють
ФРС сьогодні без сюрпризів, але з нюансами. Ставка незмінна — 3.75% - 4.00%.
Але голосування було не таким вже й єдиним: 10 проти 2 причому двоє членів комітету реально тиснули за підвищення через стійку інфляцію.По суті, регулятор у глухому куті і чекає нової статистики, щоб зрозуміти, що робити далі.
Для ринку це нейтрально але тиск відчувається.Хто що думає, куди підемо далі найближчими тижнями? 👇
#fomcвідстеження
#CanMicrosoftDeliverOnAI
#CanGoogleDefindItsCore
#KOSPISurges6.63%BackAbove6000
$BTC
$NVDA
$NIL
VoLoDyMyR7
·21 вподобань
·2.3k переглядів
BitcoinRebounds$75KAsChipsLead
12,969 переглядів
178 обговорюють
JobsReportRaisesHikeOdds
163,692 переглядів
1,412 обговорюють