
#bnbchart
bnbchart
2,288 переглядів
19 обговорюють
Популярні
Найсвіжіші

·
--
Негативно
Переглянути переклад
*🟡 $BNB - LATEST PRICE CHART UPDATE - 21 NOV 2026*
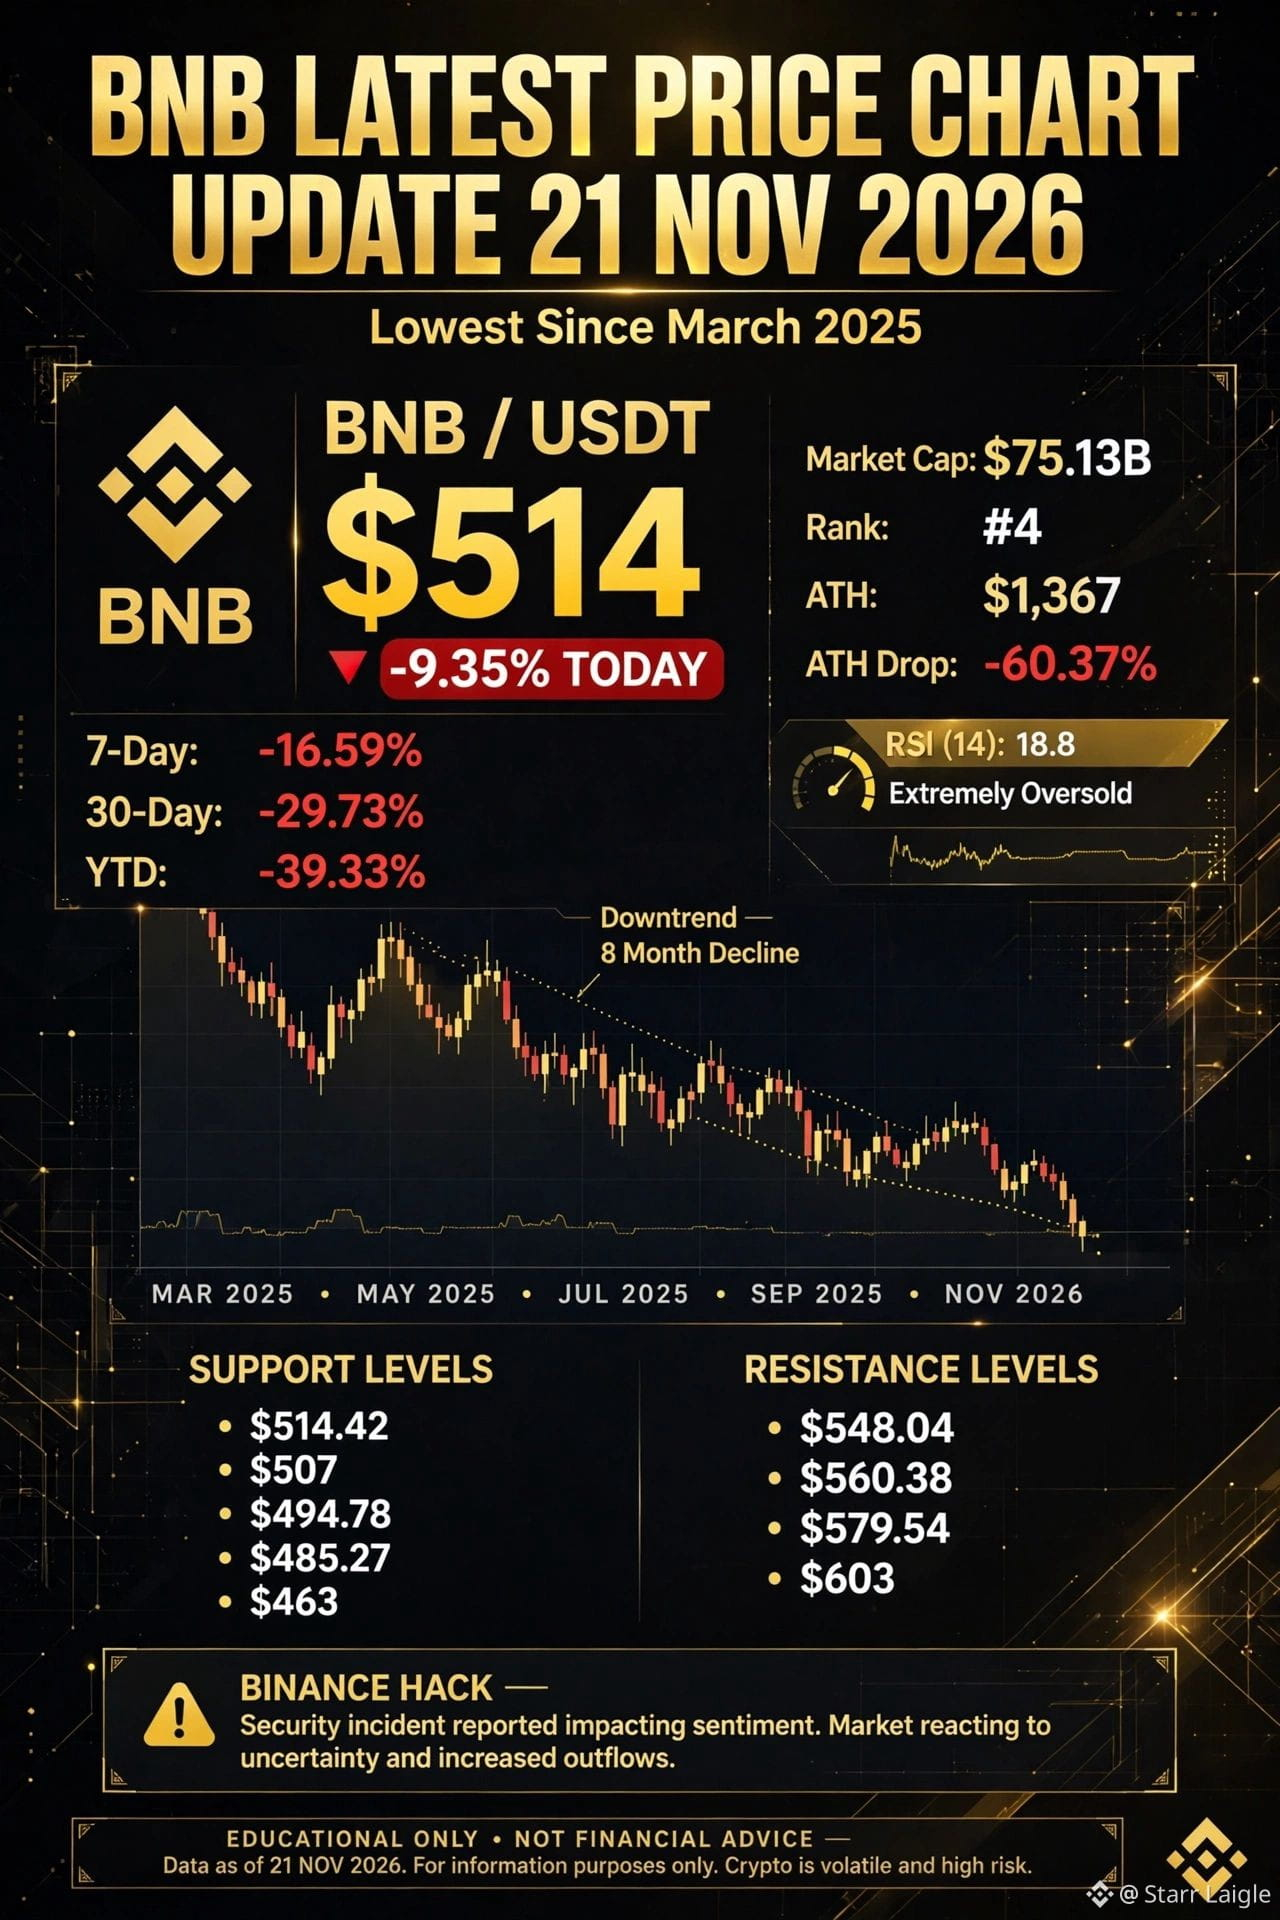
$BNB is at its *lowest price since March 2025*. All 2026 gains are now wiped out. This is the most painful coin in Top 5 today.
*$BNB PRICE RIGHT NOW:*
BNB is trading at *$514 - $542*, down *-4.11% to -9.35%* in 24h. 24h range was *$503.75 - $575.49* - a $71 swing. In 7 days BNB is down *-16.59%*. In 30 days down *-29.73% to -30.80%*. YTD down *-39.33%*. 1 Year down *-36.85%*. Market Cap *$67.60B - $75.13B*, Rank *#4*. 24h Volume *$1.14B - $1.20B*. BNB in PKR = *144,500 PKR* approx.
*BNB vs ATH:*
BNB ATH is *$1,367* on 5 Oct 2025. BNB is now *-60.37%* below ATH. If you bought $1000 at ATH, now it's only $396. BNB is down *-37%* from $809 just a few weeks ago.
*BNB CHART - WHAT IT SAYS:*
Daily chart: *STRONG BEARISH BIAS* on 1h, 4h, Daily, Weekly. Trend bearish since *29 Oct close* - exactly the day of Binance hack. BNB is *below ALL moving averages* - 7-day SMA $573.69, 20-day SMA $640.95, 50-day SMA $701.14, 200-day SMA $656.98. Price below SMA 200 = long-term bearish.
RSI (14) is *18.8 - 20.7* - *EXTREMELY OVERSOLD*. This is the lowest RSI in months. MACD *-44.83*, negative. Stochastic *11.49 / 9.19* - pinned low. Bollinger Band lower is *$523.41*, price is *hugging the lower band* with %B 0.0132. This means sellers are exhausted, but buyers are scared to step in.
Volume Profile: POC was $590, now broken. BNB lost $580, $560, $540 in 3 days.
*2. MARKET-WIDE SELL-OFF*
Total market cap down -7.21%. BTC ETF outflows $582M. Nasdaq down -4%. BNB cannot escape this.
*3. LIQUIDATIONS*
BNB longs liquidated when $580 support broke on 18 Nov. Once $580 broke, cascade to $530, then to $503.
Are you buying BNB at $514 or waiting for $463?
Comment "BNB BUY" / "BNB WAIT" / "BNB HOLD"
#bnb
#BİNANCE #bnbchart
{spot}(BNBUSDT)
*🟡 $BNB - LATEST PRICE CHART UPDATE - 21 NOV 2026*
$BNB is at its *lowest price since March 2025*. All 2026 gains are now wiped out. This is the most painful coin in Top 5 today.
*$BNB PRICE RIGHT NOW:*
BNB is trading at *$514 - $542*, down *-4.11% to -9.35%* in 24h. 24h range was *$503.75 - $575.49* - a $71 swing. In 7 days BNB is down *-16.59%*. In 30 days down *-29.73% to -30.80%*. YTD down *-39.33%*. 1 Year down *-36.85%*. Market Cap *$67.60B - $75.13B*, Rank *#4*. 24h Volume *$1.14B - $1.20B*. BNB in PKR = *144,500 PKR* approx.
*BNB vs ATH:*
BNB ATH is *$1,367* on 5 Oct 2025. BNB is now *-60.37%* below ATH. If you bought $1000 at ATH, now it's only $396. BNB is down *-37%* from $809 just a few weeks ago.
*BNB CHART - WHAT IT SAYS:*
Daily chart: *STRONG BEARISH BIAS* on 1h, 4h, Daily, Weekly. Trend bearish since *29 Oct close* - exactly the day of Binance hack. BNB is *below ALL moving averages* - 7-day SMA $573.69, 20-day SMA $640.95, 50-day SMA $701.14, 200-day SMA $656.98. Price below SMA 200 = long-term bearish.
RSI (14) is *18.8 - 20.7* - *EXTREMELY OVERSOLD*. This is the lowest RSI in months. MACD *-44.83*, negative. Stochastic *11.49 / 9.19* - pinned low. Bollinger Band lower is *$523.41*, price is *hugging the lower band* with %B 0.0132. This means sellers are exhausted, but buyers are scared to step in.
Volume Profile: POC was $590, now broken. BNB lost $580, $560, $540 in 3 days.
*2. MARKET-WIDE SELL-OFF*
Total market cap down -7.21%. BTC ETF outflows $582M. Nasdaq down -4%. BNB cannot escape this.
*3. LIQUIDATIONS*
BNB longs liquidated when $580 support broke on 18 Nov. Once $580 broke, cascade to $530, then to $503.
Are you buying BNB at $514 or waiting for $463?
Comment "BNB BUY" / "BNB WAIT" / "BNB HOLD"
#bnb
#BİNANCE #bnbchart
$BNB is at its *lowest price since March 2025*. All 2026 gains are now wiped out. This is the most painful coin in Top 5 today.
*$BNB PRICE RIGHT NOW:*
BNB is trading at *$514 - $542*, down *-4.11% to -9.35%* in 24h. 24h range was *$503.75 - $575.49* - a $71 swing. In 7 days BNB is down *-16.59%*. In 30 days down *-29.73% to -30.80%*. YTD down *-39.33%*. 1 Year down *-36.85%*. Market Cap *$67.60B - $75.13B*, Rank *#4*. 24h Volume *$1.14B - $1.20B*. BNB in PKR = *144,500 PKR* approx.
*BNB vs ATH:*
BNB ATH is *$1,367* on 5 Oct 2025. BNB is now *-60.37%* below ATH. If you bought $1000 at ATH, now it's only $396. BNB is down *-37%* from $809 just a few weeks ago.
*BNB CHART - WHAT IT SAYS:*
Daily chart: *STRONG BEARISH BIAS* on 1h, 4h, Daily, Weekly. Trend bearish since *29 Oct close* - exactly the day of Binance hack. BNB is *below ALL moving averages* - 7-day SMA $573.69, 20-day SMA $640.95, 50-day SMA $701.14, 200-day SMA $656.98. Price below SMA 200 = long-term bearish.
RSI (14) is *18.8 - 20.7* - *EXTREMELY OVERSOLD*. This is the lowest RSI in months. MACD *-44.83*, negative. Stochastic *11.49 / 9.19* - pinned low. Bollinger Band lower is *$523.41*, price is *hugging the lower band* with %B 0.0132. This means sellers are exhausted, but buyers are scared to step in.
Volume Profile: POC was $590, now broken. BNB lost $580, $560, $540 in 3 days.
*2. MARKET-WIDE SELL-OFF*
Total market cap down -7.21%. BTC ETF outflows $582M. Nasdaq down -4%. BNB cannot escape this.
*3. LIQUIDATIONS*
BNB longs liquidated when $580 support broke on 18 Nov. Once $580 broke, cascade to $530, then to $503.
Are you buying BNB at $514 or waiting for $463?
Comment "BNB BUY" / "BNB WAIT" / "BNB HOLD"
#bnb
#BİNANCE #bnbchart
17


$BNB Огляд графіка: Технічні рівні 📊
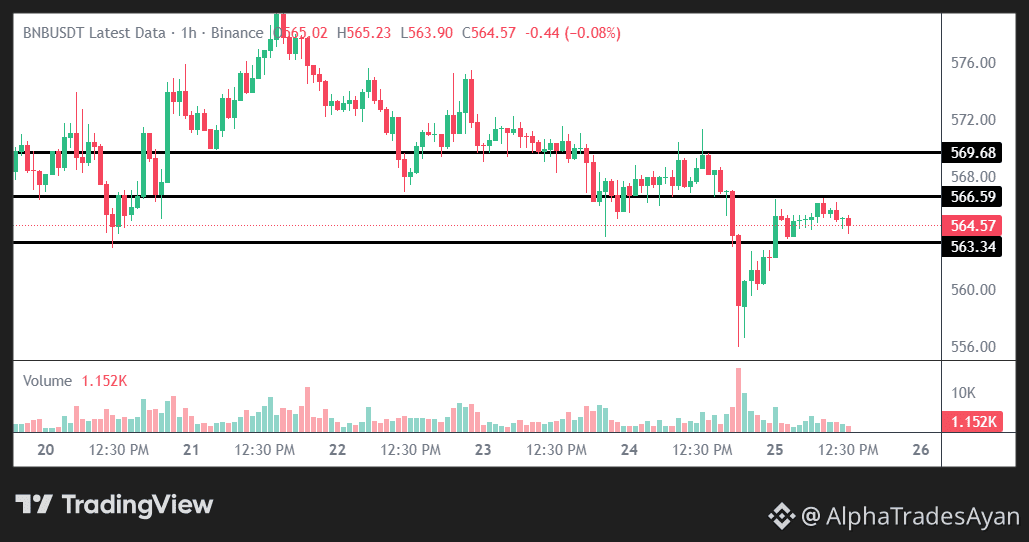
Розглядаючи графік $BNB , бачимо, що ціна зараз рухається в дуже вузькому, тісному діапазоні. Ми спостерігаємо за рухом ціни між цими ключовими технічними рівнями.
Технічні рівні на графіку:
🚧 Верхній рівень опору: $569.68
🚧 Негайний рівень опору: $566.59
🛡️ Негайний рівень підтримки: $563.34
$BNB
{future}(BNBUSDT)
Зараз ціна коливається між рівнями $563.34 та $566.59.
Якою є ваша технічна оцінка цієї структури? Чи бачите ви, що ціна й далі рухатиметься вбік, чи проб’є цей діапазон? Поділіться своїми поглядами на графік у коментарях нижче! 👇
(Лише освітній огляд графіка | NFA | DYOR)
#bnb #BNB_Market_Update #bnbchart #bnbscalping #crypto
$BNB Огляд графіка: Технічні рівні 📊
Розглядаючи графік $BNB , бачимо, що ціна зараз рухається в дуже вузькому, тісному діапазоні. Ми спостерігаємо за рухом ціни між цими ключовими технічними рівнями.
Технічні рівні на графіку:
🚧 Верхній рівень опору: $569.68
🚧 Негайний рівень опору: $566.59
🛡️ Негайний рівень підтримки: $563.34
$BNB
Зараз ціна коливається між рівнями $563.34 та $566.59.
Якою є ваша технічна оцінка цієї структури? Чи бачите ви, що ціна й далі рухатиметься вбік, чи проб’є цей діапазон? Поділіться своїми поглядами на графік у коментарях нижче! 👇
(Лише освітній огляд графіка | NFA | DYOR)
#bnb #BNB_Market_Update #bnbchart #bnbscalping #crypto
Розглядаючи графік $BNB , бачимо, що ціна зараз рухається в дуже вузькому, тісному діапазоні. Ми спостерігаємо за рухом ціни між цими ключовими технічними рівнями.
Технічні рівні на графіку:
🚧 Верхній рівень опору: $569.68
🚧 Негайний рівень опору: $566.59
🛡️ Негайний рівень підтримки: $563.34
$BNB
Зараз ціна коливається між рівнями $563.34 та $566.59.
Якою є ваша технічна оцінка цієї структури? Чи бачите ви, що ціна й далі рухатиметься вбік, чи проб’є цей діапазон? Поділіться своїми поглядами на графік у коментарях нижче! 👇
(Лише освітній огляд графіка | NFA | DYOR)
#bnb #BNB_Market_Update #bnbchart #bnbscalping #crypto
93
Увійдіть, щоб переглянути інший контент
Приєднуйтесь до користувачів криптовалют по всьому світу на Binance Square
⚡️ Отримуйте актуальну та корисну інформацію про криптовалюти.
💬 Приєднуйтесь до найбільшої у світі криптобіржі.
👍 Відкрийте справжні ідеї від перевірених авторів.
Електронна пошта / номер телефону
Трендові теми
1
#fomcвідстеження
130,147 переглядів
567 обговорюють
2
#NvidiaLoses$2.7TrillionInMonthAndAHalf
8,880 переглядів
87 обговорюють
3
#CanBTCReboundAfterFallingBelow60K?
642,775 переглядів
2,723 обговорюють
4
#GlobalStocksFaceLongestLosingStreakSince2023
227,919 переглядів
1,865 обговорюють
5
#BlackRockIBITPostsRecord$541MSingleDayOutflow
23,353 переглядів
69 обговорюють
6
#AnthropicPlungesTowardIPOPriceonDay2
113,446 переглядів
1,109 обговорюють
7
#TwentyOneCapitalAdds172.25BTC
49,919 переглядів
591 обговорюють
8
#HKBillWouldExcludeTokenizedDepositsFromVirtualAssets
5,756 переглядів
48 обговорюють
9
#BNBDropsBelow540USDTWith8.46%DailyDecline
64,279 переглядів
583 обговорюють
10
#HKBillProposesHK$100KFineForUnauthorizedCryptoTitles
2,174 переглядів
21 обговорюють