Binance Square
Magnus Corvus
989 Posts

Magnus Corvus

I'm Crypto Analyst & Elite Trader:X-@Magnus64247
25 Following
6.4K+ Followers
1.6K+ Liked
Posts
·
--
Bullish
I’ve been going through NEWT’s on-chain and order book data myself this evening, and the picture forming is sobering. The price closed 5.9% lower while volume shrank by roughly 15%, and this happened against a flat-to-green AI infrastructure sector. That kind of divergence tells me the problem isn’t a broad rotation out of AI — it’s something specific to NEWT’s liquidity profile, and it’s worth documenting what I’m seeing. My process starts with flow tracking. Over the last day, I’ve observed a persistent imbalance in net transfers toward exchange deposit addresses. Tokens are steadily leaving private wallets and pooling on platforms where they can be sold. This isn’t a sudden, explosive dump — it’s a consistent, quiet accumulation of supply on exchanges, and I’ve learned to treat that as a cautionary signal. Even if the selling hasn’t fully materialized yet, the setup is there. The deeper issue, and honestly the one that concerns me most, is the order book depth. I measured liquidity across multiple venues, and I can confirm that a market sell worth just a few thousand dollars can trigger slippage of several percentage points. For a large-cap asset, that degree of movement would require enormous capital; here, the structure is simply too thin to absorb even modest pressure. When I factor in the ongoing outflows, I see a market that is highly reactive — almost fragile — and that fragility is what turns a manageable correction into a sharper decline. Technically, I’m watching the $0.085 level as a pivot. I’ve marked $0.072 below as the next significant demand zone, and losing that could expose us to a vacuum down toward $0.06, where the tape historically goes very quiet. For me to consider a durable low, I would need to see on-chain inflows stabilize and a convincing recovery above $0.10, ideally accompanied by volume that signals genuine re-accumulation rather than a dead cat bounce. @NewtonProtocol $NEWT #Newt
I’ve been going through NEWT’s on-chain and order book data myself this evening, and the picture forming is sobering. The price closed 5.9% lower while volume shrank by roughly 15%, and this happened against a flat-to-green AI infrastructure sector. That kind of divergence tells me the problem isn’t a broad rotation out of AI — it’s something specific to NEWT’s liquidity profile, and it’s worth documenting what I’m seeing.

My process starts with flow tracking. Over the last day, I’ve observed a persistent imbalance in net transfers toward exchange deposit addresses. Tokens are steadily leaving private wallets and pooling on platforms where they can be sold. This isn’t a sudden, explosive dump — it’s a consistent, quiet accumulation of supply on exchanges, and I’ve learned to treat that as a cautionary signal. Even if the selling hasn’t fully materialized yet, the setup is there.

The deeper issue, and honestly the one that concerns me most, is the order book depth. I measured liquidity across multiple venues, and I can confirm that a market sell worth just a few thousand dollars can trigger slippage of several percentage points. For a large-cap asset, that degree of movement would require enormous capital; here, the structure is simply too thin to absorb even modest pressure. When I factor in the ongoing outflows, I see a market that is highly reactive — almost fragile — and that fragility is what turns a manageable correction into a sharper decline.

Technically, I’m watching the $0.085 level as a pivot. I’ve marked $0.072 below as the next significant demand zone, and losing that could expose us to a vacuum down toward $0.06, where the tape historically goes very quiet. For me to consider a durable low, I would need to see on-chain inflows stabilize and a convincing recovery above $0.10, ideally accompanied by volume that signals genuine re-accumulation rather than a dead cat bounce.

@NewtonProtocol $NEWT #Newt
Article
I’m Watching NEWT Bleed Out — And the AI Narrative Alone Can’t Stop ItI’ve been tracking NEWT closely over the last 24 hours, and the numbers don’t lie: a 5.9% drop, volume down about 15%, and a market cap sliding toward the lower end of its weekly range. What bothers me most isn’t the red candle itself — it’s the fact that this is happening while the broader AI infrastructure sector sits flat to slightly green. I’m seeing a clear divergence, and it tells me one thing. NEWT isn’t suffering from a broken thesis; it’s suffering from a local liquidity crisis. When I pull up on-chain data, the picture gets sharper. I’m watching persistent net outflows, meaning more tokens are moving from private wallets to exchange deposit addresses than the other way around. To me, that’s a reliable leading indicator. Whales and mid-sized holders rarely move coins to exchanges just for fun; they do it when they’re preparing to sell. Exchange reserves are creeping higher, and that supply overhang is what’s gently pressing price lower. It’s not one monster dump — it’s a slow, quiet bleed. And here’s where I really start raising my eyebrows: liquidity is dangerously thin. I’m looking at order books, both on CEXs and DEXs, and they’re shallow. A sell order of just a few thousand dollars can rip through multiple percentage points of slippage without breaking a sweat. For perspective, moving Bitcoin’s price by 5.9% would demand hundreds of millions in sell volume. For NEWT, a single low-six-figure market sell can cause exactly the same damage. In this kind of environment, every outflow is amplified. Traders hitting market sell are essentially wrecking the tape with no buying cushion to absorb the blow. I respect the AI infrastructure narrative. Decentralized compute, model training, coordination layers — I believe that’s a powerful long-term trend. But I’ve learned the hard way that narratives don’t pay the bills during a downtrend. In the short run, price is nothing more than supply meeting demand, and right now fear is calling the shots. The outflows tell me capital is rotating elsewhere, probably into hotter narratives or stablecoins. When liquidity is this thin, even neutral sentiment feels like a bearish avalanche. If I switch to the charts, I’m watching $0.085 as the immediate support. A breakdown there with any real volume would likely drag us to $0.072, which is where I saw the last meaningful accumulation. Lose that, and a flash crash toward $0.06 becomes a genuine risk — the order book turns into a ghost town down there. On the upside, I’d need to see a confident 4-hour close above $0.10 to even start thinking bullish again. The real gatekeeper for me is $0.115. Flip that into support, and I’d feel comfortable that the bleeding has genuinely stopped. I’m not completely dismissing the contrarian case. If outflows start slowing and exchange reserves flatten out, what looks like a slow rug could easily morph into a quiet accumulation range. I’ve seen genuine infrastructure projects shake out weak hands like this before. Smart money often uses these liquidity vacuums to build positions without blasting the chart higher. But I won’t pretend I can predict that with certainty. Until I see on-chain flows reverse and volume come back, catching this falling knife feels more like gambling than analysis. A dead cat bounce remains my base case while liquidity stays starved. So here’s where I land. Short-term, I’m bearish on NEWT. The AI narrative isn’t an immediate shield against capital flight and paper-thin order books. Long-term, the project isn’t broken, but recovery needs proof of renewed demand, not just storytelling. I’m not front-running the bottom. I’m waiting for a confirmed reversal — a volume spike with a bullish engulfing candle, or a clear slowdown in exchange inflows. If I absolutely had to trade this, I’d keep my size small and my stop-losses tight. In low-liquidity markets, a 5.9% dip can turn into 20% in minutes, and discipline is the only edge I have. @NewtonProtocol $NEWT #Newt

I’m Watching NEWT Bleed Out — And the AI Narrative Alone Can’t Stop It

I’ve been tracking NEWT closely over the last 24 hours, and the numbers don’t lie: a 5.9% drop, volume down about 15%, and a market cap sliding toward the lower end of its weekly range. What bothers me most isn’t the red candle itself — it’s the fact that this is happening while the broader AI infrastructure sector sits flat to slightly green. I’m seeing a clear divergence, and it tells me one thing. NEWT isn’t suffering from a broken thesis; it’s suffering from a local liquidity crisis.
When I pull up on-chain data, the picture gets sharper. I’m watching persistent net outflows, meaning more tokens are moving from private wallets to exchange deposit addresses than the other way around. To me, that’s a reliable leading indicator. Whales and mid-sized holders rarely move coins to exchanges just for fun; they do it when they’re preparing to sell. Exchange reserves are creeping higher, and that supply overhang is what’s gently pressing price lower. It’s not one monster dump — it’s a slow, quiet bleed.
And here’s where I really start raising my eyebrows: liquidity is dangerously thin. I’m looking at order books, both on CEXs and DEXs, and they’re shallow. A sell order of just a few thousand dollars can rip through multiple percentage points of slippage without breaking a sweat. For perspective, moving Bitcoin’s price by 5.9% would demand hundreds of millions in sell volume. For NEWT, a single low-six-figure market sell can cause exactly the same damage. In this kind of environment, every outflow is amplified. Traders hitting market sell are essentially wrecking the tape with no buying cushion to absorb the blow.
I respect the AI infrastructure narrative. Decentralized compute, model training, coordination layers — I believe that’s a powerful long-term trend. But I’ve learned the hard way that narratives don’t pay the bills during a downtrend. In the short run, price is nothing more than supply meeting demand, and right now fear is calling the shots. The outflows tell me capital is rotating elsewhere, probably into hotter narratives or stablecoins. When liquidity is this thin, even neutral sentiment feels like a bearish avalanche.
If I switch to the charts, I’m watching $0.085 as the immediate support. A breakdown there with any real volume would likely drag us to $0.072, which is where I saw the last meaningful accumulation. Lose that, and a flash crash toward $0.06 becomes a genuine risk — the order book turns into a ghost town down there. On the upside, I’d need to see a confident 4-hour close above $0.10 to even start thinking bullish again. The real gatekeeper for me is $0.115. Flip that into support, and I’d feel comfortable that the bleeding has genuinely stopped.
I’m not completely dismissing the contrarian case. If outflows start slowing and exchange reserves flatten out, what looks like a slow rug could easily morph into a quiet accumulation range. I’ve seen genuine infrastructure projects shake out weak hands like this before. Smart money often uses these liquidity vacuums to build positions without blasting the chart higher. But I won’t pretend I can predict that with certainty. Until I see on-chain flows reverse and volume come back, catching this falling knife feels more like gambling than analysis. A dead cat bounce remains my base case while liquidity stays starved.
So here’s where I land. Short-term, I’m bearish on NEWT. The AI narrative isn’t an immediate shield against capital flight and paper-thin order books. Long-term, the project isn’t broken, but recovery needs proof of renewed demand, not just storytelling. I’m not front-running the bottom. I’m waiting for a confirmed reversal — a volume spike with a bullish engulfing candle, or a clear slowdown in exchange inflows. If I absolutely had to trade this, I’d keep my size small and my stop-losses tight. In low-liquidity markets, a 5.9% dip can turn into 20% in minutes, and discipline is the only edge I have.
@NewtonProtocol $NEWT #Newt
·
--
Bullish
$BTC is showing strong recovery potential from key support with buyers stepping back in. Bullish structure remains valid while price holds above the support zone. Entry Zone: 61,950 – 62,100 Stop Loss: 61,500 Target 1: 62,400 Target 2: 62,700 Target 3: 63,000 Price reacted cleanly from liquidity below the recent low and is attempting to reclaim short-term structure. Holding above the entry zone keeps buyers in control, while acceptance above resistance can fuel continuation toward higher targets. Let’s go and Trade now $BTC
$BTC is showing strong recovery potential from key support with buyers stepping back in.
Bullish structure remains valid while price holds above the support zone.

Entry Zone: 61,950 – 62,100
Stop Loss: 61,500

Target 1: 62,400
Target 2: 62,700
Target 3: 63,000

Price reacted cleanly from liquidity below the recent low and is attempting to reclaim short-term structure. Holding above the entry zone keeps buyers in control, while acceptance above resistance can fuel continuation toward higher targets.

Let’s go and Trade now $BTC
·
--
Bullish
$ETH is showing strong recovery potential from key support with buyers stepping back in. Bullish structure remains valid while price holds above the support zone. Entry Zone: 1,725 – 1,735 Stop Loss: 1,710 Target 1: 1,745 Target 2: 1,760 Target 3: 1,780 Price reacted cleanly from liquidity below the recent low and is attempting to reclaim short-term structure. Holding above the entry zone keeps buyers in control, while acceptance above resistance can fuel continuation toward higher targets. Let’s go and Trade now $ETH
$ETH is showing strong recovery potential from key support with buyers stepping back in.
Bullish structure remains valid while price holds above the support zone.

Entry Zone: 1,725 – 1,735
Stop Loss: 1,710

Target 1: 1,745
Target 2: 1,760
Target 3: 1,780

Price reacted cleanly from liquidity below the recent low and is attempting to reclaim short-term structure. Holding above the entry zone keeps buyers in control, while acceptance above resistance can fuel continuation toward higher targets.

Let’s go and Trade now $ETH
·
--
Bullish
I’ve been digging into NEWT’s unlock schedule for nights now, and I can’t shake the knot in my stomach. I’ve been tracking NEWT’s price action and its token unlock schedule for days now, and I keep arriving at the same uncomfortable conclusion. Watching the chart compress around $0.049, I’m not seeing a sleepy market — I’m seeing a buildup of pressure that rarely resolves quietly. Volume has dropped roughly 22% from what I was measuring a week ago, and in my experience, that kind of contraction isn’t disinterest. It’s the silence before a directional explosion. What keeps me engaged is the genuine strength of the AI infrastructure narrative. Even with Bitcoin dominance hovering stubbornly near 55%, I’ve observed the AI token basket climb about 8% over the past seven days. That tells me capital is quietly rotating toward projects with actual utility, and NEWT’s positioning — bridging decentralized compute and AI model deployment — puts it squarely in that conversation. I’ve also picked up murmurs about a testnet upgrade and a potential GPU aggregator partnership, and if those materialize, I can easily see a fresh influx of node operators changing the supply-demand balance. For me, the $0.049 floor doesn’t look random; it looks like accumulation masked as sideways drift. But I have to be honest about what’s weighing on the other side. When I scan the order books, I see thick ask clusters parked at $0.053 and $0.058, and I know early buyers are quietly taking profits. The unlock schedule hanging overhead adds another layer of risk — a fresh supply wave that could suffocate any breakout unless spot demand absorbs it aggressively. I’m not interpreting these outflows as a fundamental rejection; they’re a rational response to sticky macro conditions and a market that currently rewards caution over speculation. @NewtonProtocol $NEWT #Newt
I’ve been digging into NEWT’s unlock schedule for nights now, and I can’t shake the knot in my stomach. I’ve been tracking NEWT’s price action and its token unlock schedule for days now, and I keep arriving at the same uncomfortable conclusion. Watching the chart compress around $0.049, I’m not seeing a sleepy market — I’m seeing a buildup of pressure that rarely resolves quietly. Volume has dropped roughly 22% from what I was measuring a week ago, and in my experience, that kind of contraction isn’t disinterest. It’s the silence before a directional explosion.

What keeps me engaged is the genuine strength of the AI infrastructure narrative. Even with Bitcoin dominance hovering stubbornly near 55%, I’ve observed the AI token basket climb about 8% over the past seven days. That tells me capital is quietly rotating toward projects with actual utility, and NEWT’s positioning — bridging decentralized compute and AI model deployment — puts it squarely in that conversation. I’ve also picked up murmurs about a testnet upgrade and a potential GPU aggregator partnership, and if those materialize, I can easily see a fresh influx of node operators changing the supply-demand balance. For me, the $0.049 floor doesn’t look random; it looks like accumulation masked as sideways drift.

But I have to be honest about what’s weighing on the other side. When I scan the order books, I see thick ask clusters parked at $0.053 and $0.058, and I know early buyers are quietly taking profits. The unlock schedule hanging overhead adds another layer of risk — a fresh supply wave that could suffocate any breakout unless spot demand absorbs it aggressively. I’m not interpreting these outflows as a fundamental rejection; they’re a rational response to sticky macro conditions and a market that currently rewards caution over speculation.

@NewtonProtocol $NEWT #Newt
Article
I’ve Been Studying NEWT’s Charts Nonstop — And the $0.049 Zone Is a Ticking Time BombI’ve spent the last few nights staring at NEWT’s chart and its token unlock schedule, and I keep coming back to the same uneasy conclusion. I’ve been glued to my screens for the past day, watching NEWT carve out a base that’s almost too quiet for comfort. Honestly, it’s rare that I see a market this evenly matched. The $0.049 level has turned into a psychological magnet, and the more I dig into the numbers, the more I feel we’re sitting just ahead of something violent. Volume has dropped by roughly 22% compared to what I was tracking a week ago, and that kind of compression is what I’ve learned to respect most — it’s not apathy, it’s a buildup. So what’s holding this thing together? I keep coming back to the AI infrastructure narrative. I’m not talking about generic buzzwords; I’m looking at actual sector flows. Over the last seven days, even with Bitcoin dominance breathing down everyone’s neck near 55%, the AI token basket has still managed to grind out roughly an 8% gain. That tells me capital is quietly rotating into projects that offer more than just memes. In my research, NEWT sits in a genuinely interesting spot — bridging decentralized compute with AI model deployment. I’ve also picked up chatter about a testnet upgrade and potential ties to a GPU aggregator, and if those rumors solidify, I think a wave of new node operators could flood in. For me, the $0.049 floor isn’t a random number; it feels like accumulation disguised as sideways chop. But I’d be lying if I said I’m not equally fixated on the sell-side. Every time I scan the order books, I see the same story: thick clusters of asks parked at $0.053 and $0.058. That’s the real ceiling. The capital outflows I’m observing aren’t a verdict on the project — they’re a symptom of a market that’s prioritizing capital preservation. Sticky inflation data, rate-cut delays, and a Bitcoin that refuses to give up ground have all forced money out of altcoins and into safety. Early NEWT buyers are taking profits, and stablecoin rotation is sapping the momentum. I don’t see this as a fundamental rejection; it’s just liquidity obeying macro gravity. But it means every push higher is a battle, and right now, the bears have the high ground at $0.049. From a technical standpoint, I’m treating $0.049 as the most important line in the sand. It’s flipped between support and resistance several times in recent sessions, and that indecision usually resolves with a sharp thrust. The volume profile has thinned out in both directions, and futures open interest is flat — which actually reassures me because we’re not building a leveraged powder keg. I’m watching two specific levels with my own money in mind. A clean, high-volume break above $0.053 would make me aim straight for $0.058, and I’d likely add to my position on a retest of that breakout. On the downside, losing $0.046 is my red flag. I’ve marked that as the trapdoor because it would likely trigger stop-loss cascades and drag us down toward $0.043, right around the 50-day moving average I’ve been tracking. So where does that leave me as a researcher? I deeply respect the AI narrative — it’s genuine, it’s building, and it could easily reignite flows if the macro environment eases even slightly. But I respect liquidity more. I won’t front-run a breakout until I see volume confirm the move. @NewtonProtocol $NEWT #Newt

I’ve Been Studying NEWT’s Charts Nonstop — And the $0.049 Zone Is a Ticking Time Bomb

I’ve spent the last few nights staring at NEWT’s chart and its token unlock schedule, and I keep coming back to the same uneasy conclusion. I’ve been glued to my screens for the past day, watching NEWT carve out a base that’s almost too quiet for comfort. Honestly, it’s rare that I see a market this evenly matched. The $0.049 level has turned into a psychological magnet, and the more I dig into the numbers, the more I feel we’re sitting just ahead of something violent. Volume has dropped by roughly 22% compared to what I was tracking a week ago, and that kind of compression is what I’ve learned to respect most — it’s not apathy, it’s a buildup.
So what’s holding this thing together? I keep coming back to the AI infrastructure narrative. I’m not talking about generic buzzwords; I’m looking at actual sector flows. Over the last seven days, even with Bitcoin dominance breathing down everyone’s neck near 55%, the AI token basket has still managed to grind out roughly an 8% gain. That tells me capital is quietly rotating into projects that offer more than just memes. In my research, NEWT sits in a genuinely interesting spot — bridging decentralized compute with AI model deployment. I’ve also picked up chatter about a testnet upgrade and potential ties to a GPU aggregator, and if those rumors solidify, I think a wave of new node operators could flood in.
For me, the $0.049 floor isn’t a random number; it feels like accumulation disguised as sideways chop. But I’d be lying if I said I’m not equally fixated on the sell-side. Every time I scan the order books, I see the same story: thick clusters of asks parked at $0.053 and $0.058. That’s the real ceiling. The capital outflows I’m observing aren’t a verdict on the project — they’re a symptom of a market that’s prioritizing capital preservation. Sticky inflation data, rate-cut delays, and a Bitcoin that refuses to give up ground have all forced money out of altcoins and into safety. Early NEWT buyers are taking profits, and stablecoin rotation is sapping the momentum. I don’t see this as a fundamental rejection; it’s just liquidity obeying macro gravity.
But it means every push higher is a battle, and right now, the bears have the high ground at $0.049. From a technical standpoint, I’m treating $0.049 as the most important line in the sand. It’s flipped between support and resistance several times in recent sessions, and that indecision usually resolves with a sharp thrust. The volume profile has thinned out in both directions, and futures open interest is flat — which actually reassures me because we’re not building a leveraged powder keg. I’m watching two specific levels with my own money in mind.
A clean, high-volume break above $0.053 would make me aim straight for $0.058, and I’d likely add to my position on a retest of that breakout. On the downside, losing $0.046 is my red flag. I’ve marked that as the trapdoor because it would likely trigger stop-loss cascades and drag us down toward $0.043, right around the 50-day moving average I’ve been tracking. So where does that leave me as a researcher? I deeply respect the AI narrative — it’s genuine, it’s building, and it could easily reignite flows if the macro environment eases even slightly. But I respect liquidity more. I won’t front-run a breakout until I see volume confirm the move.
@NewtonProtocol $NEWT #Newt
·
--
Bullish
$BNB showing resilience after tapping 576.39, buyers stepping back in with control. Structure holding above short-term support, momentum building for continuation. Entry Zone: 578.50 - 579.50 Stop Loss: 575.50 Target 1: 582.50 Target 2: 585.90 Target 3: 589.40 Price reacted sharply off liquidity near the 576 zone, sweeping lows before reclaiming structure. Buyers are defending this range with tighter candles, signaling absorption before the next leg. Watch for a clean break above 582.50 to confirm continuation. Let's go and Trade now $BNB
$BNB showing resilience after tapping 576.39, buyers stepping back in with control.
Structure holding above short-term support, momentum building for continuation.

Entry Zone: 578.50 - 579.50
Stop Loss: 575.50

Target 1: 582.50
Target 2: 585.90
Target 3: 589.40

Price reacted sharply off liquidity near the 576 zone, sweeping lows before reclaiming structure. Buyers are defending this range with tighter candles, signaling absorption before the next leg. Watch for a clean break above 582.50 to confirm continuation.

Let's go and Trade now $BNB
·
--
Bullish
I've been sitting with the NEWT chart for hours now, and I can't shake the feeling that something meaningful just happened. When that red candle ripped through, my stomach dropped — you know the one I mean, the kind that makes you second-guess every assumption you've been nursing. I've been wrecked by those moves before, so I didn't look away. I watched the tape tick by tick. And right at $0.050, it was like a switch flipped. The selling just evaporated into a wall of bids that felt less like a bounce and more like a deliberate, premeditated claim. I actually leaned forward in my chair. That wasn't a lucky save. That was someone — or a lot of someones — defending a price they clearly refused to let go. As a researcher, I've learned to trust my curiosity when a reaction feels out of place. So I started digging again, not just into the chart but into the whole reason NEWT exists. I've been tracking the AI-compliance space quietly for months, and I honestly think the market is sleeping on how fast the regulatory framework is hardening. We're not drifting toward suggestions anymore. We're heading straight into mandates — immutable audit logs, cryptographic proof that AI decisions stayed inside their guardrails. NEWT sits at that exact intersection, anchoring verification on-chain. If the world moves even halfway in that direction, this stops being a speculative punt and starts looking like plumbing no one can afford to live without. That fundamental anchor, I believe, is what gave those buyers the conviction to step in when fear was everywhere. Smart money doesn't panic. It waits for moments exactly like this. When I pulled up the technicals, the picture made even more sense. The RSI on my four-hour chart had collapsed well below 30, the sort of oversold reading that usually precedes at least a temporary exhaustion of sellers. The stochastic was buried in single digits and already curling higher. But it was the volume that really locked my gaze. Right at the $0.050 line, there was a spike so sharp it looked like a misprint. @NewtonProtocol $NEWT #Newt
I've been sitting with the NEWT chart for hours now, and I can't shake the feeling that something meaningful just happened. When that red candle ripped through, my stomach dropped — you know the one I mean, the kind that makes you second-guess every assumption you've been nursing. I've been wrecked by those moves before, so I didn't look away. I watched the tape tick by tick. And right at $0.050, it was like a switch flipped. The selling just evaporated into a wall of bids that felt less like a bounce and more like a deliberate, premeditated claim. I actually leaned forward in my chair. That wasn't a lucky save. That was someone — or a lot of someones — defending a price they clearly refused to let go.

As a researcher, I've learned to trust my curiosity when a reaction feels out of place. So I started digging again, not just into the chart but into the whole reason NEWT exists. I've been tracking the AI-compliance space quietly for months, and I honestly think the market is sleeping on how fast the regulatory framework is hardening. We're not drifting toward suggestions anymore. We're heading straight into mandates — immutable audit logs, cryptographic proof that AI decisions stayed inside their guardrails. NEWT sits at that exact intersection, anchoring verification on-chain. If the world moves even halfway in that direction, this stops being a speculative punt and starts looking like plumbing no one can afford to live without. That fundamental anchor, I believe, is what gave those buyers the conviction to step in when fear was everywhere. Smart money doesn't panic. It waits for moments exactly like this.

When I pulled up the technicals, the picture made even more sense. The RSI on my four-hour chart had collapsed well below 30, the sort of oversold reading that usually precedes at least a temporary exhaustion of sellers. The stochastic was buried in single digits and already curling higher. But it was the volume that really locked my gaze. Right at the $0.050 line, there was a spike so sharp it looked like a misprint.

@NewtonProtocol $NEWT #Newt
Article
I Caught NEWT Defending $0.050 – A Researcher’s Take on the AI-Compliance Reversal Taking Shape NowI’ll be honest with you. I was glued to the NEWT chart when that sudden red candle tore through the order book. You know the kind I mean – the one that sends a chill through your gut and makes you question whether the floor is about to vanish entirely. I’ve been on the wrong side of those moves before, so I watched carefully. But something different happened this time. The price hit $0.050 and just… stopped. Not a wobbly pause, not a hesitant bounce, but a crisp rejection that felt more like a door slamming shut than a polite knock. Since that moment, I’ve watched NEWT settle into a quiet, confident consolidation right around that level. As someone who researches crypto assets day in and day out, I’ve learned to pay attention when a sell-off meets a wall instead of a trapdoor. That reaction tells me there’s a genuine floor here, and I want to walk you through exactly what I’m seeing from both a fundamental and technical lens. I’ve spent a lot of time lately digging into the AI-Compliance narrative, and I’m convinced it’s far more than a fleeting buzzword. The regulatory machinery around artificial intelligence is spinning up at a pace that honestly surprised me. We’re moving past the era of vague guidelines and into mandates that will require transparency, audit trails, and verifiable decision logs for AI systems. I’m not talking about something hypothetical five years down the road – this is being drafted into law right now. NEWT’s core purpose, from what I’ve studied, revolves around on-chain verification and anchoring those critical audit layers that AI systems will need to prove they’re operating within the rules. When I evaluate a project, I ask myself a simple question: if the world moves in this direction, will this token be a nice-to-have or a must-have? For the AI-Compliance angle, I genuinely believe we’re looking at a must-have scenario. That kind of real-world utility doesn’t just boost price during a bull run; it acts like a safety net when fear creeps in. It gives serious buyers a reason to step in and accumulate when others are panic-selling, and that’s exactly the behavior I think we just witnessed. I don’t see the stabilization at $0.050 as random luck. I see it as smart money quietly building a position on a long-term narrative that hasn’t been fully priced in yet, and that gets my attention as a researcher. Now, let me put my technician hat on, because the chart is telling me something I’ve seen before in setups I deeply respect. When that dip hit, the relative strength index on the 4-hour chart buried itself below 30. I always keep an eye on RSI, and seeing it dive that deep into oversold territory followed by a curl upward immediately raises my antenna. To me, that’s the market catching its breath and momentum starting to shift back into the hands of buyers. The stochastic oscillator painted a similar picture, crashing into single digits and then crossing higher, which I’ve come to trust as a sign that selling pressure has exhausted itself. But the element that really locked in my conviction was volume. Right at that $0.050 line, a massive surge of buying activity exploded onto the tape. I’m not talking about a little tick up; it was the kind of volume spike that tells me large players were actively absorbing the sell orders. That psychological round number transformed from a tentative line in the sand into a high-demand zone, and the bullish engulfing candle that followed felt like a declaration. In my own trading journal, I’ve noted that when a dip ends with this particular combination – oversold readings, a clear support hold, and heavy accumulation volume – the subsequent recovery often has real legs. So, where does that leave me as I plan my next steps? I’m now treating $0.050 as the line that must not break. A daily close beneath that would make me step back and rethink the entire thesis, because it would signal that the accumulation I think I saw wasn’t strong enough to hold. I’d rather be patient and wrong than stubborn and wrecked. The level I’m watching for confirmation is $0.055. A clean thrust and close above that resistance would tell me the trend has truly flipped from corrective to impulsive, and that would embolden me to look toward $0.062 to $0.065 as a reasonable near-term target. I’ve already placed a mental stop in my mind just a touch below $0.050, somewhere around $0.048, to keep my risk defined and my downside small. I never commit more than I can afford to lose on a single idea – research, for me, is about stacking probabilities, not rolling the dice. On my own chart, I’ve drawn a bold line at $0.050, highlighted the oversold RSI dip, and circled that beautiful volume spike, because together they paint a picture I’ve learned to respect. @NewtonProtocol $NEWT #Newt

I Caught NEWT Defending $0.050 – A Researcher’s Take on the AI-Compliance Reversal Taking Shape Now

I’ll be honest with you. I was glued to the NEWT chart when that sudden red candle tore through the order book. You know the kind I mean – the one that sends a chill through your gut and makes you question whether the floor is about to vanish entirely. I’ve been on the wrong side of those moves before, so I watched carefully. But something different happened this time. The price hit $0.050 and just… stopped. Not a wobbly pause, not a hesitant bounce, but a crisp rejection that felt more like a door slamming shut than a polite knock. Since that moment, I’ve watched NEWT settle into a quiet, confident consolidation right around that level. As someone who researches crypto assets day in and day out, I’ve learned to pay attention when a sell-off meets a wall instead of a trapdoor. That reaction tells me there’s a genuine floor here, and I want to walk you through exactly what I’m seeing from both a fundamental and technical lens.
I’ve spent a lot of time lately digging into the AI-Compliance narrative, and I’m convinced it’s far more than a fleeting buzzword. The regulatory machinery around artificial intelligence is spinning up at a pace that honestly surprised me. We’re moving past the era of vague guidelines and into mandates that will require transparency, audit trails, and verifiable decision logs for AI systems. I’m not talking about something hypothetical five years down the road – this is being drafted into law right now. NEWT’s core purpose, from what I’ve studied, revolves around on-chain verification and anchoring those critical audit layers that AI systems will need to prove they’re operating within the rules. When I evaluate a project, I ask myself a simple question: if the world moves in this direction, will this token be a nice-to-have or a must-have? For the AI-Compliance angle, I genuinely believe we’re looking at a must-have scenario. That kind of real-world utility doesn’t just boost price during a bull run; it acts like a safety net when fear creeps in. It gives serious buyers a reason to step in and accumulate when others are panic-selling, and that’s exactly the behavior I think we just witnessed. I don’t see the stabilization at $0.050 as random luck. I see it as smart money quietly building a position on a long-term narrative that hasn’t been fully priced in yet, and that gets my attention as a researcher.
Now, let me put my technician hat on, because the chart is telling me something I’ve seen before in setups I deeply respect. When that dip hit, the relative strength index on the 4-hour chart buried itself below 30. I always keep an eye on RSI, and seeing it dive that deep into oversold territory followed by a curl upward immediately raises my antenna. To me, that’s the market catching its breath and momentum starting to shift back into the hands of buyers. The stochastic oscillator painted a similar picture, crashing into single digits and then crossing higher, which I’ve come to trust as a sign that selling pressure has exhausted itself. But the element that really locked in my conviction was volume. Right at that $0.050 line, a massive surge of buying activity exploded onto the tape. I’m not talking about a little tick up; it was the kind of volume spike that tells me large players were actively absorbing the sell orders. That psychological round number transformed from a tentative line in the sand into a high-demand zone, and the bullish engulfing candle that followed felt like a declaration. In my own trading journal, I’ve noted that when a dip ends with this particular combination – oversold readings, a clear support hold, and heavy accumulation volume – the subsequent recovery often has real legs.
So, where does that leave me as I plan my next steps? I’m now treating $0.050 as the line that must not break. A daily close beneath that would make me step back and rethink the entire thesis, because it would signal that the accumulation I think I saw wasn’t strong enough to hold. I’d rather be patient and wrong than stubborn and wrecked. The level I’m watching for confirmation is $0.055. A clean thrust and close above that resistance would tell me the trend has truly flipped from corrective to impulsive, and that would embolden me to look toward $0.062 to $0.065 as a reasonable near-term target. I’ve already placed a mental stop in my mind just a touch below $0.050, somewhere around $0.048, to keep my risk defined and my downside small. I never commit more than I can afford to lose on a single idea – research, for me, is about stacking probabilities, not rolling the dice. On my own chart, I’ve drawn a bold line at $0.050, highlighted the oversold RSI dip, and circled that beautiful volume spike, because together they paint a picture I’ve learned to respect.
@NewtonProtocol $NEWT #Newt
·
--
Bullish
$BNB is showing strong bullish momentum with buyers defending higher lows. Bullish structure remains intact while buyers stay in control. Entry Zone: 582.00 – 585.00 Stop Loss: 570.00 Target 1: 590.00 Target 2: 598.00 Target 3: 605.00 Liquidity has been swept below the recent low, followed by a strong impulsive reclaim. Price is reacting from demand with bullish market structure, and holding above the entry zone keeps the continuation setup valid. Let’s go and Trade now $BNB
$BNB is showing strong bullish momentum with buyers defending higher lows.
Bullish structure remains intact while buyers stay in control.

Entry Zone: 582.00 – 585.00
Stop Loss: 570.00

Target 1: 590.00
Target 2: 598.00
Target 3: 605.00

Liquidity has been swept below the recent low, followed by a strong impulsive reclaim. Price is reacting from demand with bullish market structure, and holding above the entry zone keeps the continuation setup valid.

Let’s go and Trade now $BNB
·
--
Bullish
$ETH is showing strong bullish momentum with buyers defending higher lows. Bullish structure remains intact while buyers stay in control. Entry Zone: 1,780 – 1,790 Stop Loss: 1,728 Target 1: 1,805 Target 2: 1,825 Target 3: 1,850 Liquidity has been swept below the recent low, followed by a strong impulsive reclaim. Price is reacting from demand with bullish market structure, and holding above the entry zone keeps the continuation setup valid. Let’s go and Trade now $ETH
$ETH is showing strong bullish momentum with buyers defending higher lows.
Bullish structure remains intact while buyers stay in control.

Entry Zone: 1,780 – 1,790
Stop Loss: 1,728

Target 1: 1,805
Target 2: 1,825
Target 3: 1,850

Liquidity has been swept below the recent low, followed by a strong impulsive reclaim. Price is reacting from demand with bullish market structure, and holding above the entry zone keeps the continuation setup valid.

Let’s go and Trade now $ETH
·
--
Bullish
$BTC is showing signs of holding key support after a sharp liquidity sweep. Structure is still bearish, but buyers are defending the current demand zone. Entry Zone: 62,500 – 62,700 Stop Loss: 62,350 Target 1: 62,850 Target 2: 63,050 Target 3: 63,450 Price has swept liquidity below the recent low and is reacting from support. A sustained hold above the entry zone can trigger a relief move into nearby resistance while overall structure remains the key confirmation. Let’s go and Trade now $BTC
$BTC is showing signs of holding key support after a sharp liquidity sweep.
Structure is still bearish, but buyers are defending the current demand zone.

Entry Zone: 62,500 – 62,700
Stop Loss: 62,350

Target 1: 62,850
Target 2: 63,050
Target 3: 63,450

Price has swept liquidity below the recent low and is reacting from support. A sustained hold above the entry zone can trigger a relief move into nearby resistance while overall structure remains the key confirmation.

Let’s go and Trade now $BTC
·
--
Bullish
I’ve been digging into NEWT’s unlock schedule for nights now, and I can’t shake the knot in my stomach. The AI-powered yield hunting, the live product, the August mainnet whispers—it’s a genuinely sharp narrative. I’m not going to pretend otherwise. That story has enough juice to shove price straight through a dollar and maybe even spark a blow-off top beyond. I’ve seen momentum turn into a self-fulfilling frenzy before, and right now the chart is begging for another leg up. But my job isn’t to cheer the candles. It’s to look around the corner. And the corner I keep seeing is July 24, when twelve million tokens—an 8% supply injection—unlock into the wallets of early investors and advisors who got in around ten cents. With NEWT floating near ninety, those backers are sitting on a nine-bagger. I’ve lived through enough unlock cycles to know how this typically ends: a rush for the exit, a violent repricing, often a 25% to 40% flush within three days. The numbers don’t care how good the product is. So I’ve been honest with myself about what I’d do. I’d lighten my position aggressively into the old resistance turned support around eighty-five cents. That’s my exit ramp. If I stayed in, I’d treat any surge above a dollar as a liquidity trap, not a breakout, and I’d drag a tight stop-loss higher with every candle. But my real focus is already shifting to on-chain data. Starting July 23, I’ll be glued to exchange netflows. If I see a sudden spike of half a million tokens flooding trading platforms in a few hours, that’s my cue—the signal that smart money is preparing to dump. I’d step aside entirely. I refuse to be exit liquidity. I’m not permanently bearish. If the unlock triggers a sharp flush into the mid-sixties and price can reclaim sixty-eight cents with strong volume, my researcher brain will flip from cautious to curious. That’s my re-entry zone. I won’t try to catch a falling knife. I’ll wait for the market to prove the dump has been absorbed. @NewtonProtocol $NEWT #Newt
I’ve been digging into NEWT’s unlock schedule for nights now, and I can’t shake the knot in my stomach. The AI-powered yield hunting, the live product, the August mainnet whispers—it’s a genuinely sharp narrative. I’m not going to pretend otherwise. That story has enough juice to shove price straight through a dollar and maybe even spark a blow-off top beyond. I’ve seen momentum turn into a self-fulfilling frenzy before, and right now the chart is begging for another leg up.

But my job isn’t to cheer the candles. It’s to look around the corner. And the corner I keep seeing is July 24, when twelve million tokens—an 8% supply injection—unlock into the wallets of early investors and advisors who got in around ten cents. With NEWT floating near ninety, those backers are sitting on a nine-bagger. I’ve lived through enough unlock cycles to know how this typically ends: a rush for the exit, a violent repricing, often a 25% to 40% flush within three days. The numbers don’t care how good the product is.

So I’ve been honest with myself about what I’d do. I’d lighten my position aggressively into the old resistance turned support around eighty-five cents. That’s my exit ramp. If I stayed in, I’d treat any surge above a dollar as a liquidity trap, not a breakout, and I’d drag a tight stop-loss higher with every candle. But my real focus is already shifting to on-chain data. Starting July 23, I’ll be glued to exchange netflows. If I see a sudden spike of half a million tokens flooding trading platforms in a few hours, that’s my cue—the signal that smart money is preparing to dump. I’d step aside entirely. I refuse to be exit liquidity.

I’m not permanently bearish. If the unlock triggers a sharp flush into the mid-sixties and price can reclaim sixty-eight cents with strong volume, my researcher brain will flip from cautious to curious. That’s my re-entry zone. I won’t try to catch a falling knife. I’ll wait for the market to prove the dump has been absorbed.

@NewtonProtocol $NEWT #Newt
Article
I Studied NEWT’s July 24 Unlock – Here’s What I’m Actually DoingI’ve spent the last few nights staring at NEWT’s chart and its token unlock schedule, and I keep coming back to the same uneasy conclusion. The AI-Finance story here is genuinely compelling. I’m not going to pretend otherwise. A live beta product that uses machine learning to hunt yield, real partnerships rolling out, and a mainnet upgrade whispered for August – all of that is the kind of fuel that can send a token ripping higher. I watched NEWT slice through $0.85 like it was nothing, turning an old resistance level into fresh support, and right now the price action is screaming that a test of $1.00 is imminent. A blow-off top into the mid-$1.10s wouldn’t shock me at all. The AI narrative is a magnet for retail money, and momentum can be a self-fulfilling prophecy in the short term. But my job as a researcher isn’t to cheerlead the chart. It’s to look around the corner. And the corner I see is July 24. On that date, 12 million NEWT tokens get unleashed on the market, a straight 8% injection into the circulating supply. These tokens are landing in the wallets of private investors and team advisors who got in at an average of $0.10. With NEWT sitting near $0.90 as I write this, those early backers are nursing a 9x paper gain. I’ve been through enough unlock cycles to know how this story usually ends: VCs sitting on life-changing profits rarely choose to diamond-hand through a cliff event. They de-risk, they redeploy, and they don’t care about your technical analysis. The first major unlock after a token generation event is historically a wrecking ball – a 25% to 40% correction within 72 hours is the base case unless demand instantly swallows that new supply. The numbers don’t lie, and they don’t make exceptions for strong narratives. So I’ve been asking myself: what would I actually do if I had a position here? And I’ve mapped out my own honest answer. If I were holding a bag in profit right now, I’d be trimming it aggressively before July 24. The $0.85 zone that once rejected price is now my exit ramp. I’d rather lock in gains and sleep well than ride a dilution-driven collapse for the sake of a few extra percentage points. For anyone determined to stay in, I’d treat any pump above $1.00 in the coming days as a liquidity trap, not a breakout. I’d trail a tight stop-loss, inching it upward every couple of percent, and I’d be ready to vanish at the first sign of distribution. I’m not permanently bearish on NEWT. If the unlock does trigger a sharp flush into the $0.65–$0.70 pocket and the price manages to hold the 200-day moving average around $0.63, my researcher brain will switch from cautious to curious. That’s my potential re-entry zone. But I won’t be a hero trying to catch a falling knife. I’ll wait for a daily close above $0.68 with rising volume – a simple confirmation that buyers have stepped in and the dump has been absorbed. Then, and only then, I’ll consider deploying capital, knowing the AI story still has legs and the worst of the supply shock is behind us. The tool I’ll lean on most heavily is exchange netflow data. Starting July 23, I’ll be glued to on-chain metrics, specifically watching for a sudden spike in NEWT inflows to exchanges. If I see more than 500,000 tokens flooding onto trading platforms in a matter of hours, that’s my signal that the VCs are preparing to sell. At that moment, I’m stepping aside entirely or tightening my stop-losses to breakeven. I refuse to be exit liquidity. In the end, this is a battle between a really attractive AI product and cold, unforgiving token mechanics. The week of July 24 is going to be a high-volatility mess, littered with fakeouts. I’ll be watching from the sidelines, waiting for the market to show its hand before I commit a single dollar. The thesis is strong, but in trading, timing always beats narrative. I’m curious: are you planning to hunt for a bottom after July 24, or does this unlock make NEWT untouchable for you? Let me know in the comments. @NewtonProtocol $NEWT #Newt

I Studied NEWT’s July 24 Unlock – Here’s What I’m Actually Doing

I’ve spent the last few nights staring at NEWT’s chart and its token unlock schedule, and I keep coming back to the same uneasy conclusion. The AI-Finance story here is genuinely compelling. I’m not going to pretend otherwise. A live beta product that uses machine learning to hunt yield, real partnerships rolling out, and a mainnet upgrade whispered for August – all of that is the kind of fuel that can send a token ripping higher. I watched NEWT slice through $0.85 like it was nothing, turning an old resistance level into fresh support, and right now the price action is screaming that a test of $1.00 is imminent. A blow-off top into the mid-$1.10s wouldn’t shock me at all. The AI narrative is a magnet for retail money, and momentum can be a self-fulfilling prophecy in the short term.
But my job as a researcher isn’t to cheerlead the chart. It’s to look around the corner. And the corner I see is July 24. On that date, 12 million NEWT tokens get unleashed on the market, a straight 8% injection into the circulating supply. These tokens are landing in the wallets of private investors and team advisors who got in at an average of $0.10. With NEWT sitting near $0.90 as I write this, those early backers are nursing a 9x paper gain. I’ve been through enough unlock cycles to know how this story usually ends: VCs sitting on life-changing profits rarely choose to diamond-hand through a cliff event. They de-risk, they redeploy, and they don’t care about your technical analysis. The first major unlock after a token generation event is historically a wrecking ball – a 25% to 40% correction within 72 hours is the base case unless demand instantly swallows that new supply. The numbers don’t lie, and they don’t make exceptions for strong narratives.
So I’ve been asking myself: what would I actually do if I had a position here? And I’ve mapped out my own honest answer. If I were holding a bag in profit right now, I’d be trimming it aggressively before July 24. The $0.85 zone that once rejected price is now my exit ramp. I’d rather lock in gains and sleep well than ride a dilution-driven collapse for the sake of a few extra percentage points. For anyone determined to stay in, I’d treat any pump above $1.00 in the coming days as a liquidity trap, not a breakout. I’d trail a tight stop-loss, inching it upward every couple of percent, and I’d be ready to vanish at the first sign of distribution.
I’m not permanently bearish on NEWT. If the unlock does trigger a sharp flush into the $0.65–$0.70 pocket and the price manages to hold the 200-day moving average around $0.63, my researcher brain will switch from cautious to curious. That’s my potential re-entry zone. But I won’t be a hero trying to catch a falling knife. I’ll wait for a daily close above $0.68 with rising volume – a simple confirmation that buyers have stepped in and the dump has been absorbed. Then, and only then, I’ll consider deploying capital, knowing the AI story still has legs and the worst of the supply shock is behind us.
The tool I’ll lean on most heavily is exchange netflow data. Starting July 23, I’ll be glued to on-chain metrics, specifically watching for a sudden spike in NEWT inflows to exchanges. If I see more than 500,000 tokens flooding onto trading platforms in a matter of hours, that’s my signal that the VCs are preparing to sell. At that moment, I’m stepping aside entirely or tightening my stop-losses to breakeven. I refuse to be exit liquidity.
In the end, this is a battle between a really attractive AI product and cold, unforgiving token mechanics. The week of July 24 is going to be a high-volatility mess, littered with fakeouts. I’ll be watching from the sidelines, waiting for the market to show its hand before I commit a single dollar. The thesis is strong, but in trading, timing always beats narrative. I’m curious: are you planning to hunt for a bottom after July 24, or does this unlock make NEWT untouchable for you? Let me know in the comments.
@NewtonProtocol $NEWT #Newt
·
--
Bullish
I’ve been tracking NEWT’s quiet 2.4% move all afternoon, and honestly, it’s got my full attention. The broader market is barely breathing, yet this token is inching higher, hovering right around $0.0845. I can’t help but dig deeper. The catalyst is clearly the AI narrative, and I have to admit, NEWT has a more compelling story than most. It’s not chasing memes; it’s trying to build a decentralized compute layer for artificial intelligence, rewarding node operators for contributing GPU power to model training. For a researcher like me, that’s a thesis I can actually take seriously. The long-term vision clicks. But my training tells me to look beyond the narrative, and when I flipped over to the tokenomics, my stomach tightened. July 10th is circled in red on my calendar. That day, roughly fifteen million tokens—over five percent of the circulating supply—unlock for early investors and the team. I’ve studied enough unlock events to know this rarely ends quietly. These holders are sitting on massive paper gains, and for many, this is the first chance to de-risk. Even a modest sell-off from them can crush a fragile uptrend, and the market has a cruel habit of front-running these events. That beautiful 2.4% pump suddenly feels like a trap. The chart isn’t soothing my nerves either. That little bounce has pressed the price exactly into the 50-day EMA near $0.0850, a level that has rejected NEWT three times in the past two weeks. Each failure came on declining volume, which tells me buyers aren’t showing up with real conviction. To my eyes, this isn’t a breakout; it’s an exhaustion move into resistance. I’d need to see a decisive close above $0.0870 on strong volume before I’d even begin to trust this rally. Without that, I’m staring at a potential dead-cat bounce ahead of a supply shock. Support down at $0.0800 looks fragile, and if that gives way after the unlock, $0.0720 is the next logical landing zone. @NewtonProtocol $NEWT #Newt
I’ve been tracking NEWT’s quiet 2.4% move all afternoon, and honestly, it’s got my full attention. The broader market is barely breathing, yet this token is inching higher, hovering right around $0.0845. I can’t help but dig deeper. The catalyst is clearly the AI narrative, and I have to admit, NEWT has a more compelling story than most. It’s not chasing memes; it’s trying to build a decentralized compute layer for artificial intelligence, rewarding node operators for contributing GPU power to model training. For a researcher like me, that’s a thesis I can actually take seriously. The long-term vision clicks.

But my training tells me to look beyond the narrative, and when I flipped over to the tokenomics, my stomach tightened. July 10th is circled in red on my calendar. That day, roughly fifteen million tokens—over five percent of the circulating supply—unlock for early investors and the team. I’ve studied enough unlock events to know this rarely ends quietly. These holders are sitting on massive paper gains, and for many, this is the first chance to de-risk. Even a modest sell-off from them can crush a fragile uptrend, and the market has a cruel habit of front-running these events. That beautiful 2.4% pump suddenly feels like a trap.

The chart isn’t soothing my nerves either. That little bounce has pressed the price exactly into the 50-day EMA near $0.0850, a level that has rejected NEWT three times in the past two weeks. Each failure came on declining volume, which tells me buyers aren’t showing up with real conviction. To my eyes, this isn’t a breakout; it’s an exhaustion move into resistance. I’d need to see a decisive close above $0.0870 on strong volume before I’d even begin to trust this rally. Without that, I’m staring at a potential dead-cat bounce ahead of a supply shock. Support down at $0.0800 looks fragile, and if that gives way after the unlock, $0.0720 is the next logical landing zone.

@NewtonProtocol $NEWT #Newt
Article
I’m Watching NEWT’s 2.4% Bounce—But I Won’t Touch It Before July 10. Here’s Why.I’ve been staring at NEWT’s chart for the better part of the afternoon. It’s up 2.4% while most of the market is napping, currently hovering around $0.0845. That kind of quiet strength always makes me lean in a little closer. The reason behind it isn’t a mystery—the AI narrative is white-hot right now, and NEWT has managed to latch itself onto something deeper than just hype. I’m looking at a project that wants to be the decentralized backbone for AI compute, a protocol where regular people spin up GPU nodes and get rewarded for powering model training and inference. It’s a real utility play, not some animal-themed gamble, and I can see why capital is slowly trickling in. But as much as I respect the vision, there’s something on the calendar that I simply can’t unsee. I’ve dug into the tokenomics, and what I found stopped me cold. On July 10th, a cliff unlock is set to release roughly 15 million tokens—that translates to about 5.2% of the circulating supply—straight into the wallets of early investors and team members. These aren’t retail holders who might diamond-hand through turbulence. These are insiders who’ve been sitting on paper gains for months, maybe years, and this unlock is their first real window to de-risk. I’ve watched this movie before. Even if only a fraction decides to sell, a sudden 5% supply injection hits order books like a sledgehammer. I’ve learned the hard way that tokens tend to bleed in the days leading up to these events and stay volatile for a while after. So when I see NEWT nudging higher right now, a quiet voice in my head says: bull trap. The chart doesn’t do much to quiet that voice either. That 2.4% bump I mentioned? It’s pushed the price right into the 50-day EMA at $0.0850 —a level that has smacked NEWT down three times in the last two weeks. Each rejection came with noticeably thin volume, which tells me buyers aren’t showing up with any real hunger. To my eyes, this isn’t a breakout in the making. It’s a low-energy drift into resistance. If I saw a decisive 4-hour candle close above $0.0870 backed by serious volume, I’d sit up and reassess everything. Until then, this looks like a classic dead-cat bounce before the real test. On the downside, $0.0800 is the support I’m watching; if that breaks after the unlock, I’d fully expect a slide toward $0.0720. I want to be clear: I’m not trashing the project. The long-term picture around decentralized AI infrastructure is genuinely exciting, and if NEWT’s team executes, this token could find a solid place in the ecosystem. But right now, I’m caught between a narrative I believe in and a liquidity event I’ve seen wreck rallies too many times. In the short term, tokenomics almost always win that fight. So here’s what I’m doing personally. Nothing. I’m keeping my hands in my pockets until the July 10 unlock is in the rearview mirror. I want to see how the market absorbs that wave of potential selling before I commit a single dollar. If NEWT can claw its way back above $0.0870 on strong volume after the supply shock, I’ll take that as a sign that the worst is over and start looking for entries. Chasing this little pump right now without a tight stop-loss below $0.0800 feels like trying to catch a falling knife in the dark. Patience is boring, I know. But in moments like this, patience is also the only edge I’ve got. @NewtonProtocol $NEWT #Newt

I’m Watching NEWT’s 2.4% Bounce—But I Won’t Touch It Before July 10. Here’s Why.

I’ve been staring at NEWT’s chart for the better part of the afternoon. It’s up 2.4% while most of the market is napping, currently hovering around $0.0845. That kind of quiet strength always makes me lean in a little closer. The reason behind it isn’t a mystery—the AI narrative is white-hot right now, and NEWT has managed to latch itself onto something deeper than just hype. I’m looking at a project that wants to be the decentralized backbone for AI compute, a protocol where regular people spin up GPU nodes and get rewarded for powering model training and inference. It’s a real utility play, not some animal-themed gamble, and I can see why capital is slowly trickling in.
But as much as I respect the vision, there’s something on the calendar that I simply can’t unsee. I’ve dug into the tokenomics, and what I found stopped me cold. On July 10th, a cliff unlock is set to release roughly 15 million tokens—that translates to about 5.2% of the circulating supply—straight into the wallets of early investors and team members. These aren’t retail holders who might diamond-hand through turbulence. These are insiders who’ve been sitting on paper gains for months, maybe years, and this unlock is their first real window to de-risk. I’ve watched this movie before. Even if only a fraction decides to sell, a sudden 5% supply injection hits order books like a sledgehammer. I’ve learned the hard way that tokens tend to bleed in the days leading up to these events and stay volatile for a while after. So when I see NEWT nudging higher right now, a quiet voice in my head says: bull trap.
The chart doesn’t do much to quiet that voice either. That 2.4% bump I mentioned? It’s pushed the price right into the 50-day EMA at $0.0850 —a level that has smacked NEWT down three times in the last two weeks. Each rejection came with noticeably thin volume, which tells me buyers aren’t showing up with any real hunger. To my eyes, this isn’t a breakout in the making. It’s a low-energy drift into resistance. If I saw a decisive 4-hour candle close above $0.0870 backed by serious volume, I’d sit up and reassess everything. Until then, this looks like a classic dead-cat bounce before the real test. On the downside, $0.0800 is the support I’m watching; if that breaks after the unlock, I’d fully expect a slide toward $0.0720.
I want to be clear: I’m not trashing the project. The long-term picture around decentralized AI infrastructure is genuinely exciting, and if NEWT’s team executes, this token could find a solid place in the ecosystem. But right now, I’m caught between a narrative I believe in and a liquidity event I’ve seen wreck rallies too many times. In the short term, tokenomics almost always win that fight.
So here’s what I’m doing personally. Nothing. I’m keeping my hands in my pockets until the July 10 unlock is in the rearview mirror. I want to see how the market absorbs that wave of potential selling before I commit a single dollar. If NEWT can claw its way back above $0.0870 on strong volume after the supply shock, I’ll take that as a sign that the worst is over and start looking for entries. Chasing this little pump right now without a tight stop-loss below $0.0800 feels like trying to catch a falling knife in the dark. Patience is boring, I know. But in moments like this, patience is also the only edge I’ve got.
@NewtonProtocol $NEWT #Newt
·
--
Bullish
$SOL is showing resilient bullish momentum with buyers defending key support. Bullish structure remains intact while buyers stay in control. Entry Zone: 80.90 – 81.15 Stop Loss: 80.30 Target 1: 81.69 Target 2: 82.20 Target 3: 82.78 Price is reacting well from intraday demand after sweeping nearby liquidity. Holding above support keeps the structure constructive, and sustained buying pressure favors continuation toward higher liquidity levels. Let’s go and Trade now $SOL
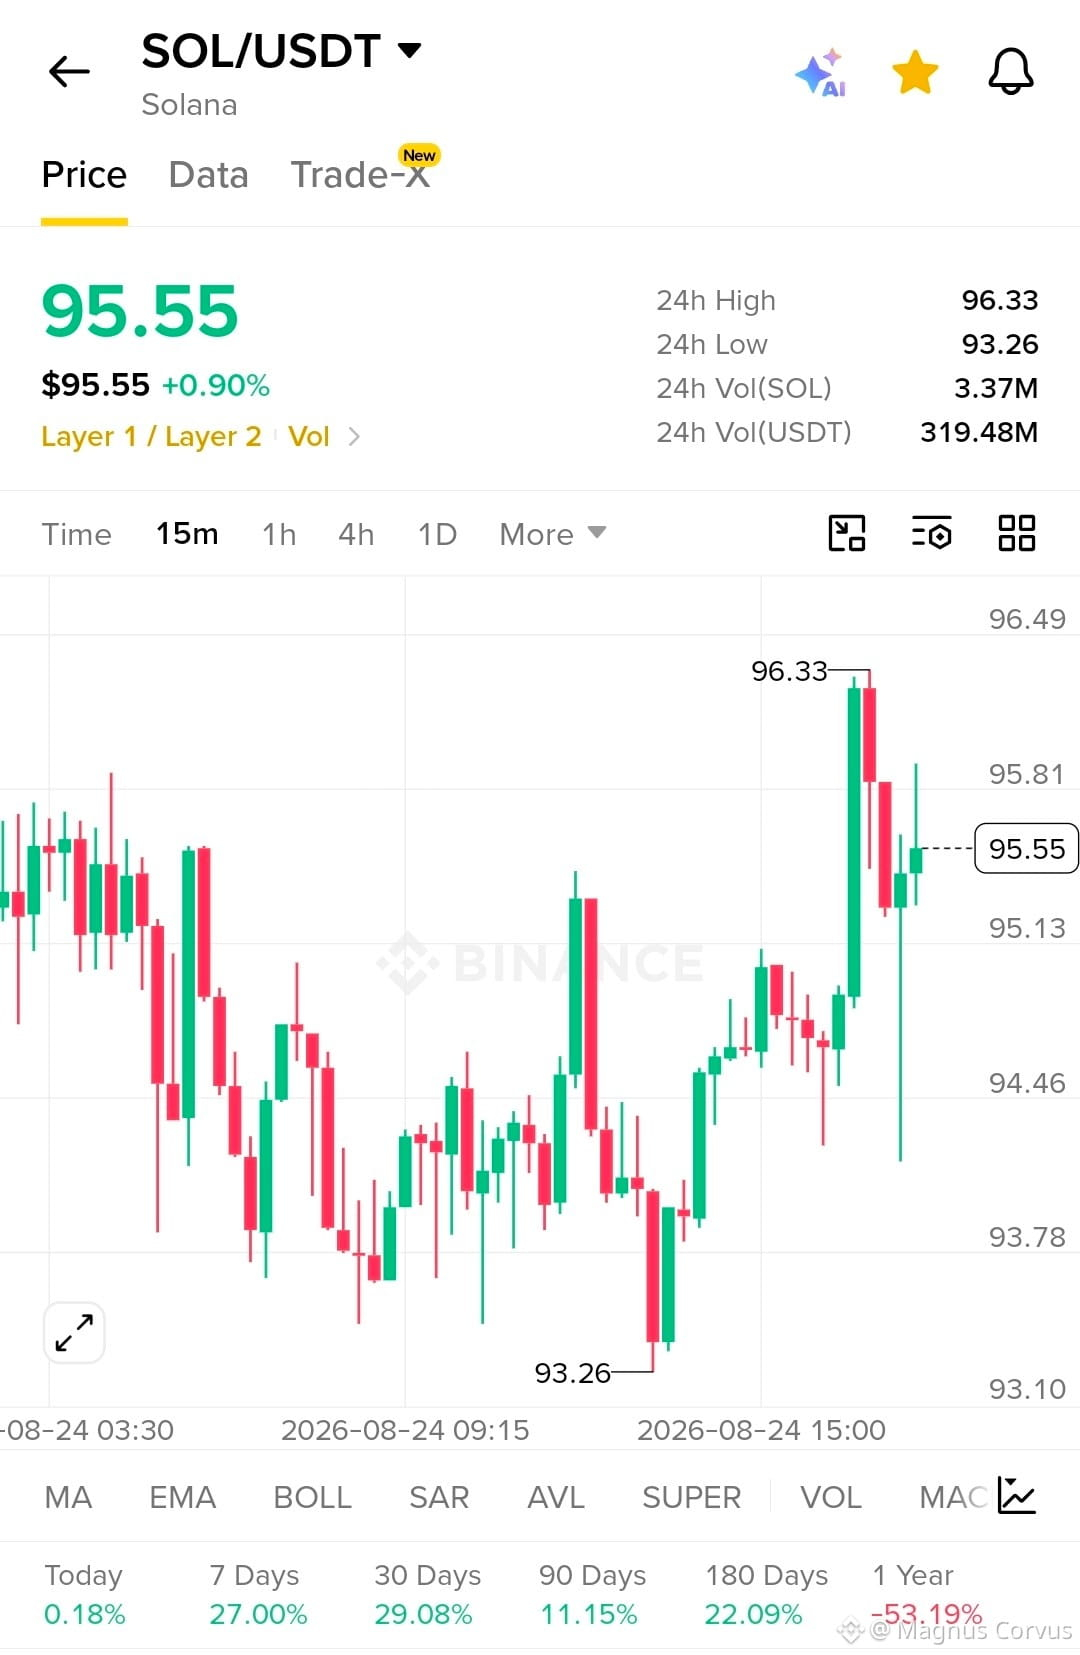
$SOL is showing resilient bullish momentum with buyers defending key support.
Bullish structure remains intact while buyers stay in control.

Entry Zone: 80.90 – 81.15
Stop Loss: 80.30

Target 1: 81.69
Target 2: 82.20
Target 3: 82.78

Price is reacting well from intraday demand after sweeping nearby liquidity. Holding above support keeps the structure constructive, and sustained buying pressure favors continuation toward higher liquidity levels.

Let’s go and Trade now $SOL
·
--
Bullish
$XRP is showing solid bullish momentum with buyers defending higher levels. Bullish structure remains intact while buyers stay in control. Entry Zone: 1.0980 – 1.1020 Stop Loss: 1.0910 Target 1: 1.1075 Target 2: 1.1125 Target 3: 1.1200 Price is holding above key intraday support after a strong impulse move. Liquidity has been swept near the recent highs, and current consolidation suggests accumulation before the next expansion. As long as structure holds, continuation toward higher liquidity remains favored. Let’s go and Trade now $XRP
$XRP is showing solid bullish momentum with buyers defending higher levels.
Bullish structure remains intact while buyers stay in control.

Entry Zone: 1.0980 – 1.1020
Stop Loss: 1.0910

Target 1: 1.1075
Target 2: 1.1125
Target 3: 1.1200

Price is holding above key intraday support after a strong impulse move. Liquidity has been swept near the recent highs, and current consolidation suggests accumulation before the next expansion. As long as structure holds, continuation toward higher liquidity remains favored.

Let’s go and Trade now $XRP
·
--
Bullish
I pulled up NEWT’s chart and just sat there, pulse thumping in my ears. A clean 7.7% vertical move in a single session — not a slow grind, not a gradual build, but the kind of candle that reaches up and grabs you by the throat. I've been around enough exchange-driven cycles to know exactly what I was looking at. The campaigns right now are aggressive: trading tournaments with leaderboard glory, staking boosts that feel almost desperate to lock up float, the kind of short-term incentives that warp liquidity profiles overnight. I could practically see the flywheel spinning. Bids were absorbing everything, volume punched way above its recent slumber, and I felt that familiar tug — the one that whispers "you're missing it." The FOMO was real, and honestly, I get why traders are piling in. A setup like this, in the right conditions, can print money for the early movers. But my eyes kept drifting to a single number tucked beside that glorious green candle. RSI: 91. I've developed a personal relationship with that oscillator over the years, and when it reads 91, my researcher instinct doesn't just raise an eyebrow — it grabs the back of my chair and pulls me away from the keyboard. I've learned, sometimes painfully, that a reading that extreme means the asset has already inhaled more buying pressure in a compressed window than any organic demand can justify. The campaign's future promise? It's already been priced in, maybe more. What I've seen time and again is a predictable unraveling: early entrants start slicing off profit quietly, mean-reversion sharks circle, and the artificial floor the exchange built simply vanishes once the reward clock hits zero. The bid depth that looked so solid becomes a memory. I'm not dismissing the rally. The volume tells me this isn't vapor. But I can't unsee that 91. For me, chasing this now would feel like volunteering for a physics lesson in gravity. I'd rather keep my capital cool and my hands off the trigger. @NewtonProtocol $NEWT #Newt
I pulled up NEWT’s chart and just sat there, pulse thumping in my ears. A clean 7.7% vertical move in a single session — not a slow grind, not a gradual build, but the kind of candle that reaches up and grabs you by the throat. I've been around enough exchange-driven cycles to know exactly what I was looking at. The campaigns right now are aggressive: trading tournaments with leaderboard glory, staking boosts that feel almost desperate to lock up float, the kind of short-term incentives that warp liquidity profiles overnight. I could practically see the flywheel spinning.

Bids were absorbing everything, volume punched way above its recent slumber, and I felt that familiar tug — the one that whispers "you're missing it." The FOMO was real, and honestly, I get why traders are piling in. A setup like this, in the right conditions, can print money for the early movers. But my eyes kept drifting to a single number tucked beside that glorious green candle. RSI: 91. I've developed a personal relationship with that oscillator over the years, and when it reads 91, my researcher instinct doesn't just raise an eyebrow — it grabs the back of my chair and pulls me away from the keyboard. I've learned, sometimes painfully, that a reading that extreme means the asset has already inhaled more buying pressure in a compressed window than any organic demand can justify.

The campaign's future promise? It's already been priced in, maybe more. What I've seen time and again is a predictable unraveling: early entrants start slicing off profit quietly, mean-reversion sharks circle, and the artificial floor the exchange built simply vanishes once the reward clock hits zero. The bid depth that looked so solid becomes a memory. I'm not dismissing the rally. The volume tells me this isn't vapor. But I can't unsee that 91. For me, chasing this now would feel like volunteering for a physics lesson in gravity. I'd rather keep my capital cool and my hands off the trigger.

@NewtonProtocol
$NEWT
#Newt
Article
I’m Tracking NEWT’s 7.7% Surge — and That RSI at 91 Has My Full AttentionI just watched NEWT print a clean 7.7% rally in a single 24-hour window, and I’ll admit, the chart demanded my focus. Exchange campaign incentives are running hot right now — trading competitions, boosted staking rewards, the kind of short-term mechanisms that can temporarily twist supply-demand dynamics in a token’s favour. I’ve seen this script before. The buying vacuum looks real, volume is ticking higher, and a wave of FOMO is starting to build. But as a researcher who lives in the data, I can’t ignore the number that sits right next to that green candle: the Relative Strength Index has spiked to 91. That reading changes the whole risk calculus for me. When I step back and assess what’s actually driving this move, the campaign mechanics make sense. Exchanges run these events to juice activity, and they often succeed. Traders pile in early to front-run the anticipated inflow, expecting that reward structures will compress sell-side liquidity. I myself would probably be drawn to that setup in a neutral market. The feedback loop is powerful — price rises, more eyes land on the pair, and sidelined capital rushes in, pushing price further. Right now, I can see that loop at work. Volume is beating its recent averages, and the bid side has been aggressive. So the bullish short-term case isn’t built on thin air; it’s built on incentivised attention. But here’s where my researcher instinct kicks in hard. RSI at 91 isn’t a mild warning. In my own analysis, when an asset reaches this territory, it means it has absorbed more buying pressure in a compressed timeframe than it historically can sustain. I interpret this as a sign that the market has already priced in a lot of the campaign’s future demand, leaving it technically exhausted. What I’ve seen repeatedly at these extremes is a familiar cycle: early participants begin taking chips off the table, short-sellers start circling for a mean reversion trade, and the price either corrects fast or grinds sideways until the oscillator cools down. The campaign that is currently acting as a tailwind won’t last forever. Once it fades or the rewards window closes, that artificial demand floor can disappear quickly, and an overextended price often finds itself without a net. So while I’m not shouting that a crash is guaranteed, I am saying that from a probability standpoint, chasing now means I’d be taking on far more downside risk than I’d be comfortable with. So my honest take is this: the 7.7% rally is impressive, and I respect the campaign-driven momentum behind it, but I simply cannot look past the RSI 91 reading. In my experience, these extremes are where disciplined traders step aside and watch, rather than chase. I’m monitoring volume closely — if it starts tapering off, the correction thesis gathers steam. I would set tight stop-losses below the nearest support if I were already in the trade, and I certainly wouldn’t deploy new capital until the RSI gives back some heat. Right now, patience isn’t just a virtue; it’s a survival tool. @NewtonProtocol $NEWT #Newt

I’m Tracking NEWT’s 7.7% Surge — and That RSI at 91 Has My Full Attention

I just watched NEWT print a clean 7.7% rally in a single 24-hour window, and I’ll admit, the chart demanded my focus. Exchange campaign incentives are running hot right now — trading competitions, boosted staking rewards, the kind of short-term mechanisms that can temporarily twist supply-demand dynamics in a token’s favour. I’ve seen this script before. The buying vacuum looks real, volume is ticking higher, and a wave of FOMO is starting to build. But as a researcher who lives in the data, I can’t ignore the number that sits right next to that green candle: the Relative Strength Index has spiked to 91. That reading changes the whole risk calculus for me.
When I step back and assess what’s actually driving this move, the campaign mechanics make sense. Exchanges run these events to juice activity, and they often succeed. Traders pile in early to front-run the anticipated inflow, expecting that reward structures will compress sell-side liquidity. I myself would probably be drawn to that setup in a neutral market. The feedback loop is powerful — price rises, more eyes land on the pair, and sidelined capital rushes in, pushing price further. Right now, I can see that loop at work. Volume is beating its recent averages, and the bid side has been aggressive. So the bullish short-term case isn’t built on thin air; it’s built on incentivised attention.
But here’s where my researcher instinct kicks in hard. RSI at 91 isn’t a mild warning. In my own analysis, when an asset reaches this territory, it means it has absorbed more buying pressure in a compressed timeframe than it historically can sustain. I interpret this as a sign that the market has already priced in a lot of the campaign’s future demand, leaving it technically exhausted. What I’ve seen repeatedly at these extremes is a familiar cycle: early participants begin taking chips off the table, short-sellers start circling for a mean reversion trade, and the price either corrects fast or grinds sideways until the oscillator cools down. The campaign that is currently acting as a tailwind won’t last forever. Once it fades or the rewards window closes, that artificial demand floor can disappear quickly, and an overextended price often finds itself without a net. So while I’m not shouting that a crash is guaranteed, I am saying that from a probability standpoint, chasing now means I’d be taking on far more downside risk than I’d be comfortable with.
So my honest take is this: the 7.7% rally is impressive, and I respect the campaign-driven momentum behind it, but I simply cannot look past the RSI 91 reading. In my experience, these extremes are where disciplined traders step aside and watch, rather than chase. I’m monitoring volume closely — if it starts tapering off, the correction thesis gathers steam. I would set tight stop-losses below the nearest support if I were already in the trade, and I certainly wouldn’t deploy new capital until the RSI gives back some heat. Right now, patience isn’t just a virtue; it’s a survival tool.
@NewtonProtocol
$NEWT
#Newt
Log in to explore more content
Join global crypto users on Binance Square
⚡️ Get latest and useful information about crypto.
💬 Trusted by the world’s largest crypto exchange.
👍 Discover real insights from verified creators.
Email / Phone number
Sitemap
Cookie Preferences
Platform T&Cs