
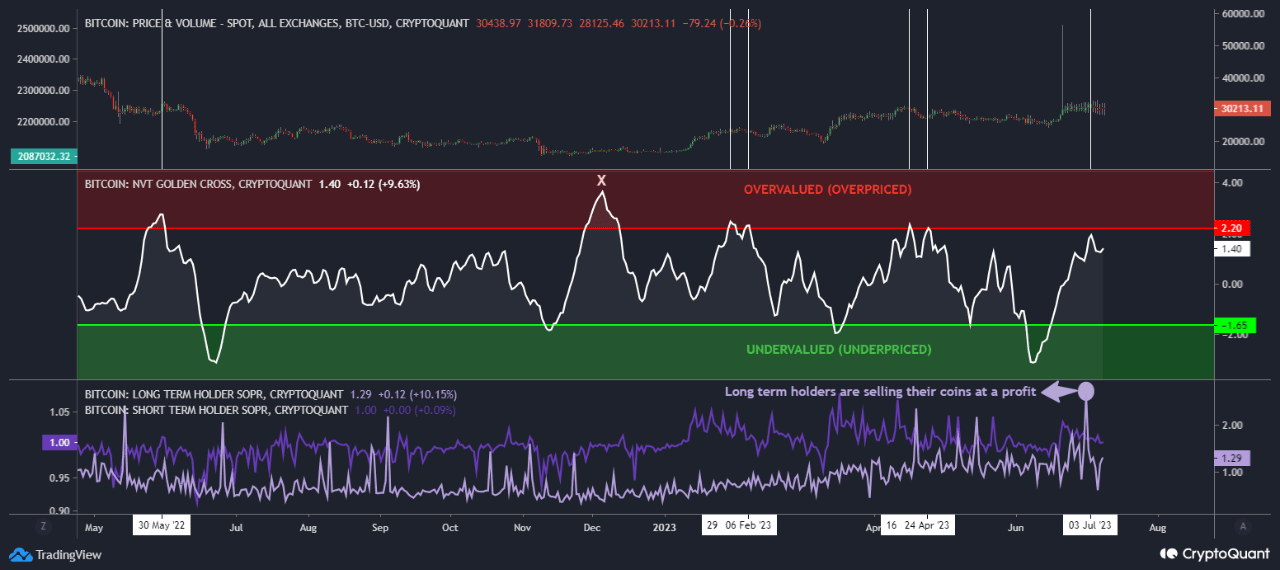
The Network Value to Transactions (NVT) metric tells that when the value of the metric is high, it means Bitcoin is overvalued (red zone) as transaction volumes are low compared to the market cap. On the other hand, low values imply that Bitcoin may be undervalued (green zone). The NVT Golden Cross is an indicator that shows the comparative trend difference between long-term and short-term. As we can see in the graph, whenever this metric has a value of more than 2.2, it means Bitcoin might be overvalued (overpriced). The overvalued area can act as resistance and it usually has a bearish effect when it is touched or crossed. The undervalued (underpriced) condition occurs when the NVT Golden Cross has values less than -1.6. In the image, we can observe also the chart of the long term holders and short term holders that tells us whether holders are selling or not currently. We can conclude that the long term holders have been participating to selling recently. The NVT Golden Cross indicator is now close to the overvalued region, which suggests Bitcoin may soon be seeing some bearish volatility and that the price is heating up compared to the transaction volume. Bitcoin’s NVT Golden Ratio is a Bollinger-band-like signaling indicator that predicts the appearances of local tops and of local bottoms.
Written by SimonaD