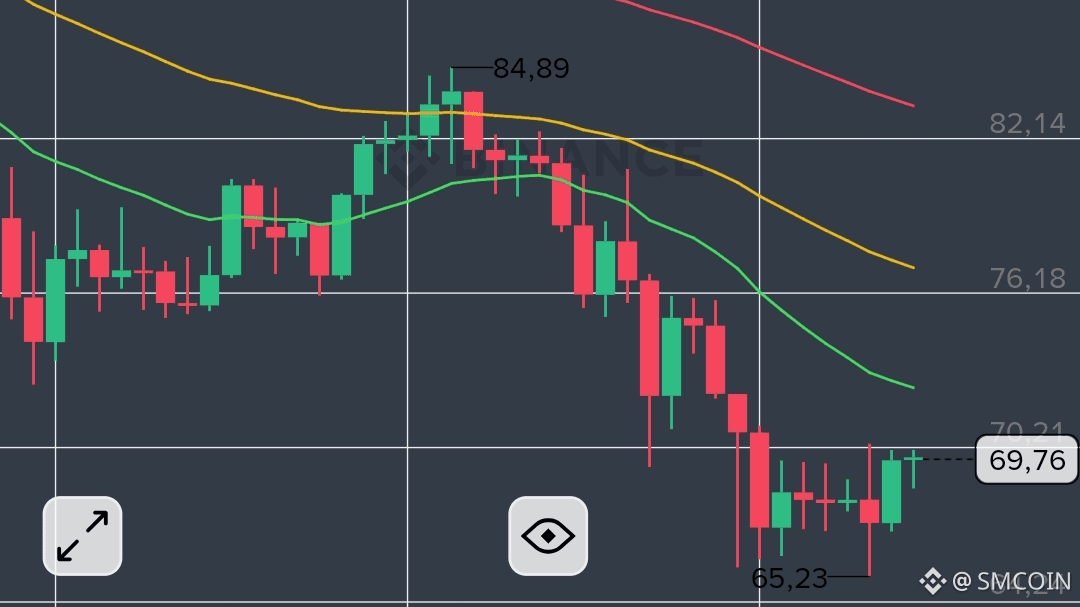
Current price: 69.79 USDT (+1.04% today)
In the last 24 hours, LTC showed a minimum of 68.64 and a maximum of 70.12, with a trading volume of 21.59 million USDT.
📊 What do the indicators say❓
EMA(21) below EMA(50) and EMA(99) on the daily chart ➖ signal of a downtrend in the medium term.
RSI(6) around 46–68 ➖ no overbought condition, there is room for growth.
Volumes are decreasing ➖ consolidation possible before a new movement.
📉 Dynamics over periods:
In 7 days: -2.17%
In 30 days: -11.37%
In a year: -42.71%
LTC is clearly in correction, but the current levels could become a turning point.
💡 My view:
LTC is currently testing the key zone of 69–70 USDT. A breakout upwards with increasing volumes will open the way to 73–76 USDT. If support does not hold, the next level ➖ 65 USDT.
🔔 Attention to:
Increase in volumes in the 69–70 USDT zone.
Divergences on RSI and MACD.
Your thoughts❓ Like if you are waiting for growth❗ Comment on your goals and stop levels 👇
