
Rozanne
238 Posts

Rozanne
crypto analyst /writer , works in advertising agency
Open Trade

XLM Holder
Frequent Trader
2.8 Years
9 Following
1.0K+ Followers
805 Liked
Posts
Portfolio
All
Quotes
Stellar ($XLM) has lost its speculative hype, and a reality check indicates a steady decline toward the 0.12 USDT level. This bearish trend is expected to persist over the next six months.
📉 Technical Breakdown
Broken Support: Price action has broken below key levels, confirming a structural markdown phase.
The 0.12 Target: The 0.12 USDT mark serves as the next major multi-month liquidity baseline.
Moving Averages: Trading below long-term moving averages reinforces the dominant downward momentum.
🔍 Driving Factors
Fading Volatility: Lower trading volumes indicate retail investors are exiting the asset.#XLMUSDT
Market Sentiment: Capital is rotating away from mid-cap utility tokens into dominant macro assets.
#XLM #DollarHits3MonthLow #DOJProbesA16zOverRivalAIBoardSeats #XRPPredictions
📉 Technical Breakdown
Broken Support: Price action has broken below key levels, confirming a structural markdown phase.
The 0.12 Target: The 0.12 USDT mark serves as the next major multi-month liquidity baseline.
Moving Averages: Trading below long-term moving averages reinforces the dominant downward momentum.
🔍 Driving Factors
Fading Volatility: Lower trading volumes indicate retail investors are exiting the asset.#XLMUSDT
Market Sentiment: Capital is rotating away from mid-cap utility tokens into dominant macro assets.
#XLM #DollarHits3MonthLow #DOJProbesA16zOverRivalAIBoardSeats #XRPPredictions


FROM DTCC HYPE TO TOTAL PAIN: THE #XLM LIQUIDITY TRAP! 📉🛑
If you FOMO’ed into $XLM after the massive Depository Trust & Clearing Corporation DTCC real-world asset tokenization headline, you are likely trapped in deep, painful red right now.
Stellar has officially crowned itself as one of the most consistent losing coins of June, wiping out late buyers. Let’s look at the cold, brutal reality of this dump before you catch a falling knife. 👇
📉 Why the DTCC Hype Turned Into a Nightmare
* The Ultimate "Sell the News" Trap: Large whales used the massive institutional product XLM to secure liquidity, aggressively dumping on retail traders who bought the top near $0.26–$0.29.
* Institutional Timeline Delay: While the media hyped immediate action, the actual institutional connectivity won't even launch until the first half of 2027. Short-term speculative buyers quickly realized they were holding empty bags.
* Broken Technical Market Structure: XLM has shed over 27% of its value in a relentless June bleed, losing major psychological support lines daily.
🐻 Next Target: The Plunge Back to 0.16 USDT
The bleeding is far from over. Short-term bounces are getting aggressively sold off by trapped market participants looking for a way out.
* Current Trend: Strong bearish continuation on high volume.
* Next Major Floor: 0.16 USDT.
The daily charts point straight down to the strong historical consolidation base near 0.16 USDT. Buying anywhere above this zone is an unnecessary gamble.
🚫 Current Verdict: DO NOT INVEST YET! ✋
Patience is your absolute greatest weapon in a crashing market.
* Smart Money Strategy: Sit firmly in cash or stablecoins.
*
* Ultimate Entry Zone: Do not touch this asset until it flushes out final retail sellers and searches for an accumulation bottom around 0.16 USDT.
Let the panic-sellers finish their job. Protect your hard-earned capital
💬 What is your move? Are you a trapped holder in pain, or are you waiting patiently for 0.16 USDT to strike? Drop your thoughts below! 👇
#XLMUSDT #BearishAlert #DTCC #xrp
If you FOMO’ed into $XLM after the massive Depository Trust & Clearing Corporation DTCC real-world asset tokenization headline, you are likely trapped in deep, painful red right now.
Stellar has officially crowned itself as one of the most consistent losing coins of June, wiping out late buyers. Let’s look at the cold, brutal reality of this dump before you catch a falling knife. 👇
📉 Why the DTCC Hype Turned Into a Nightmare
* The Ultimate "Sell the News" Trap: Large whales used the massive institutional product XLM to secure liquidity, aggressively dumping on retail traders who bought the top near $0.26–$0.29.
* Institutional Timeline Delay: While the media hyped immediate action, the actual institutional connectivity won't even launch until the first half of 2027. Short-term speculative buyers quickly realized they were holding empty bags.
* Broken Technical Market Structure: XLM has shed over 27% of its value in a relentless June bleed, losing major psychological support lines daily.
🐻 Next Target: The Plunge Back to 0.16 USDT
The bleeding is far from over. Short-term bounces are getting aggressively sold off by trapped market participants looking for a way out.
* Current Trend: Strong bearish continuation on high volume.
* Next Major Floor: 0.16 USDT.
The daily charts point straight down to the strong historical consolidation base near 0.16 USDT. Buying anywhere above this zone is an unnecessary gamble.
🚫 Current Verdict: DO NOT INVEST YET! ✋
Patience is your absolute greatest weapon in a crashing market.
* Smart Money Strategy: Sit firmly in cash or stablecoins.
*
* Ultimate Entry Zone: Do not touch this asset until it flushes out final retail sellers and searches for an accumulation bottom around 0.16 USDT.
Let the panic-sellers finish their job. Protect your hard-earned capital
💬 What is your move? Are you a trapped holder in pain, or are you waiting patiently for 0.16 USDT to strike? Drop your thoughts below! 👇
#XLMUSDT #BearishAlert #DTCC #xrp
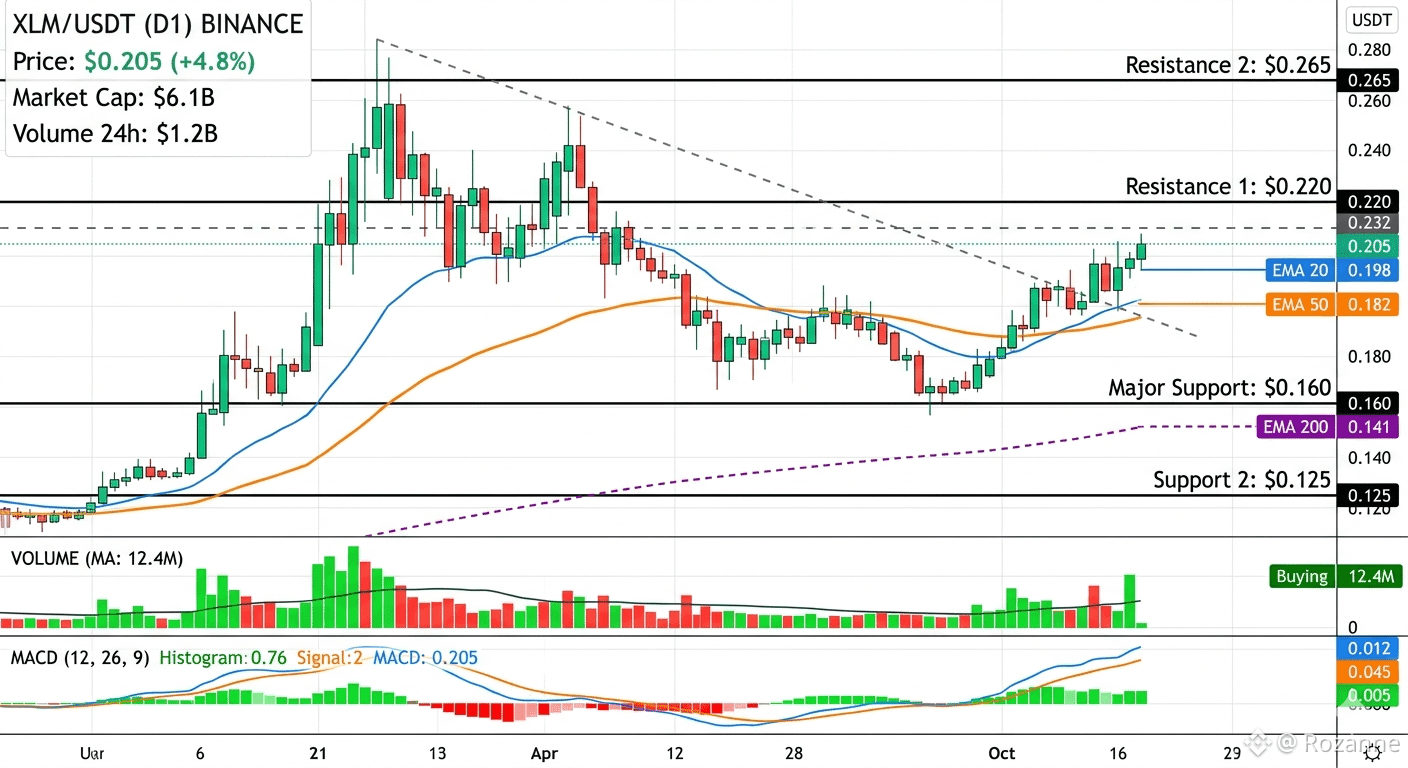
🚀 Is XLM Just "Stuck"—Or Is It Loading a Monster Move? 🚀
Stellar ($XLM) has been trapped in a tight cage all week, leaving traders asking: What is next?
Let’s cut through the noise and look at the raw mechanics,
🔍 Why the Hold Up?
After a massive 72% rally fueled by the groundbreaking DTCC integration news, XLM has hit a structural pause. Why?
The Gap: The market digested the hype. The actual tech rollout is a long-term play, leaving a temporary catalyst vacuum.
The Wall: Heavy overhead resistance sits right above us. Old holders are taking profit, creating a temporary ceiling.
The Macro: With Bitcoin compressing and market sentiment holding in fear, capital is playing defense.
📈 The Breakout Blueprint
Consolidation is not death; it is energy accumulation. XLM is coiling like a spring, and the next move will be violent. Here are the two levels that matter right now:
The Bull Case 🚀: A clean, high-volume daily close above $0.22 clears the runway. If buyers step in here, expect a rapid sprint to retest $0.25, opening the door to $0.30.
The Bear Case ⚠️: If the broader market slips, look for a healthy retest of the critical $0.185 support floor. Holding this level keeps the macro bullish structure perfectly intact,
💡 The Verdict
Smart money doesn't buy the peak; they trade the compression. XLM is giving traders a clear line in the sand. Watch the volume at the borders of this range.
👇 What’s your play? Are you accumulating spot here, or waiting for a clean breakout confirmation? Drop your targets below!
#XLM #Stellar #CryptoTrading #TechnicalAnalysis #BinanceSquare
Stellar ($XLM) has been trapped in a tight cage all week, leaving traders asking: What is next?
Let’s cut through the noise and look at the raw mechanics,
🔍 Why the Hold Up?
After a massive 72% rally fueled by the groundbreaking DTCC integration news, XLM has hit a structural pause. Why?
The Gap: The market digested the hype. The actual tech rollout is a long-term play, leaving a temporary catalyst vacuum.
The Wall: Heavy overhead resistance sits right above us. Old holders are taking profit, creating a temporary ceiling.
The Macro: With Bitcoin compressing and market sentiment holding in fear, capital is playing defense.
📈 The Breakout Blueprint
Consolidation is not death; it is energy accumulation. XLM is coiling like a spring, and the next move will be violent. Here are the two levels that matter right now:
The Bull Case 🚀: A clean, high-volume daily close above $0.22 clears the runway. If buyers step in here, expect a rapid sprint to retest $0.25, opening the door to $0.30.
The Bear Case ⚠️: If the broader market slips, look for a healthy retest of the critical $0.185 support floor. Holding this level keeps the macro bullish structure perfectly intact,
💡 The Verdict
Smart money doesn't buy the peak; they trade the compression. XLM is giving traders a clear line in the sand. Watch the volume at the borders of this range.
👇 What’s your play? Are you accumulating spot here, or waiting for a clean breakout confirmation? Drop your targets below!
#XLM #Stellar #CryptoTrading #TechnicalAnalysis #BinanceSquare
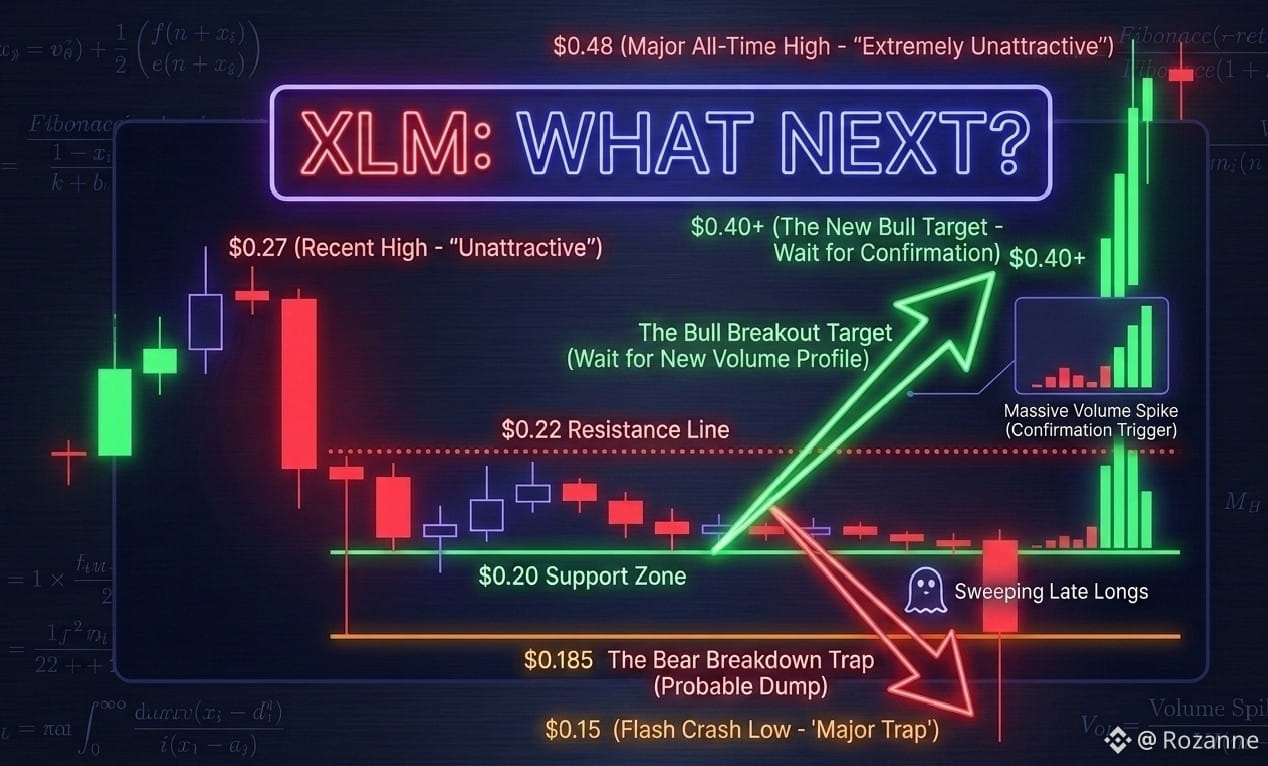
📌 MARKET ALARMING AS BITCOIN ON MOVE TOWARDS $58K ON WEEKEND? 📉
Bitcoin is under intense pressure. Currently trading around $61,000–$62,000, the market is bracing for a potential drop to $58,000 this weekend.
🔥 Why Bitcoin Is Dropping
ETF Outflows: Institutional investors pulled $4B+ over a record 13-day selling streak.
Global Tensions: Rising Middle East conflicts are forcing a macro "risk-off" shift.
Technical Break: BTC failed to hold $65K. If $60K cracks, a fast slide to $58K is next.
🔮 The Weekend Playbook
🟢 The Bounce ($58,000 Holds)
What: Hits the critical 200-weekly moving average and rebounds.
Target: Triggers a relief rally back up toward $70,000.
🔴 The Crash ($58,000 Fails)
What: High selling volume breaks the psychological floor.
Target: Opens the door for a deeper drop toward $55,000.
#btc #XLM #hbar #PENDLE #ARB
Bitcoin is under intense pressure. Currently trading around $61,000–$62,000, the market is bracing for a potential drop to $58,000 this weekend.
🔥 Why Bitcoin Is Dropping
ETF Outflows: Institutional investors pulled $4B+ over a record 13-day selling streak.
Global Tensions: Rising Middle East conflicts are forcing a macro "risk-off" shift.
Technical Break: BTC failed to hold $65K. If $60K cracks, a fast slide to $58K is next.
🔮 The Weekend Playbook
🟢 The Bounce ($58,000 Holds)
What: Hits the critical 200-weekly moving average and rebounds.
Target: Triggers a relief rally back up toward $70,000.
🔴 The Crash ($58,000 Fails)
What: High selling volume breaks the psychological floor.
Target: Opens the door for a deeper drop toward $55,000.
#btc #XLM #hbar #PENDLE #ARB

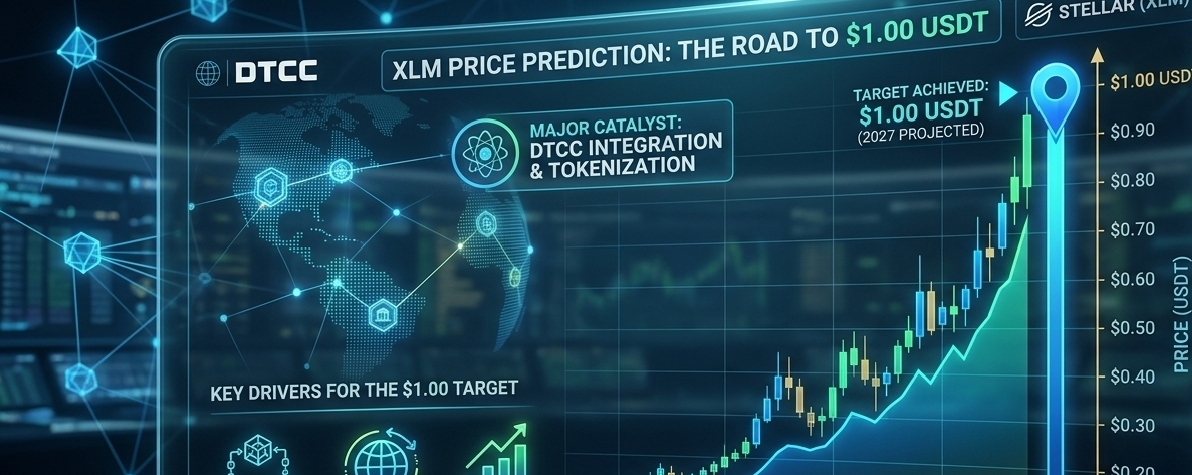
⚡💯 PENDLE Price Structure & Technical Risk Analysis ⚡👈
📉 PENDLE is currently trading in a highly volatile market environment, facing strong short-term bearish pressure while still maintaining solid long-term DeFi potential. The asset continues to trade below major moving averages, signaling cautious market sentiment and increased downside risk in the near term.
🛡️🫢 Key support remains positioned around $1.38 – $1.40, acting as a critical defensive zone for buyers. Meanwhile, heavy resistance between $1.59 – $1.83 continues to limit bullish momentum and broader recovery attempts.
📊📢 Despite ongoing volatility and an “Extreme Fear” market sentiment, Pendle’s ecosystem fundamentals remain active and resilient. Growing DeFi integrations, rising liquidity activity, and expanding yield opportunities continue to strengthen long-term investor interest.
🚀 ✅If market conditions stabilize and buying momentum increases, PENDLE could attempt a recovery toward higher resistance zones. However, continued weakness across the crypto sector may keep price action under pressure in the short term.
🔍 ✌️Traders are closely monitoring:
👉 • RSI & momentum indicators
👉• Moving average crossovers
👉• Volume spikes & whale activity
👉• Broader Bitcoin market direction
💡 Overall Outlook:
Short-term trend remains cautious ⚠️,
but long-term ecosystem growth keeps PENDLE on the radar as a high-potential DeFi asset.
📉 PENDLE is currently trading in a highly volatile market environment, facing strong short-term bearish pressure while still maintaining solid long-term DeFi potential. The asset continues to trade below major moving averages, signaling cautious market sentiment and increased downside risk in the near term.
🛡️🫢 Key support remains positioned around $1.38 – $1.40, acting as a critical defensive zone for buyers. Meanwhile, heavy resistance between $1.59 – $1.83 continues to limit bullish momentum and broader recovery attempts.
📊📢 Despite ongoing volatility and an “Extreme Fear” market sentiment, Pendle’s ecosystem fundamentals remain active and resilient. Growing DeFi integrations, rising liquidity activity, and expanding yield opportunities continue to strengthen long-term investor interest.
🚀 ✅If market conditions stabilize and buying momentum increases, PENDLE could attempt a recovery toward higher resistance zones. However, continued weakness across the crypto sector may keep price action under pressure in the short term.
🔍 ✌️Traders are closely monitoring:
👉 • RSI & momentum indicators
👉• Moving average crossovers
👉• Volume spikes & whale activity
👉• Broader Bitcoin market direction
💡 Overall Outlook:
Short-term trend remains cautious ⚠️,
but long-term ecosystem growth keeps PENDLE on the radar as a high-potential DeFi asset.

$SEI Strategic Outlook: The "Only Short" Bias
For traders, the "reality" you mentioned is clear: SEI is currently a "sell-the-rip" asset.
The Bearish Case: With a negative funding rate of -0.0323%, the entire market is betting against SEI.
The Danger: The only risk to a short position is a "short squeeze"—a temporary, violent price spike caused by the "Giga Upgrade" hype that forces shorts to close. However, these spikes are historically met with immediate selling from the aforementioned locked investors.
Summary: The hype has faded, and the math has taken over. Between the massive April unlock and the total loss of investor confidence, SEI is fighting for its life at the $0.05 mark. Without a miracle reversal in capital retention, the "addition of a zero" seems less like a possibility and more like an inevitability.#USJoblessClaimsNearTwo-YearLow #SEİ #Sei #SolanaUSTD #BinanceExplorers
For traders, the "reality" you mentioned is clear: SEI is currently a "sell-the-rip" asset.
The Bearish Case: With a negative funding rate of -0.0323%, the entire market is betting against SEI.
The Danger: The only risk to a short position is a "short squeeze"—a temporary, violent price spike caused by the "Giga Upgrade" hype that forces shorts to close. However, these spikes are historically met with immediate selling from the aforementioned locked investors.
Summary: The hype has faded, and the math has taken over. Between the massive April unlock and the total loss of investor confidence, SEI is fighting for its life at the $0.05 mark. Without a miracle reversal in capital retention, the "addition of a zero" seems less like a possibility and more like an inevitability.#USJoblessClaimsNearTwo-YearLow #SEİ #Sei #SolanaUSTD #BinanceExplorers
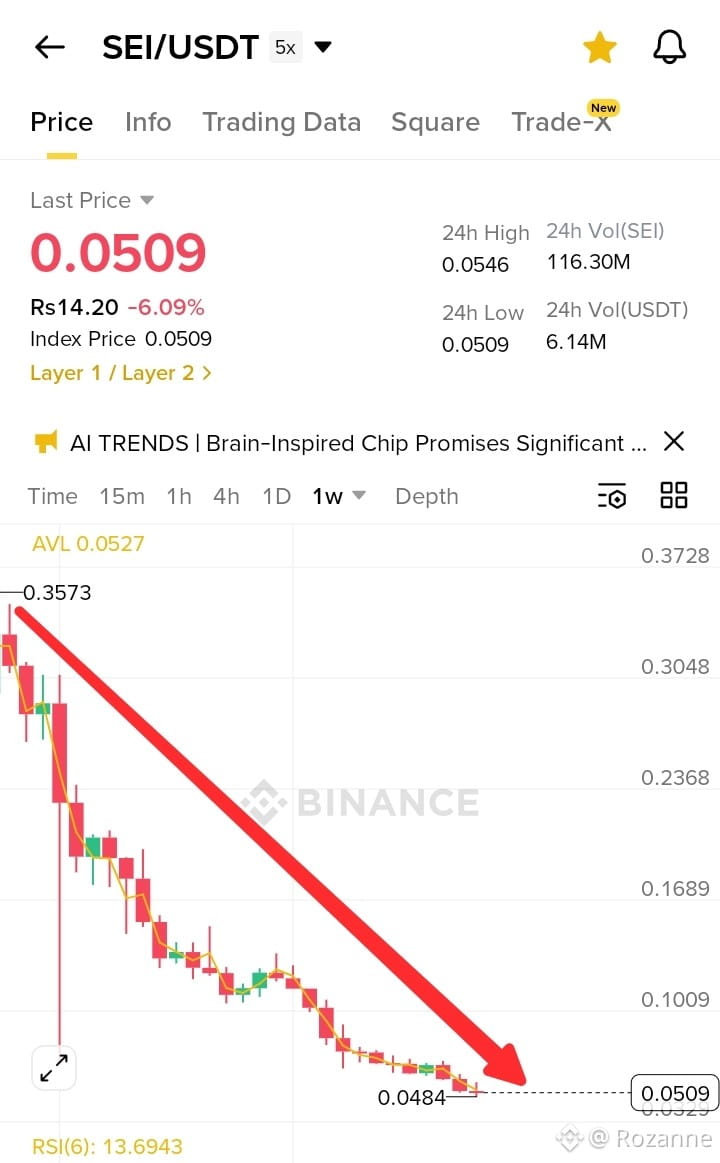
🔥 Sei (SEI) — The Slow Bleed: Fading Quietly, Not Crashing Loudly 📉
Will It Keep Dropping / “Add Zeros”?
SEI is showing a steady, controlled downtrend,
where price is gradually losing value day by day without sharp pumps or major crashes. Over the past year, it has fallen from ~$0.45–$0.48 to around $0.06–$0.12 — an ~85–90% drop, confirming a clear pattern of lower highs and lower lows.
This kind of movement signals a “slow bleed” market — not enough buying strength to push price up, and not enough panic to cause a crash. Instead, it just keeps drifting downward quietly, with small daily moves (around 2–5%) and weak recoveries.
🧠 What Does This Mean?
Logically, this suggests fading demand and weak momentum. The market isn’t reacting — it’s simply losing interest over time. If this behavior continues, SEI could keep declining slowly or move sideways near support before any major shift.
🔻 Will It Keep Dropping / “Add Zeros”?
It’s possible for SEI to continue downward like some weak coins, but a full collapse (e.g., going toward $0.01) would only happen if liquidity, usage, and confidence disappear completely. Right now, it’s weak but still active, so not in a dead phase yet.
📉 Futures Trading Angle
In a trend like this, many traders prefer short positions:
Short near $0.12–$0.14 resistance
Target $0.07–$0.08 support
👉 This kind of market can feel like easy wins because direction is mostly down, but:
A 95% win rate is possible as looking it's chart
So while shorting may have higher probability, it’s never guaranteed.
#SEİ #SEI/USDT #BinanceSquareTalks #ARB #SONIC
Will It Keep Dropping / “Add Zeros”?
SEI is showing a steady, controlled downtrend,
where price is gradually losing value day by day without sharp pumps or major crashes. Over the past year, it has fallen from ~$0.45–$0.48 to around $0.06–$0.12 — an ~85–90% drop, confirming a clear pattern of lower highs and lower lows.
This kind of movement signals a “slow bleed” market — not enough buying strength to push price up, and not enough panic to cause a crash. Instead, it just keeps drifting downward quietly, with small daily moves (around 2–5%) and weak recoveries.
🧠 What Does This Mean?
Logically, this suggests fading demand and weak momentum. The market isn’t reacting — it’s simply losing interest over time. If this behavior continues, SEI could keep declining slowly or move sideways near support before any major shift.
🔻 Will It Keep Dropping / “Add Zeros”?
It’s possible for SEI to continue downward like some weak coins, but a full collapse (e.g., going toward $0.01) would only happen if liquidity, usage, and confidence disappear completely. Right now, it’s weak but still active, so not in a dead phase yet.
📉 Futures Trading Angle
In a trend like this, many traders prefer short positions:
Short near $0.12–$0.14 resistance
Target $0.07–$0.08 support
👉 This kind of market can feel like easy wins because direction is mostly down, but:
A 95% win rate is possible as looking it's chart
So while shorting may have higher probability, it’s never guaranteed.
#SEİ #SEI/USDT #BinanceSquareTalks #ARB #SONIC

“Behind the Headlines: Israel, U.S. Power, and the Voices Shaking the Narrative”
as
Social media provocateur Dan Bilzerian has once again thrown fuel on an already raging fire—this time dragging U.S. foreign policy, Israel, and global power dynamics into a heated online storm.
In a viral post, Bilzerian didn’t just criticize America’s stance on Iran—he questioned the entire motive behind it, claiming the U.S. has no real national interest in the conflict. His remarks quickly spiraled into controversy, especially after he framed the war as being driven by powerful interests rather than genuine security concerns, triggering backlash and accusations of dangerous rhetoric.
But beyond the outrage, his comments have reignited a bigger, more uncomfortable conversation—one that inevitably circles back to leaders like Donald Trump and America’s long-standing relationship with Israel.
Was this relationship strengthened for strategic stability—or shaped by political pressure and alliances? And are today’s conflicts rooted in decisions made during past administrations?
🔥 The Bigger Questions Now Being Asked:
Did Donald Trump redefine U.S.–Israel ties in a way that secured peace—or intensified divisions in the Middle East?
Was recognizing Jerusalem as Israel’s capital a bold diplomatic move—or a trigger for deeper conflict?
Are U.S. military actions in the region truly about national security, or influenced by external political and financial forces?
Did America act as a neutral power—or clearly take sides in a complex geopolitical struggle?
And in the age of viral influence, are voices like Dan Bilzerian exposing hidden truths—or amplifying misinformation that further divides public opinion?#MarchFedMeeting #IranIsraelConflict #BTC #DonaldTrump #TAO
as
Social media provocateur Dan Bilzerian has once again thrown fuel on an already raging fire—this time dragging U.S. foreign policy, Israel, and global power dynamics into a heated online storm.
In a viral post, Bilzerian didn’t just criticize America’s stance on Iran—he questioned the entire motive behind it, claiming the U.S. has no real national interest in the conflict. His remarks quickly spiraled into controversy, especially after he framed the war as being driven by powerful interests rather than genuine security concerns, triggering backlash and accusations of dangerous rhetoric.
But beyond the outrage, his comments have reignited a bigger, more uncomfortable conversation—one that inevitably circles back to leaders like Donald Trump and America’s long-standing relationship with Israel.
Was this relationship strengthened for strategic stability—or shaped by political pressure and alliances? And are today’s conflicts rooted in decisions made during past administrations?
🔥 The Bigger Questions Now Being Asked:
Did Donald Trump redefine U.S.–Israel ties in a way that secured peace—or intensified divisions in the Middle East?
Was recognizing Jerusalem as Israel’s capital a bold diplomatic move—or a trigger for deeper conflict?
Are U.S. military actions in the region truly about national security, or influenced by external political and financial forces?
Did America act as a neutral power—or clearly take sides in a complex geopolitical struggle?
And in the age of viral influence, are voices like Dan Bilzerian exposing hidden truths—or amplifying misinformation that further divides public opinion?#MarchFedMeeting #IranIsraelConflict #BTC #DonaldTrump #TAO
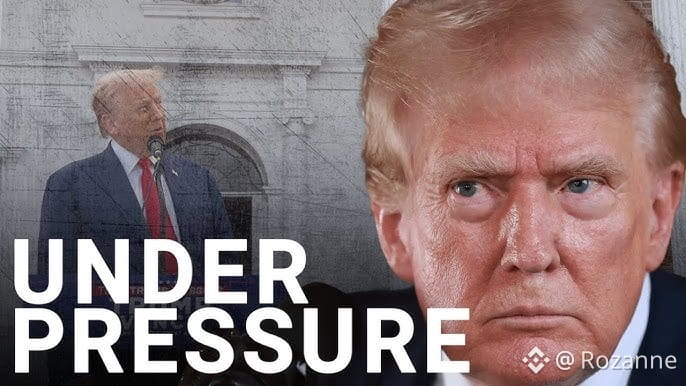
👉The "Middle East Premium": Conflict Escalation and Bitcoin: 👉Digital Gold or Risk Asset?
The escalating Iran-USA conflict has shifted from a background noise to a primary market driver.😂🤣😂
Energy Shockwaves: Direct threats to maritime routes and energy infrastructure have sent oil prices surging. This acts as an "inflation tax," threatening to stall the Fed's cooling efforts.
Safe-Haven Rotation: Investors are moving out of high-beta tech and into Gold, Defense, and Treasuries as a "risk-off" reflex to the geopolitical instability.
Bitcoin: Digital Gold or Risk Asset?🫣
Bitcoin is facing a crisis of identity amidst the tensions. While it often acts as a hedge against fiat debasement, it is currently trading as a high-risk asset.
The Pullback: Recent volatility has BTC testing the $70,000 psychological floor. If the conflict intensifies, a "liquidity flush" could see a temporary drop to $65,000.
The Recovery Path: Analysts project a bounce to $74,600 by the weekend if tensions stabilize, as the market looks past the immediate shock toward its long-term scarcity value.
III. U.S. Markets: S&P 500 Under Pressure
The S&P 500, currently hovering near 6,830, is caught between the AI Capex Boom and the fear of a broader regional war.
7,000 Milestone: A push toward the 7,000 mark is stalled until there is clarity on the U.S. military posture and energy price stability.
Sector Divergence: While Big Tech may see short-term cooling, Aerospace & Defense and Energy stocks are expected to lead the "next journey" as the U.S. ramps up regional support and security.
👉The Verdict
The "Next Journey" is a volatile climb. Expect heavy fluctuations tied to every headline out of Washington and Tehran. The underlying trend for BTC and Stocks remains bullish for 2026, but the immediate path is paved with geopolitical landmines.#USIranWarEscalation #BTC #AIBinance #SolanaUSTD #BinanceSquareFamily
The escalating Iran-USA conflict has shifted from a background noise to a primary market driver.😂🤣😂
Energy Shockwaves: Direct threats to maritime routes and energy infrastructure have sent oil prices surging. This acts as an "inflation tax," threatening to stall the Fed's cooling efforts.
Safe-Haven Rotation: Investors are moving out of high-beta tech and into Gold, Defense, and Treasuries as a "risk-off" reflex to the geopolitical instability.
Bitcoin: Digital Gold or Risk Asset?🫣
Bitcoin is facing a crisis of identity amidst the tensions. While it often acts as a hedge against fiat debasement, it is currently trading as a high-risk asset.
The Pullback: Recent volatility has BTC testing the $70,000 psychological floor. If the conflict intensifies, a "liquidity flush" could see a temporary drop to $65,000.
The Recovery Path: Analysts project a bounce to $74,600 by the weekend if tensions stabilize, as the market looks past the immediate shock toward its long-term scarcity value.
III. U.S. Markets: S&P 500 Under Pressure
The S&P 500, currently hovering near 6,830, is caught between the AI Capex Boom and the fear of a broader regional war.
7,000 Milestone: A push toward the 7,000 mark is stalled until there is clarity on the U.S. military posture and energy price stability.
Sector Divergence: While Big Tech may see short-term cooling, Aerospace & Defense and Energy stocks are expected to lead the "next journey" as the U.S. ramps up regional support and security.
👉The Verdict
The "Next Journey" is a volatile climb. Expect heavy fluctuations tied to every headline out of Washington and Tehran. The underlying trend for BTC and Stocks remains bullish for 2026, but the immediate path is paved with geopolitical landmines.#USIranWarEscalation #BTC #AIBinance #SolanaUSTD #BinanceSquareFamily

🌟 Altcoin Recovery & Spot Trading in 2025
1️⃣ Lessons from the Past
Altcoins historically bounce faster than Bitcoin after downtrends.
High risk, high reward: deeper drops, bigger surges.
Spot traders recover if holding strong, large-cap coins.
2️⃣ The 2025 Reality
Bitcoin dominates — institutional flows slow altcoin rebounds.
Mature market — macro trends, regulations, and ETFs shape prices.
Selective alt strength — mid- and small-caps can rally, but not automatically.
3️⃣ Spot Traders’ Strategy
Recovery possible for solid coins (ETH, SOL, ADA).
Low-cap coins may never fully recover.
Bitcoin’s trend still drives the market.
Patience and selective holdings are key.
4️⃣ Key Takeaways
Altcoin recovery depends on Bitcoin, macro conditions, and coin quality.
Focus on strong projects, not every pump.
Combine historical lessons + 2025 market reality for smart trades.
💡 Bottom Line
Crypto in 2025 is different, but recovery is still possible never sell your asset in loss. Success needs patience, selectivity, and an eye on Bitcoin and macro trends.
when you recover your losses don't wait further don't be greedy
If you want, I can make an even snappier “one-glance” version, almost like a roadmap for altcoin recovery in 2025. Do you want me to do that?#USJobsData #SEİ #QI #Near #SONIC
1️⃣ Lessons from the Past
Altcoins historically bounce faster than Bitcoin after downtrends.
High risk, high reward: deeper drops, bigger surges.
Spot traders recover if holding strong, large-cap coins.
2️⃣ The 2025 Reality
Bitcoin dominates — institutional flows slow altcoin rebounds.
Mature market — macro trends, regulations, and ETFs shape prices.
Selective alt strength — mid- and small-caps can rally, but not automatically.
3️⃣ Spot Traders’ Strategy
Recovery possible for solid coins (ETH, SOL, ADA).
Low-cap coins may never fully recover.
Bitcoin’s trend still drives the market.
Patience and selective holdings are key.
4️⃣ Key Takeaways
Altcoin recovery depends on Bitcoin, macro conditions, and coin quality.
Focus on strong projects, not every pump.
Combine historical lessons + 2025 market reality for smart trades.
💡 Bottom Line
Crypto in 2025 is different, but recovery is still possible never sell your asset in loss. Success needs patience, selectivity, and an eye on Bitcoin and macro trends.
when you recover your losses don't wait further don't be greedy
If you want, I can make an even snappier “one-glance” version, almost like a roadmap for altcoin recovery in 2025. Do you want me to do that?#USJobsData #SEİ #QI #Near #SONIC

Bitcoin (BTC) Price Outlook: Could It Dip Below $100,000 Next?
A short-term drop to $98,000 remains a possible scenario for Bitcoin in the next week or two, but most current analyses for early November 2025 suggest the price is more likely to stay above $100,000 or even move higher.
Possibility of a Dip Below $100K
Support Levels:
According to Forex24.pro (Nov 3–7, 2025), Bitcoin has strong support near $102,505.
A clear break below this level could open the door to $98,000, while falling below $92,205 would invalidate the current bullish trend.
Short-Term Pullback:
Analysts still warn of an “inevitable short-term correction” under $100K before Bitcoin resumes its upward momentum.
Volatility Factor:
Bitcoin’s high volatility often leads to sudden dips, even in an overall bullish market.
Historical Range:
Earlier forecasts (from Sept 2024) placed Bitcoin between $85,000 and $108,000, which keeps $98K within a realistic fluctuation range — though recent data leans more bullish.
Current and Near-Term Outlook (Early November 2025)
Current Price: Around $105,500 , – $107,020 as of Nov 3, 2025.
Bullish Momentum:
Changelly projects a rise above $108,000 by Nov 5.
CoinCodex expects BTC between $111,964–$116,035 this week and $116,035–$120,184 next week. (feel looks awkward till today )
Binance forecasts a 5% monthly increase.
Strong Buying Support: Buyers have repeatedly defended levels above $102,000, showing strong market confidence.
Conclusion
While a brief dip toward $98,000 cannot be ruled out due to volatility or a short correction, most forecasts and indicators for early November point toward price stability or further gains.
Strong buying activity above $102,000 and positive sentiment make it more likely that Bitcoin will stay above $100,000 in the near term rather than fall below it,😘🤔 but a sharp dip may Upto 98k is not far away now#BinanceHODLerMMT #xrp #QI #SONIC #Near
A short-term drop to $98,000 remains a possible scenario for Bitcoin in the next week or two, but most current analyses for early November 2025 suggest the price is more likely to stay above $100,000 or even move higher.
Possibility of a Dip Below $100K
Support Levels:
According to Forex24.pro (Nov 3–7, 2025), Bitcoin has strong support near $102,505.
A clear break below this level could open the door to $98,000, while falling below $92,205 would invalidate the current bullish trend.
Short-Term Pullback:
Analysts still warn of an “inevitable short-term correction” under $100K before Bitcoin resumes its upward momentum.
Volatility Factor:
Bitcoin’s high volatility often leads to sudden dips, even in an overall bullish market.
Historical Range:
Earlier forecasts (from Sept 2024) placed Bitcoin between $85,000 and $108,000, which keeps $98K within a realistic fluctuation range — though recent data leans more bullish.
Current and Near-Term Outlook (Early November 2025)
Current Price: Around $105,500 , – $107,020 as of Nov 3, 2025.
Bullish Momentum:
Changelly projects a rise above $108,000 by Nov 5.
CoinCodex expects BTC between $111,964–$116,035 this week and $116,035–$120,184 next week. (feel looks awkward till today )
Binance forecasts a 5% monthly increase.
Strong Buying Support: Buyers have repeatedly defended levels above $102,000, showing strong market confidence.
Conclusion
While a brief dip toward $98,000 cannot be ruled out due to volatility or a short correction, most forecasts and indicators for early November point toward price stability or further gains.
Strong buying activity above $102,000 and positive sentiment make it more likely that Bitcoin will stay above $100,000 in the near term rather than fall below it,😘🤔 but a sharp dip may Upto 98k is not far away now#BinanceHODLerMMT #xrp #QI #SONIC #Near

one thing is good of sonic always ready to crash hard

amirkhanjee
·
--
💚♦️$S / USDT – Long Setup Alert! 🟢♥️
🟣$S is showing strong bullish momentum after holding its key support level! Traders are watching closely as the price prepares for a potential upside breakout.
💲 Trade Setup (Long)
♦️ Entry Zone: 0.1414
🧡 Targets: 0.1428 | 0.1452 | 0.1475 | 0.1558
🟣 Stop-Loss: 0.1343
💡🌹 Market Insight:
Buyers are gaining control as $s forms a solid base near support. A breakout above 0.1450 could confirm bullish strength, opening the door for further gains toward 0.1558. Traders are advised to follow strict risk management and watch volume closely for confirmation.
📌💛 Trend Outlook: Bullish bias remains as long as price holds above 0.1340.
#S #CryptoTrading #BinanceSquare #AltcoinSignals #CryptoAnalysis #TradingSetup #BullishTrend #Binance #CryptoNews #Altcoins
$S
🟣$S is showing strong bullish momentum after holding its key support level! Traders are watching closely as the price prepares for a potential upside breakout.
💲 Trade Setup (Long)
♦️ Entry Zone: 0.1414
🧡 Targets: 0.1428 | 0.1452 | 0.1475 | 0.1558
🟣 Stop-Loss: 0.1343
💡🌹 Market Insight:
Buyers are gaining control as $s forms a solid base near support. A breakout above 0.1450 could confirm bullish strength, opening the door for further gains toward 0.1558. Traders are advised to follow strict risk management and watch volume closely for confirmation.
📌💛 Trend Outlook: Bullish bias remains as long as price holds above 0.1340.
#S #CryptoTrading #BinanceSquare #AltcoinSignals #CryptoAnalysis #TradingSetup #BullishTrend #Binance #CryptoNews #Altcoins
$S

what a joke,so funnyman

Market-ZONe
·
--
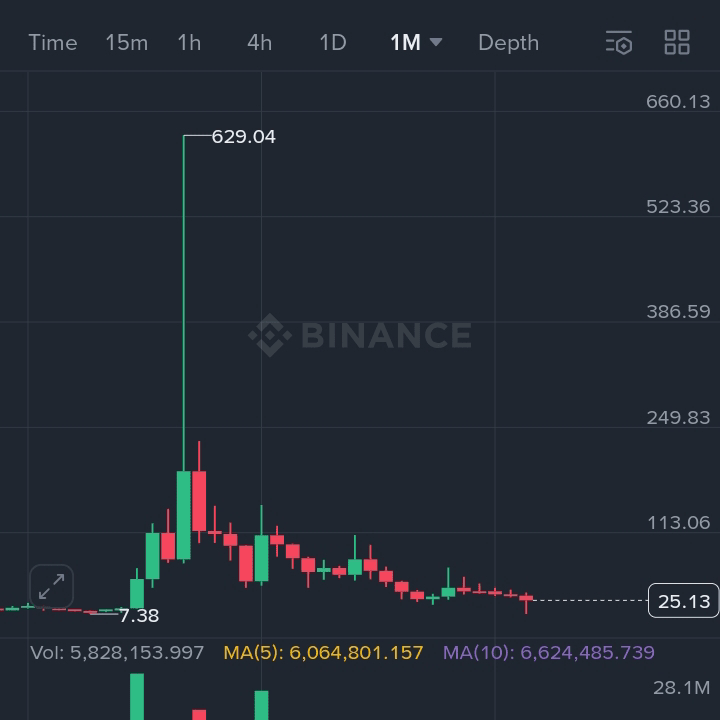
BullishGuys, I’ve had a really rough time 😅💔. I bought $TRB at $56, and then… I lost my phone 📱😭. After a long time, I finally managed to open my account again because I didn’t even remember my password 😅.
The crazy part? $TRB went all the way up to $629 🚀🔥! I never even imagined it could reach that high… and now I check, and it’s down to $25 😭📉. No profit, only huge loss 💔💸. First my heart broke because of losing my phone, and now… this just adds to it 😅💔.
The crazy part? $TRB went all the way up to $629 🚀🔥! I never even imagined it could reach that high… and now I check, and it’s down to $25 😭📉. No profit, only huge loss 💔💸. First my heart broke because of losing my phone, and now… this just adds to it 😅💔.
$S if u want to earn from it,then
short it as it is losing price since one year
#SONIC #SonicUpgrade #SonicLabs #Sonicnetwork #sonic交易竞赛
short it as it is losing price since one year
#SONIC #SonicUpgrade #SonicLabs #Sonicnetwork #sonic交易竞赛
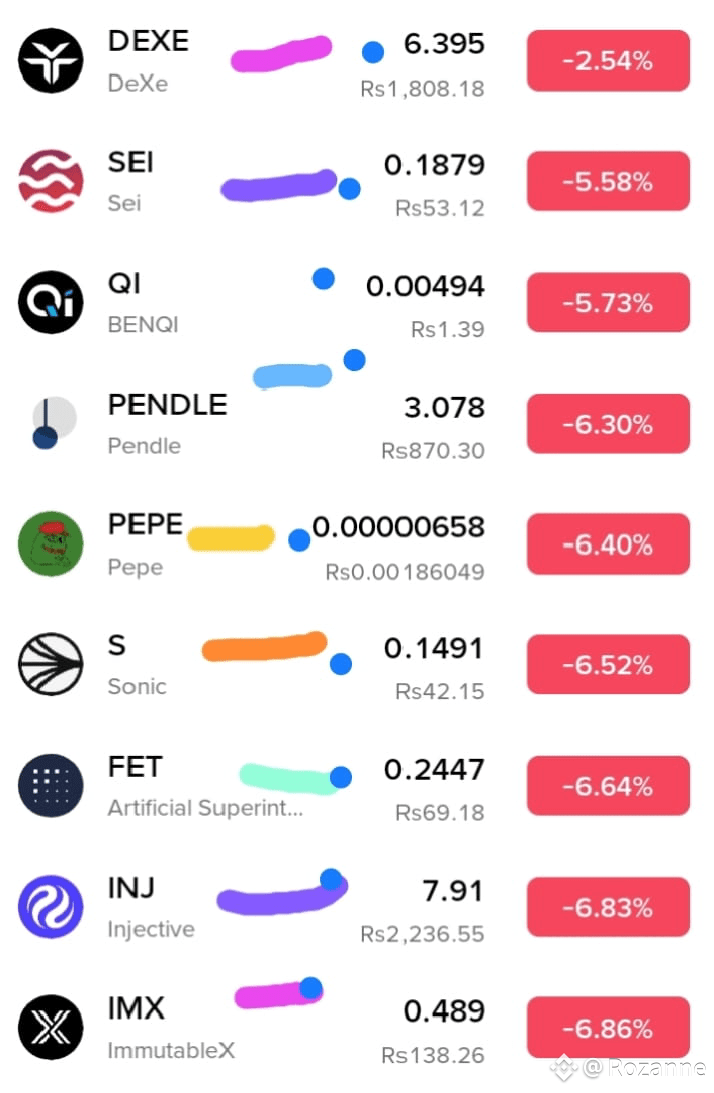
Will These “Hype Coins” Ever Recover? – The Bitter Truth of Modern Crypto
If you’re holding these coins for a skyrocket, it’s time to face reality.
Check their annual charts — prices are consistently falling, not recovering.
Today’s crypto market is full of short-term hype projects that explode on launch, attract communities, then fade into silence once liquidity dries up.
📉 Full Reality Check — All Falling Together
DEXE SEI QI PENDLE PEPE SONIC FET INJ IMX
🔹 Average fall: 55–85% from peak
🔹 Trading Volume: Down 40–70% since early 2024
🔹 RSI (Relative Strength Index): Mostly under 40 → clear bearish pressure
🔹 MACD: Negative crossovers → long-term downtrend confirmed
🔹 Investor Confidence: Weak, as new money moves back to Bitcoin & ETH dominance (now over 55%)
🔹 Utility: Limited — most rely on hype, not adoption
⚠️ Price Example Snapshot
INJ: $42 → $7.9 (-81%)
IMX: $2.5 → $0.48 (-80%)
PENDLE: $7.5 → $3 (-60%)
SEI: $0.45 → $0.18 (-60%)
PEPE: Down 70% since peak, meme value only
---
💬 Harsh Reality:
These coins rise on marketing, not fundamentals.
They’re community-driven pumps that collapse when the crowd exits.
Most never recover previous highs — only 10–15% of altcoins historically regain 50% of peak value.
🚫 Don’t hold dreams — hold logic.
Study charts, not hype. Watch trends, not tweets.
📊 Crypto rewards research — not wishful thinking.
#PENDLE #SEI/USDT #SONIC #QI #pepe
If you’re holding these coins for a skyrocket, it’s time to face reality.
Check their annual charts — prices are consistently falling, not recovering.
Today’s crypto market is full of short-term hype projects that explode on launch, attract communities, then fade into silence once liquidity dries up.
📉 Full Reality Check — All Falling Together
DEXE SEI QI PENDLE PEPE SONIC FET INJ IMX
🔹 Average fall: 55–85% from peak
🔹 Trading Volume: Down 40–70% since early 2024
🔹 RSI (Relative Strength Index): Mostly under 40 → clear bearish pressure
🔹 MACD: Negative crossovers → long-term downtrend confirmed
🔹 Investor Confidence: Weak, as new money moves back to Bitcoin & ETH dominance (now over 55%)
🔹 Utility: Limited — most rely on hype, not adoption
⚠️ Price Example Snapshot
INJ: $42 → $7.9 (-81%)
IMX: $2.5 → $0.48 (-80%)
PENDLE: $7.5 → $3 (-60%)
SEI: $0.45 → $0.18 (-60%)
PEPE: Down 70% since peak, meme value only
---
💬 Harsh Reality:
These coins rise on marketing, not fundamentals.
They’re community-driven pumps that collapse when the crowd exits.
Most never recover previous highs — only 10–15% of altcoins historically regain 50% of peak value.
🚫 Don’t hold dreams — hold logic.
Study charts, not hype. Watch trends, not tweets.
📊 Crypto rewards research — not wishful thinking.
#PENDLE #SEI/USDT #SONIC #QI #pepe
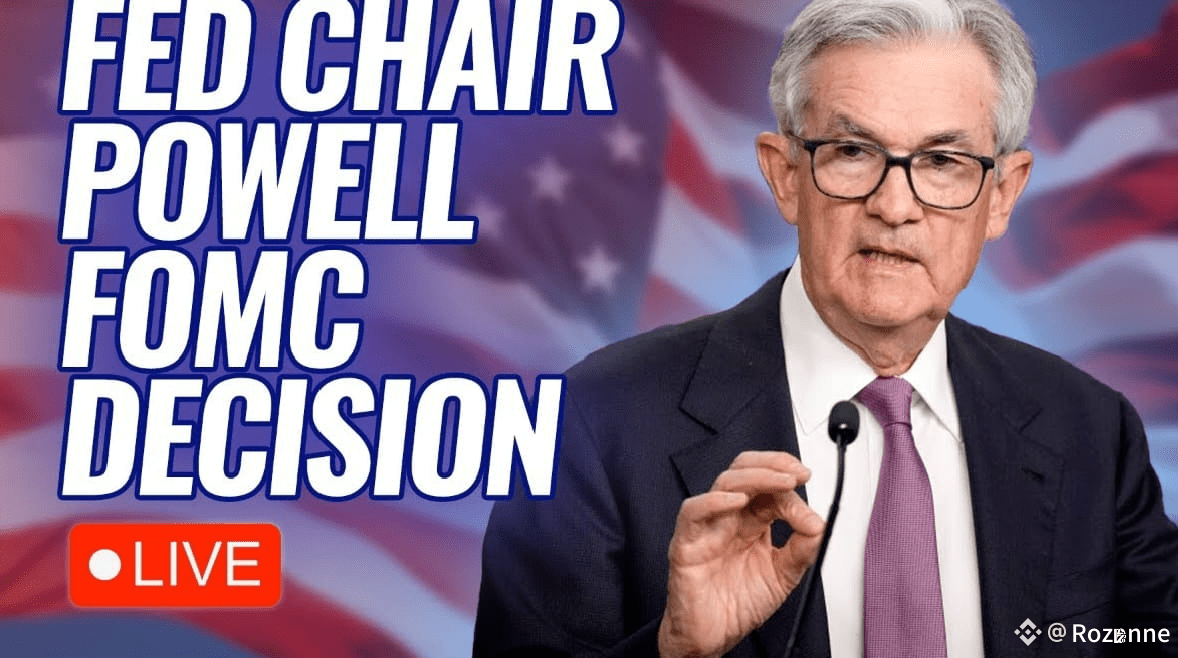
Powell Cautions Against Further Rate Cuts Despite Easing Move as
Federal Reserve Cuts Rates by 25 Basis Points, Ends Quantitative Tightening
The Federal Reserve reduced its benchmark lending rate by 25 basis points to a range of 3.75%–4.00%, marking the second rate cut of 2025. In addition, the Federal Open Market Committee (FOMC) announced it will end its balance sheet reduction (quantitative tightening) effective December 1.
Key Highlights from the FOMC Meeting
Rate Cut:
The Fed implemented a quarter-point rate cut, aligning with market expectations. Governor Stephen Miran dissented, advocating for a more aggressive half-point reduction.
End of Quantitative Tightening:
The central bank will halt its three-year balance sheet reduction program, signaling a shift toward a more accommodative policy stance.
Forward Guidance:
Fed Chair Jerome Powell stated that an additional rate cut in December is “not a foregone conclusion,” emphasizing that future policy moves will depend on economic data.
Economic Outlook:
Powell noted signs of softening in the labor market, but said the overall outlook for employment and inflation remains broadly unchanged since September, despite disruptions caused by the recent government shutdown.
Market Reaction:
U.S. equity markets — including the Dow Jones, S&P 500, and Nasdaq — rallied initially on expectations of easing monetary policy, but reversed gains after Powell’s cautious tone regarding future rate cuts
#Fed #WriteToEarnUpgrade #SONIC #ONDO #dexe
Federal Reserve Cuts Rates by 25 Basis Points, Ends Quantitative Tightening
The Federal Reserve reduced its benchmark lending rate by 25 basis points to a range of 3.75%–4.00%, marking the second rate cut of 2025. In addition, the Federal Open Market Committee (FOMC) announced it will end its balance sheet reduction (quantitative tightening) effective December 1.
Key Highlights from the FOMC Meeting
Rate Cut:
The Fed implemented a quarter-point rate cut, aligning with market expectations. Governor Stephen Miran dissented, advocating for a more aggressive half-point reduction.
End of Quantitative Tightening:
The central bank will halt its three-year balance sheet reduction program, signaling a shift toward a more accommodative policy stance.
Forward Guidance:
Fed Chair Jerome Powell stated that an additional rate cut in December is “not a foregone conclusion,” emphasizing that future policy moves will depend on economic data.
Economic Outlook:
Powell noted signs of softening in the labor market, but said the overall outlook for employment and inflation remains broadly unchanged since September, despite disruptions caused by the recent government shutdown.
Market Reaction:
U.S. equity markets — including the Dow Jones, S&P 500, and Nasdaq — rallied initially on expectations of easing monetary policy, but reversed gains after Powell’s cautious tone regarding future rate cuts
#Fed #WriteToEarnUpgrade #SONIC #ONDO #dexe
FOMC Meeting Update: Fed Expected to Cut Rates Again as Powell Faces Political Pressure
The Federal Open Market Committee (FOMC) began its two-day meeting today. While Chair Jerome Powell will not speak today, the meeting will conclude tomorrow, Wednesday, October 29, with a policy announcement at 2:00 p.m. ET followed by Powell’s press conference at 2:30 p.m. ET.
Expected Decision:
The Fed is widely expected to cut its key interest rate, marking the second rate cut this year. This move follows signs of a weakening labor market, and analysts anticipate the possibility of another rate cut in December.
Additionally, Powell is expected to signal that the central bank may soon end its balance sheet reduction program, a sign of further monetary easing.
---
Comments from Donald Trump
During a dinner with business leaders in Tokyo, President Donald Trump criticized Powell, calling him “incompetent” and reiterating his wish to replace him before his term expires in May 2026.
Reports indicate Trump has considered Treasury Secretary Scott Bessent as a potential replacement, though Bessent has shown no interest in the position.
---
Investment Analysis
Market analysts suggest that the anticipated rate cut could benefit sectors that gain from lower borrowing costs, particularly:
Real Estate Investment Trusts (REITs)
Growth and tech stocks sensitive to financing rates
Despite short-term volatility, the overall outlook is positive for equities, as investors generally interpret falling interest rates as a buying signal for stocks.
---
Summary Insight:
The Fed’s expected policy shift signals continued support for the economy. Markets are watching closely for Powell’s tone — whether he emphasizes confidence or caution — which could influence short-term trading sentiment
#WriteToEarnUpgrade #Fed #solana #PENDLEUSDT #ONDO
The Federal Open Market Committee (FOMC) began its two-day meeting today. While Chair Jerome Powell will not speak today, the meeting will conclude tomorrow, Wednesday, October 29, with a policy announcement at 2:00 p.m. ET followed by Powell’s press conference at 2:30 p.m. ET.
Expected Decision:
The Fed is widely expected to cut its key interest rate, marking the second rate cut this year. This move follows signs of a weakening labor market, and analysts anticipate the possibility of another rate cut in December.
Additionally, Powell is expected to signal that the central bank may soon end its balance sheet reduction program, a sign of further monetary easing.
---
Comments from Donald Trump
During a dinner with business leaders in Tokyo, President Donald Trump criticized Powell, calling him “incompetent” and reiterating his wish to replace him before his term expires in May 2026.
Reports indicate Trump has considered Treasury Secretary Scott Bessent as a potential replacement, though Bessent has shown no interest in the position.
---
Investment Analysis
Market analysts suggest that the anticipated rate cut could benefit sectors that gain from lower borrowing costs, particularly:
Real Estate Investment Trusts (REITs)
Growth and tech stocks sensitive to financing rates
Despite short-term volatility, the overall outlook is positive for equities, as investors generally interpret falling interest rates as a buying signal for stocks.
---
Summary Insight:
The Fed’s expected policy shift signals continued support for the economy. Markets are watching closely for Powell’s tone — whether he emphasizes confidence or caution — which could influence short-term trading sentiment
#WriteToEarnUpgrade #Fed #solana #PENDLEUSDT #ONDO

Log in to explore more content