
#nbis
nbis
74,106 views
1,400 Discussing
Hot
Latest

·
--
Keeping it simple and objective. We have mapped out a highly structured downside setup on $NBIS with tight risk invalidation. Here is the exact plan we are executing.
⚡ $NBIS — SHORT SETUP
📍 Entry: 217.1 – 218.4
🎯 TP1: 214.51
🎯 TP2: 212.78
🎯 TP3: 210.19
🛑 Stop Loss: 219.7
Trade here 👇
📌 Trade management rules: see pinned post.
Where do you see $NBIS heading next? Hit follow for more real-time setups.
#WriteToEarn #NBIS #CryptoTrading #BinanceSquare #Crypto
Keeping it simple and objective. We have mapped out a highly structured downside setup on $NBIS with tight risk invalidation. Here is the exact plan we are executing.
⚡ $NBIS — SHORT SETUP
📍 Entry: 217.1 – 218.4
🎯 TP1: 214.51
🎯 TP2: 212.78
🎯 TP3: 210.19
🛑 Stop Loss: 219.7
Trade here 👇
📌 Trade management rules: see pinned post.
Where do you see $NBIS heading next? Hit follow for more real-time setups.
#WriteToEarn #NBIS #CryptoTrading #BinanceSquare #Crypto
⚡ $NBIS — SHORT SETUP
📍 Entry: 217.1 – 218.4
🎯 TP1: 214.51
🎯 TP2: 212.78
🎯 TP3: 210.19
🛑 Stop Loss: 219.7
Trade here 👇
📌 Trade management rules: see pinned post.
Where do you see $NBIS heading next? Hit follow for more real-time setups.
#WriteToEarn #NBIS #CryptoTrading #BinanceSquare #Crypto
1
15

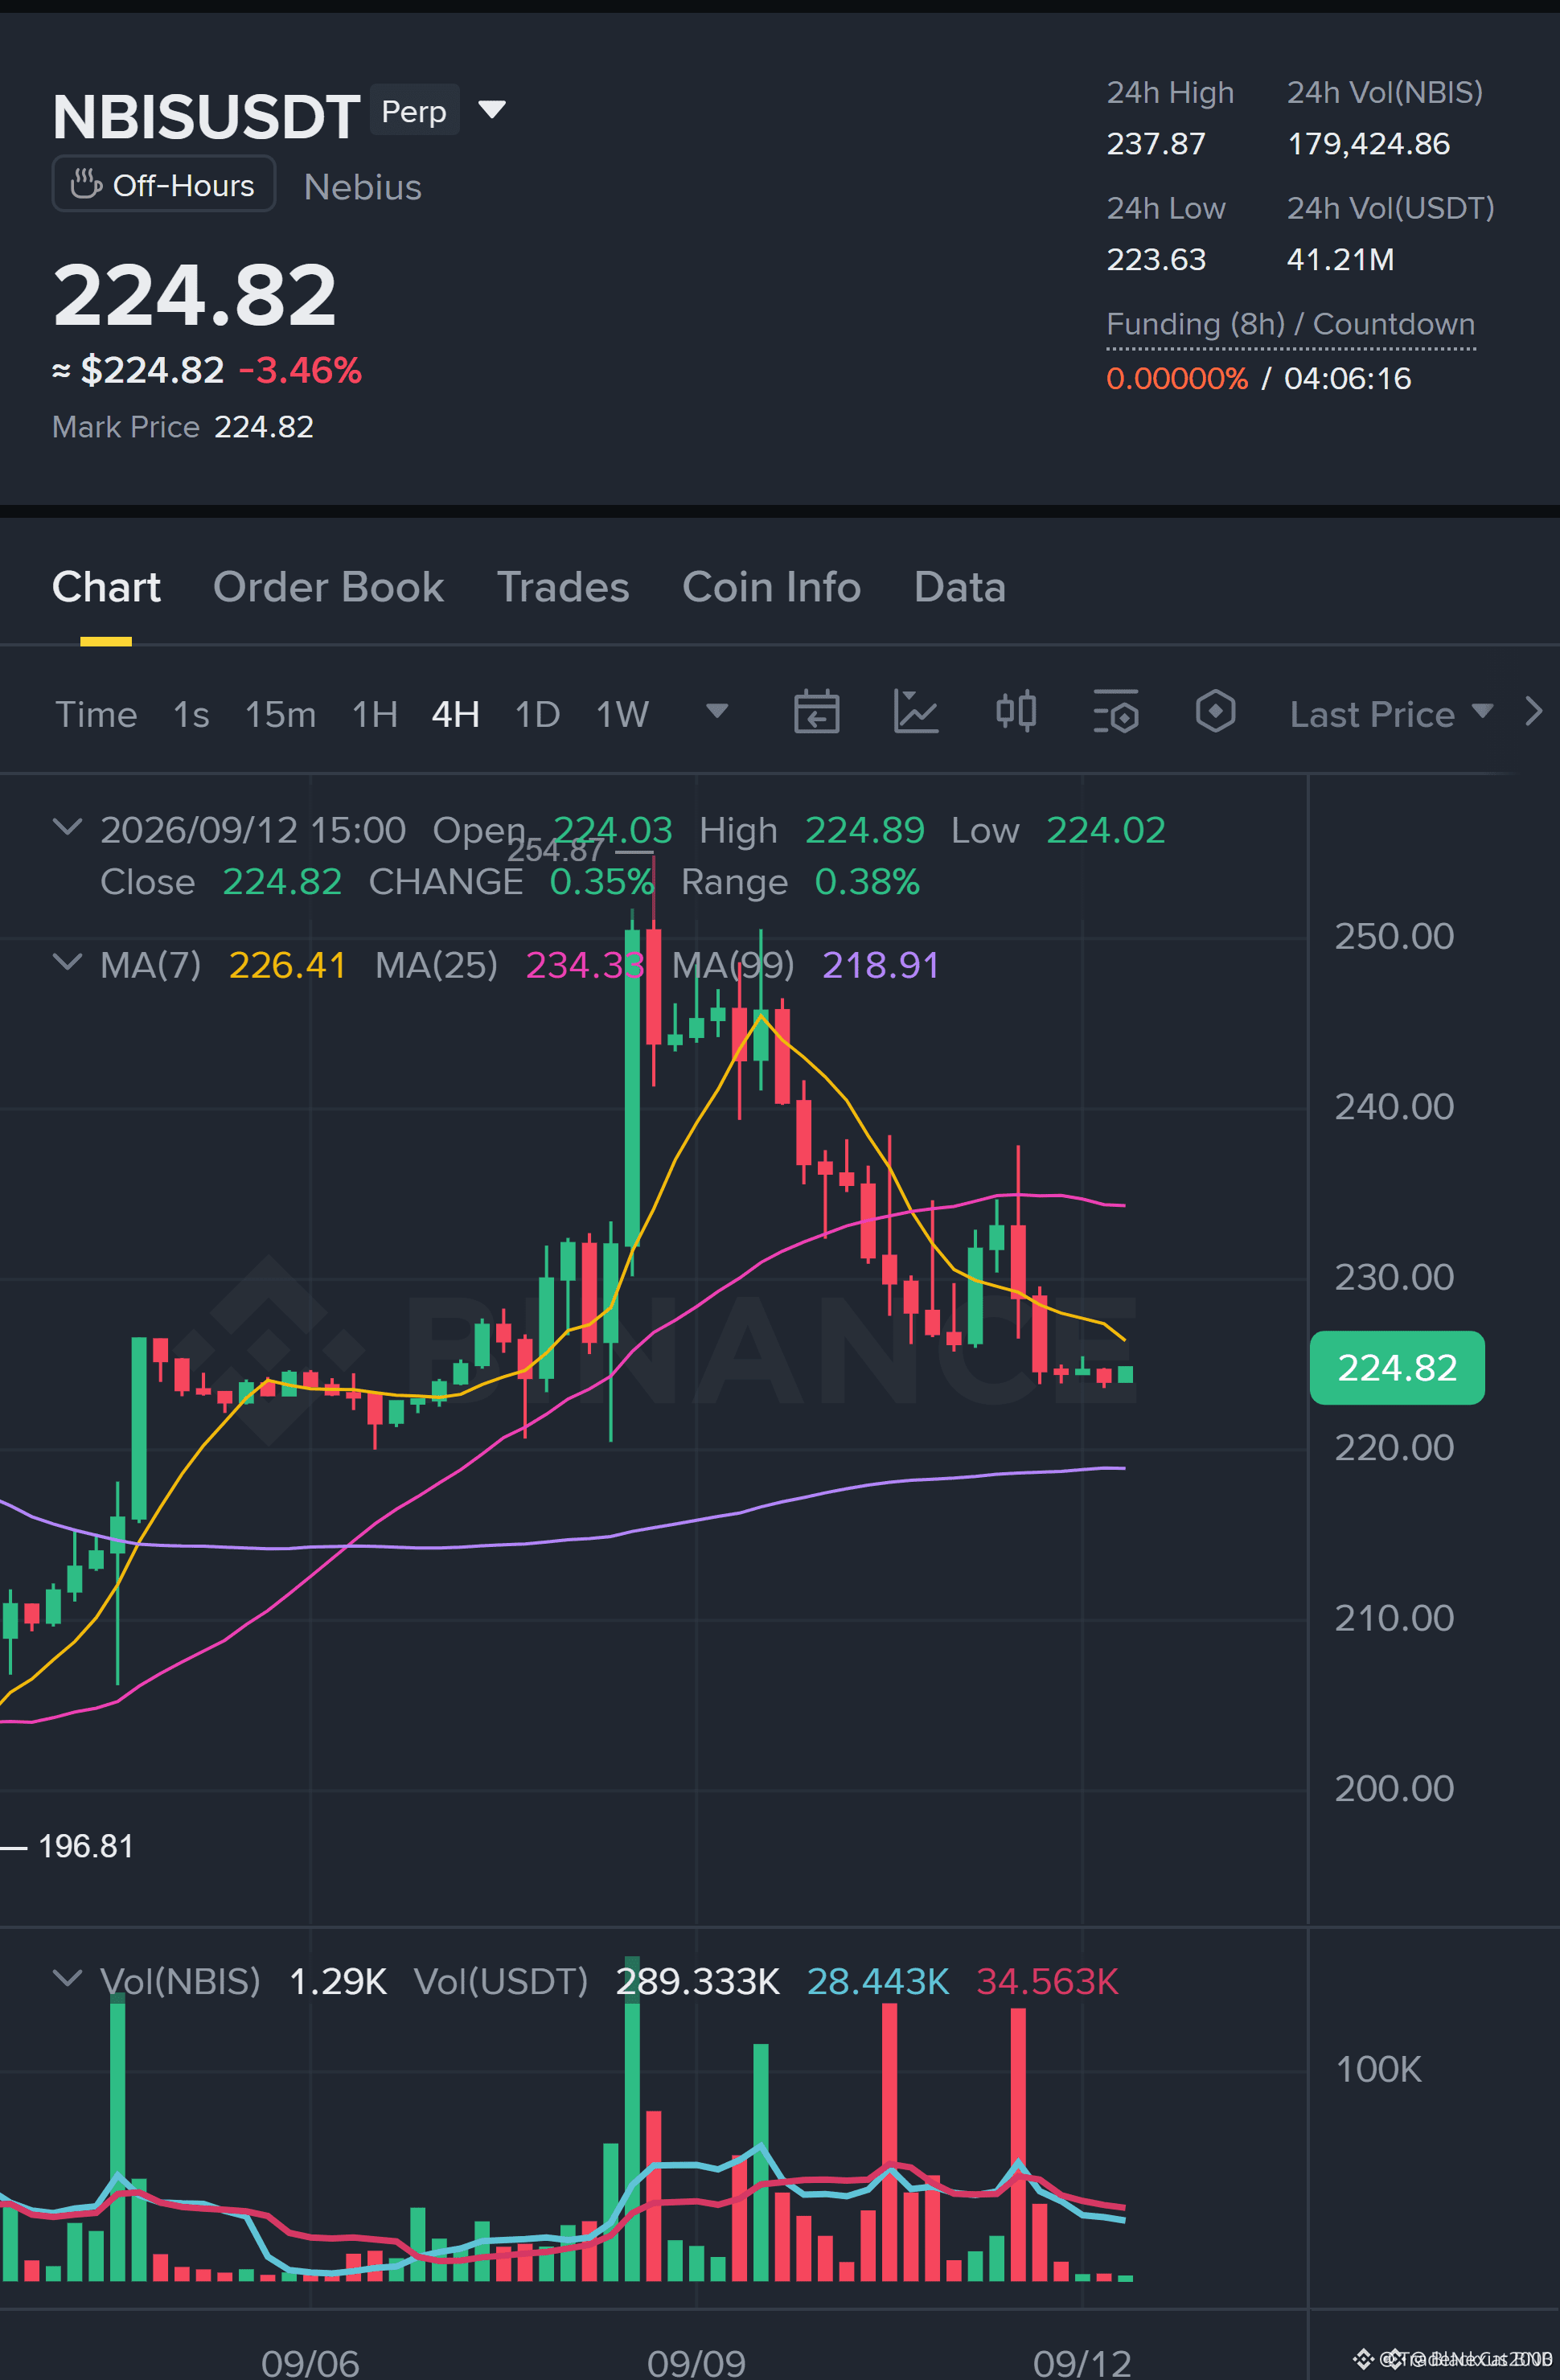
🚨 $NBIS BEARISH STRUCTURE IMPRINT AT 224.76 BUT PATIENCE IS MANDATORY BEFORE EXECUTING 📉
Entry: 224.64 - 224.76 🔻
Target: 221.70 📉
Stop Loss: 225.57 🛑
The 1H timeframe on $NBIS continues to display institutional sell-side control with lower highs printing into localized supply. 📊 However, lower-timeframe execution remains incomplete as the 15M structure has not yet confirmed a clean shift in market character.
With current expected value registering negative, disciplined capital protection demands this setup remain strictly on your watchlist. 🔍 Smart money waits for structural validation at the 224.76 zone before positioning for the liquidity sweep toward 221.70. 💭 Are you waiting for lower timeframe breakdown confirmation or taking early exposure on supply retests? 👇
⚠️ Not financial advice. Always manage your risk. 🛡️
🏷️ #NBIS #ShortSetup #MarketStructure #Crypto
🐻 🎯
🚨 $NBIS BEARISH STRUCTURE IMPRINT AT 224.76 BUT PATIENCE IS MANDATORY BEFORE EXECUTING 📉
Entry: 224.64 - 224.76 🔻
Target: 221.70 📉
Stop Loss: 225.57 🛑
The 1H timeframe on $NBIS continues to display institutional sell-side control with lower highs printing into localized supply. 📊 However, lower-timeframe execution remains incomplete as the 15M structure has not yet confirmed a clean shift in market character.
With current expected value registering negative, disciplined capital protection demands this setup remain strictly on your watchlist. 🔍 Smart money waits for structural validation at the 224.76 zone before positioning for the liquidity sweep toward 221.70. 💭 Are you waiting for lower timeframe breakdown confirmation or taking early exposure on supply retests? 👇
⚠️ Not financial advice. Always manage your risk. 🛡️
🏷️ #NBIS #ShortSetup #MarketStructure #Crypto
🐻 🎯
Entry: 224.64 - 224.76 🔻
Target: 221.70 📉
Stop Loss: 225.57 🛑
The 1H timeframe on $NBIS continues to display institutional sell-side control with lower highs printing into localized supply. 📊 However, lower-timeframe execution remains incomplete as the 15M structure has not yet confirmed a clean shift in market character.
With current expected value registering negative, disciplined capital protection demands this setup remain strictly on your watchlist. 🔍 Smart money waits for structural validation at the 224.76 zone before positioning for the liquidity sweep toward 221.70. 💭 Are you waiting for lower timeframe breakdown confirmation or taking early exposure on supply retests? 👇
⚠️ Not financial advice. Always manage your risk. 🛡️
🏷️ #NBIS #ShortSetup #MarketStructure #Crypto
🐻 🎯
37

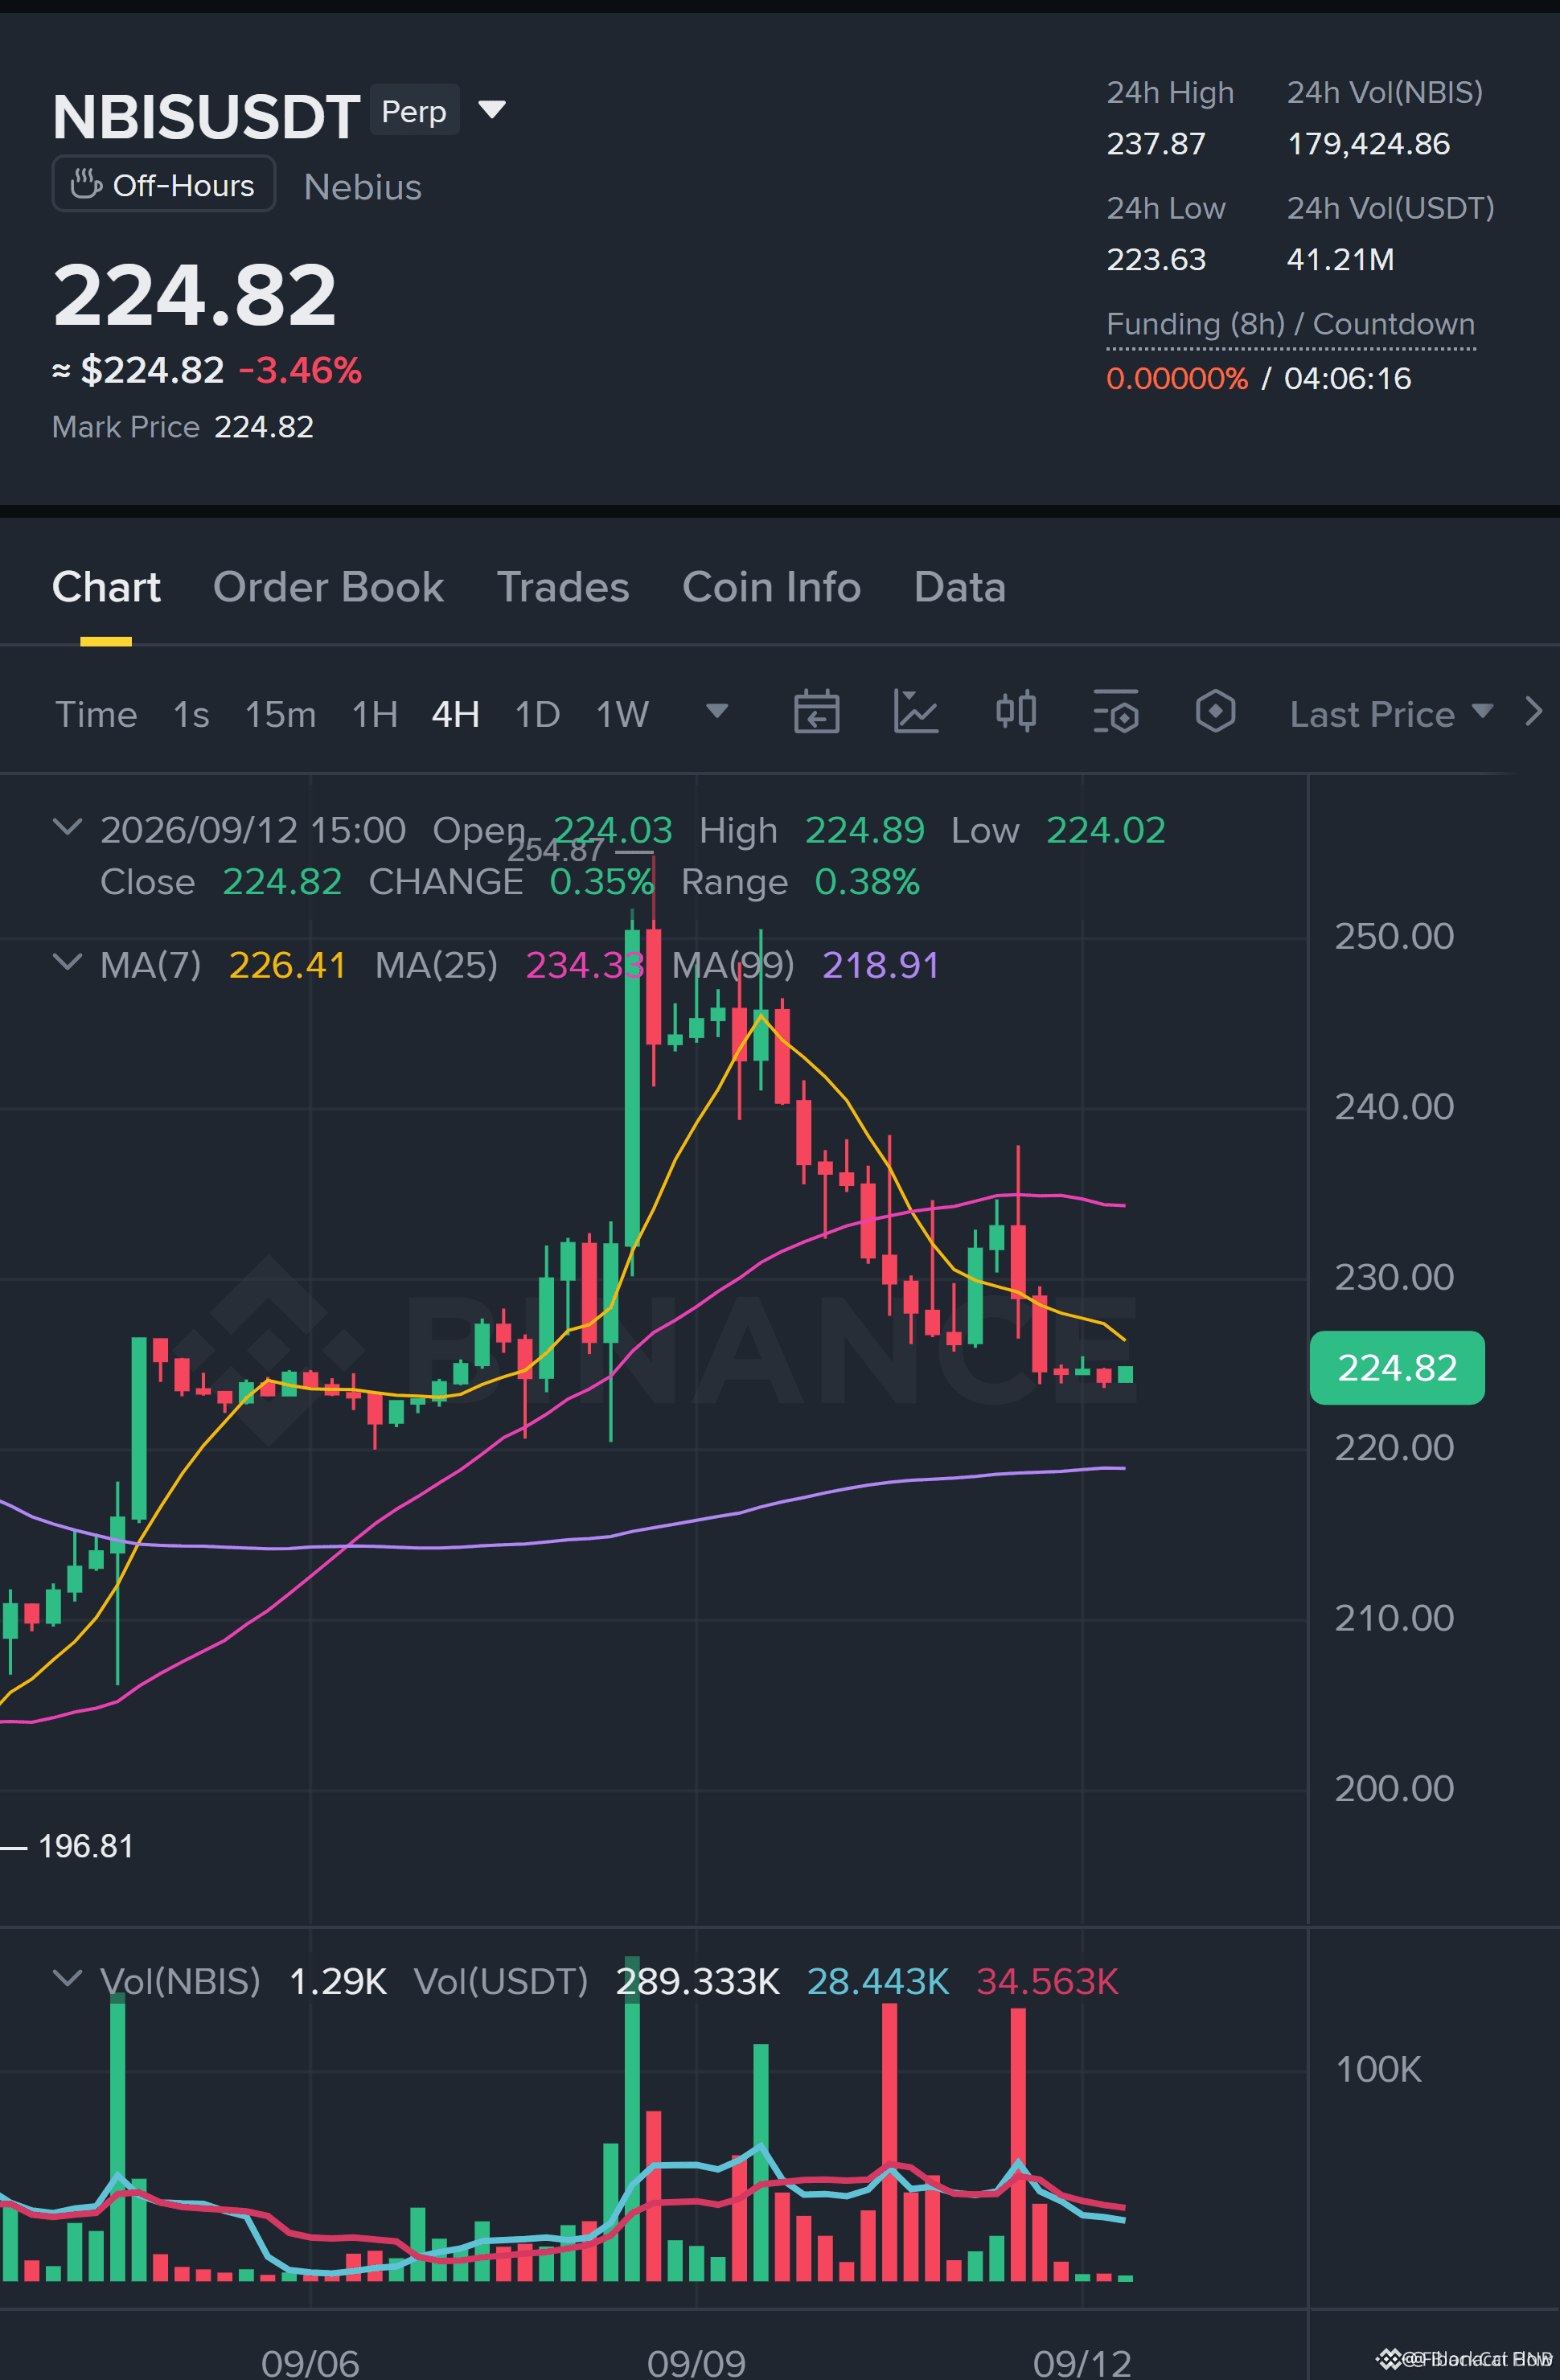
🚨 $NBIS PREPARES TO BREAK DOWN AS SELLERS DEFEND THE 1H RESISTANCE 📉
Entry: 224.64 - 224.76 🔻
Target: 221.70 🎯
Stop Loss: 225.57 🛑
The hourly frame on $NBIS shows clear distribution, with sellers aggressively capping relief rallies into the 224.70 supply zone. 📊 Price action leans heavily lower, but lower timeframe confirmation hasn't fully printed just yet.
Execution discipline is key here. 🔍 Patience pays on setups like this—keep $NBIS on your radar and let the market validate order flow before stepping in. 💬
Do you wait for lower timeframe validation before pulling the trigger, or do you front-run the breakdown? 👇
⚠️ Not financial advice. Always manage your risk. 🛡️
🏷️ #NBIS #ShortSetup #Crypto #PriceAction
📉 🐻
🚨 $NBIS PREPARES TO BREAK DOWN AS SELLERS DEFEND THE 1H RESISTANCE 📉
Entry: 224.64 - 224.76 🔻
Target: 221.70 🎯
Stop Loss: 225.57 🛑
The hourly frame on $NBIS shows clear distribution, with sellers aggressively capping relief rallies into the 224.70 supply zone. 📊 Price action leans heavily lower, but lower timeframe confirmation hasn't fully printed just yet.
Execution discipline is key here. 🔍 Patience pays on setups like this—keep $NBIS on your radar and let the market validate order flow before stepping in. 💬
Do you wait for lower timeframe validation before pulling the trigger, or do you front-run the breakdown? 👇
⚠️ Not financial advice. Always manage your risk. 🛡️
🏷️ #NBIS #ShortSetup #Crypto #PriceAction
📉 🐻
Entry: 224.64 - 224.76 🔻
Target: 221.70 🎯
Stop Loss: 225.57 🛑
The hourly frame on $NBIS shows clear distribution, with sellers aggressively capping relief rallies into the 224.70 supply zone. 📊 Price action leans heavily lower, but lower timeframe confirmation hasn't fully printed just yet.
Execution discipline is key here. 🔍 Patience pays on setups like this—keep $NBIS on your radar and let the market validate order flow before stepping in. 💬
Do you wait for lower timeframe validation before pulling the trigger, or do you front-run the breakdown? 👇
⚠️ Not financial advice. Always manage your risk. 🛡️
🏷️ #NBIS #ShortSetup #Crypto #PriceAction
📉 🐻
32

·
--
31

·
--
$NBIS #NBIS #Contract Trading
Long Alert | NBIS 15m rapid volatility
5m surge with high volume
Current price 205.94
Trigger level 216.72
Invalidation level 202.19
Observation levels 224.09 / 234.76
Funding fee +0.0087% (longs pay, shorts receive)
Market cues: 30m volatility +3.7% / 5m turnover 8.2x / 24h turnover active
Anomalous increase in funds. You may chase longs at the current price; the invalidation level is your stop-loss.
$NBIS #NBIS #Contract Trading
Long Alert | NBIS 15m rapid volatility
5m surge with high volume
Current price 205.94
Trigger level 216.72
Invalidation level 202.19
Observation levels 224.09 / 234.76
Funding fee +0.0087% (longs pay, shorts receive)
Market cues: 30m volatility +3.7% / 5m turnover 8.2x / 24h turnover active
Anomalous increase in funds. You may chase longs at the current price; the invalidation level is your stop-loss.
Long Alert | NBIS 15m rapid volatility
5m surge with high volume
Current price 205.94
Trigger level 216.72
Invalidation level 202.19
Observation levels 224.09 / 234.76
Funding fee +0.0087% (longs pay, shorts receive)
Market cues: 30m volatility +3.7% / 5m turnover 8.2x / 24h turnover active
Anomalous increase in funds. You may chase longs at the current price; the invalidation level is your stop-loss.
21

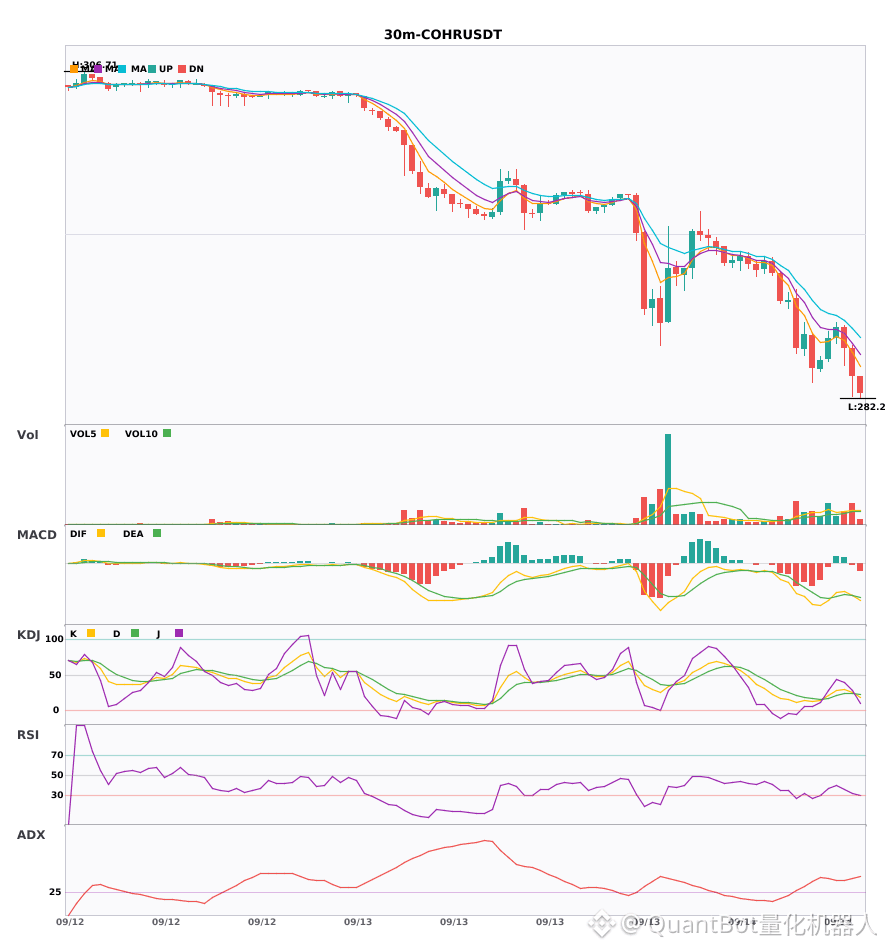
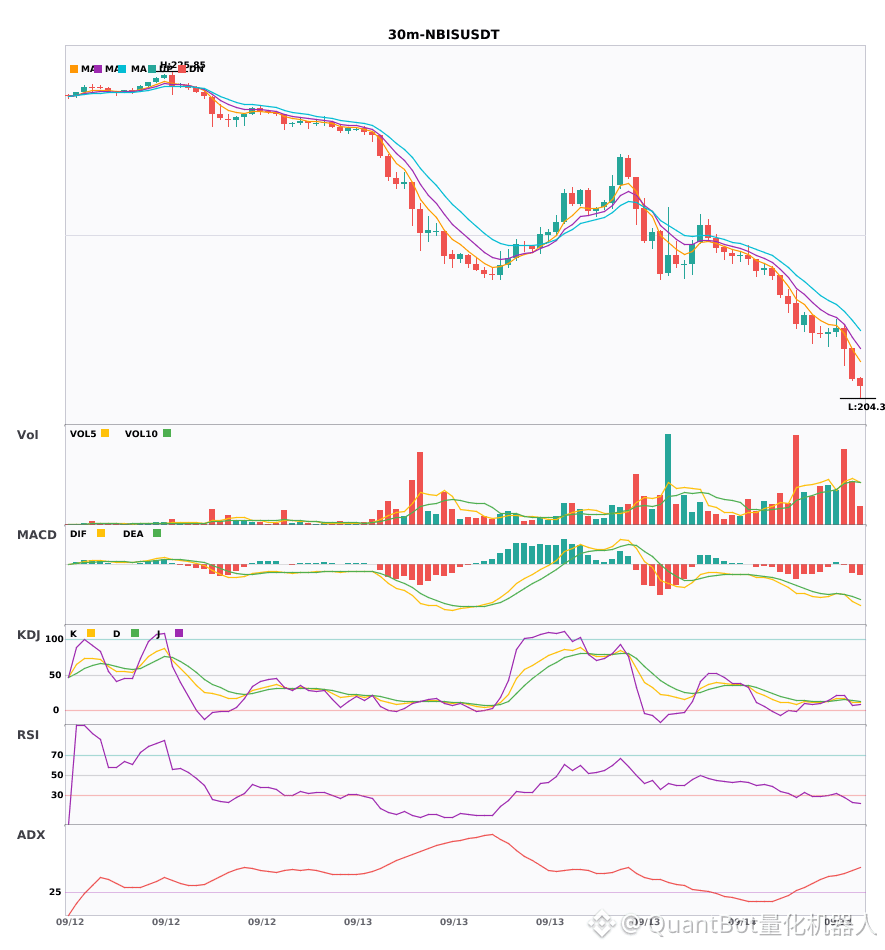
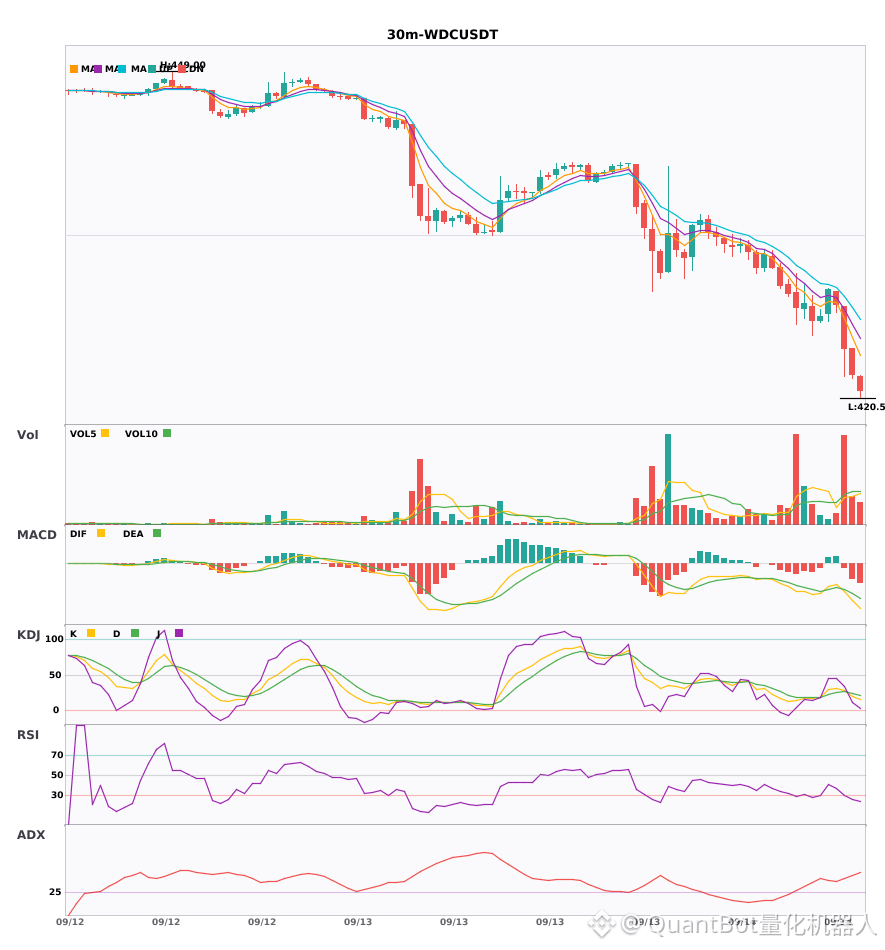
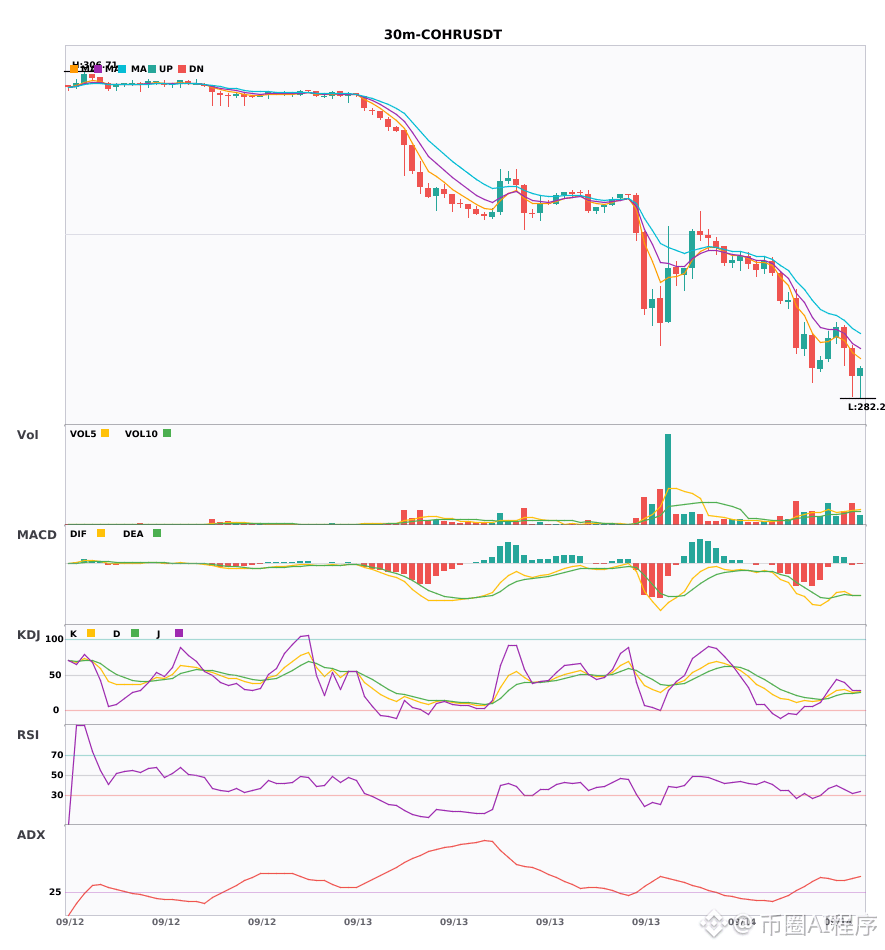
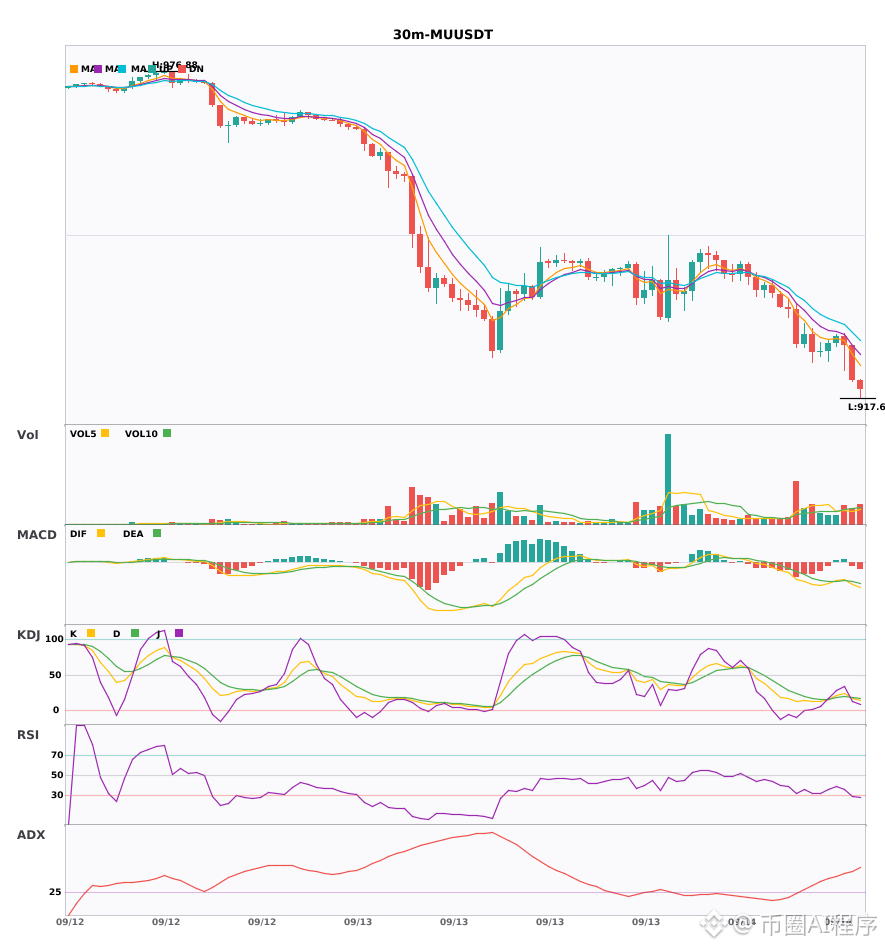
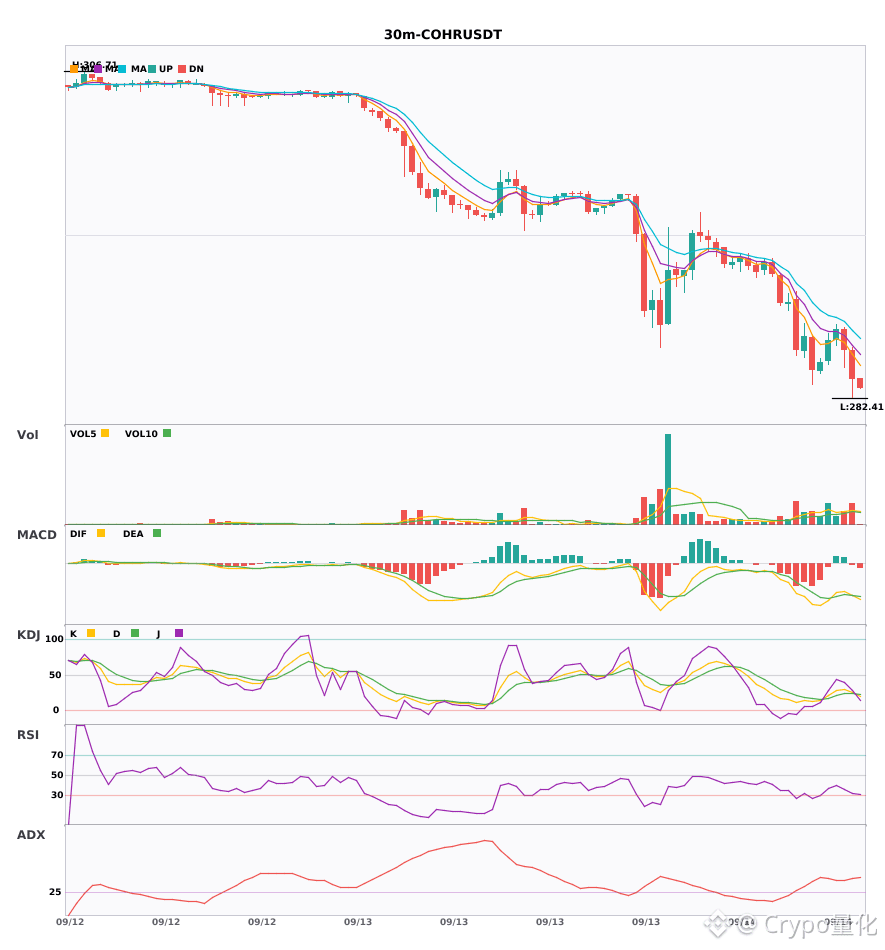
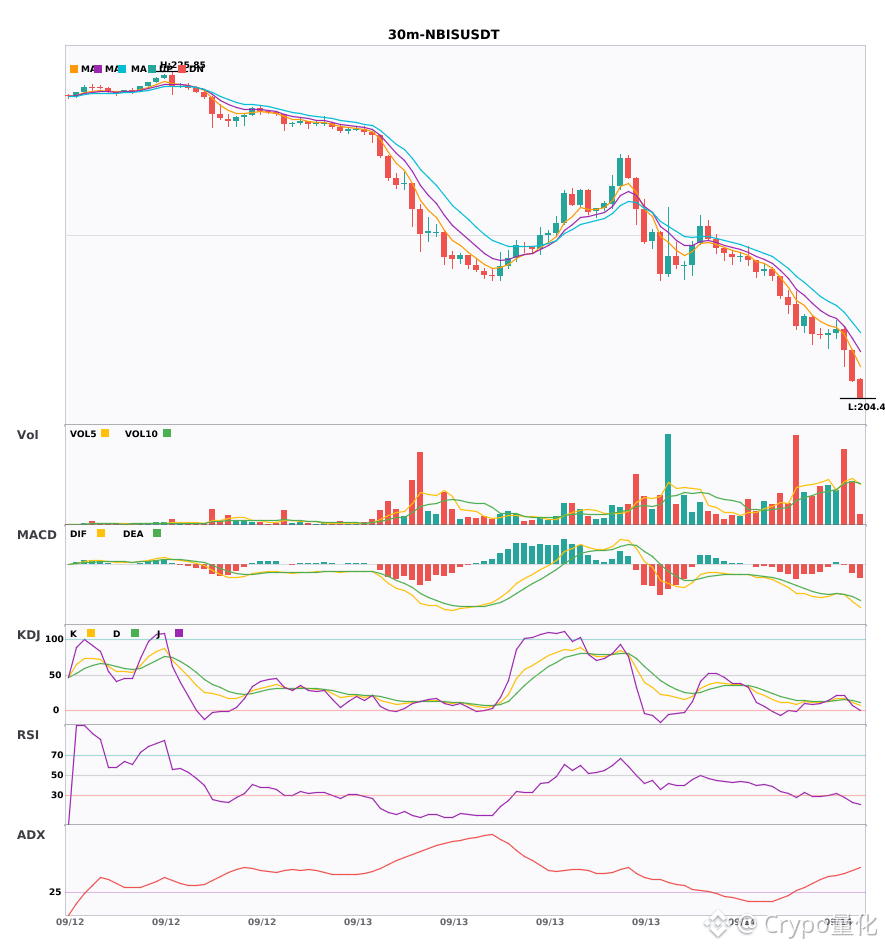
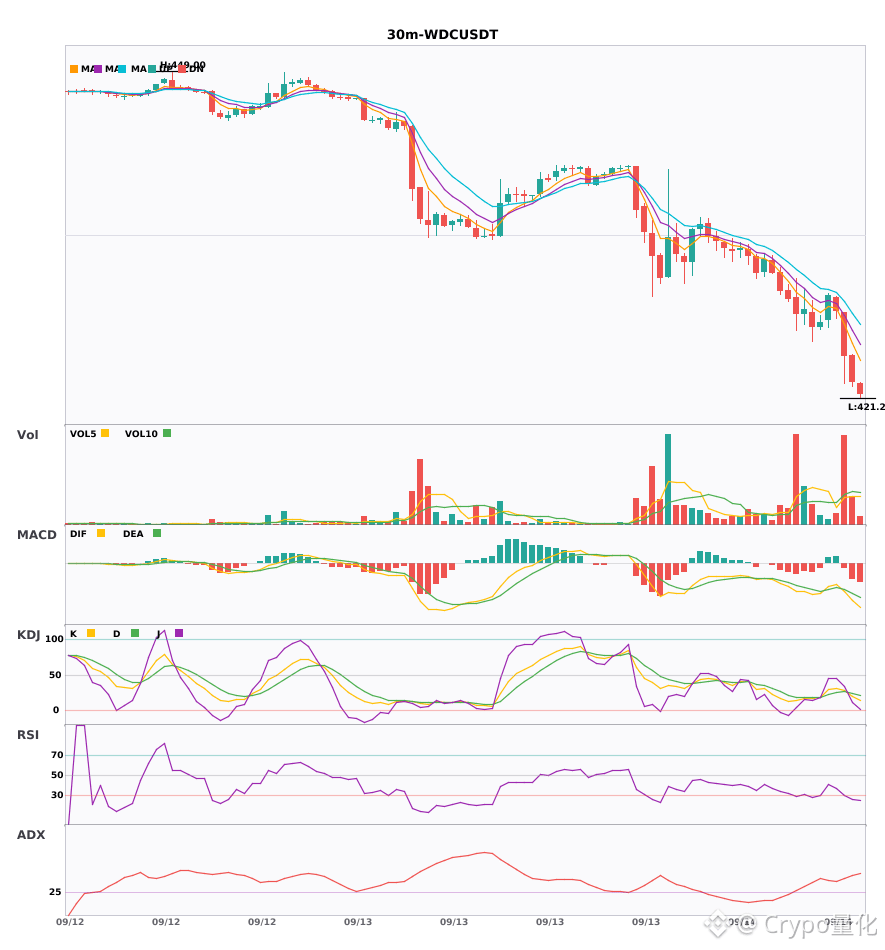
$COHR / $NBIS / $WDC 30 minute-level bias is bearish, short-term pressure
📉 $COHR | 30-minute bearish signal
━━━━━━━━━━━━━━━━━━
Technical analysis: ADX(43) shows a clear trending market | MACD below zero with a dead cross, bearish momentum accelerating | EMA5 < EMA8 < EMA13 bearish alignment | KDJ in weak performance, bearish dominance (K is 25.7, D is 24.6) | Volume expanding (1.6x)
Price change: -0.7500%
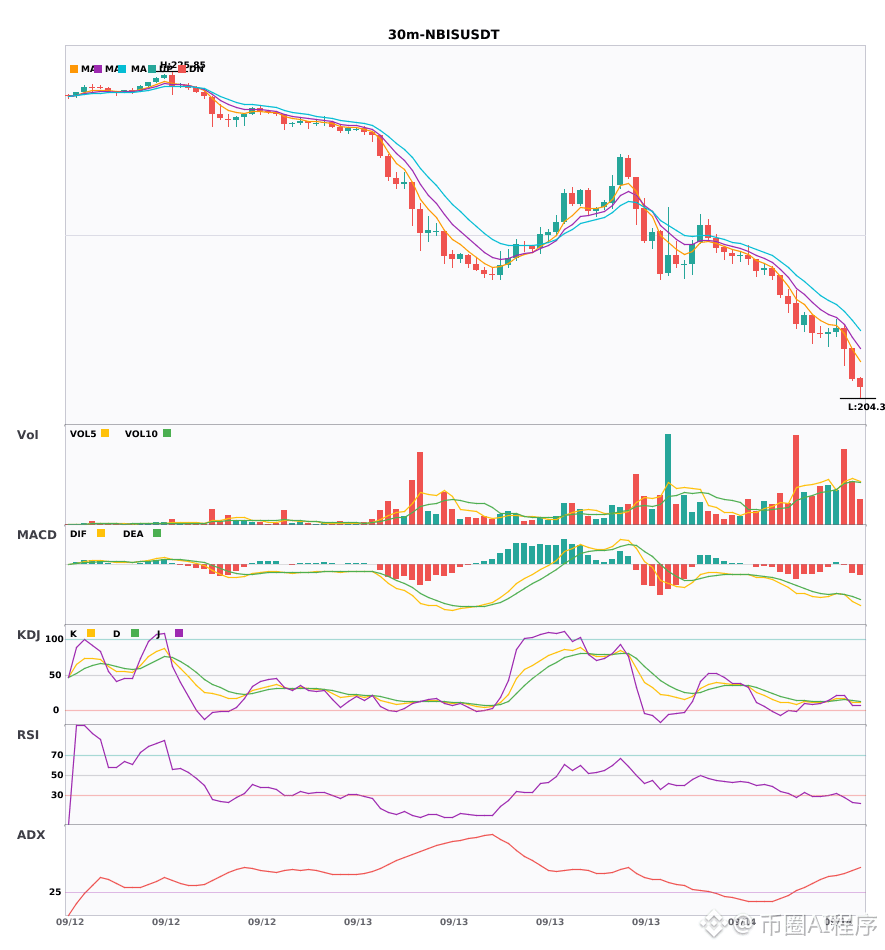
📉 $NBIS | 30-minute bearish signal
━━━━━━━━━━━━━━━━━━
Technical analysis: ADX(52) a very strong trend (watch for an overheated pullback) | MACD below zero with a dead cross, bearish momentum accelerating | EMA5 < EMA8 < EMA13 bearish alignment | KDJ in the oversold zone, watch for rebound opportunities (K is 17.0, D is 15.1) | Volume expanding (1.8x)
Price change: -0.6700%
📉 $WDC | 30-minute bearish signal
━━━━━━━━━━━━━━━━━━
Technical analysis: ADX(45) a clear trending market | MACD below zero with a dead cross, bearish momentum accelerating | EMA5 < EMA8 < EMA13 bearish alignment | KDJ in weak performance, bearish dominance (K is 28.8, D is 26.4) | Volume surge (2.9x)
Price change: -0.9000%
━━━━━━━━━━━━━━━━━━
#技术分析 #COHR #NBIS #WDC
📌 The above content is for reference only and does not constitute investment advice
$COHR / $NBIS / $WDC 30 minute-level bias is bearish, short-term pressure
📉 $COHR | 30-minute bearish signal
━━━━━━━━━━━━━━━━━━
Technical analysis: ADX(43) shows a clear trending market | MACD below zero with a dead cross, bearish momentum accelerating | EMA5 < EMA8 < EMA13 bearish alignment | KDJ in weak performance, bearish dominance (K is 25.7, D is 24.6) | Volume expanding (1.6x)
Price change: -0.7500%
📉 $NBIS | 30-minute bearish signal
━━━━━━━━━━━━━━━━━━
Technical analysis: ADX(52) a very strong trend (watch for an overheated pullback) | MACD below zero with a dead cross, bearish momentum accelerating | EMA5 < EMA8 < EMA13 bearish alignment | KDJ in the oversold zone, watch for rebound opportunities (K is 17.0, D is 15.1) | Volume expanding (1.8x)
Price change: -0.6700%
📉 $WDC | 30-minute bearish signal
━━━━━━━━━━━━━━━━━━
Technical analysis: ADX(45) a clear trending market | MACD below zero with a dead cross, bearish momentum accelerating | EMA5 < EMA8 < EMA13 bearish alignment | KDJ in weak performance, bearish dominance (K is 28.8, D is 26.4) | Volume surge (2.9x)
Price change: -0.9000%
━━━━━━━━━━━━━━━━━━
#技术分析 #COHR #NBIS #WDC
📌 The above content is for reference only and does not constitute investment advice
📉 $COHR | 30-minute bearish signal
━━━━━━━━━━━━━━━━━━
Technical analysis: ADX(43) shows a clear trending market | MACD below zero with a dead cross, bearish momentum accelerating | EMA5 < EMA8 < EMA13 bearish alignment | KDJ in weak performance, bearish dominance (K is 25.7, D is 24.6) | Volume expanding (1.6x)
Price change: -0.7500%
📉 $NBIS | 30-minute bearish signal
━━━━━━━━━━━━━━━━━━
Technical analysis: ADX(52) a very strong trend (watch for an overheated pullback) | MACD below zero with a dead cross, bearish momentum accelerating | EMA5 < EMA8 < EMA13 bearish alignment | KDJ in the oversold zone, watch for rebound opportunities (K is 17.0, D is 15.1) | Volume expanding (1.8x)
Price change: -0.6700%
📉 $WDC | 30-minute bearish signal
━━━━━━━━━━━━━━━━━━
Technical analysis: ADX(45) a clear trending market | MACD below zero with a dead cross, bearish momentum accelerating | EMA5 < EMA8 < EMA13 bearish alignment | KDJ in weak performance, bearish dominance (K is 28.8, D is 26.4) | Volume surge (2.9x)
Price change: -0.9000%
━━━━━━━━━━━━━━━━━━
#技术分析 #COHR #NBIS #WDC
📌 The above content is for reference only and does not constitute investment advice
14

·
--
Three coins, synchronized short-selling at 30 minutes and 4 hours—short-side resonance signal confirmed 🔥
════════════════════
🟢 $COHR 30-minute short signal
⚠️ Technical analysis: multi-timeframe resonance bearish! 4-hour short-side confirmation; 30-minute MACD forms a bearish cross below zero; moving averages are arranged bearishly; KDJ’s K is below D; volume expands by 1.6x
════════════════════
🟢 $NBIS 30-minute short signal
⚠️ Technical analysis: multi-timeframe resonance! 4-hour short-side confirmation; 30-minute MACD bearish cross below zero with green histogram amplified; moving averages arranged bearishly and diverging; volume expands by 1.8x; KDJ is oversold—watch for a rebound.
════════════════════
🟢 $MU 3 30-minute short signal
⚠️ Technical analysis: multi-timeframe resonance! 4-hour short-side confirmation; 30-minute entry: MACD bearish cross below zero with green histogram amplified; moving averages arranged bearishly and diverging downward; KDJ’s K crosses below D—bearish in the short term
════════════════════
🔔 Follow to get real-time market updates on abnormal moves 🔔
#多周期共振 #COHR #NBIS #MU
📌 When trading, pay attention to whether the candlestick pattern matches
Three coins, synchronized short-selling at 30 minutes and 4 hours—short-side resonance signal confirmed 🔥
════════════════════
🟢 $COHR 30-minute short signal
⚠️ Technical analysis: multi-timeframe resonance bearish! 4-hour short-side confirmation; 30-minute MACD forms a bearish cross below zero; moving averages are arranged bearishly; KDJ’s K is below D; volume expands by 1.6x
════════════════════
🟢 $NBIS 30-minute short signal
⚠️ Technical analysis: multi-timeframe resonance! 4-hour short-side confirmation; 30-minute MACD bearish cross below zero with green histogram amplified; moving averages arranged bearishly and diverging; volume expands by 1.8x; KDJ is oversold—watch for a rebound.
════════════════════
🟢 $MU 3 30-minute short signal
⚠️ Technical analysis: multi-timeframe resonance! 4-hour short-side confirmation; 30-minute entry: MACD bearish cross below zero with green histogram amplified; moving averages arranged bearishly and diverging downward; KDJ’s K crosses below D—bearish in the short term
════════════════════
🔔 Follow to get real-time market updates on abnormal moves 🔔
#多周期共振 #COHR #NBIS #MU
📌 When trading, pay attention to whether the candlestick pattern matches
════════════════════
🟢 $COHR 30-minute short signal
⚠️ Technical analysis: multi-timeframe resonance bearish! 4-hour short-side confirmation; 30-minute MACD forms a bearish cross below zero; moving averages are arranged bearishly; KDJ’s K is below D; volume expands by 1.6x
════════════════════
🟢 $NBIS 30-minute short signal
⚠️ Technical analysis: multi-timeframe resonance! 4-hour short-side confirmation; 30-minute MACD bearish cross below zero with green histogram amplified; moving averages arranged bearishly and diverging; volume expands by 1.8x; KDJ is oversold—watch for a rebound.
════════════════════
🟢 $MU 3 30-minute short signal
⚠️ Technical analysis: multi-timeframe resonance! 4-hour short-side confirmation; 30-minute entry: MACD bearish cross below zero with green histogram amplified; moving averages arranged bearishly and diverging downward; KDJ’s K crosses below D—bearish in the short term
════════════════════
🔔 Follow to get real-time market updates on abnormal moves 🔔
#多周期共振 #COHR #NBIS #MU
📌 When trading, pay attention to whether the candlestick pattern matches
6

·
--
$COHR/$NBIS/$WDC 30 minutes collective conversion to shorts, it’s going down 🔥
════════════════════
🟢 $COHR 30 minutes Bearish signal
⚠️ Technical analysis: ADX(43) shows a clear trending market | MACD dead cross below zero, bearish momentum accelerating | EMA5 < EMA8 < EMA13 bearish alignment | KDJ is weak, bears in control (K is 25.7, D is 24.6) | Volume expands (1.6x)
════════════════════
🟢 $NBIS 30 minutes Bearish signal
⚠️ Technical analysis: ADX(52) is a very strong trend (be cautious of an overheated pullback) | MACD dead cross below zero, bearish momentum accelerating | EMA5 < EMA8 < EMA13 bearish alignment | KDJ in oversold zone—watch for rebound opportunities (K is 17.0, D is 15.1) | Volume expands (1.8x)
════════════════════
🟢 $WDC 30 minutes Bearish signal
⚠️ Technical analysis: ADX45 trend is clear; MACD dead cross below zero with accelerating bears; moving averages in bearish order; KDJ weak and bearish dominant; volume expands by 2.9x
════════════════════
🔔 Follow for the first-hand market move updates 🔔
#技术分析 #COHR #NBIS #WDC
📌 When trading, pay attention to whether the candlestick patterns match
$COHR /$NBIS /$WDC 30 minutes collective conversion to shorts, it’s going down 🔥
════════════════════
🟢 $COHR 30 minutes Bearish signal
⚠️ Technical analysis: ADX(43) shows a clear trending market | MACD dead cross below zero, bearish momentum accelerating | EMA5 < EMA8 < EMA13 bearish alignment | KDJ is weak, bears in control (K is 25.7, D is 24.6) | Volume expands (1.6x)
════════════════════
🟢 $NBIS 30 minutes Bearish signal
⚠️ Technical analysis: ADX(52) is a very strong trend (be cautious of an overheated pullback) | MACD dead cross below zero, bearish momentum accelerating | EMA5 < EMA8 < EMA13 bearish alignment | KDJ in oversold zone—watch for rebound opportunities (K is 17.0, D is 15.1) | Volume expands (1.8x)
════════════════════
🟢 $WDC 30 minutes Bearish signal
⚠️ Technical analysis: ADX45 trend is clear; MACD dead cross below zero with accelerating bears; moving averages in bearish order; KDJ weak and bearish dominant; volume expands by 2.9x
════════════════════
🔔 Follow for the first-hand market move updates 🔔
#技术分析 #COHR #NBIS #WDC
📌 When trading, pay attention to whether the candlestick patterns match
════════════════════
🟢 $COHR 30 minutes Bearish signal
⚠️ Technical analysis: ADX(43) shows a clear trending market | MACD dead cross below zero, bearish momentum accelerating | EMA5 < EMA8 < EMA13 bearish alignment | KDJ is weak, bears in control (K is 25.7, D is 24.6) | Volume expands (1.6x)
════════════════════
🟢 $NBIS 30 minutes Bearish signal
⚠️ Technical analysis: ADX(52) is a very strong trend (be cautious of an overheated pullback) | MACD dead cross below zero, bearish momentum accelerating | EMA5 < EMA8 < EMA13 bearish alignment | KDJ in oversold zone—watch for rebound opportunities (K is 17.0, D is 15.1) | Volume expands (1.8x)
════════════════════
🟢 $WDC 30 minutes Bearish signal
⚠️ Technical analysis: ADX45 trend is clear; MACD dead cross below zero with accelerating bears; moving averages in bearish order; KDJ weak and bearish dominant; volume expands by 2.9x
════════════════════
🔔 Follow for the first-hand market move updates 🔔
#技术分析 #COHR #NBIS #WDC
📌 When trading, pay attention to whether the candlestick patterns match
161

·
--
It fell 3.936% in $NBIS 24 hours, quoted at 209.92, and the funding rate is tightly pinned at zero. The old dog took a look at the position: the 65,207.45 contract units haven’t moved much, while the trading volume surged to $23.72 million. With the price pushed down, yet the long/short funding rates stay flat—this combination is unusual.
A funding rate greater than zero means longs pay shorts, which usually signals crowded longs; less than zero means shorts pay longs, indicating crowded shorts. Now it’s zero—no one is paying. In a downturn, this either suggests a standoff or building up fuel. $NBIS is an on-chain U.S. stock contract for the semiconductor sector. Theoretically it should track tech-stock sentiment, but in this drop there’s no evidence of the kind of long “crowding/trampling” you’d see when BTC funding rates are positive. If BTC’s funding rate is positive, it’s often a sign of excessively crowded longs. But here $NBIS’s funding rate is at zero—shorts didn’t dare to press the advantage, and the open interest is still holding up, suggesting the old positions haven’t largely withdrawn.
When trading volume expands in tandem with the price falling, it may indicate some positions are being adjusted. But since the funding rate hasn’t changed, the re-positioning force is limited. From the perspective of Crypto × TradFi resonance: as a TradFi asset’s on-chain contract structure, $NBIS currently shows a balance between longs and shorts—this contrasts with the commonly non-zero funding-state seen in crypto markets. If crypto volatility becomes intense, capital might flow into such neutral-funding assets for temporary shelter, but since the input doesn’t provide BTC or COIN/MSTR/HOOD data, this is only a single-signal inference.
The old dog’s view is that watching from the sidelines is steadier than taking action right now. If the funding rate turns negative—confirming shorts start paying—and the price can hold above 209, then it could be worth trying a small long position, because negative funding may trigger a short-term squeeze. Conversely, if the funding rate suddenly turns positive and the price breaks below 200, the risk is that longs get trapped and add aggressively. If open interest then crashes as well, a liquidation wave could form, and you would need to撤.
The strongest contrary evidence: the price is falling but open interest doesn’t decrease. That could be a “hold-your-ground” signal—once a breakdown occurs, the sell-off could accelerate. With the funding rate neutral and also lacking panic, when they “fight” each other, I trust the funding rate more.
Second-order effects: if the funding rate turns negative, shorts will be forced to close, pushing the price up. If it turns positive, longs will absorb the downside cost, and liquidity may rotate toward other neutral-funding instruments.
Invalidation conditions are clear: if the funding rate turns positive and the price continues to fall, my neutral assessment is invalid.
Trading tag: #BinanceFutures #TradFi #USDⓈM #NBIS #NBISUSDT $NBIS
It fell 3.936% in $NBIS 24 hours, quoted at 209.92, and the funding rate is tightly pinned at zero. The old dog took a look at the position: the 65,207.45 contract units haven’t moved much, while the trading volume surged to $23.72 million. With the price pushed down, yet the long/short funding rates stay flat—this combination is unusual.
A funding rate greater than zero means longs pay shorts, which usually signals crowded longs; less than zero means shorts pay longs, indicating crowded shorts. Now it’s zero—no one is paying. In a downturn, this either suggests a standoff or building up fuel. $NBIS is an on-chain U.S. stock contract for the semiconductor sector. Theoretically it should track tech-stock sentiment, but in this drop there’s no evidence of the kind of long “crowding/trampling” you’d see when BTC funding rates are positive. If BTC’s funding rate is positive, it’s often a sign of excessively crowded longs. But here $NBIS ’s funding rate is at zero—shorts didn’t dare to press the advantage, and the open interest is still holding up, suggesting the old positions haven’t largely withdrawn.
When trading volume expands in tandem with the price falling, it may indicate some positions are being adjusted. But since the funding rate hasn’t changed, the re-positioning force is limited. From the perspective of Crypto × TradFi resonance: as a TradFi asset’s on-chain contract structure, $NBIS currently shows a balance between longs and shorts—this contrasts with the commonly non-zero funding-state seen in crypto markets. If crypto volatility becomes intense, capital might flow into such neutral-funding assets for temporary shelter, but since the input doesn’t provide BTC or COIN/MSTR/HOOD data, this is only a single-signal inference.
The old dog’s view is that watching from the sidelines is steadier than taking action right now. If the funding rate turns negative—confirming shorts start paying—and the price can hold above 209, then it could be worth trying a small long position, because negative funding may trigger a short-term squeeze. Conversely, if the funding rate suddenly turns positive and the price breaks below 200, the risk is that longs get trapped and add aggressively. If open interest then crashes as well, a liquidation wave could form, and you would need to撤.
The strongest contrary evidence: the price is falling but open interest doesn’t decrease. That could be a “hold-your-ground” signal—once a breakdown occurs, the sell-off could accelerate. With the funding rate neutral and also lacking panic, when they “fight” each other, I trust the funding rate more.
Second-order effects: if the funding rate turns negative, shorts will be forced to close, pushing the price up. If it turns positive, longs will absorb the downside cost, and liquidity may rotate toward other neutral-funding instruments.
Invalidation conditions are clear: if the funding rate turns positive and the price continues to fall, my neutral assessment is invalid.
Trading tag: #BinanceFutures #TradFi #USDⓈM #NBIS #NBISUSDT $NBIS
A funding rate greater than zero means longs pay shorts, which usually signals crowded longs; less than zero means shorts pay longs, indicating crowded shorts. Now it’s zero—no one is paying. In a downturn, this either suggests a standoff or building up fuel. $NBIS is an on-chain U.S. stock contract for the semiconductor sector. Theoretically it should track tech-stock sentiment, but in this drop there’s no evidence of the kind of long “crowding/trampling” you’d see when BTC funding rates are positive. If BTC’s funding rate is positive, it’s often a sign of excessively crowded longs. But here $NBIS ’s funding rate is at zero—shorts didn’t dare to press the advantage, and the open interest is still holding up, suggesting the old positions haven’t largely withdrawn.
When trading volume expands in tandem with the price falling, it may indicate some positions are being adjusted. But since the funding rate hasn’t changed, the re-positioning force is limited. From the perspective of Crypto × TradFi resonance: as a TradFi asset’s on-chain contract structure, $NBIS currently shows a balance between longs and shorts—this contrasts with the commonly non-zero funding-state seen in crypto markets. If crypto volatility becomes intense, capital might flow into such neutral-funding assets for temporary shelter, but since the input doesn’t provide BTC or COIN/MSTR/HOOD data, this is only a single-signal inference.
The old dog’s view is that watching from the sidelines is steadier than taking action right now. If the funding rate turns negative—confirming shorts start paying—and the price can hold above 209, then it could be worth trying a small long position, because negative funding may trigger a short-term squeeze. Conversely, if the funding rate suddenly turns positive and the price breaks below 200, the risk is that longs get trapped and add aggressively. If open interest then crashes as well, a liquidation wave could form, and you would need to撤.
The strongest contrary evidence: the price is falling but open interest doesn’t decrease. That could be a “hold-your-ground” signal—once a breakdown occurs, the sell-off could accelerate. With the funding rate neutral and also lacking panic, when they “fight” each other, I trust the funding rate more.
Second-order effects: if the funding rate turns negative, shorts will be forced to close, pushing the price up. If it turns positive, longs will absorb the downside cost, and liquidity may rotate toward other neutral-funding instruments.
Invalidation conditions are clear: if the funding rate turns positive and the price continues to fall, my neutral assessment is invalid.
Trading tag: #BinanceFutures #TradFi #USDⓈM #NBIS #NBISUSDT $NBIS
32

·
--
$NBIS fell 4.145% in the past 24 hours, and the funding rate is -0.00038610. Behind the numbers, shorts are paying money to longs.
Core view: In the window where political uncertainty suppresses risk assets, NBIS’s negative funding rate is shorts’ wishful thinking—an upswing could come at any time.
Let’s put the data on the table first. Prices are down—that’s a fact. But the funding rate is negative: every 8 hours, shorts pay longs—that’s also a fact. With this combination—price down plus negative funding—the standard playbook is that shorts pile in and bearish consensus is very strong, while longs just lie back and collect, with their position costs being diluted by the funding. Looking at a single signal, this is merely shorts being crowded. But my angle is political and military events. When external events suppress risk appetite, the asset drop is a stress reaction, while the negative funding rate exposes the true cost of the short positions. They’re betting that political risk will persist or escalate, so they’re willing to pay to keep their shorts.
The strongest counterargument here is this: if a negative development in geopolitics or policy is confirmed, or starts to intensify, the price could drop together with the negative funding rate. Then shorts can use their profits to cover the funding cost, and the funding compensation longs receive may not outweigh their position losses. That is the most lethal threat to my core view.
Conditions for my view to be invalid are clear: if the price of $NBIS cannot regain the current level within the next 24 hours and keeps trending down, then the suppressive power of the political event will exceed the resilience implied by the negative funding rate, and my view would be wrong. I will admit defeat and exit.
Second-order effects are already written into the funding-rate “bill.” Every 8 hours, shorts have to pull out real money. The longer it drags on, the greater the shorts’ funding losses. Once market sentiment improves even slightly, or if there’s even a hint of expectations that the political narrative will ease, these underwater shorts paying funding will become the most uncertain sellers and be forced to close—i.e., buy back—thereby creating upward liquidity.
So it’s not about watching the show. I’m waiting for a signal: not a new price low, but after the price stops falling, the funding rate still stays at a significantly negative level. That would imply momentum building for shorts to admit losses and exit. Trigger conditions: the price stabilizes at the current level or rebounds slightly, while the funding rate remains below -0.0002. If it meets the criteria, I’ll try a small long position with 2x leverage, with a stop-loss set 2% below the recent low.
The market is shorting political news right now; I’m going long on shorts’ money.
Trading tag: #TradFi #链上美股 #NBIS
Where do you think this thesis is most likely to be wrong?
$NBIS fell 4.145% in the past 24 hours, and the funding rate is -0.00038610. Behind the numbers, shorts are paying money to longs.
Core view: In the window where political uncertainty suppresses risk assets, NBIS’s negative funding rate is shorts’ wishful thinking—an upswing could come at any time.
Let’s put the data on the table first. Prices are down—that’s a fact. But the funding rate is negative: every 8 hours, shorts pay longs—that’s also a fact. With this combination—price down plus negative funding—the standard playbook is that shorts pile in and bearish consensus is very strong, while longs just lie back and collect, with their position costs being diluted by the funding. Looking at a single signal, this is merely shorts being crowded. But my angle is political and military events. When external events suppress risk appetite, the asset drop is a stress reaction, while the negative funding rate exposes the true cost of the short positions. They’re betting that political risk will persist or escalate, so they’re willing to pay to keep their shorts.
The strongest counterargument here is this: if a negative development in geopolitics or policy is confirmed, or starts to intensify, the price could drop together with the negative funding rate. Then shorts can use their profits to cover the funding cost, and the funding compensation longs receive may not outweigh their position losses. That is the most lethal threat to my core view.
Conditions for my view to be invalid are clear: if the price of $NBIS cannot regain the current level within the next 24 hours and keeps trending down, then the suppressive power of the political event will exceed the resilience implied by the negative funding rate, and my view would be wrong. I will admit defeat and exit.
Second-order effects are already written into the funding-rate “bill.” Every 8 hours, shorts have to pull out real money. The longer it drags on, the greater the shorts’ funding losses. Once market sentiment improves even slightly, or if there’s even a hint of expectations that the political narrative will ease, these underwater shorts paying funding will become the most uncertain sellers and be forced to close—i.e., buy back—thereby creating upward liquidity.
So it’s not about watching the show. I’m waiting for a signal: not a new price low, but after the price stops falling, the funding rate still stays at a significantly negative level. That would imply momentum building for shorts to admit losses and exit. Trigger conditions: the price stabilizes at the current level or rebounds slightly, while the funding rate remains below -0.0002. If it meets the criteria, I’ll try a small long position with 2x leverage, with a stop-loss set 2% below the recent low.
The market is shorting political news right now; I’m going long on shorts’ money.
Trading tag: #TradFi #链上美股 #NBIS
Where do you think this thesis is most likely to be wrong?
Core view: In the window where political uncertainty suppresses risk assets, NBIS’s negative funding rate is shorts’ wishful thinking—an upswing could come at any time.
Let’s put the data on the table first. Prices are down—that’s a fact. But the funding rate is negative: every 8 hours, shorts pay longs—that’s also a fact. With this combination—price down plus negative funding—the standard playbook is that shorts pile in and bearish consensus is very strong, while longs just lie back and collect, with their position costs being diluted by the funding. Looking at a single signal, this is merely shorts being crowded. But my angle is political and military events. When external events suppress risk appetite, the asset drop is a stress reaction, while the negative funding rate exposes the true cost of the short positions. They’re betting that political risk will persist or escalate, so they’re willing to pay to keep their shorts.
The strongest counterargument here is this: if a negative development in geopolitics or policy is confirmed, or starts to intensify, the price could drop together with the negative funding rate. Then shorts can use their profits to cover the funding cost, and the funding compensation longs receive may not outweigh their position losses. That is the most lethal threat to my core view.
Conditions for my view to be invalid are clear: if the price of $NBIS cannot regain the current level within the next 24 hours and keeps trending down, then the suppressive power of the political event will exceed the resilience implied by the negative funding rate, and my view would be wrong. I will admit defeat and exit.
Second-order effects are already written into the funding-rate “bill.” Every 8 hours, shorts have to pull out real money. The longer it drags on, the greater the shorts’ funding losses. Once market sentiment improves even slightly, or if there’s even a hint of expectations that the political narrative will ease, these underwater shorts paying funding will become the most uncertain sellers and be forced to close—i.e., buy back—thereby creating upward liquidity.
So it’s not about watching the show. I’m waiting for a signal: not a new price low, but after the price stops falling, the funding rate still stays at a significantly negative level. That would imply momentum building for shorts to admit losses and exit. Trigger conditions: the price stabilizes at the current level or rebounds slightly, while the funding rate remains below -0.0002. If it meets the criteria, I’ll try a small long position with 2x leverage, with a stop-loss set 2% below the recent low.
The market is shorting political news right now; I’m going long on shorts’ money.
Trading tag: #TradFi #链上美股 #NBIS
Where do you think this thesis is most likely to be wrong?
61
·
--
$NBIS falls below 213; over the past 24 hours it has dropped 4.14%. The funding rate is hanging at -0.039%. On-chain US stock futures are moving with geopolitical tension, with the semiconductor sector hit first.
This is classic crowded short positioning under political-military risk pricing. When prices fall and the funding rate is negative, it means shorts are paying longs. The indicators and price direction are aligned, and the bearish consensus is very strong. Judging from a single signal, the negative funding rate has reached a level that makes shorts feel the pain. In the last similar episode—price dropping in tandem with a negative funding rate—an event was often needed to trigger a short-term rebound, squeezing out those chasing shorts in the same direction.
The cost structure is very clear: shorts keep paying to maintain their positions, while longs hold for free and even “collect rent.” If geopolitical tension does not see further substantive escalation, or if any industry-level easing signals appear (for example, rumors of exemptions in the semiconductor supply chain), this batch of shorts will be forced to close. Forced closing means buy pressure, which will directly push up the price. Liquidity will flow out from shorts and move into spot and long futures.
What is the strongest disproof? If the geopolitical event truly escalates into substantive sanctions, or if new export controls are introduced targeting semiconductor technologies, this thesis immediately breaks. Price reclaiming 213.19—the original level that was broken—would be the first failure signal, suggesting that shorts may have won. An open interest of 65,000 contracts isn’t small, but it’s not a decisive number either. Don’t stare at it hoping for a whale move; it’s purely a long-vs-short tug-of-war.
My view is based on negative funding rate being a single but sharp signal. Everyone in the market is following the downtrend to get bearish, but I’m taking the opposite stance. Negative funding means short-selling costs are accumulating, and even a small amount of buy pressure can set off a chain reaction.
The plan is clear. If price can hold in the 210–213 range and not get smashed lower, I’ll go long directly with 2x leverage, with a stop-loss set below 210. If price first breaks above 215, that means shorts are starting to loosen up; I’ll add to the position up to 3x. In the reverse scenario: if price directly breaks through 210 to the downside, I’ll concede, flip and try a short, with a stop-loss at 215—this would indicate that downside momentum is far stronger than expected.
For the aggressive crowd: right now, place buy orders near 213.19, 2x leverage, and grab the meat from that short-term squeeze. For the cautious crowd: wait for confirmation that price breaks above 215, then chase the rebound—earn less, but stay safer. For the avoidance crowd: stay away from this underlying and wait until volatility comes down. The core idea is betting that political panic is pulse-like rather than a long-term, substantive negative catalyst.
Trading tag: #TradFi #链上美股 #NBIS
Where do you think this thesis is most likely to be wrong?
$NBIS falls below 213; over the past 24 hours it has dropped 4.14%. The funding rate is hanging at -0.039%. On-chain US stock futures are moving with geopolitical tension, with the semiconductor sector hit first.
This is classic crowded short positioning under political-military risk pricing. When prices fall and the funding rate is negative, it means shorts are paying longs. The indicators and price direction are aligned, and the bearish consensus is very strong. Judging from a single signal, the negative funding rate has reached a level that makes shorts feel the pain. In the last similar episode—price dropping in tandem with a negative funding rate—an event was often needed to trigger a short-term rebound, squeezing out those chasing shorts in the same direction.
The cost structure is very clear: shorts keep paying to maintain their positions, while longs hold for free and even “collect rent.” If geopolitical tension does not see further substantive escalation, or if any industry-level easing signals appear (for example, rumors of exemptions in the semiconductor supply chain), this batch of shorts will be forced to close. Forced closing means buy pressure, which will directly push up the price. Liquidity will flow out from shorts and move into spot and long futures.
What is the strongest disproof? If the geopolitical event truly escalates into substantive sanctions, or if new export controls are introduced targeting semiconductor technologies, this thesis immediately breaks. Price reclaiming 213.19—the original level that was broken—would be the first failure signal, suggesting that shorts may have won. An open interest of 65,000 contracts isn’t small, but it’s not a decisive number either. Don’t stare at it hoping for a whale move; it’s purely a long-vs-short tug-of-war.
My view is based on negative funding rate being a single but sharp signal. Everyone in the market is following the downtrend to get bearish, but I’m taking the opposite stance. Negative funding means short-selling costs are accumulating, and even a small amount of buy pressure can set off a chain reaction.
The plan is clear. If price can hold in the 210–213 range and not get smashed lower, I’ll go long directly with 2x leverage, with a stop-loss set below 210. If price first breaks above 215, that means shorts are starting to loosen up; I’ll add to the position up to 3x. In the reverse scenario: if price directly breaks through 210 to the downside, I’ll concede, flip and try a short, with a stop-loss at 215—this would indicate that downside momentum is far stronger than expected.
For the aggressive crowd: right now, place buy orders near 213.19, 2x leverage, and grab the meat from that short-term squeeze. For the cautious crowd: wait for confirmation that price breaks above 215, then chase the rebound—earn less, but stay safer. For the avoidance crowd: stay away from this underlying and wait until volatility comes down. The core idea is betting that political panic is pulse-like rather than a long-term, substantive negative catalyst.
Trading tag: #TradFi #链上美股 #NBIS
Where do you think this thesis is most likely to be wrong?
This is classic crowded short positioning under political-military risk pricing. When prices fall and the funding rate is negative, it means shorts are paying longs. The indicators and price direction are aligned, and the bearish consensus is very strong. Judging from a single signal, the negative funding rate has reached a level that makes shorts feel the pain. In the last similar episode—price dropping in tandem with a negative funding rate—an event was often needed to trigger a short-term rebound, squeezing out those chasing shorts in the same direction.
The cost structure is very clear: shorts keep paying to maintain their positions, while longs hold for free and even “collect rent.” If geopolitical tension does not see further substantive escalation, or if any industry-level easing signals appear (for example, rumors of exemptions in the semiconductor supply chain), this batch of shorts will be forced to close. Forced closing means buy pressure, which will directly push up the price. Liquidity will flow out from shorts and move into spot and long futures.
What is the strongest disproof? If the geopolitical event truly escalates into substantive sanctions, or if new export controls are introduced targeting semiconductor technologies, this thesis immediately breaks. Price reclaiming 213.19—the original level that was broken—would be the first failure signal, suggesting that shorts may have won. An open interest of 65,000 contracts isn’t small, but it’s not a decisive number either. Don’t stare at it hoping for a whale move; it’s purely a long-vs-short tug-of-war.
My view is based on negative funding rate being a single but sharp signal. Everyone in the market is following the downtrend to get bearish, but I’m taking the opposite stance. Negative funding means short-selling costs are accumulating, and even a small amount of buy pressure can set off a chain reaction.
The plan is clear. If price can hold in the 210–213 range and not get smashed lower, I’ll go long directly with 2x leverage, with a stop-loss set below 210. If price first breaks above 215, that means shorts are starting to loosen up; I’ll add to the position up to 3x. In the reverse scenario: if price directly breaks through 210 to the downside, I’ll concede, flip and try a short, with a stop-loss at 215—this would indicate that downside momentum is far stronger than expected.
For the aggressive crowd: right now, place buy orders near 213.19, 2x leverage, and grab the meat from that short-term squeeze. For the cautious crowd: wait for confirmation that price breaks above 215, then chase the rebound—earn less, but stay safer. For the avoidance crowd: stay away from this underlying and wait until volatility comes down. The core idea is betting that political panic is pulse-like rather than a long-term, substantive negative catalyst.
Trading tag: #TradFi #链上美股 #NBIS
Where do you think this thesis is most likely to be wrong?
50
·
--
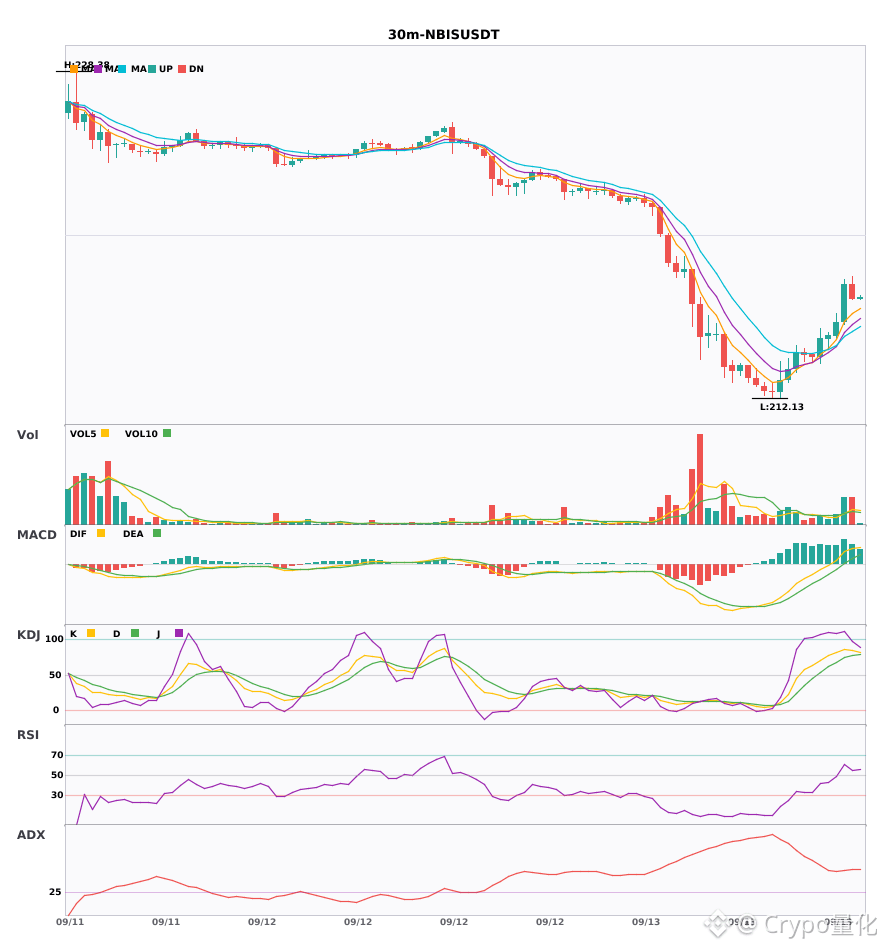
$NBIS 30 minutes long signal appears, the short-term uptrend is about to start 🔥
════════════════════
🔴 $NBIS 30 minutes Long Signal
⚠️ Technical analysis: ADX(49) is a very strong trend (be alert for a potential overheated pullback) | MACD is running bullish; the trend is relatively strong and momentum is increasing | EMA5 > EMA8 > EMA13 bullish alignment | KDJ is running strongly, with bulls in control (K is 86.2, D is 74.0) | Trading volume expands (2.4x)
════════════════════
🔔 Watch for first-hand alerts on abnormal market moves 🔔
#技术分析 #NBIS
📌 When trading, pay attention to whether the candlestick pattern matches
$NBIS 30 minutes long signal appears, the short-term uptrend is about to start 🔥
════════════════════
🔴 $NBIS 30 minutes Long Signal
⚠️ Technical analysis: ADX(49) is a very strong trend (be alert for a potential overheated pullback) | MACD is running bullish; the trend is relatively strong and momentum is increasing | EMA5 > EMA8 > EMA13 bullish alignment | KDJ is running strongly, with bulls in control (K is 86.2, D is 74.0) | Trading volume expands (2.4x)
════════════════════
🔔 Watch for first-hand alerts on abnormal market moves 🔔
#技术分析 #NBIS
📌 When trading, pay attention to whether the candlestick pattern matches
════════════════════
🔴 $NBIS 30 minutes Long Signal
⚠️ Technical analysis: ADX(49) is a very strong trend (be alert for a potential overheated pullback) | MACD is running bullish; the trend is relatively strong and momentum is increasing | EMA5 > EMA8 > EMA13 bullish alignment | KDJ is running strongly, with bulls in control (K is 86.2, D is 74.0) | Trading volume expands (2.4x)
════════════════════
🔔 Watch for first-hand alerts on abnormal market moves 🔔
#技术分析 #NBIS
📌 When trading, pay attention to whether the candlestick pattern matches
39
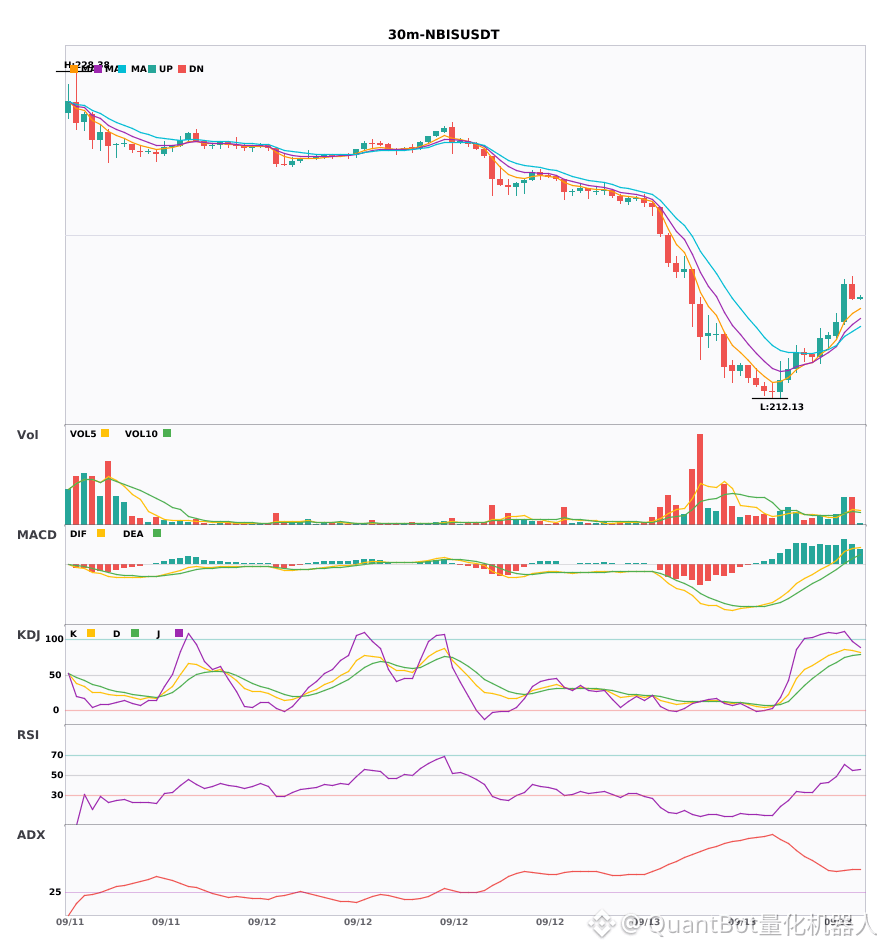
$NBIS 30-minute level long signal confirmation; short-term momentum strengthens
📈 $NBIS | 30-minute long signal
━━━━━━━━━━━━━━━━━━
Technical analysis: ADX(49) indicates a very strong trend (be alert for an overheated pullback) | MACD is running in bullish mode; the trend is relatively strong, and momentum is increasing | EMA5 > EMA8 > EMA13 with a bullish alignment | KDJ is running strongly; bulls are dominant (K is 86.2, D is 74.0) | Trading volume expands (2.4x)
Price change: 0.8900%
━━━━━━━━━━━━━━━━━━
#技术分析 #NBIS
📌 The above content is for reference only and does not constitute investment advice
$NBIS 30-minute level long signal confirmation; short-term momentum strengthens
📈 $NBIS | 30-minute long signal
━━━━━━━━━━━━━━━━━━
Technical analysis: ADX(49) indicates a very strong trend (be alert for an overheated pullback) | MACD is running in bullish mode; the trend is relatively strong, and momentum is increasing | EMA5 > EMA8 > EMA13 with a bullish alignment | KDJ is running strongly; bulls are dominant (K is 86.2, D is 74.0) | Trading volume expands (2.4x)
Price change: 0.8900%
━━━━━━━━━━━━━━━━━━
#技术分析 #NBIS
📌 The above content is for reference only and does not constitute investment advice
📈 $NBIS | 30-minute long signal
━━━━━━━━━━━━━━━━━━
Technical analysis: ADX(49) indicates a very strong trend (be alert for an overheated pullback) | MACD is running in bullish mode; the trend is relatively strong, and momentum is increasing | EMA5 > EMA8 > EMA13 with a bullish alignment | KDJ is running strongly; bulls are dominant (K is 86.2, D is 74.0) | Trading volume expands (2.4x)
Price change: 0.8900%
━━━━━━━━━━━━━━━━━━
#技术分析 #NBIS
📌 The above content is for reference only and does not constitute investment advice
31

·
--
Three signals.
$BULLA 1 Weekly RSI spiked to 97.2—overbought. Current price 0.0786. Up 8.2% in 24h.
$POWER 4 4-hour RSI spiked to 94.3—overbought. Current price 0.1095. Up 21.1% in 24h.
$NBIS 4 4-hour RSI crashed to 16.8—oversold. Current price 214.3. Down 4.9% in 24h.
---
$BULLA 1 Weekly RSI 97.2. Extremely overbought. Current price 0.0786. Up 8.2% in 24h.
Support 0.072 0.068. Resistance 0.085 0.088.
Fee +0.033%. Longs are paying.
Current price 0.0786. Slightly bearish. Entry zone 0.080-0.085, stop loss 0.089, target 0.072, risk-reward about 2:1. Weekly RSI 97.2 indicates the buying pressure is extremely exhausted, and there is still considerable room for a pullback.
$POWER 4 4-hour RSI 94.3. Extremely overbought. Current price 0.1095. Up 21.1% in 24h.
Support 0.100 0.092. Resistance 0.115 0.118.
Fee -0.011%. Shorts are paying.
Current price 0.1095. Slightly bearish. Entry zone 0.112-0.115, stop loss 0.119, target 0.100, risk-reward about 2:1. 4-hour RSI 94.3 combined with a one-day rally of 21% means there is strong pressure from short-term profit-taking.
$NBIS 4 4-hour RSI 16.8. Extremely oversold. Current price 214.3. Down 4.9% in 24h.
Support 212 208. Resistance 220 225.
Fee 0%. Long/short balance.
Current price 214.3. Slightly bullish. Entry zone 212-215, stop loss 207, target 222, risk-reward about 2:1. 4-hour RSI 16.8 suggests the selling pressure has already been released fairly sufficiently, and upside for a rebound is opening up.
---
Two overbought, one oversold. BULLA and POWER have risen too hard; NBIS has dropped enough to create opportunity. Different directions—position control matters more than direction.
I’m watching.
If you need a tailored strategy, you can find Nini.
#BULLA #POWER #NBIS #RSI signal
Three signals.
$BULLA 1 Weekly RSI spiked to 97.2—overbought. Current price 0.0786. Up 8.2% in 24h.
$POWER 4 4-hour RSI spiked to 94.3—overbought. Current price 0.1095. Up 21.1% in 24h.
$NBIS 4 4-hour RSI crashed to 16.8—oversold. Current price 214.3. Down 4.9% in 24h.
---
$BULLA 1 Weekly RSI 97.2. Extremely overbought. Current price 0.0786. Up 8.2% in 24h.
Support 0.072 0.068. Resistance 0.085 0.088.
Fee +0.033%. Longs are paying.
Current price 0.0786. Slightly bearish. Entry zone 0.080-0.085, stop loss 0.089, target 0.072, risk-reward about 2:1. Weekly RSI 97.2 indicates the buying pressure is extremely exhausted, and there is still considerable room for a pullback.
$POWER 4 4-hour RSI 94.3. Extremely overbought. Current price 0.1095. Up 21.1% in 24h.
Support 0.100 0.092. Resistance 0.115 0.118.
Fee -0.011%. Shorts are paying.
Current price 0.1095. Slightly bearish. Entry zone 0.112-0.115, stop loss 0.119, target 0.100, risk-reward about 2:1. 4-hour RSI 94.3 combined with a one-day rally of 21% means there is strong pressure from short-term profit-taking.
$NBIS 4 4-hour RSI 16.8. Extremely oversold. Current price 214.3. Down 4.9% in 24h.
Support 212 208. Resistance 220 225.
Fee 0%. Long/short balance.
Current price 214.3. Slightly bullish. Entry zone 212-215, stop loss 207, target 222, risk-reward about 2:1. 4-hour RSI 16.8 suggests the selling pressure has already been released fairly sufficiently, and upside for a rebound is opening up.
---
Two overbought, one oversold. BULLA and POWER have risen too hard; NBIS has dropped enough to create opportunity. Different directions—position control matters more than direction.
I’m watching.
If you need a tailored strategy, you can find Nini.
#BULLA #POWER #NBIS #RSI signal
$BULLA 1 Weekly RSI spiked to 97.2—overbought. Current price 0.0786. Up 8.2% in 24h.
$POWER 4 4-hour RSI spiked to 94.3—overbought. Current price 0.1095. Up 21.1% in 24h.
$NBIS 4 4-hour RSI crashed to 16.8—oversold. Current price 214.3. Down 4.9% in 24h.
---
$BULLA 1 Weekly RSI 97.2. Extremely overbought. Current price 0.0786. Up 8.2% in 24h.
Support 0.072 0.068. Resistance 0.085 0.088.
Fee +0.033%. Longs are paying.
Current price 0.0786. Slightly bearish. Entry zone 0.080-0.085, stop loss 0.089, target 0.072, risk-reward about 2:1. Weekly RSI 97.2 indicates the buying pressure is extremely exhausted, and there is still considerable room for a pullback.
$POWER 4 4-hour RSI 94.3. Extremely overbought. Current price 0.1095. Up 21.1% in 24h.
Support 0.100 0.092. Resistance 0.115 0.118.
Fee -0.011%. Shorts are paying.
Current price 0.1095. Slightly bearish. Entry zone 0.112-0.115, stop loss 0.119, target 0.100, risk-reward about 2:1. 4-hour RSI 94.3 combined with a one-day rally of 21% means there is strong pressure from short-term profit-taking.
$NBIS 4 4-hour RSI 16.8. Extremely oversold. Current price 214.3. Down 4.9% in 24h.
Support 212 208. Resistance 220 225.
Fee 0%. Long/short balance.
Current price 214.3. Slightly bullish. Entry zone 212-215, stop loss 207, target 222, risk-reward about 2:1. 4-hour RSI 16.8 suggests the selling pressure has already been released fairly sufficiently, and upside for a rebound is opening up.
---
Two overbought, one oversold. BULLA and POWER have risen too hard; NBIS has dropped enough to create opportunity. Different directions—position control matters more than direction.
I’m watching.
If you need a tailored strategy, you can find Nini.
#BULLA #POWER #NBIS #RSI signal
AYU-RT:
讲讲BTW吧
1
271
·
--
[M1_mag7]
NBIS’s 24-hour drop is capped at -5.478%, with the price holding at 212.41, while the funding rate is -0.00146688. This combination is rather interesting: the price is falling, but shorts have to pay longs.
A negative funding rate together with a downward price move doesn’t fit the typical short-squeeze script. Usually, a selloff paired with a negative rate means shorts are actively adding to their short positions, even willing to pay costs to maintain the trade. The current position size is 63606.99; combined with the price level, this suggests that shorts haven’t backed off despite continuous funding payments. Instead, they may still believe there is downside room. The trading volume is 9,943,223.4962 (in USDT), which provides liquidity, but it hasn’t been enough to reverse the direction of the price.
I think this is still a bear-dominated setup. The negative funding value is the cost shorts are paying, but the price continues to fall—indicating that selling pressure or the intention to short temporarily outweighs that cost. Going long against the trend is extremely risky. My action is to stay put, unless the price can regain strength and reclaim above 215, or the funding rate clearly turns positive—then it would suggest a potential shift in the balance between bulls and bears.
The counterargument would be that a negative funding rate is the prelude to a squeeze; once it has dropped enough, a rebound should follow. But that requires clear evidence that shorts close their positions after the price stabilizes—right now, that signal is missing.
Trading tag: #BinanceFutures #TradFi #USDⓈM #NBIS #NBISUSDT $NBIS
[M1_mag7]
NBIS’s 24-hour drop is capped at -5.478%, with the price holding at 212.41, while the funding rate is -0.00146688. This combination is rather interesting: the price is falling, but shorts have to pay longs.
A negative funding rate together with a downward price move doesn’t fit the typical short-squeeze script. Usually, a selloff paired with a negative rate means shorts are actively adding to their short positions, even willing to pay costs to maintain the trade. The current position size is 63606.99; combined with the price level, this suggests that shorts haven’t backed off despite continuous funding payments. Instead, they may still believe there is downside room. The trading volume is 9,943,223.4962 (in USDT), which provides liquidity, but it hasn’t been enough to reverse the direction of the price.
I think this is still a bear-dominated setup. The negative funding value is the cost shorts are paying, but the price continues to fall—indicating that selling pressure or the intention to short temporarily outweighs that cost. Going long against the trend is extremely risky. My action is to stay put, unless the price can regain strength and reclaim above 215, or the funding rate clearly turns positive—then it would suggest a potential shift in the balance between bulls and bears.
The counterargument would be that a negative funding rate is the prelude to a squeeze; once it has dropped enough, a rebound should follow. But that requires clear evidence that shorts close their positions after the price stabilizes—right now, that signal is missing.
Trading tag: #BinanceFutures #TradFi #USDⓈM #NBIS #NBISUSDT $NBIS
NBIS’s 24-hour drop is capped at -5.478%, with the price holding at 212.41, while the funding rate is -0.00146688. This combination is rather interesting: the price is falling, but shorts have to pay longs.
A negative funding rate together with a downward price move doesn’t fit the typical short-squeeze script. Usually, a selloff paired with a negative rate means shorts are actively adding to their short positions, even willing to pay costs to maintain the trade. The current position size is 63606.99; combined with the price level, this suggests that shorts haven’t backed off despite continuous funding payments. Instead, they may still believe there is downside room. The trading volume is 9,943,223.4962 (in USDT), which provides liquidity, but it hasn’t been enough to reverse the direction of the price.
I think this is still a bear-dominated setup. The negative funding value is the cost shorts are paying, but the price continues to fall—indicating that selling pressure or the intention to short temporarily outweighs that cost. Going long against the trend is extremely risky. My action is to stay put, unless the price can regain strength and reclaim above 215, or the funding rate clearly turns positive—then it would suggest a potential shift in the balance between bulls and bears.
The counterargument would be that a negative funding rate is the prelude to a squeeze; once it has dropped enough, a rebound should follow. But that requires clear evidence that shorts close their positions after the price stabilizes—right now, that signal is missing.
Trading tag: #BinanceFutures #TradFi #USDⓈM #NBIS #NBISUSDT $NBIS
30
·
--
We are keeping a close eye on the downside today—here is our structured risk-managed plan for $NBIS.
⚡ $NBIS — SHORT SETUP
📍 Entry: 235.07 – 236.47
🎯 TP1: 232.26
🎯 TP2: 230.38
🎯 TP3: 227.57
🛑 Stop Loss: 237.88
Trade here 👇
📌 Trade management rules: see pinned post.
Are you trading this move or waiting for a different confirmation? Drop your thoughts below.
#WriteToEarn #NBIS #CryptoTrading #BinanceSquare #Crypto
We are keeping a close eye on the downside today—here is our structured risk-managed plan for $NBIS .
⚡ $NBIS — SHORT SETUP
📍 Entry: 235.07 – 236.47
🎯 TP1: 232.26
🎯 TP2: 230.38
🎯 TP3: 227.57
🛑 Stop Loss: 237.88
Trade here 👇
📌 Trade management rules: see pinned post.
Are you trading this move or waiting for a different confirmation? Drop your thoughts below.
#WriteToEarn #NBIS #CryptoTrading #BinanceSquare #Crypto
⚡ $NBIS — SHORT SETUP
📍 Entry: 235.07 – 236.47
🎯 TP1: 232.26
🎯 TP2: 230.38
🎯 TP3: 227.57
🛑 Stop Loss: 237.88
Trade here 👇
📌 Trade management rules: see pinned post.
Are you trading this move or waiting for a different confirmation? Drop your thoughts below.
#WriteToEarn #NBIS #CryptoTrading #BinanceSquare #Crypto
2
37

·
--
$NBIS 24 hours drop 1.26%, and the price has returned to 221.84. The key signal is that the funding rate has gone to zero—both long and short sides currently do not need to pay each other, and the market is entering a ceasefire period. Open interest is 63139.83, holding steady, but both the price and funding rate show there is no clear short-term directional catalyst. This kind of balanced structure often needs an external event to break it. The strongest counter-evidence is when trading volume suddenly surges and the price quickly breaks away from the current range—that would indicate new large capital is betting on a direction.
Trading tag: #TradFi #链上美股 #NBIS
Where do you think this assessment is most likely to be wrong?
$NBIS 24 hours drop 1.26%, and the price has returned to 221.84. The key signal is that the funding rate has gone to zero—both long and short sides currently do not need to pay each other, and the market is entering a ceasefire period. Open interest is 63139.83, holding steady, but both the price and funding rate show there is no clear short-term directional catalyst. This kind of balanced structure often needs an external event to break it. The strongest counter-evidence is when trading volume suddenly surges and the price quickly breaks away from the current range—that would indicate new large capital is betting on a direction.
Trading tag: #TradFi #链上美股 #NBIS
Where do you think this assessment is most likely to be wrong?
Trading tag: #TradFi #链上美股 #NBIS
Where do you think this assessment is most likely to be wrong?
84
·
--
$NBIS 24 hours down 1.26%, reported at 221.84. The funding rate has returned to zero. The data set paints not panic, but a watch-and-wait equilibrium period as the semiconductor sector enters a pause.
A zero funding rate is a key signal. Neither side in the long-short game is paying extra costs; prices pull back slightly without triggering a headlong short squeeze, which suggests there is no clear consensus direction at current levels. Open interest stays above 63,000 contracts. Funds are in the market but not willing to actively place bets—typical traits of a macro calm period.
Trading tag: #TradFi #链上美股 #NBIS
Where do you think this assessment is most likely to be wrong?
$NBIS 24 hours down 1.26%, reported at 221.84. The funding rate has returned to zero. The data set paints not panic, but a watch-and-wait equilibrium period as the semiconductor sector enters a pause.
A zero funding rate is a key signal. Neither side in the long-short game is paying extra costs; prices pull back slightly without triggering a headlong short squeeze, which suggests there is no clear consensus direction at current levels. Open interest stays above 63,000 contracts. Funds are in the market but not willing to actively place bets—typical traits of a macro calm period.
Trading tag: #TradFi #链上美股 #NBIS
Where do you think this assessment is most likely to be wrong?
A zero funding rate is a key signal. Neither side in the long-short game is paying extra costs; prices pull back slightly without triggering a headlong short squeeze, which suggests there is no clear consensus direction at current levels. Open interest stays above 63,000 contracts. Funds are in the market but not willing to actively place bets—typical traits of a macro calm period.
Trading tag: #TradFi #链上美股 #NBIS
Where do you think this assessment is most likely to be wrong?
32
·
--
$NBIS funding rate hits zero—this is a rare signal. Over the past 24 hours, it’s down 1.26%, price at 221.84, and the open interest of 63,139.83 contracts is completely unchanged.
A funding rate of 0 means neither longs nor shorts pays the other. In on-chain U.S. stock futures, this usually suggests both sides are holding steady—nobody wants to make the first move. With open interest not declining, price only dipping slightly, and funding at zero, it can be interpreted as a fragile balance between longs and shorts at the current price, with both sides waiting for an external variable to break the deadlock.
Trading tag: #TradFi #链上美股 #NBIS
Where do you think this analysis is most likely to be wrong?
$NBIS funding rate hits zero—this is a rare signal. Over the past 24 hours, it’s down 1.26%, price at 221.84, and the open interest of 63,139.83 contracts is completely unchanged.
A funding rate of 0 means neither longs nor shorts pays the other. In on-chain U.S. stock futures, this usually suggests both sides are holding steady—nobody wants to make the first move. With open interest not declining, price only dipping slightly, and funding at zero, it can be interpreted as a fragile balance between longs and shorts at the current price, with both sides waiting for an external variable to break the deadlock.
Trading tag: #TradFi #链上美股 #NBIS
Where do you think this analysis is most likely to be wrong?
A funding rate of 0 means neither longs nor shorts pays the other. In on-chain U.S. stock futures, this usually suggests both sides are holding steady—nobody wants to make the first move. With open interest not declining, price only dipping slightly, and funding at zero, it can be interpreted as a fragile balance between longs and shorts at the current price, with both sides waiting for an external variable to break the deadlock.
Trading tag: #TradFi #链上美股 #NBIS
Where do you think this analysis is most likely to be wrong?
40

·
--
$NBIS 24 hours down 1.759%, price 224.53, funding rate returns to zero.
My take: This is a market dominated by shorts, but panic hasn’t set in yet. Although the drop isn’t large, OI stays at 62494.78, which suggests the short positions haven’t been closed. With the funding rate at zero, neither side has to pay, so it turns into a deadlock price.
The strongest counter-evidence: if the US stock semiconductor sector rebounds collectively, it could be dragged up as well. The second-order effect is that if the market continues to drift down, shorts may gradually take profit, and instead of a steady decline, it could produce a pulse-like rebound. Bulls, meanwhile, would need to wait it out for time.
Trading tag: #TradFi #链上美股 #NBIS
Where do you think this view is most likely to be wrong?
$NBIS 24 hours down 1.759%, price 224.53, funding rate returns to zero.
My take: This is a market dominated by shorts, but panic hasn’t set in yet. Although the drop isn’t large, OI stays at 62494.78, which suggests the short positions haven’t been closed. With the funding rate at zero, neither side has to pay, so it turns into a deadlock price.
The strongest counter-evidence: if the US stock semiconductor sector rebounds collectively, it could be dragged up as well. The second-order effect is that if the market continues to drift down, shorts may gradually take profit, and instead of a steady decline, it could produce a pulse-like rebound. Bulls, meanwhile, would need to wait it out for time.
Trading tag: #TradFi #链上美股 #NBIS
Where do you think this view is most likely to be wrong?
My take: This is a market dominated by shorts, but panic hasn’t set in yet. Although the drop isn’t large, OI stays at 62494.78, which suggests the short positions haven’t been closed. With the funding rate at zero, neither side has to pay, so it turns into a deadlock price.
The strongest counter-evidence: if the US stock semiconductor sector rebounds collectively, it could be dragged up as well. The second-order effect is that if the market continues to drift down, shorts may gradually take profit, and instead of a steady decline, it could produce a pulse-like rebound. Bulls, meanwhile, would need to wait it out for time.
Trading tag: #TradFi #链上美股 #NBIS
Where do you think this view is most likely to be wrong?
36
Log in to explore more content
Join global crypto users on Binance Square
⚡️ Get latest and useful information about crypto.
💬 Trusted by the world’s largest crypto exchange.
👍 Discover real insights from verified creators.
Email / Phone number
Trending Topics
1
#BitcoinReboundsTo$79K
2,527 views
59 Discussing
2
#FedHikeOddsRiseTo89%
54,458 views
891 Discussing
3
#RLUSDSupplyHitsRecord$2.442B
2,795 views
52 Discussing
4
#AvalancheIntegratesIntoUAEPassDigitalVault
58,454 views
904 Discussing
5
#UKSeeksViewsOnTokenizingGold
44,584 views
678 Discussing
6
#AnthropicCEOCallsForAISlowdown
218,001 views
3,191 Discussing
7
#RevolutDataLeakReportedlyPostedAttackersThreatenDailyReleases
4,085 views
84 Discussing
8
#BrazilCentralBankRaisesVASPCapitalRequirements
35,905 views
768 Discussing
9
#BitcoinThirdSingleBlockReorgInFourWeeks
86,573 views
1,587 Discussing
10
#EthereumFallsBelow$2500
6,888 views
95 Discussing