

#bitcoinetf
bitcoinetf
1.9M views
4,678 Discussing
Hot
Latest

🚨 BITCOIN OCTOBER UPDATE 📈
October has started with some interesting signals for crypto.
🟢 BTC ETFs are back in positive territory
After around $148.7M in outflows, Bitcoin ETFs recorded about $102.7M in inflows on October 1.
🟢 Bitcoin is showing strength
BTC moved back above the $86K area, giving the market some renewed optimism.
🟡 But the market is still mixed
Solana ETFs recorded a small outflow of around $1.1M on the same day.
🔍 What matters now?
The important thing is whether Bitcoin can maintain this momentum and whether ETF inflows continue.
One good day doesn't confirm a new bull run—but it's definitely something worth watching. 👀
What are you watching this October: BTC price, ETF flows, or the Fed?
#BinanceSquare #Bitcoin #BTC#Crypto #BitcoinETF #Solana #SOL #CryptoNews
🚨 BITCOIN OCTOBER UPDATE 📈
October has started with some interesting signals for crypto.
🟢 BTC ETFs are back in positive territory
After around $148.7M in outflows, Bitcoin ETFs recorded about $102.7M in inflows on October 1.
🟢 Bitcoin is showing strength
BTC moved back above the $86K area, giving the market some renewed optimism.
🟡 But the market is still mixed
Solana ETFs recorded a small outflow of around $1.1M on the same day.
🔍 What matters now?
The important thing is whether Bitcoin can maintain this momentum and whether ETF inflows continue.
One good day doesn't confirm a new bull run—but it's definitely something worth watching. 👀
What are you watching this October: BTC price, ETF flows, or the Fed?
#BinanceSquare #Bitcoin #BTC#Crypto #BitcoinETF #Solana #SOL #CryptoNews
October has started with some interesting signals for crypto.
🟢 BTC ETFs are back in positive territory
After around $148.7M in outflows, Bitcoin ETFs recorded about $102.7M in inflows on October 1.
🟢 Bitcoin is showing strength
BTC moved back above the $86K area, giving the market some renewed optimism.
🟡 But the market is still mixed
Solana ETFs recorded a small outflow of around $1.1M on the same day.
🔍 What matters now?
The important thing is whether Bitcoin can maintain this momentum and whether ETF inflows continue.
One good day doesn't confirm a new bull run—but it's definitely something worth watching. 👀
What are you watching this October: BTC price, ETF flows, or the Fed?
#BinanceSquare #Bitcoin #BTC#Crypto #BitcoinETF #Solana #SOL #CryptoNews
40

Bitcoin ETFs have returned to net inflows with $103 million to start October. Contrastingly, Ether funds are seeing continued weakness with three straight days of outflows.
#BitcoinETF #EtherOutflows
Bitcoin ETFs have returned to net inflows with $103 million to start October. Contrastingly, Ether funds are seeing continued weakness with three straight days of outflows.
#BitcoinETF #EtherOutflows
#BitcoinETF #EtherOutflows
23

·
--
🚀 Bitcoin ETF Inflows Are Back — Is BTC Entering a New Phase?
Bitcoin is once again attracting strong attention from institutional investors. Recent data shows significant inflows into U.S. spot Bitcoin ETFs, while BTC has moved above the $85K level. 📈
At the same time, Ethereum is also seeing renewed institutional interest, keeping the overall crypto market in focus.
The big question is:
👉 Are ETF inflows becoming a major driver of the next crypto market move?
Crypto markets remain highly volatile, so don’t trade based on hype alone. Always do your own research and manage your risk carefully.
What do you think — are institutional investors becoming more bullish on crypto? 👀👇
#Bitcoin #ETH #BitcoinETF #Binance #CryptoNews
🚀 Bitcoin ETF Inflows Are Back — Is BTC Entering a New Phase?
Bitcoin is once again attracting strong attention from institutional investors. Recent data shows significant inflows into U.S. spot Bitcoin ETFs, while BTC has moved above the $85K level. 📈
At the same time, Ethereum is also seeing renewed institutional interest, keeping the overall crypto market in focus.
The big question is:
👉 Are ETF inflows becoming a major driver of the next crypto market move?
Crypto markets remain highly volatile, so don’t trade based on hype alone. Always do your own research and manage your risk carefully.
What do you think — are institutional investors becoming more bullish on crypto? 👀👇
#Bitcoin #ETH #BitcoinETF #Binance #CryptoNews
Bitcoin is once again attracting strong attention from institutional investors. Recent data shows significant inflows into U.S. spot Bitcoin ETFs, while BTC has moved above the $85K level. 📈
At the same time, Ethereum is also seeing renewed institutional interest, keeping the overall crypto market in focus.
The big question is:
👉 Are ETF inflows becoming a major driver of the next crypto market move?
Crypto markets remain highly volatile, so don’t trade based on hype alone. Always do your own research and manage your risk carefully.
What do you think — are institutional investors becoming more bullish on crypto? 👀👇
#Bitcoin #ETH #BitcoinETF #Binance #CryptoNews

89
Spot Bitcoin ETFs saw massive $2.65 billion net inflows throughout September, marking the second largest monthly influx ever. This signals sustained institutional interest despite price volatility.
#BitcoinETF #InstitutionalAdoption
Spot Bitcoin ETFs saw massive $2.65 billion net inflows throughout September, marking the second largest monthly influx ever. This signals sustained institutional interest despite price volatility.
#BitcoinETF #InstitutionalAdoption
#BitcoinETF #InstitutionalAdoption
29

·
--
Bullish
BITCOIN'S HIDDEN BATTLE ISN'T JUST ABOUT PRICE 👀
Most people are watching the BTC chart.
But there's a bigger battle happening underneath:
💰 Capital flowing into Bitcoin ETFs
vs.
🏦 Capital attracted by high Treasury yields
U.S. spot Bitcoin ETFs attracted roughly $6.34B in Q3 2026.
Then, after a 9-day inflow streak worth around $3.1B, the latest session saw about $148.7M in net outflows.
That doesn't automatically mean the trend has reversed.
It shows something more important:
Institutional flows can change quickly.
Meanwhile, the U.S. 10-Year Treasury yield has been around 5.3%, giving investors another place to put capital.
So I'm watching 3 things:
ETF FLOWS + TREASURY YIELDS + LIQUIDITY
Because they can tell a deeper story than one green candle.
👀 THE BIG QUESTION FOR Q4:
Will institutional money keep flowing into Bitcoin strongly enough to compete with attractive traditional yields?
Nobody knows yet.
But that's the battle worth watching.
The next Bitcoin move may be less about hype...
and more about where global capital chooses to sit.
$BTC
{spot}(BTCUSDT)
$ETH
{spot}(ETHUSDT)
$BNB
{spot}(BNBUSDT)
#Bitcoin #BitcoinETF #Crypto #Macro #TreasuryYields #CryptoNews
BITCOIN'S HIDDEN BATTLE ISN'T JUST ABOUT PRICE 👀
Most people are watching the BTC chart.
But there's a bigger battle happening underneath:
💰 Capital flowing into Bitcoin ETFs
vs.
🏦 Capital attracted by high Treasury yields
U.S. spot Bitcoin ETFs attracted roughly $6.34B in Q3 2026.
Then, after a 9-day inflow streak worth around $3.1B, the latest session saw about $148.7M in net outflows.
That doesn't automatically mean the trend has reversed.
It shows something more important:
Institutional flows can change quickly.
Meanwhile, the U.S. 10-Year Treasury yield has been around 5.3%, giving investors another place to put capital.
So I'm watching 3 things:
ETF FLOWS + TREASURY YIELDS + LIQUIDITY
Because they can tell a deeper story than one green candle.
👀 THE BIG QUESTION FOR Q4:
Will institutional money keep flowing into Bitcoin strongly enough to compete with attractive traditional yields?
Nobody knows yet.
But that's the battle worth watching.
The next Bitcoin move may be less about hype...
and more about where global capital chooses to sit.
$BTC
$ETH
$BNB
#Bitcoin #BitcoinETF #Crypto #Macro #TreasuryYields #CryptoNews
Most people are watching the BTC chart.
But there's a bigger battle happening underneath:
💰 Capital flowing into Bitcoin ETFs
vs.
🏦 Capital attracted by high Treasury yields
U.S. spot Bitcoin ETFs attracted roughly $6.34B in Q3 2026.
Then, after a 9-day inflow streak worth around $3.1B, the latest session saw about $148.7M in net outflows.
That doesn't automatically mean the trend has reversed.
It shows something more important:
Institutional flows can change quickly.
Meanwhile, the U.S. 10-Year Treasury yield has been around 5.3%, giving investors another place to put capital.
So I'm watching 3 things:
ETF FLOWS + TREASURY YIELDS + LIQUIDITY
Because they can tell a deeper story than one green candle.
👀 THE BIG QUESTION FOR Q4:
Will institutional money keep flowing into Bitcoin strongly enough to compete with attractive traditional yields?
Nobody knows yet.
But that's the battle worth watching.
The next Bitcoin move may be less about hype...
and more about where global capital chooses to sit.
$BTC
$ETH
$BNB
#Bitcoin #BitcoinETF #Crypto #Macro #TreasuryYields #CryptoNews

2
117
ETF Inflow Momentum Hits a Wall
Bitcoin ETF inflows snapped after a nine day streak with $149 million exiting the funds. Ethereum ETFs also felt the heat with nearly $60 million in net outflows.
#BitcoinETF #EthereumETF
ETF Inflow Momentum Hits a Wall
Bitcoin ETF inflows snapped after a nine day streak with $149 million exiting the funds. Ethereum ETFs also felt the heat with nearly $60 million in net outflows.
#BitcoinETF #EthereumETF
Bitcoin ETF inflows snapped after a nine day streak with $149 million exiting the funds. Ethereum ETFs also felt the heat with nearly $60 million in net outflows.
#BitcoinETF #EthereumETF

8

$BTC ETF Flows: One Red Day After a Strong Run
Spot BTC ETFs recorded a net outflow of -$148.7M (about 1.78 K BTC) on Sep 30, with FBTC leading the redemptions. This follows roughly $2.3B of net inflows between Sep 21 and Sep 30.
📉 BTC held near $83.6K through the outflow. Price absorbing selling pressure is worth noting, but one session is not a confirmed shift in demand.
Two scenarios to map:
Month-end rebalancing: institutional managers adjust positions on the last trading day, and flows often normalize in the first sessions of the new month.
Genuine cooling: outflows continue into early October and the inflow streak loses momentum.
Oct 1 flow data is the first real read. Until then, flows are a context signal, not a trade trigger. Backtest your plan against both scenarios before sizing up.
verify first. risk later. scale slowly...
#Bitcoin #BitcoinETF #CryptoGates
$BTC ETF Flows: One Red Day After a Strong Run
Spot BTC ETFs recorded a net outflow of -$148.7M (about 1.78 K BTC) on Sep 30, with FBTC leading the redemptions. This follows roughly $2.3B of net inflows between Sep 21 and Sep 30.
📉 BTC held near $83.6K through the outflow. Price absorbing selling pressure is worth noting, but one session is not a confirmed shift in demand.
Two scenarios to map:
Month-end rebalancing: institutional managers adjust positions on the last trading day, and flows often normalize in the first sessions of the new month.
Genuine cooling: outflows continue into early October and the inflow streak loses momentum.
Oct 1 flow data is the first real read. Until then, flows are a context signal, not a trade trigger. Backtest your plan against both scenarios before sizing up.
verify first. risk later. scale slowly...
#Bitcoin #BitcoinETF #CryptoGates
Spot BTC ETFs recorded a net outflow of -$148.7M (about 1.78 K BTC) on Sep 30, with FBTC leading the redemptions. This follows roughly $2.3B of net inflows between Sep 21 and Sep 30.
📉 BTC held near $83.6K through the outflow. Price absorbing selling pressure is worth noting, but one session is not a confirmed shift in demand.
Two scenarios to map:
Month-end rebalancing: institutional managers adjust positions on the last trading day, and flows often normalize in the first sessions of the new month.
Genuine cooling: outflows continue into early October and the inflow streak loses momentum.
Oct 1 flow data is the first real read. Until then, flows are a context signal, not a trade trigger. Backtest your plan against both scenarios before sizing up.
verify first. risk later. scale slowly...
#Bitcoin #BitcoinETF #CryptoGates
58
The ETF engine is firing again.
Bitcoin ETFs just matched their August momentum by securing a nine day straight winning streak, adding $66 million on Tuesday alone.
#BitcoinETF #InstitutionalDemand
The ETF engine is firing again.
Bitcoin ETFs just matched their August momentum by securing a nine day straight winning streak, adding $66 million on Tuesday alone.
#BitcoinETF #InstitutionalDemand
Bitcoin ETFs just matched their August momentum by securing a nine day straight winning streak, adding $66 million on Tuesday alone.
#BitcoinETF #InstitutionalDemand
19

·
--
$BTC | The SEC chair wants tokenised stock markets. Australia already has this for bitcoin: six spot ETFs trade on ASX and Cboe/TMX Australia now, regulated and live. On the desk we once explained bitcoin exposure through CFDs. An ASIC-regulated ETF with an institutional custodian is cleaner for most retail investors. VanEck's VBTC charges 0.45%. It holds roughly AUD 292 million. SatoshiMacro's guide models a 10-year AUD 10,000 holding at AUD 250 to 490 in ETF fees versus AUD 10 to 100 direct. My read: the SEC headline is years ahead of anything here. Limitation: smaller listed funds can carry spreads above 0.3% in quiet trading. The 50 percent CGT discount still applies.
https://satoshimacro.com/guides/etfs/bitcoin-etf-australia/?utm_source=binance_square&utm_medium=social&utm_campaign=autopilot_short-2
#SatoshiMacro #SECChairWantsStockMarketsOnChain #BitcoinETF #Bitcoin
$BTC | The SEC chair wants tokenised stock markets. Australia already has this for bitcoin: six spot ETFs trade on ASX and Cboe/TMX Australia now, regulated and live. On the desk we once explained bitcoin exposure through CFDs. An ASIC-regulated ETF with an institutional custodian is cleaner for most retail investors. VanEck's VBTC charges 0.45%. It holds roughly AUD 292 million. SatoshiMacro's guide models a 10-year AUD 10,000 holding at AUD 250 to 490 in ETF fees versus AUD 10 to 100 direct. My read: the SEC headline is years ahead of anything here. Limitation: smaller listed funds can carry spreads above 0.3% in quiet trading. The 50 percent CGT discount still applies.
https://satoshimacro.com/guides/etfs/bitcoin-etf-australia/?utm_source=binance_square&utm_medium=social&utm_campaign=autopilot_short-2
#SatoshiMacro #SECChairWantsStockMarketsOnChain #BitcoinETF #Bitcoin
https://satoshimacro.com/guides/etfs/bitcoin-etf-australia/?utm_source=binance_square&utm_medium=social&utm_campaign=autopilot_short-2
#SatoshiMacro #SECChairWantsStockMarketsOnChain #BitcoinETF #Bitcoin
40

·
--
Bullish
$BTC
{spot}(BTCUSDT)
Follow the Money, Not the Noise
Bitcoin ETFs pulled in $2.4 billion last week. Biggest week since October 2025.
Big money doesn't tweet. It just buys.
Retail makes noise. Institutions build positions quietly.
Lesson? Watch the data, not the hype.
Do you trust charts or Crypto Twitter? 👇
#BitcoinETF #BTC #Crypto #BinanceSquare
$BTC
Follow the Money, Not the Noise
Bitcoin ETFs pulled in $2.4 billion last week. Biggest week since October 2025.
Big money doesn't tweet. It just buys.
Retail makes noise. Institutions build positions quietly.
Lesson? Watch the data, not the hype.
Do you trust charts or Crypto Twitter? 👇
#BitcoinETF #BTC #Crypto #BinanceSquare
Follow the Money, Not the Noise
Bitcoin ETFs pulled in $2.4 billion last week. Biggest week since October 2025.
Big money doesn't tweet. It just buys.
Retail makes noise. Institutions build positions quietly.
Lesson? Watch the data, not the hype.
Do you trust charts or Crypto Twitter? 👇
#BitcoinETF #BTC #Crypto #BinanceSquare
50

·
--
CoinShares notes Bitcoin ETF inflows obscure true institutional demand, with IBIT offering only partial clues to real buying power. Does ETF data mislead us on the actual strength of the current bull run? $BTC #BitcoinETF #CryptoNews
CoinShares notes Bitcoin ETF inflows obscure true institutional demand, with IBIT offering only partial clues to real buying power. Does ETF data mislead us on the actual strength of the current bull run? $BTC #BitcoinETF #CryptoNews
44

🔥 THE $2B BITCOIN ETF INJECTION JUST TURNED THE GAME ON ITS HEAD.
📊 Smart money poured a record $2 billion into US spot #BitcoinETF in April – the biggest monthly surge this year – and #IBIT ripped the top spot, outpacing rivals even as a late‑month outflow trimmed the rest of the fund family. At the same time #BTC is trading at $
🔥 THE $2B BITCOIN ETF INJECTION JUST TURNED THE GAME ON ITS HEAD.
📊 Smart money poured a record $2 billion into US spot #BitcoinETF in April – the biggest monthly surge this year – and #IBIT ripped the top spot, outpacing rivals even as a late‑month outflow trimmed the rest of the fund family. At the same time #BTC is trading at $
📊 Smart money poured a record $2 billion into US spot #BitcoinETF in April – the biggest monthly surge this year – and #IBIT ripped the top spot, outpacing rivals even as a late‑month outflow trimmed the rest of the fund family. At the same time #BTC is trading at $
BTC+2.45%
IBITETF+1.43%
4

🚨 BITCOIN ETF UPDATE
U.S. Spot Bitcoin ETFs recorded around $2.39 BILLION in net inflows over the latest reported week.
That was the largest weekly total of 2026 according to the report. 📊
Despite BTC's recent pullback, ETF demand remains a major market story.
Are institutions still interested in BTC?
DYOR — Not Financial Advice.
#bitcoin #BTC #BitcoinETF #CryptoNews #BinanceSquare
🚨 BITCOIN ETF UPDATE
U.S. Spot Bitcoin ETFs recorded around $2.39 BILLION in net inflows over the latest reported week.
That was the largest weekly total of 2026 according to the report. 📊
Despite BTC's recent pullback, ETF demand remains a major market story.
Are institutions still interested in BTC?
DYOR — Not Financial Advice.
#bitcoin #BTC #BitcoinETF #CryptoNews #BinanceSquare
U.S. Spot Bitcoin ETFs recorded around $2.39 BILLION in net inflows over the latest reported week.
That was the largest weekly total of 2026 according to the report. 📊
Despite BTC's recent pullback, ETF demand remains a major market story.
Are institutions still interested in BTC?
DYOR — Not Financial Advice.
#bitcoin #BTC #BitcoinETF #CryptoNews #BinanceSquare
5
Bitcoin ETFs have secured a massive $2.95 billion in inflows over the last 30 days, maintaining an eight day winning streak as they recover from recent regulatory sell off periods.
#BitcoinETF #ETFInflows
Bitcoin ETFs have secured a massive $2.95 billion in inflows over the last 30 days, maintaining an eight day winning streak as they recover from recent regulatory sell off periods.
#BitcoinETF #ETFInflows
#BitcoinETF #ETFInflows
10
$BTC ETF flows are still positive, but the momentum is cooling fast.
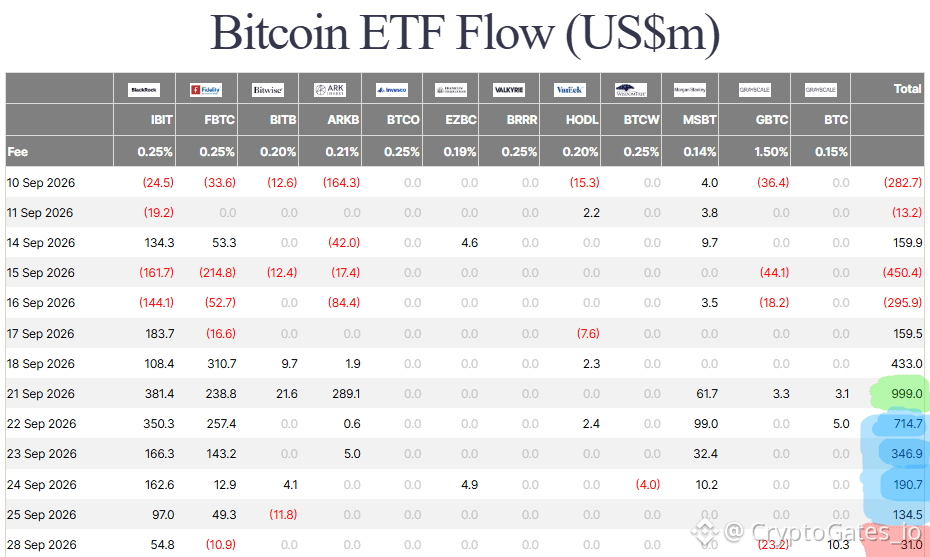
US spot Bitcoin ETFs have logged 8 straight days of net inflows. The daily prints tell a different story: $999M on Sep 21, then $714.7M, $346.9M, $190.7M, $134.5M, and just $31M on Sep 28. That is roughly a 97% drop from the peak day in one week 📉
Context matters too. On Sep 15 and 16, ETFs saw $450.4M and $295.9M of outflows, so the swing back to inflows was sharp.
BTC is sitting near $83K while flow intensity fades. Three scenarios I'm mapping:
Flows stabilize, and price builds a base
Flows keep shrinking and momentum stalls
A fresh inflow spike restarts the move
Price and flows need to agree before conviction means much.
Verify first. Risk later. Scale slowly...
#BTC #BitcoinETF #ETFFlows
$BTC ETF flows are still positive, but the momentum is cooling fast.
US spot Bitcoin ETFs have logged 8 straight days of net inflows. The daily prints tell a different story: $999M on Sep 21, then $714.7M, $346.9M, $190.7M, $134.5M, and just $31M on Sep 28. That is roughly a 97% drop from the peak day in one week 📉
Context matters too. On Sep 15 and 16, ETFs saw $450.4M and $295.9M of outflows, so the swing back to inflows was sharp.
BTC is sitting near $83K while flow intensity fades. Three scenarios I'm mapping:
Flows stabilize, and price builds a base
Flows keep shrinking and momentum stalls
A fresh inflow spike restarts the move
Price and flows need to agree before conviction means much.
Verify first. Risk later. Scale slowly...
#BTC #BitcoinETF #ETFFlows
US spot Bitcoin ETFs have logged 8 straight days of net inflows. The daily prints tell a different story: $999M on Sep 21, then $714.7M, $346.9M, $190.7M, $134.5M, and just $31M on Sep 28. That is roughly a 97% drop from the peak day in one week 📉
Context matters too. On Sep 15 and 16, ETFs saw $450.4M and $295.9M of outflows, so the swing back to inflows was sharp.
BTC is sitting near $83K while flow intensity fades. Three scenarios I'm mapping:
Flows stabilize, and price builds a base
Flows keep shrinking and momentum stalls
A fresh inflow spike restarts the move
Price and flows need to agree before conviction means much.
Verify first. Risk later. Scale slowly...
#BTC #BitcoinETF #ETFFlows
27
ETF Inflows Support BTC Near $84k
Bitcoin holds steady near $84k as spot ETFs record eight straight days of inflows, despite macro pressure from high treasury yields and rising crude prices.
#BitcoinETF #TreasuryYields
ETF Inflows Support BTC Near $84k
Bitcoin holds steady near $84k as spot ETFs record eight straight days of inflows, despite macro pressure from high treasury yields and rising crude prices.
#BitcoinETF #TreasuryYields
Bitcoin holds steady near $84k as spot ETFs record eight straight days of inflows, despite macro pressure from high treasury yields and rising crude prices.
#BitcoinETF #TreasuryYields
1
19
Don't get blinded by ETF inflows
CoinShares reports that recent Bitcoin ETF inflows may stem from basis trades instead of direct long bets, making it harder to gauge true institutional conviction.
#BitcoinETF #BasisTrading
Don't get blinded by ETF inflows
CoinShares reports that recent Bitcoin ETF inflows may stem from basis trades instead of direct long bets, making it harder to gauge true institutional conviction.
#BitcoinETF #BasisTrading
CoinShares reports that recent Bitcoin ETF inflows may stem from basis trades instead of direct long bets, making it harder to gauge true institutional conviction.
#BitcoinETF #BasisTrading

1

📊 Spot Bitcoin Funds See Flows in the Billions of Dollars
Spot Bitcoin exchange-traded funds (ETFs) recorded money inflows exceeding $3 billion over nine days. This data indicates renewed interest from financial institutions in investment products linked to Bitcoin.
━━━━━━━━━━━━━━
📊 Impact: 📈 High
🏷️ BITCOIN
#BitcoinETF #InstitutionalFlows #CryptoMarket #DigitalAssets #Bitcoin
📰 Source: cryptobriefing.com
📊 Spot Bitcoin Funds See Flows in the Billions of Dollars
Spot Bitcoin exchange-traded funds (ETFs) recorded money inflows exceeding $3 billion over nine days. This data indicates renewed interest from financial institutions in investment products linked to Bitcoin.
━━━━━━━━━━━━━━
📊 Impact: 📈 High
🏷️ BITCOIN
#BitcoinETF #InstitutionalFlows #CryptoMarket #DigitalAssets #Bitcoin
📰 Source: cryptobriefing.com
Spot Bitcoin exchange-traded funds (ETFs) recorded money inflows exceeding $3 billion over nine days. This data indicates renewed interest from financial institutions in investment products linked to Bitcoin.
━━━━━━━━━━━━━━
📊 Impact: 📈 High
🏷️ BITCOIN
#BitcoinETF #InstitutionalFlows #CryptoMarket #DigitalAssets #Bitcoin
📰 Source: cryptobriefing.com
10

BITCOIN ETFS CONTINUE RECEIVING MONEY, BUT THE PACE COOLS
U.S. spot Bitcoin ETFs of $BTC recorded $31.07 million in net inflows on September 28, extending a streak of eight consecutive positive sessions.
However, inflows were significantly lower than the $134.47 million recorded the previous Friday.
The data shows that institutional interest remains, although the pace of buying has lost momentum.
📊 ETF + spot demand = one of the key indicators to watch for BTC.
#Bitcoin #BitcoinETF #BTC #crypto
BITCOIN ETFS CONTINUE RECEIVING MONEY, BUT THE PACE COOLS
U.S. spot Bitcoin ETFs of $BTC recorded $31.07 million in net inflows on September 28, extending a streak of eight consecutive positive sessions.
However, inflows were significantly lower than the $134.47 million recorded the previous Friday.
The data shows that institutional interest remains, although the pace of buying has lost momentum.
📊 ETF + spot demand = one of the key indicators to watch for BTC.
#Bitcoin #BitcoinETF #BTC #crypto
U.S. spot Bitcoin ETFs of $BTC recorded $31.07 million in net inflows on September 28, extending a streak of eight consecutive positive sessions.
However, inflows were significantly lower than the $134.47 million recorded the previous Friday.
The data shows that institutional interest remains, although the pace of buying has lost momentum.
📊 ETF + spot demand = one of the key indicators to watch for BTC.
#Bitcoin #BitcoinETF #BTC #crypto

54
·
--
What Does A Single Bitcoin ETF Outflow Day Actually Tell You?$BTC | Every time the US spot Bitcoin ETFs post a big red flow number, someone asks whether institutions are quietly leaving and the top is in.
A single outflow day tells you almost nothing on its own. It becomes a real signal only when it repeats for five to ten straight sessions, which is roughly the window SatoshiMacro's daily flow tracker shows preceding actual BTC corrections historically. One red print is noise; a red week is data.
## Why One Day Of ETF Flow Data Rarely Means Anything
On the desk we never sized a position off one data point, and ETF flow reads are no different. SatoshiMacro's flow tracker showed US spot Bitcoin ETFs recording a net inflow of US$134.5 million on 25 September 2026, led by IBIT at plus US$97.0 million and FBTC at plus US$49.3 million. That is a green day. The session before it could just as easily have printed red by a similar margin, and neither one predicts tomorrow.
The eleven funds the tracker follows, IBIT, FBTC, GBTC, ARKB, BITB, the Grayscale Mini Trust, BTCO, EZBC, HODL, BRRR and DEFI, have traded since the SEC approved the category on 11 January 2024. Across that history, roughly 60 percent of trading sessions have closed with a positive net flow. That base rate alone tells you a single green or red day sits well inside normal variance, not at some extreme worth reacting to.
## What Actually Separates Signal From Noise
The pattern that has mattered historically is duration, not magnitude. Sustained inflow runs of five to ten trading days have preceded BTC rallies of eight to twenty percent. Outflow runs of similar length have preceded corrections of five to twelve percent. That is the threshold I actually watch, not the headline number on any single day.
Magnitude matters too, but only at the extremes. The largest single inflow day on record was a USD 1.4 billion session in November 2024, driven by the post-election Bitcoin rally. The largest single outflow was a USD 1.1 billion session in late February 2025, tied to broad macro de-risking. Both got attention precisely because they were rare, not because one unusual day is diagnostic by itself.
## A Worked Example: Reading A Real Outflow Run
Say the tracker shows six straight red days totalling roughly US$800 million in net redemptions, with GBTC as the largest single contributor. That clears the five-to-ten-day threshold above, so it is worth treating as a genuine de-risking signal, not a certainty that a top is in.
My read is you check where the outflow is concentrated before drawing any conclusion. GBTC has bled roughly USD 28 billion in net outflows since launch, mostly investors migrating to cheaper fee structures, which is a structural story that keeps repeating and tells you little about fresh demand. IBIT and FBTC both turning negative at the same time is a different reading entirely, since IBIT alone has pulled in over USD 60 billion in net inflows since launch and reached USD 50 billion in assets faster than any ETF on record. A GBTC-only outflow run barely moves my thinking. IBIT and FBTC joining it does.
## Why This Matters More For AUD Investors Than It Looks
Australian investors accessing these funds through an AFSL-licensed broker, with Stake and Interactive Brokers the common routes, are literally inside this flow data on the buy side, not just reading a US chart from the outside. Every buy order routed through one of those platforms adds to the print that Farside publishes the next US afternoon.
That flow also transmits directly to spot BTC price, which is what actually drives your AUD-denominated Bitcoin holdings, not the US dollar headline. It matters at a smaller scale too. Combined ASX-listed spot Bitcoin ETF holdings totalled A$427.9 million as of August 2026, a fraction of the US market but the same underlying mechanic, and the same signal-versus-noise question applies before you read anything into a single day's move there either.
## Where This Data Actually Comes From
The tracker pulls from Farside Investors, who publish the daily issuer-by-issuer flow table scraped from each fund's official AUM disclosure, with SoSoValue as a fallback source. Updates land on a T+1 cadence, meaning yesterday's flows post the next US afternoon, so anything you read on a given Sydney morning is already a session old by the time it lands. That lag matters for how you use the number: it is a same-day confirmation tool, not a live trading signal.
It also explains why smaller issuers regularly print a flat zero. ARKB, BITB, the Grayscale Mini Trust, BTCO, EZBC, HODL, BRRR and DEFI each carry far smaller assets under management than IBIT, FBTC or GBTC, so a day with no creations or redemptions at all is completely normal for them and should not be read as a warning sign about the fund itself.
## The Honest Limitation
This is a flow signal, not a forecasting model. It tells you about institutional positioning through one specific product wrapper. It says nothing about on-chain accumulation, leverage building in perpetual futures, or retail sentiment away from these eleven funds. I treat it as one input into a wider cycle read, alongside the other tier signals in the SatoshiMacro Model, never as the whole picture on its own.
If you are trading the reaction rather than the fund itself, remember the flow-to-price relationship SatoshiMacro's tracker documents runs one to three trading days ahead at swing-trade horizons and two to four weeks at trend-trade horizons. React to the run, not the print.
https://satoshimacro.com/tools/crypto/etf-flows/daily-spot-etf-flows/?utm_source=binance_square&utm_medium=social&utm_campaign=autopilot_article
#SatoshiMacro #BitcoinETF #ETFFlows #Bitcoin
What Does A Single Bitcoin ETF Outflow Day Actually Tell You?
$BTC | Every time the US spot Bitcoin ETFs post a big red flow number, someone asks whether institutions are quietly leaving and the top is in.
A single outflow day tells you almost nothing on its own. It becomes a real signal only when it repeats for five to ten straight sessions, which is roughly the window SatoshiMacro's daily flow tracker shows preceding actual BTC corrections historically. One red print is noise; a red week is data.
## Why One Day Of ETF Flow Data Rarely Means Anything
On the desk we never sized a position off one data point, and ETF flow reads are no different. SatoshiMacro's flow tracker showed US spot Bitcoin ETFs recording a net inflow of US$134.5 million on 25 September 2026, led by IBIT at plus US$97.0 million and FBTC at plus US$49.3 million. That is a green day. The session before it could just as easily have printed red by a similar margin, and neither one predicts tomorrow.
The eleven funds the tracker follows, IBIT, FBTC, GBTC, ARKB, BITB, the Grayscale Mini Trust, BTCO, EZBC, HODL, BRRR and DEFI, have traded since the SEC approved the category on 11 January 2024. Across that history, roughly 60 percent of trading sessions have closed with a positive net flow. That base rate alone tells you a single green or red day sits well inside normal variance, not at some extreme worth reacting to.
## What Actually Separates Signal From Noise
The pattern that has mattered historically is duration, not magnitude. Sustained inflow runs of five to ten trading days have preceded BTC rallies of eight to twenty percent. Outflow runs of similar length have preceded corrections of five to twelve percent. That is the threshold I actually watch, not the headline number on any single day.
Magnitude matters too, but only at the extremes. The largest single inflow day on record was a USD 1.4 billion session in November 2024, driven by the post-election Bitcoin rally. The largest single outflow was a USD 1.1 billion session in late February 2025, tied to broad macro de-risking. Both got attention precisely because they were rare, not because one unusual day is diagnostic by itself.
## A Worked Example: Reading A Real Outflow Run
Say the tracker shows six straight red days totalling roughly US$800 million in net redemptions, with GBTC as the largest single contributor. That clears the five-to-ten-day threshold above, so it is worth treating as a genuine de-risking signal, not a certainty that a top is in.
My read is you check where the outflow is concentrated before drawing any conclusion. GBTC has bled roughly USD 28 billion in net outflows since launch, mostly investors migrating to cheaper fee structures, which is a structural story that keeps repeating and tells you little about fresh demand. IBIT and FBTC both turning negative at the same time is a different reading entirely, since IBIT alone has pulled in over USD 60 billion in net inflows since launch and reached USD 50 billion in assets faster than any ETF on record. A GBTC-only outflow run barely moves my thinking. IBIT and FBTC joining it does.
## Why This Matters More For AUD Investors Than It Looks
Australian investors accessing these funds through an AFSL-licensed broker, with Stake and Interactive Brokers the common routes, are literally inside this flow data on the buy side, not just reading a US chart from the outside. Every buy order routed through one of those platforms adds to the print that Farside publishes the next US afternoon.
That flow also transmits directly to spot BTC price, which is what actually drives your AUD-denominated Bitcoin holdings, not the US dollar headline. It matters at a smaller scale too. Combined ASX-listed spot Bitcoin ETF holdings totalled A$427.9 million as of August 2026, a fraction of the US market but the same underlying mechanic, and the same signal-versus-noise question applies before you read anything into a single day's move there either.
## Where This Data Actually Comes From
The tracker pulls from Farside Investors, who publish the daily issuer-by-issuer flow table scraped from each fund's official AUM disclosure, with SoSoValue as a fallback source. Updates land on a T+1 cadence, meaning yesterday's flows post the next US afternoon, so anything you read on a given Sydney morning is already a session old by the time it lands. That lag matters for how you use the number: it is a same-day confirmation tool, not a live trading signal.
It also explains why smaller issuers regularly print a flat zero. ARKB, BITB, the Grayscale Mini Trust, BTCO, EZBC, HODL, BRRR and DEFI each carry far smaller assets under management than IBIT, FBTC or GBTC, so a day with no creations or redemptions at all is completely normal for them and should not be read as a warning sign about the fund itself.
## The Honest Limitation
This is a flow signal, not a forecasting model. It tells you about institutional positioning through one specific product wrapper. It says nothing about on-chain accumulation, leverage building in perpetual futures, or retail sentiment away from these eleven funds. I treat it as one input into a wider cycle read, alongside the other tier signals in the SatoshiMacro Model, never as the whole picture on its own.
If you are trading the reaction rather than the fund itself, remember the flow-to-price relationship SatoshiMacro's tracker documents runs one to three trading days ahead at swing-trade horizons and two to four weeks at trend-trade horizons. React to the run, not the print.
https://satoshimacro.com/tools/crypto/etf-flows/daily-spot-etf-flows/?utm_source=binance_square&utm_medium=social&utm_campaign=autopilot_article
#SatoshiMacro #BitcoinETF #ETFFlows #Bitcoin
A single outflow day tells you almost nothing on its own. It becomes a real signal only when it repeats for five to ten straight sessions, which is roughly the window SatoshiMacro's daily flow tracker shows preceding actual BTC corrections historically. One red print is noise; a red week is data.
## Why One Day Of ETF Flow Data Rarely Means Anything
On the desk we never sized a position off one data point, and ETF flow reads are no different. SatoshiMacro's flow tracker showed US spot Bitcoin ETFs recording a net inflow of US$134.5 million on 25 September 2026, led by IBIT at plus US$97.0 million and FBTC at plus US$49.3 million. That is a green day. The session before it could just as easily have printed red by a similar margin, and neither one predicts tomorrow.
The eleven funds the tracker follows, IBIT, FBTC, GBTC, ARKB, BITB, the Grayscale Mini Trust, BTCO, EZBC, HODL, BRRR and DEFI, have traded since the SEC approved the category on 11 January 2024. Across that history, roughly 60 percent of trading sessions have closed with a positive net flow. That base rate alone tells you a single green or red day sits well inside normal variance, not at some extreme worth reacting to.
## What Actually Separates Signal From Noise
The pattern that has mattered historically is duration, not magnitude. Sustained inflow runs of five to ten trading days have preceded BTC rallies of eight to twenty percent. Outflow runs of similar length have preceded corrections of five to twelve percent. That is the threshold I actually watch, not the headline number on any single day.
Magnitude matters too, but only at the extremes. The largest single inflow day on record was a USD 1.4 billion session in November 2024, driven by the post-election Bitcoin rally. The largest single outflow was a USD 1.1 billion session in late February 2025, tied to broad macro de-risking. Both got attention precisely because they were rare, not because one unusual day is diagnostic by itself.
## A Worked Example: Reading A Real Outflow Run
Say the tracker shows six straight red days totalling roughly US$800 million in net redemptions, with GBTC as the largest single contributor. That clears the five-to-ten-day threshold above, so it is worth treating as a genuine de-risking signal, not a certainty that a top is in.
My read is you check where the outflow is concentrated before drawing any conclusion. GBTC has bled roughly USD 28 billion in net outflows since launch, mostly investors migrating to cheaper fee structures, which is a structural story that keeps repeating and tells you little about fresh demand. IBIT and FBTC both turning negative at the same time is a different reading entirely, since IBIT alone has pulled in over USD 60 billion in net inflows since launch and reached USD 50 billion in assets faster than any ETF on record. A GBTC-only outflow run barely moves my thinking. IBIT and FBTC joining it does.
## Why This Matters More For AUD Investors Than It Looks
Australian investors accessing these funds through an AFSL-licensed broker, with Stake and Interactive Brokers the common routes, are literally inside this flow data on the buy side, not just reading a US chart from the outside. Every buy order routed through one of those platforms adds to the print that Farside publishes the next US afternoon.
That flow also transmits directly to spot BTC price, which is what actually drives your AUD-denominated Bitcoin holdings, not the US dollar headline. It matters at a smaller scale too. Combined ASX-listed spot Bitcoin ETF holdings totalled A$427.9 million as of August 2026, a fraction of the US market but the same underlying mechanic, and the same signal-versus-noise question applies before you read anything into a single day's move there either.
## Where This Data Actually Comes From
The tracker pulls from Farside Investors, who publish the daily issuer-by-issuer flow table scraped from each fund's official AUM disclosure, with SoSoValue as a fallback source. Updates land on a T+1 cadence, meaning yesterday's flows post the next US afternoon, so anything you read on a given Sydney morning is already a session old by the time it lands. That lag matters for how you use the number: it is a same-day confirmation tool, not a live trading signal.
It also explains why smaller issuers regularly print a flat zero. ARKB, BITB, the Grayscale Mini Trust, BTCO, EZBC, HODL, BRRR and DEFI each carry far smaller assets under management than IBIT, FBTC or GBTC, so a day with no creations or redemptions at all is completely normal for them and should not be read as a warning sign about the fund itself.
## The Honest Limitation
This is a flow signal, not a forecasting model. It tells you about institutional positioning through one specific product wrapper. It says nothing about on-chain accumulation, leverage building in perpetual futures, or retail sentiment away from these eleven funds. I treat it as one input into a wider cycle read, alongside the other tier signals in the SatoshiMacro Model, never as the whole picture on its own.
If you are trading the reaction rather than the fund itself, remember the flow-to-price relationship SatoshiMacro's tracker documents runs one to three trading days ahead at swing-trade horizons and two to four weeks at trend-trade horizons. React to the run, not the print.
https://satoshimacro.com/tools/crypto/etf-flows/daily-spot-etf-flows/?utm_source=binance_square&utm_medium=social&utm_campaign=autopilot_article
#SatoshiMacro #BitcoinETF #ETFFlows #Bitcoin
87
Log in to explore more content
Join global crypto users on Binance Square
⚡️ Get latest and useful information about crypto.
💬 Trusted by the world’s largest crypto exchange.
👍 Discover real insights from verified creators.
Email / Phone number
Trending Topics
1
#NFPWatch
10.6M views
17,973 Discussing
2
#BitcoinFundingRateTriplesTo10%
11,134 views
290 Discussing
3
#BitcoinSurpasses$86KUp2.99%
3,402 views
43 Discussing
4
#ZcashFalls21%FromSeptemberPeak
15,371 views
309 Discussing
5
#USSeptemberPayrollsAdd29KUnemploymentRises4.2%
7,947 views
150 Discussing
6
#XRPPostsFirstThreeGreenMonthsInQ3
15,470 views
360 Discussing
7
#BNBChainTokenizedStocksTop$1BAt30%Share
189 views
24 Discussing
8
#BitcoinRisesToward$85K
57,328 views
121 Discussing
9
#AmazonPlansToSell$8BNvidiaChips
6,053 views
80 Discussing
10
#NEARFallsToAround$4.70Down14%
40,607 views
106 Discussing