Binance Square
#ztcbinamcetge

ztcbinamcetge

182 views
3 Discussing
kishore_kumar12
·
--
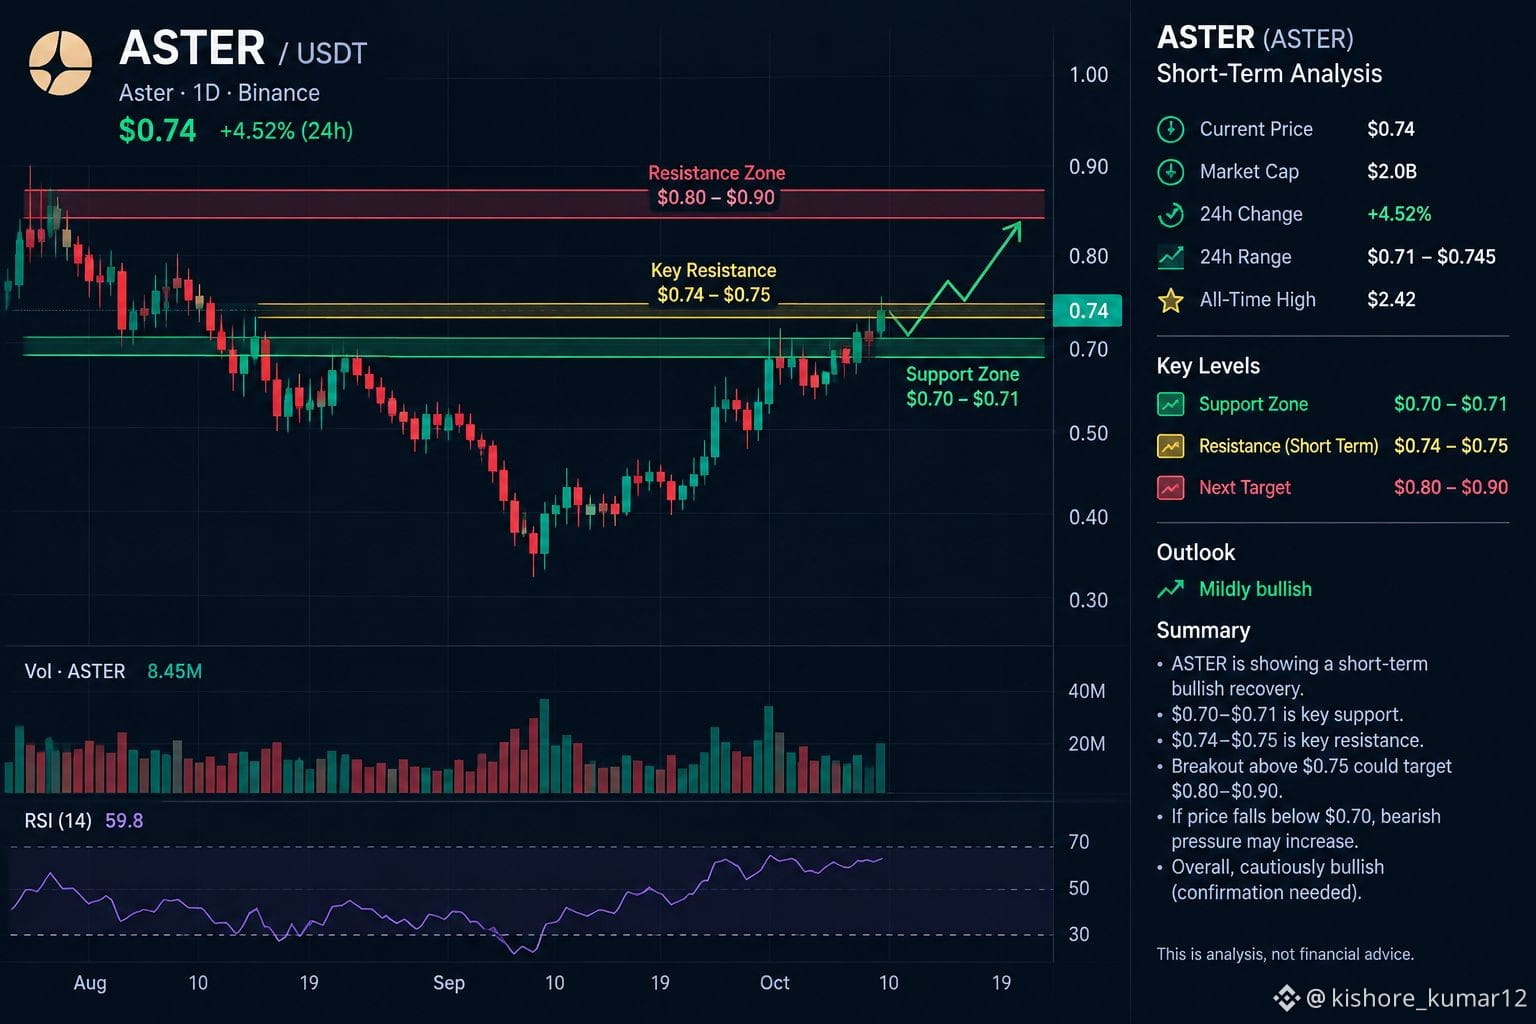
Current price: around $0.74 Market cap: around $2.0B 24h change: roughly +4–5% 24h range: approximately $0.71–$0.745 All-time high: about $2.42 � Binance +1 $ASTER has recently shown improving momentum, with its 7-day performance positive. � CoinGecko Technical view: $ASTER is currently showing a short-term bullish recovery, but $0.74–$0.75 is an important resistance area. A strong breakout above this zone could open the way toward $0.80–$0.90. On the downside, $0.70–$0.71 is an important support zone based on recent price action. #USTraderDeficitShrink #ZTCBinamceTGE #WriteToEarnUpgradev #CPIWatch
Current price: around $0.74
Market cap: around $2.0B
24h change: roughly +4–5%
24h range: approximately $0.71–$0.745
All-time high: about $2.42 �
Binance +1
$ASTER has recently shown improving momentum, with its 7-day performance positive. �
CoinGecko
Technical view: $ASTER is currently showing a short-term bullish recovery, but $0.74–$0.75 is an important resistance area. A strong breakout above this zone could open the way toward $0.80–$0.90. On the downside, $0.70–$0.71 is an important support zone based on recent price action.
#USTraderDeficitShrink #ZTCBinamceTGE #WriteToEarnUpgradev #CPIWatch
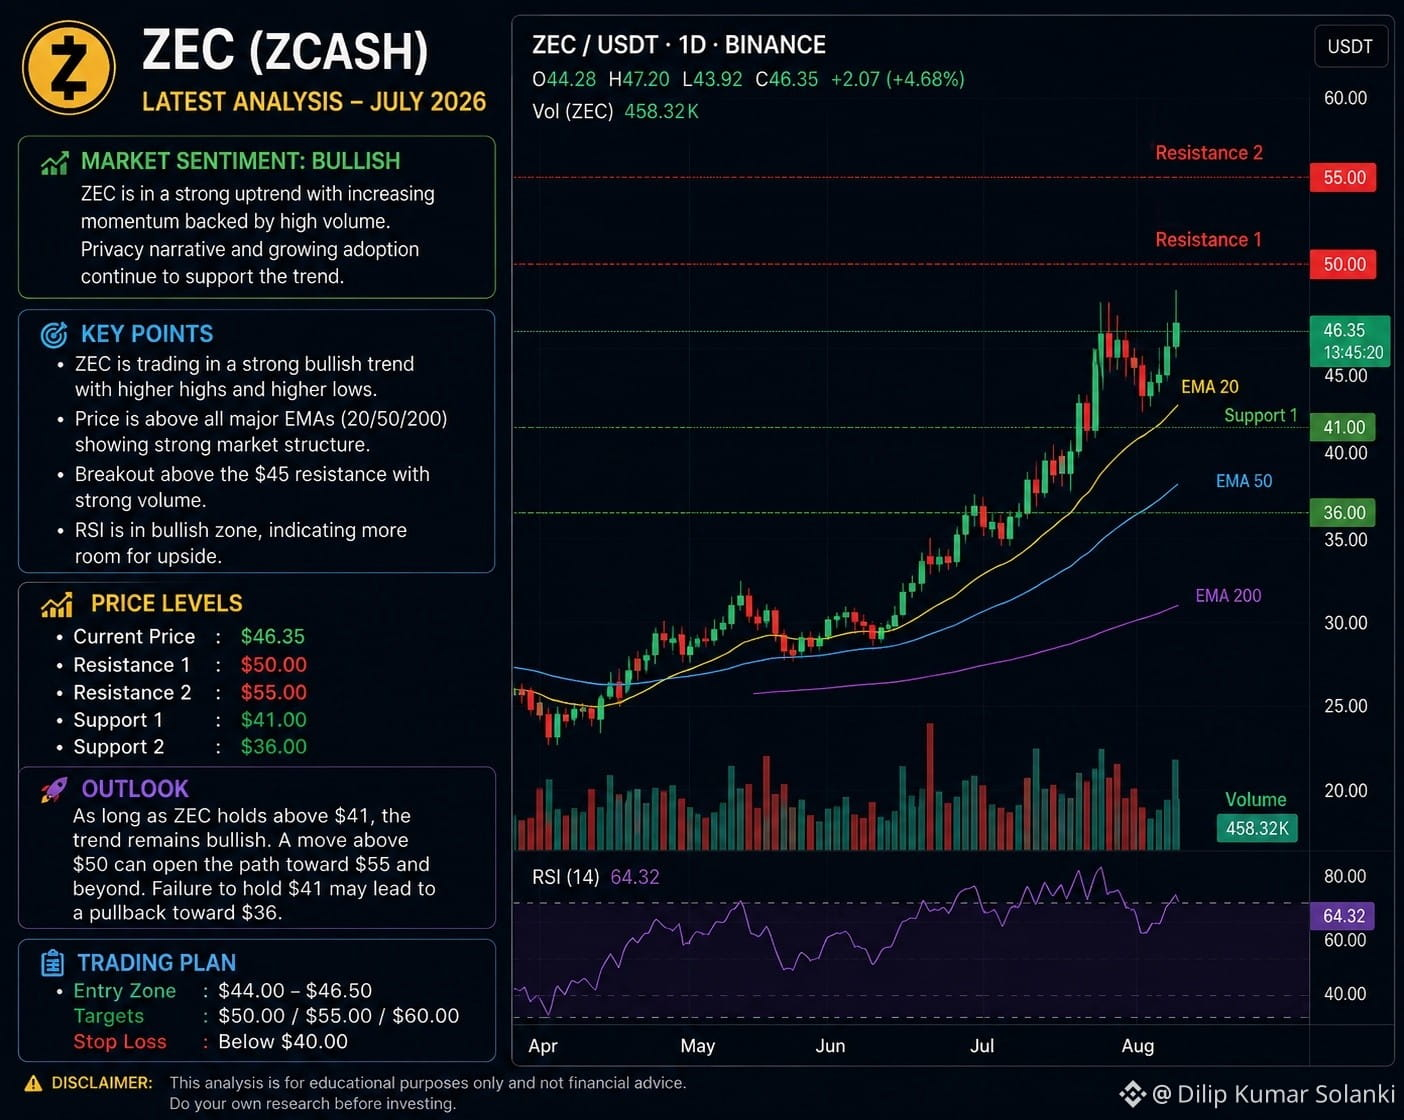
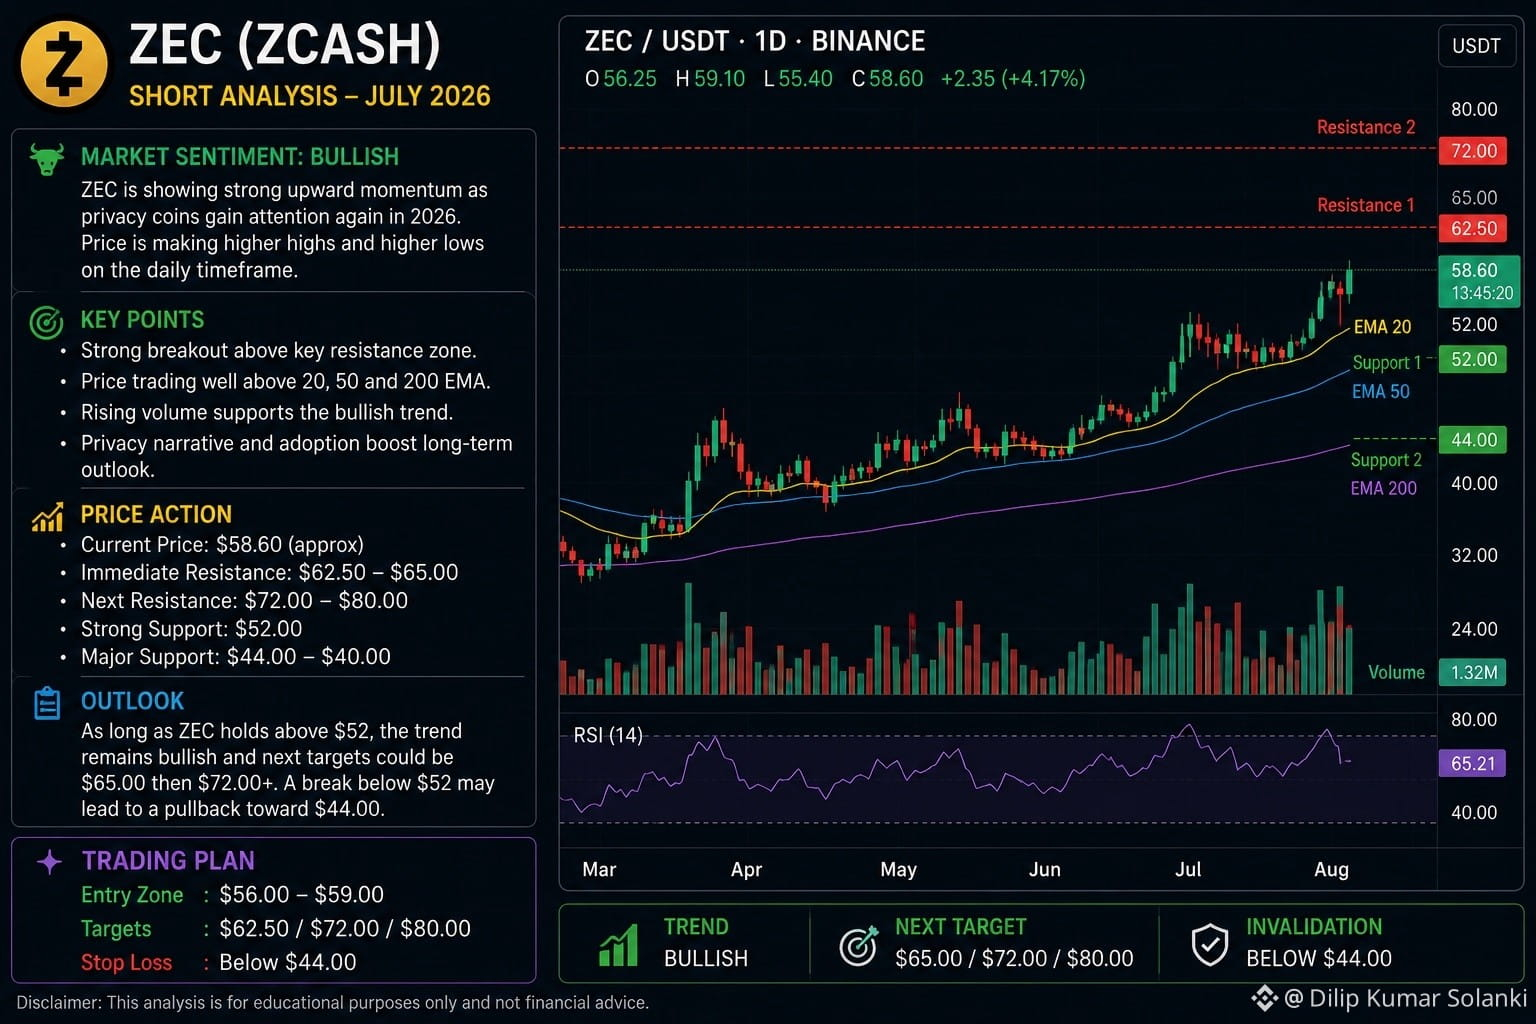
$ZEC C (Zcash) — Short Analysis ZEC is strongly bullish but highly volatile. On August 22, 2026, ZEC surged above $800, reaching an 8-year high, with ETF-related optimism helping drive the rally. Trend: 🚀 Strong bullish momentum Key support: ~$700, then ~$600 Resistance: ~$800–$850 Bullish case: Sustained trading above $800 could open further upside. Risk: RSI was reported around 86, indicating an extremely overbought market where a sharp pullback is possible. Important: The candlestick image is an illustrative technical chart, not {spot}(ZECUSDT) a live-price chart. ZEC is moving very quickly, so check the live ZEC/USDT chart before trading. #USTC #ZTCBinamceTGE #Write2Earn #CPIWatch
$ZEC C (Zcash) — Short Analysis
ZEC is strongly bullish but highly volatile. On August 22, 2026, ZEC surged above $800, reaching an 8-year high, with ETF-related optimism helping drive the rally.
Trend: 🚀 Strong bullish momentum
Key support: ~$700, then ~$600
Resistance: ~$800–$850
Bullish case: Sustained trading above $800 could open further upside.
Risk: RSI was reported around 86, indicating an extremely overbought market where a sharp pullback is possible.
Important: The candlestick image is an illustrative technical chart, not
a live-price chart. ZEC is moving very quickly, so check the live ZEC/USDT chart before trading. #USTC #ZTCBinamceTGE #Write2Earn #CPIWatch
Toulouse FC vs. Olympique Lyonnais - More Markets

Toulouse FC vs. Olympique Lyonnais - More Markets

Olympique Lyonnais...99%O/U 1.599%O/U 0.599%
Volume $1,041.61
Log in to explore more content
Join global crypto users on Binance Square
⚡️ Get latest and useful information about crypto.
💬 Trusted by the world’s largest crypto exchange.
👍 Discover real insights from verified creators.
Email / Phone number