
#xlmanalysis
xlmanalysis
30,921 views
18 Discussing
Hot
Latest

Article
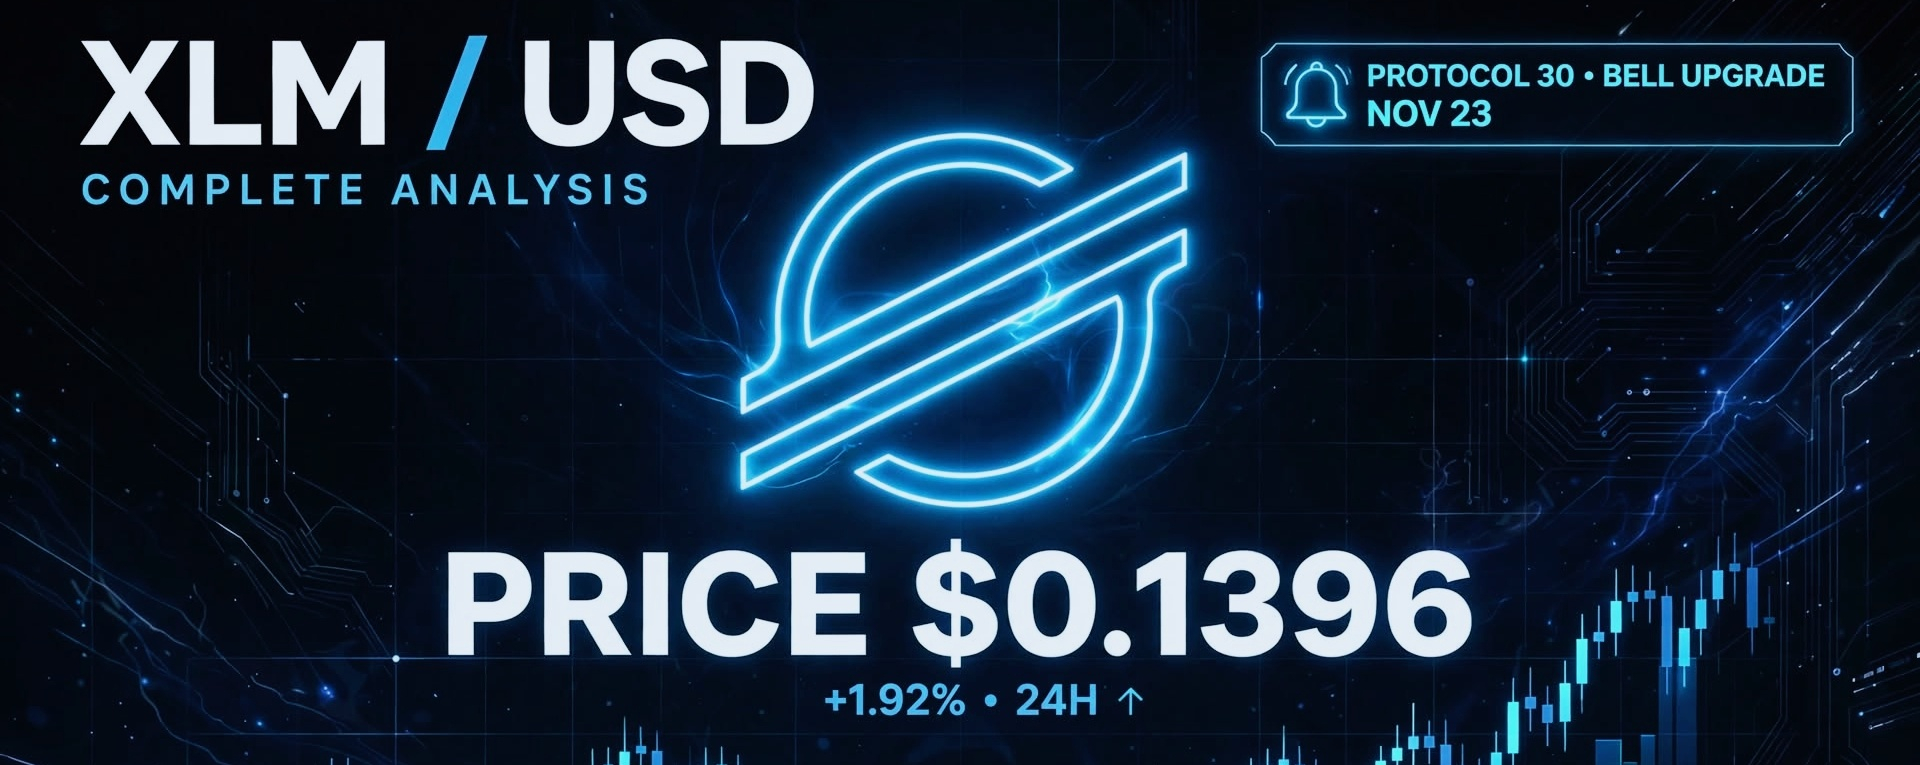
XLM / USD - Complete Analysis
16 Nov 2026$XLM / USD - Complete Analysis
16 Nov 2026
1. Current Price Snapshot
Price: ~ $0.1396 - $0.1413
24h Change: +1.97% to +3.07% - a bounce after a sharp sell-off
24h Range: $0.1365 - $0.1421
Previous Day: Open $0.1355, High $0.1411, Low $0.1304, Close $0.1401
Market Cap: ∼$4.86B - $5.0B, Rank #19
Circulating Supply: 35.4B XLM / Total Supply: 50.0B XLM
{spot}(XLMUSDT)
Performance:
5 sessions: -3.18%
1 month: -22.81%
6 months: -7.71%
Year-to-date: -32.87%
1 year: -44.84%
$XLM is in a long-term downtrend but trying to bounce short-term.
### 2. Technical Analysis
Overall Trend: BEARISH on Daily, Neutral-to-Bearish on 4H
Price is trading below all major EMAs: 50-day ∼$0.173, 100-day ∼$0.179, 200-day ∼$0.185. That cluster at $0.175 - $0.186 is heavy overhead supply.
On the daily chart, XLM is in a daily downtrend inside a weekly downtrend. Sellers have the edge while price stays under $0.1527.
Momentum Indicators:
RSI (14) Daily: 30.7 - 33.9 - Near oversold, leaning to slight buy / selling exhaustion
RSI (14) 4H: ∼47.4, 1H: ∼62.1 - Short-term bounce is stronger than daily
MACD (12,26): -0.0105, Sell - Still bearish, but histogram is flattening, suggesting momentum loss for sellers
ADX: ∼27.8 - 31.2 - Trend is still firm, not yet sideways
Interpretation: Oversold bounce is possible, but NOT a trend reversal yet. This looks like a relief rally inside a downtrend until $0.1527 - $0.1555 is reclaimed.
3. Key Levels to Watch
| Type | Levels |
| --- | --- |
| Immediate Support | $0.1365 - $0.1370 |
| Strong Support | $0.1304 - $0.1306 (recent low) |
| Breakdown Support | $0.1288, then $0.1223 |
| Immediate Resistance | $0.1416 - $0.1437 |
| Key Resistance | $0.1442 - $0.1464 |
| Breakout Resistance | $0.1531 - $0.1555 |
| Major Resistance | $0.168 - $0.173 (50-day EMA) |
Pivot for today: $0.1377
Scenarios:
Bullish: Hold above $0.1370 > break $0.1437 > target $0.1531, then $0.168
Bearish: Lose $0.1365 > retest $0.1304 > break below opens $0.1223
Most Likely Short-term (1-3 days): Range $0.1362 - $0.1464 with choppy, mixed signals
4. Fundamental Analysis - Why XLM is Moving
Main Catalyst: Protocol 30 "Bell" Upgrade
This is the biggest near-term driver.
Testnet: Went live Nov 3-4, 2026 after validator vote
Mainnet Vote: Nov 23, 2026 at 17:00 UTC - NOT yet activated
What it does (3 changes):
CAP-84 - Muxed Contract Addresses: One smart contract can serve many customers with a 64-bit customer ID. Makes it much easier for exchanges / businesses to use Soroban contracts.
CAP-87 - Post-Quantum Signatures: Soroban contracts can verify ML-DSA post-quantum signatures. Important: This does NOT make Stellar itself post-quantum, network transactions still use Ed25519.
CAP-88 - Millisecond Ledger Timestamps: Finer timing for DeFi / payments.
Fundamental Verdict: Bell is a strong infrastructure upgrade for developers and institutions, especially for smart accounts and tokenization. But it does not change XLM issuance, fees, or demand directly. So it can create hype into Nov 23, but price needs a successful vote + real usage to sustain.
Other Fundamentals:
Stellar's core use case remains cross-border payments, remittances, and tokenized real-world assets via anchors.
No new token burn or supply change in Bell.
Market sentiment is Extreme Fear (Fear & Greed ∼10) and overall crypto risk-off due to macro / Fed rate hike warnings, which is pressuring XLM along with XRP.
5. Sentiment & Market Context
Sentiment: Bearish on most dashboards, despite today's +7.45% bounce reported on Nov 15
Correlation: $XLM moves closely with XRP and overall altcoin market. If BTC drops, XLM will likely fall faster.
Volume: Low relative volume on bounce = weak conviction. A real reversal needs volume expansion above $0.1442.
6. Trading Plan (Not Financial Advice)
For Short-term Traders:
Do NOT chase at $0.141. Wait for pullback to $0.1365-$0.1370 for long, or breakout close above $0.1442.
Stop-loss for longs: Below $0.1304
Take-profit: $0.1464, then $0.1531
For Swing / Investors:
Accumulation zone: $0.130 - $0.137 looks attractive for long-term, but only in parts (DCA), because trend is still down.
Invalidation: Weekly close below $0.1223 would be very bearish.
Confirmation of reversal: Daily close above $0.1555 + RSI back above 45.
Risk: High. 1-year down -44.84% shows this is a falling asset. Only risk money you can afford to lose, and keep position size small ahead of the Nov 23 vote - volatility will spike.
7. Bottom Line
Short-term: Oversold bounce, watch $0.1370 support / $0.1437 resistance.
Medium-term: Still bearish until $0.1527 is reclaimed.
Long-term: Bell upgrade on Nov 23 is a genuine positive for Stellar's tech, but XLM needs broader crypto recovery + real adoption to break the 2026 downtrend.
Want me to make you a price alert plan for $0.130 / $0.144 / $0.153, or a 1-week forecast table for XLM?
#XLMAnalysis #XLMUSDT #XLMAlert #TrendingPredictions #viralmypost
XLM / USD - Complete Analysis 16 Nov 2026
$XLM / USD - Complete Analysis
16 Nov 2026
1. Current Price Snapshot
Price: ~ $0.1396 - $0.1413
24h Change: +1.97% to +3.07% - a bounce after a sharp sell-off
24h Range: $0.1365 - $0.1421
Previous Day: Open $0.1355, High $0.1411, Low $0.1304, Close $0.1401
Market Cap: ∼$4.86B - $5.0B, Rank #19
Circulating Supply: 35.4B XLM / Total Supply: 50.0B XLM
Performance:
5 sessions: -3.18%
1 month: -22.81%
6 months: -7.71%
Year-to-date: -32.87%
1 year: -44.84%
$XLM is in a long-term downtrend but trying to bounce short-term.
### 2. Technical Analysis
Overall Trend: BEARISH on Daily, Neutral-to-Bearish on 4H
Price is trading below all major EMAs: 50-day ∼$0.173, 100-day ∼$0.179, 200-day ∼$0.185. That cluster at $0.175 - $0.186 is heavy overhead supply.
On the daily chart, XLM is in a daily downtrend inside a weekly downtrend. Sellers have the edge while price stays under $0.1527.
Momentum Indicators:
RSI (14) Daily: 30.7 - 33.9 - Near oversold, leaning to slight buy / selling exhaustion
RSI (14) 4H: ∼47.4, 1H: ∼62.1 - Short-term bounce is stronger than daily
MACD (12,26): -0.0105, Sell - Still bearish, but histogram is flattening, suggesting momentum loss for sellers
ADX: ∼27.8 - 31.2 - Trend is still firm, not yet sideways
Interpretation: Oversold bounce is possible, but NOT a trend reversal yet. This looks like a relief rally inside a downtrend until $0.1527 - $0.1555 is reclaimed.
3. Key Levels to Watch
| Type | Levels |
| --- | --- |
| Immediate Support | $0.1365 - $0.1370 |
| Strong Support | $0.1304 - $0.1306 (recent low) |
| Breakdown Support | $0.1288, then $0.1223 |
| Immediate Resistance | $0.1416 - $0.1437 |
| Key Resistance | $0.1442 - $0.1464 |
| Breakout Resistance | $0.1531 - $0.1555 |
| Major Resistance | $0.168 - $0.173 (50-day EMA) |
Pivot for today: $0.1377
Scenarios:
Bullish: Hold above $0.1370 > break $0.1437 > target $0.1531, then $0.168
Bearish: Lose $0.1365 > retest $0.1304 > break below opens $0.1223
Most Likely Short-term (1-3 days): Range $0.1362 - $0.1464 with choppy, mixed signals
4. Fundamental Analysis - Why XLM is Moving
Main Catalyst: Protocol 30 "Bell" Upgrade
This is the biggest near-term driver.
Testnet: Went live Nov 3-4, 2026 after validator vote
Mainnet Vote: Nov 23, 2026 at 17:00 UTC - NOT yet activated
What it does (3 changes):
CAP-84 - Muxed Contract Addresses: One smart contract can serve many customers with a 64-bit customer ID. Makes it much easier for exchanges / businesses to use Soroban contracts.
CAP-87 - Post-Quantum Signatures: Soroban contracts can verify ML-DSA post-quantum signatures. Important: This does NOT make Stellar itself post-quantum, network transactions still use Ed25519.
CAP-88 - Millisecond Ledger Timestamps: Finer timing for DeFi / payments.
Fundamental Verdict: Bell is a strong infrastructure upgrade for developers and institutions, especially for smart accounts and tokenization. But it does not change XLM issuance, fees, or demand directly. So it can create hype into Nov 23, but price needs a successful vote + real usage to sustain.
Other Fundamentals:
Stellar's core use case remains cross-border payments, remittances, and tokenized real-world assets via anchors.
No new token burn or supply change in Bell.
Market sentiment is Extreme Fear (Fear & Greed ∼10) and overall crypto risk-off due to macro / Fed rate hike warnings, which is pressuring XLM along with XRP.
5. Sentiment & Market Context
Sentiment: Bearish on most dashboards, despite today's +7.45% bounce reported on Nov 15
Correlation: $XLM moves closely with XRP and overall altcoin market. If BTC drops, XLM will likely fall faster.
Volume: Low relative volume on bounce = weak conviction. A real reversal needs volume expansion above $0.1442.
6. Trading Plan (Not Financial Advice)
For Short-term Traders:
Do NOT chase at $0.141. Wait for pullback to $0.1365-$0.1370 for long, or breakout close above $0.1442.
Stop-loss for longs: Below $0.1304
Take-profit: $0.1464, then $0.1531
For Swing / Investors:
Accumulation zone: $0.130 - $0.137 looks attractive for long-term, but only in parts (DCA), because trend is still down.
Invalidation: Weekly close below $0.1223 would be very bearish.
Confirmation of reversal: Daily close above $0.1555 + RSI back above 45.
Risk: High. 1-year down -44.84% shows this is a falling asset. Only risk money you can afford to lose, and keep position size small ahead of the Nov 23 vote - volatility will spike.
7. Bottom Line
Short-term: Oversold bounce, watch $0.1370 support / $0.1437 resistance.
Medium-term: Still bearish until $0.1527 is reclaimed.
Long-term: Bell upgrade on Nov 23 is a genuine positive for Stellar's tech, but XLM needs broader crypto recovery + real adoption to break the 2026 downtrend.
Want me to make you a price alert plan for $0.130 / $0.144 / $0.153, or a 1-week forecast table for XLM?
#XLMAnalysis #XLMUSDT #XLMAlert #TrendingPredictions #viralmypost
16 Nov 2026
1. Current Price Snapshot
Price: ~ $0.1396 - $0.1413
24h Change: +1.97% to +3.07% - a bounce after a sharp sell-off
24h Range: $0.1365 - $0.1421
Previous Day: Open $0.1355, High $0.1411, Low $0.1304, Close $0.1401
Market Cap: ∼$4.86B - $5.0B, Rank #19
Circulating Supply: 35.4B XLM / Total Supply: 50.0B XLM
Performance:
5 sessions: -3.18%
1 month: -22.81%
6 months: -7.71%
Year-to-date: -32.87%
1 year: -44.84%
$XLM is in a long-term downtrend but trying to bounce short-term.
### 2. Technical Analysis
Overall Trend: BEARISH on Daily, Neutral-to-Bearish on 4H
Price is trading below all major EMAs: 50-day ∼$0.173, 100-day ∼$0.179, 200-day ∼$0.185. That cluster at $0.175 - $0.186 is heavy overhead supply.
On the daily chart, XLM is in a daily downtrend inside a weekly downtrend. Sellers have the edge while price stays under $0.1527.
Momentum Indicators:
RSI (14) Daily: 30.7 - 33.9 - Near oversold, leaning to slight buy / selling exhaustion
RSI (14) 4H: ∼47.4, 1H: ∼62.1 - Short-term bounce is stronger than daily
MACD (12,26): -0.0105, Sell - Still bearish, but histogram is flattening, suggesting momentum loss for sellers
ADX: ∼27.8 - 31.2 - Trend is still firm, not yet sideways
Interpretation: Oversold bounce is possible, but NOT a trend reversal yet. This looks like a relief rally inside a downtrend until $0.1527 - $0.1555 is reclaimed.
3. Key Levels to Watch
| Type | Levels |
| --- | --- |
| Immediate Support | $0.1365 - $0.1370 |
| Strong Support | $0.1304 - $0.1306 (recent low) |
| Breakdown Support | $0.1288, then $0.1223 |
| Immediate Resistance | $0.1416 - $0.1437 |
| Key Resistance | $0.1442 - $0.1464 |
| Breakout Resistance | $0.1531 - $0.1555 |
| Major Resistance | $0.168 - $0.173 (50-day EMA) |
Pivot for today: $0.1377
Scenarios:
Bullish: Hold above $0.1370 > break $0.1437 > target $0.1531, then $0.168
Bearish: Lose $0.1365 > retest $0.1304 > break below opens $0.1223
Most Likely Short-term (1-3 days): Range $0.1362 - $0.1464 with choppy, mixed signals
4. Fundamental Analysis - Why XLM is Moving
Main Catalyst: Protocol 30 "Bell" Upgrade
This is the biggest near-term driver.
Testnet: Went live Nov 3-4, 2026 after validator vote
Mainnet Vote: Nov 23, 2026 at 17:00 UTC - NOT yet activated
What it does (3 changes):
CAP-84 - Muxed Contract Addresses: One smart contract can serve many customers with a 64-bit customer ID. Makes it much easier for exchanges / businesses to use Soroban contracts.
CAP-87 - Post-Quantum Signatures: Soroban contracts can verify ML-DSA post-quantum signatures. Important: This does NOT make Stellar itself post-quantum, network transactions still use Ed25519.
CAP-88 - Millisecond Ledger Timestamps: Finer timing for DeFi / payments.
Fundamental Verdict: Bell is a strong infrastructure upgrade for developers and institutions, especially for smart accounts and tokenization. But it does not change XLM issuance, fees, or demand directly. So it can create hype into Nov 23, but price needs a successful vote + real usage to sustain.
Other Fundamentals:
Stellar's core use case remains cross-border payments, remittances, and tokenized real-world assets via anchors.
No new token burn or supply change in Bell.
Market sentiment is Extreme Fear (Fear & Greed ∼10) and overall crypto risk-off due to macro / Fed rate hike warnings, which is pressuring XLM along with XRP.
5. Sentiment & Market Context
Sentiment: Bearish on most dashboards, despite today's +7.45% bounce reported on Nov 15
Correlation: $XLM moves closely with XRP and overall altcoin market. If BTC drops, XLM will likely fall faster.
Volume: Low relative volume on bounce = weak conviction. A real reversal needs volume expansion above $0.1442.
6. Trading Plan (Not Financial Advice)
For Short-term Traders:
Do NOT chase at $0.141. Wait for pullback to $0.1365-$0.1370 for long, or breakout close above $0.1442.
Stop-loss for longs: Below $0.1304
Take-profit: $0.1464, then $0.1531
For Swing / Investors:
Accumulation zone: $0.130 - $0.137 looks attractive for long-term, but only in parts (DCA), because trend is still down.
Invalidation: Weekly close below $0.1223 would be very bearish.
Confirmation of reversal: Daily close above $0.1555 + RSI back above 45.
Risk: High. 1-year down -44.84% shows this is a falling asset. Only risk money you can afford to lose, and keep position size small ahead of the Nov 23 vote - volatility will spike.
7. Bottom Line
Short-term: Oversold bounce, watch $0.1370 support / $0.1437 resistance.
Medium-term: Still bearish until $0.1527 is reclaimed.
Long-term: Bell upgrade on Nov 23 is a genuine positive for Stellar's tech, but XLM needs broader crypto recovery + real adoption to break the 2026 downtrend.
Want me to make you a price alert plan for $0.130 / $0.144 / $0.153, or a 1-week forecast table for XLM?
#XLMAnalysis #XLMUSDT #XLMAlert #TrendingPredictions #viralmypost
161

·
--

Article
XLM TRADE SETUP FOR SWING TRADEXLM/USDT – 1H
Bias: Bullish
Entry: 0.177 – 0.179
Stop: 0.176
Targets:
T1: 0.184
T2: 0.189
Why:
Strong breakout, then tight consolidation above support. Buyers are still holding the zone.
Risk:
Lose 0.176, and the breakout starts looking fake.
Simple continuation setup.$XLM TRADE HERE
#TradeSignal #XLMAnalysis
{spot}(XLMUSDT)
{future}(XLMUSDT)
XLM TRADE SETUP FOR SWING TRADE
XLM/USDT – 1H
Bias: Bullish
Entry: 0.177 – 0.179
Stop: 0.176
Targets:
T1: 0.184
T2: 0.189
Why:
Strong breakout, then tight consolidation above support. Buyers are still holding the zone.
Risk:
Lose 0.176, and the breakout starts looking fake.
Simple continuation setup.$XLM TRADE HERE
#TradeSignal #XLMAnalysis
Bias: Bullish
Entry: 0.177 – 0.179
Stop: 0.176
Targets:
T1: 0.184
T2: 0.189
Why:
Strong breakout, then tight consolidation above support. Buyers are still holding the zone.
Risk:
Lose 0.176, and the breakout starts looking fake.
Simple continuation setup.$XLM TRADE HERE
#TradeSignal #XLMAnalysis
1
465
Log in to explore more content
Join global crypto users on Binance Square
⚡️ Get latest and useful information about crypto.
💬 Trusted by the world’s largest crypto exchange.
👍 Discover real insights from verified creators.
Email / Phone number
Trending Topics
1
#A Packed Week of Earnings and Data Tests Markets
13,355 views
139 Discussing
2
#AnthropicIPOTestsInvestorAppetiteForAI
9,133 views
266 Discussing
3
#HuangReportedlyConsidersReturnToNvidia
30,277 views
464 Discussing
4
#CryptoSelloffTriggersMultipleWhaleLiquidations
313,848 views
2,505 Discussing
5
#BitcoinSpotETFsPost$1.065BOutflowsForThirdStraightWeek
3,342 views
70 Discussing
6
#About64000BitcoinMiningMachinesReportedlyHijacked
25,597 views
324 Discussing
7
#USSpotXRPETFsSeeLargestWeeklyOutflowIn8Months
241,921 views
1,927 Discussing
8
#WillFOMCMinutesReinforceRateHikeExpectations?
91,913 views
979 Discussing
9
#BitcoinActiveSupplyInProfitDropsBelow45%
316,480 views
2,136 Discussing
10
#KavaSaysAbnormalActivityLimitedToKavaLend
206,501 views
1,199 Discussing