
#tradesetup
tradesetup
4.4M views
35,381 Discussing
Hot
Latest

·
--
Bearish
A 300% pump in 24 hours? Gravity always wins, and the trap is set on $JCT ! 🐻
Do not buy this top. Here is my exact Short setup to ride the inevitable bloodbath. 👇
🔴 Short Setup
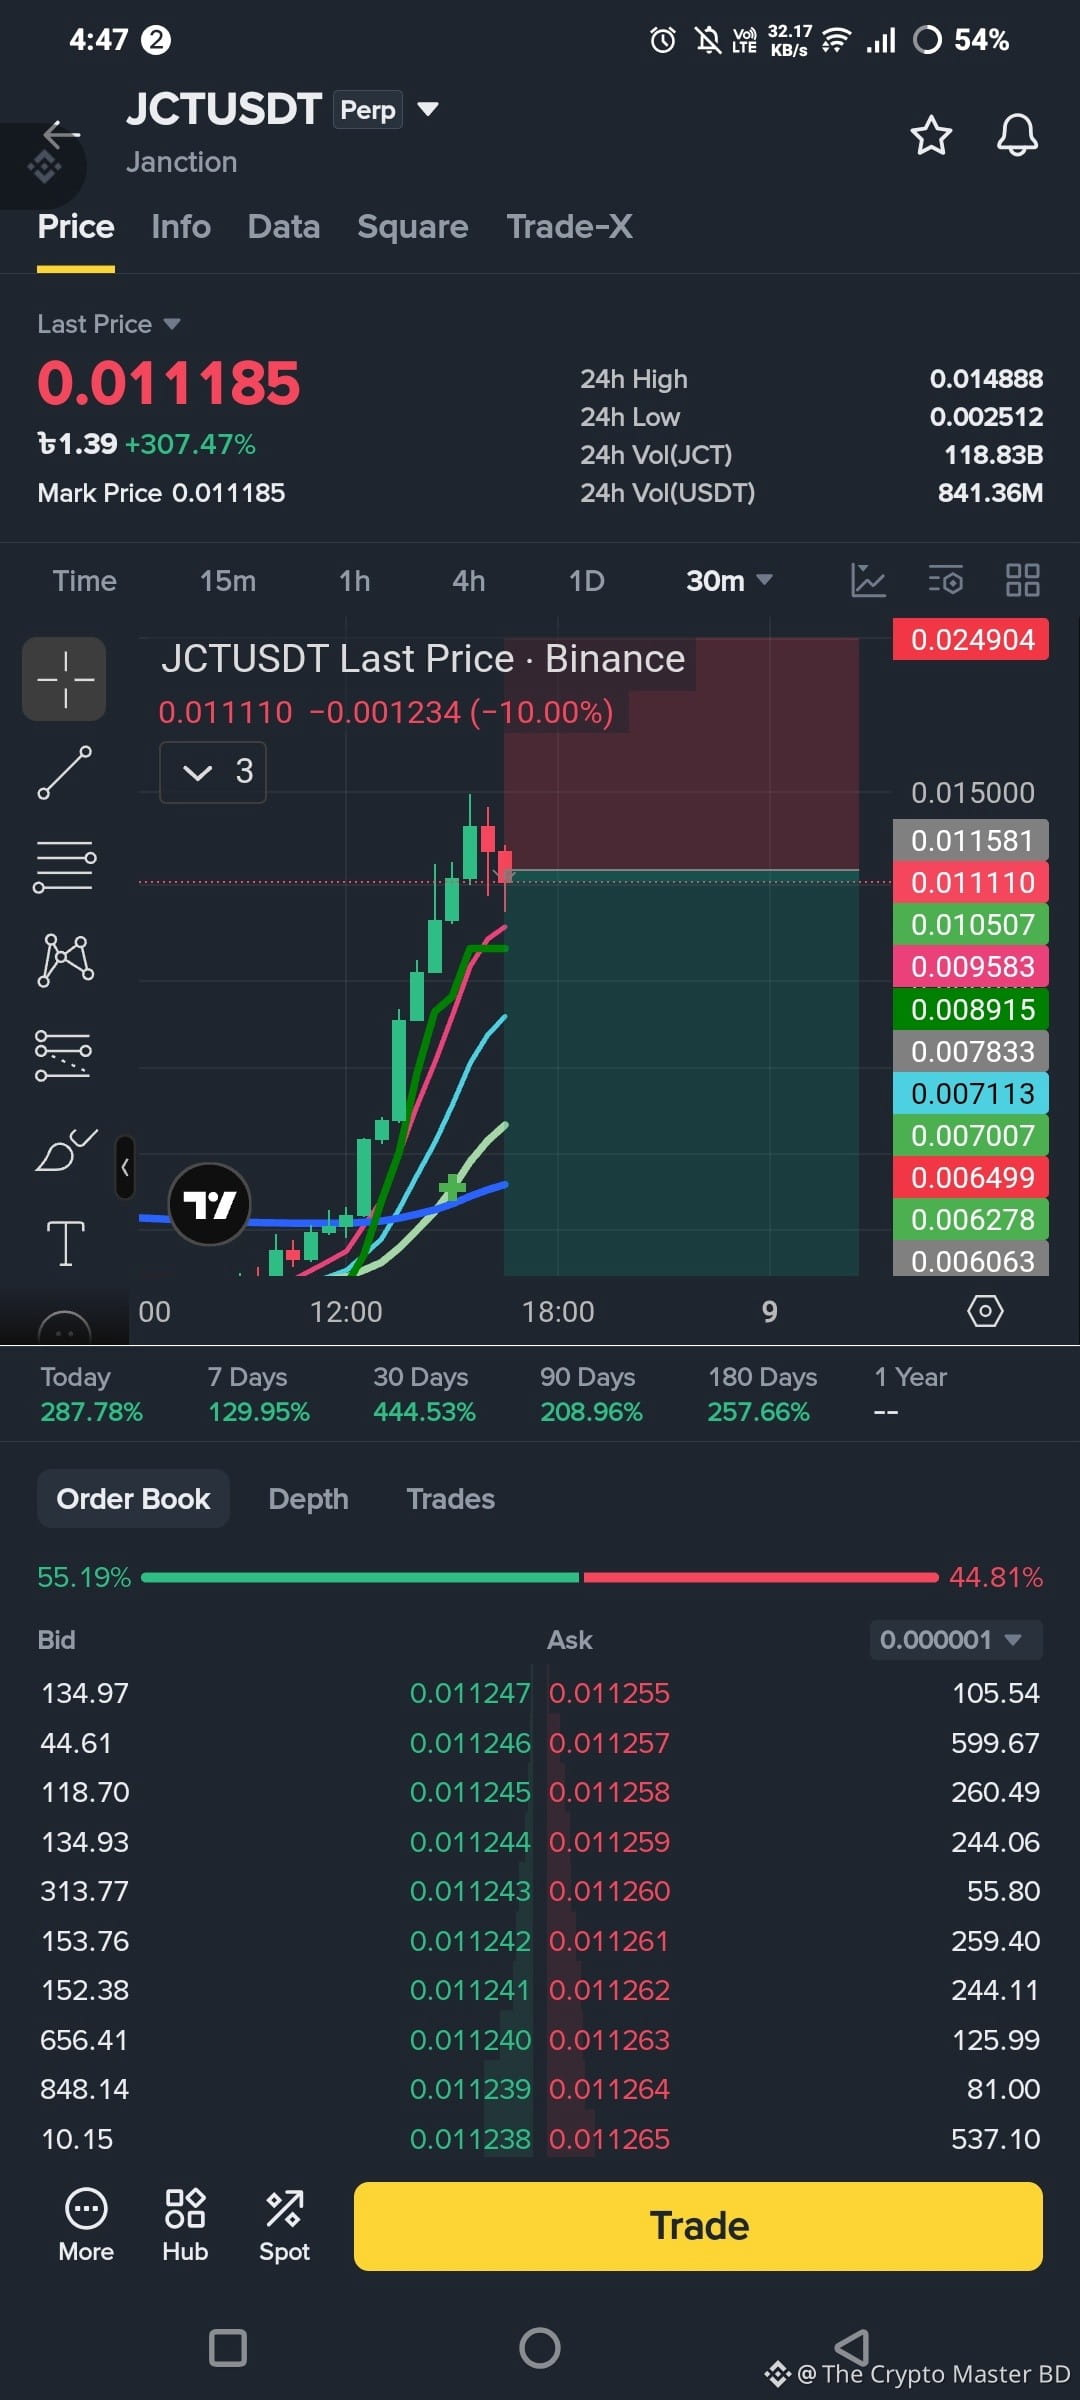
📌 Entry → $0.011600
🎯 TP1 → $0.009000 (-22.4%)
🎯 TP2 → $0.006000 (-48.2%)
✅ Final Target → $0.002000 (-82.7%)
⛔ SL → $0.020000 (+63.7%)
🙇 Plan: Once TP1 hits, close 50% of your position and move the Stop Loss straight to entry. The rest runs risk-free!
💪 Why I'm taking this: Look at the chart. JCT went absolutely parabolic, pumping over 300% to hit $0.014888. But the music has stopped. The 30m chart just printed a massive red rejection candle, dropping 10% instantly. When a low-cap coin pumps this hard, it's a classic liquidity trap. Retail gets greedy, and smart money dumps on them. The order book is already showing weakness, and the path of least resistance is now down.
⚠️ One thing to respect: Shorting a freshly pumped coin is extremely dangerous. The volatility is insane. If the bulls somehow push it back above $0.019000, the bears are dead. Use strict risk management and ALWAYS respect the stop loss!
$JCT #CryptoTrading #tradesetup
{future}(JCTUSDT)
A 300% pump in 24 hours? Gravity always wins, and the trap is set on $JCT ! 🐻
Do not buy this top. Here is my exact Short setup to ride the inevitable bloodbath. 👇
🔴 Short Setup
📌 Entry → $0.011600
🎯 TP1 → $0.009000 (-22.4%)
🎯 TP2 → $0.006000 (-48.2%)
✅ Final Target → $0.002000 (-82.7%)
⛔ SL → $0.020000 (+63.7%)
🙇 Plan: Once TP1 hits, close 50% of your position and move the Stop Loss straight to entry. The rest runs risk-free!
💪 Why I'm taking this: Look at the chart. JCT went absolutely parabolic, pumping over 300% to hit $0.014888. But the music has stopped. The 30m chart just printed a massive red rejection candle, dropping 10% instantly. When a low-cap coin pumps this hard, it's a classic liquidity trap. Retail gets greedy, and smart money dumps on them. The order book is already showing weakness, and the path of least resistance is now down.
⚠️ One thing to respect: Shorting a freshly pumped coin is extremely dangerous. The volatility is insane. If the bulls somehow push it back above $0.019000, the bears are dead. Use strict risk management and ALWAYS respect the stop loss!
$JCT #CryptoTrading #tradesetup
Do not buy this top. Here is my exact Short setup to ride the inevitable bloodbath. 👇
🔴 Short Setup
📌 Entry → $0.011600
🎯 TP1 → $0.009000 (-22.4%)
🎯 TP2 → $0.006000 (-48.2%)
✅ Final Target → $0.002000 (-82.7%)
⛔ SL → $0.020000 (+63.7%)
🙇 Plan: Once TP1 hits, close 50% of your position and move the Stop Loss straight to entry. The rest runs risk-free!
💪 Why I'm taking this: Look at the chart. JCT went absolutely parabolic, pumping over 300% to hit $0.014888. But the music has stopped. The 30m chart just printed a massive red rejection candle, dropping 10% instantly. When a low-cap coin pumps this hard, it's a classic liquidity trap. Retail gets greedy, and smart money dumps on them. The order book is already showing weakness, and the path of least resistance is now down.
⚠️ One thing to respect: Shorting a freshly pumped coin is extremely dangerous. The volatility is insane. If the bulls somehow push it back above $0.019000, the bears are dead. Use strict risk management and ALWAYS respect the stop loss!
$JCT #CryptoTrading #tradesetup
CreepTo_Tiger:
Ojala nadie haya puesto ese SL…
10
1
1
1.6k

·
--
$ON Short: price poked above the old high and rolled over, target 0.2279
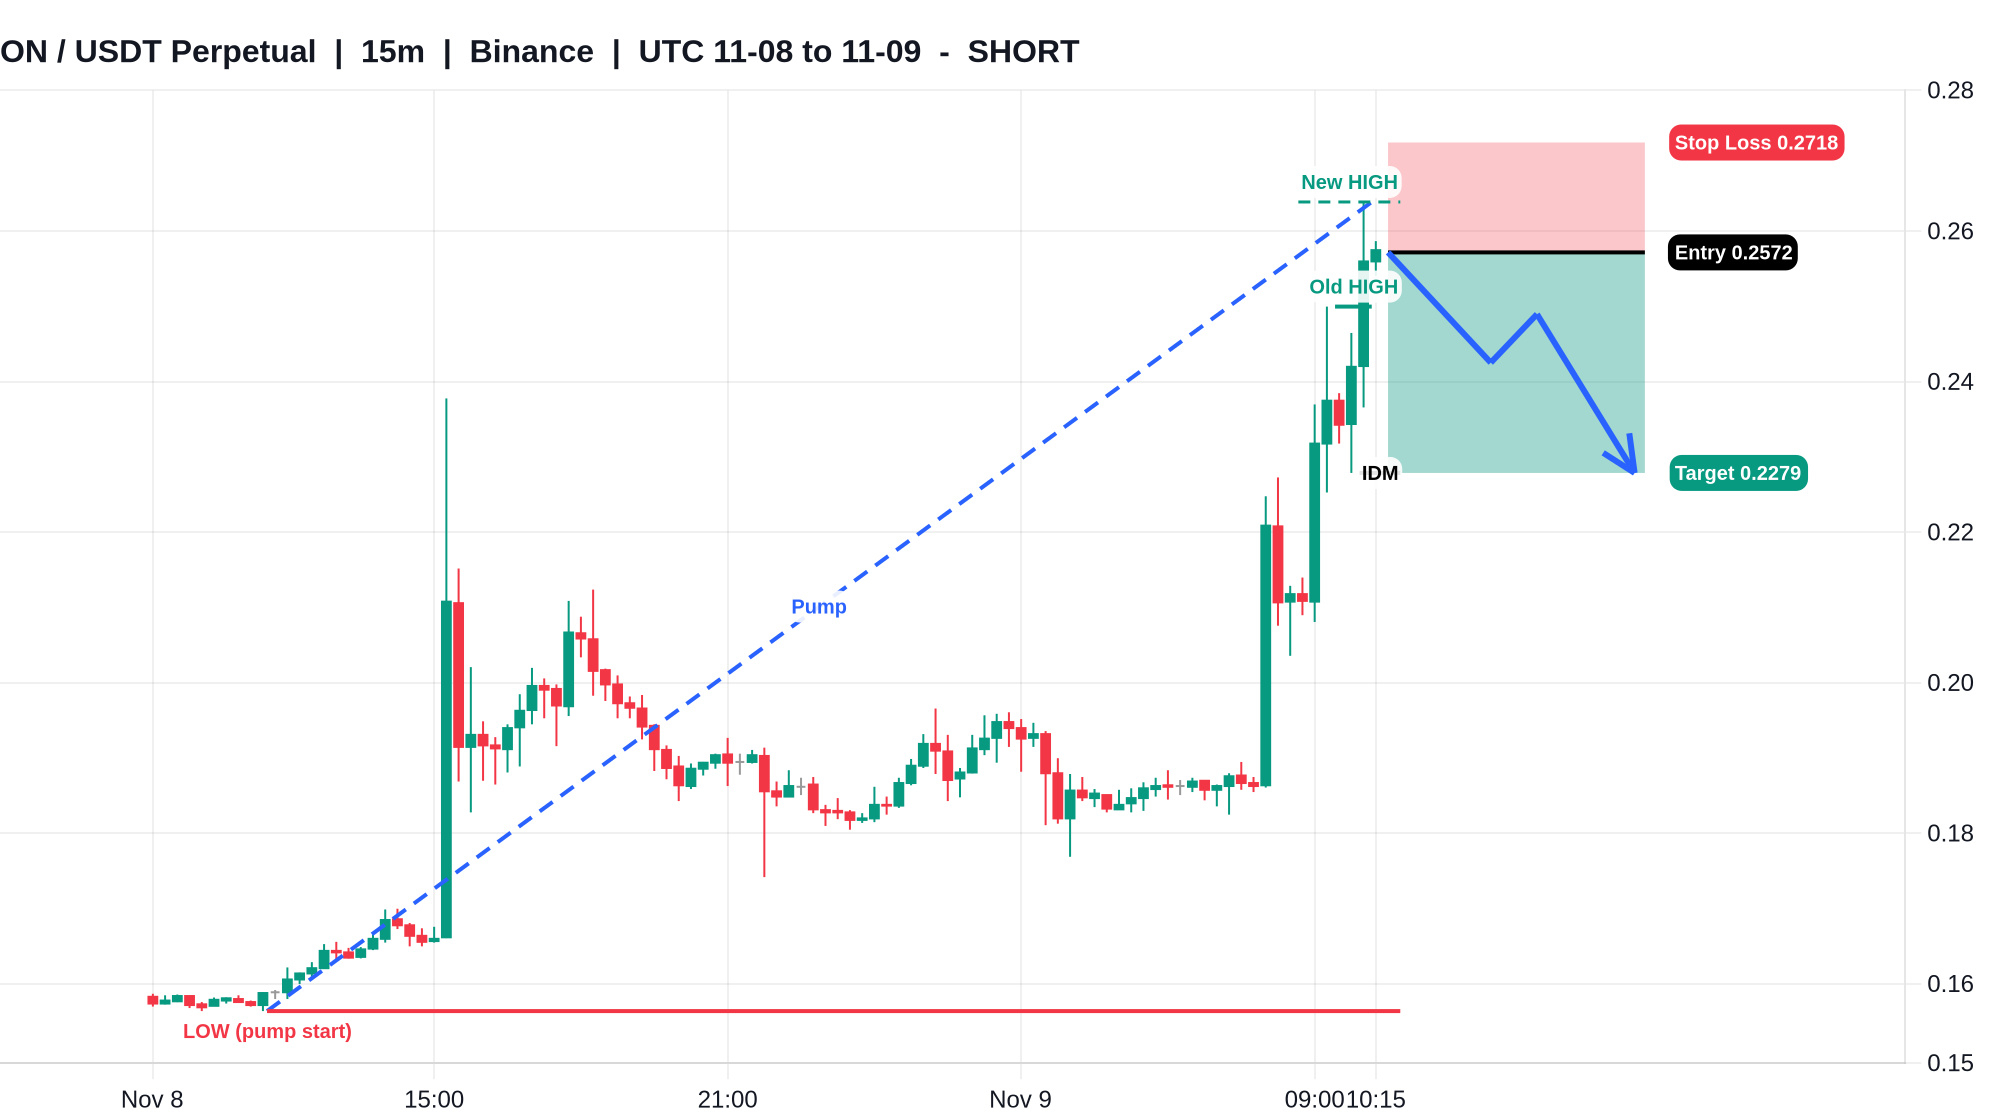
🔴 Short - sell 0.2572, stop level 0.2718, take profit 0.2279 (1:2)
Big pump on ON: 69% from the low in 23 hours, 64% on the day. That break of 0.25 was small (5.6%), a quick poke and a sell-off from 0.2639. Looks like a failed breakout to me. Stop 0.2718, target 0.2279. Risking 5.68% for roughly 2 times that. Not chasing if it runs away from the entry.
#ON #TradeSetup #FuturesTrading
$ON Short: price poked above the old high and rolled over, target 0.2279
🔴 Short - sell 0.2572, stop level 0.2718, take profit 0.2279 (1:2)
Big pump on ON: 69% from the low in 23 hours, 64% on the day. That break of 0.25 was small (5.6%), a quick poke and a sell-off from 0.2639. Looks like a failed breakout to me. Stop 0.2718, target 0.2279. Risking 5.68% for roughly 2 times that. Not chasing if it runs away from the entry.
#ON #TradeSetup #FuturesTrading
🔴 Short - sell 0.2572, stop level 0.2718, take profit 0.2279 (1:2)
Big pump on ON: 69% from the low in 23 hours, 64% on the day. That break of 0.25 was small (5.6%), a quick poke and a sell-off from 0.2639. Looks like a failed breakout to me. Stop 0.2718, target 0.2279. Risking 5.68% for roughly 2 times that. Not chasing if it runs away from the entry.
#ON #TradeSetup #FuturesTrading
201

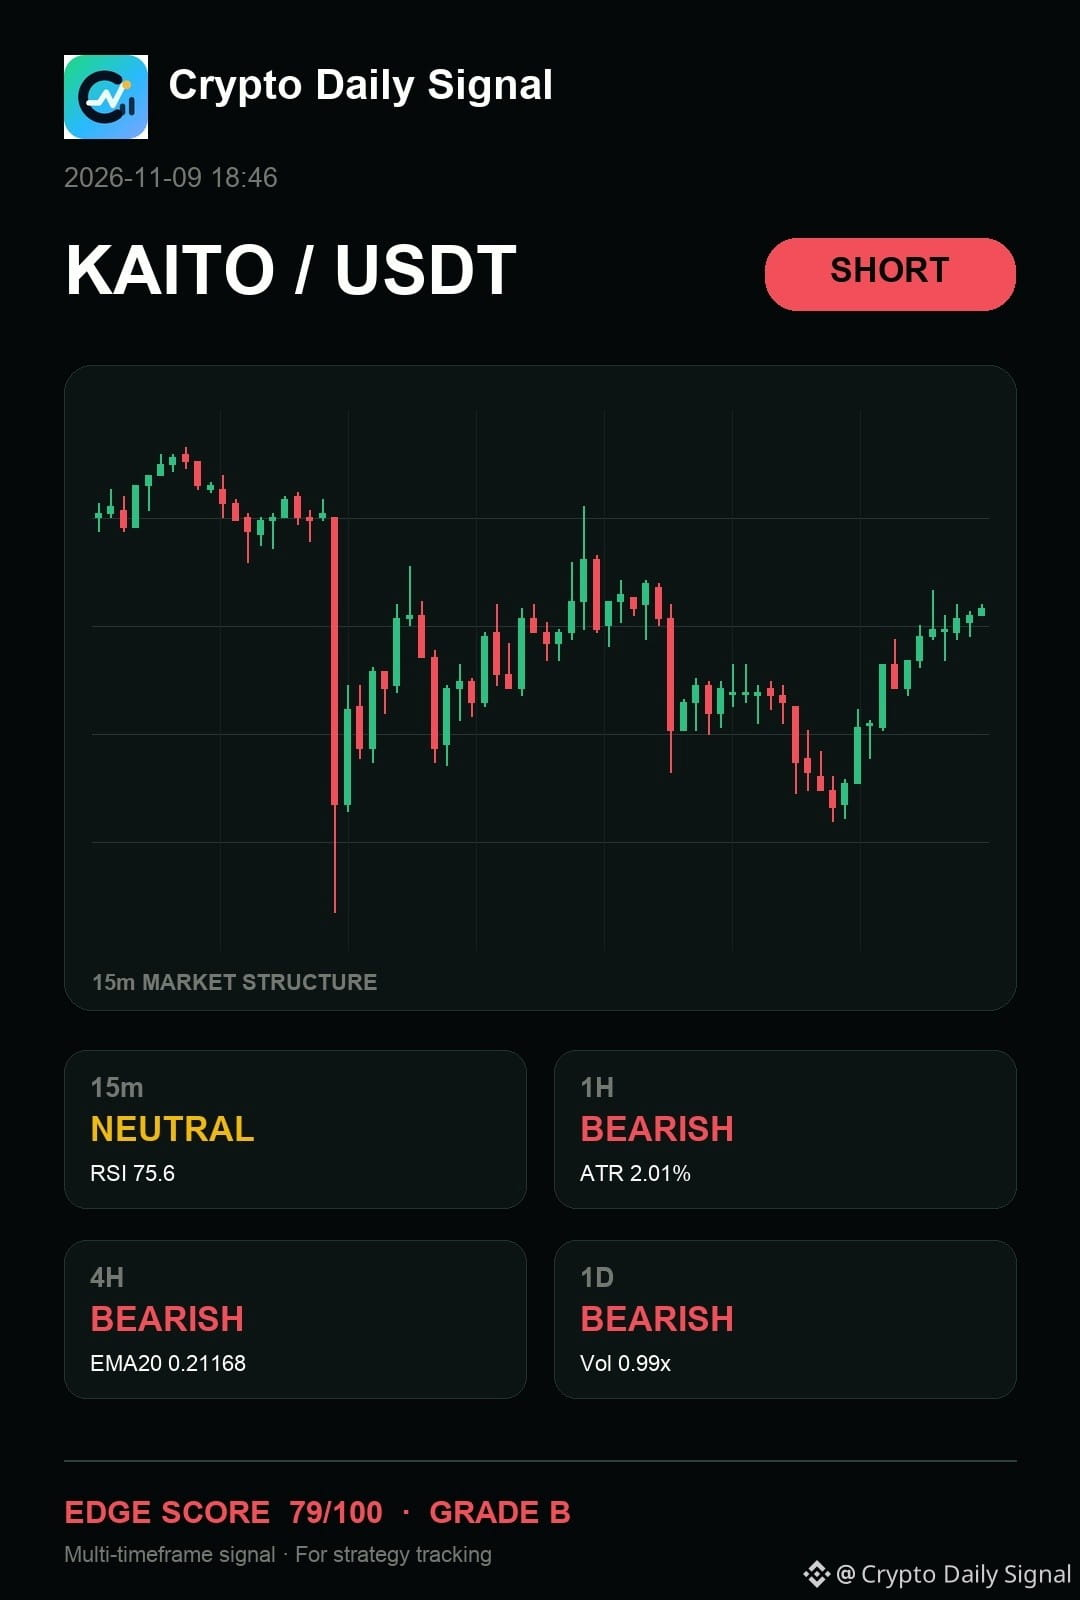
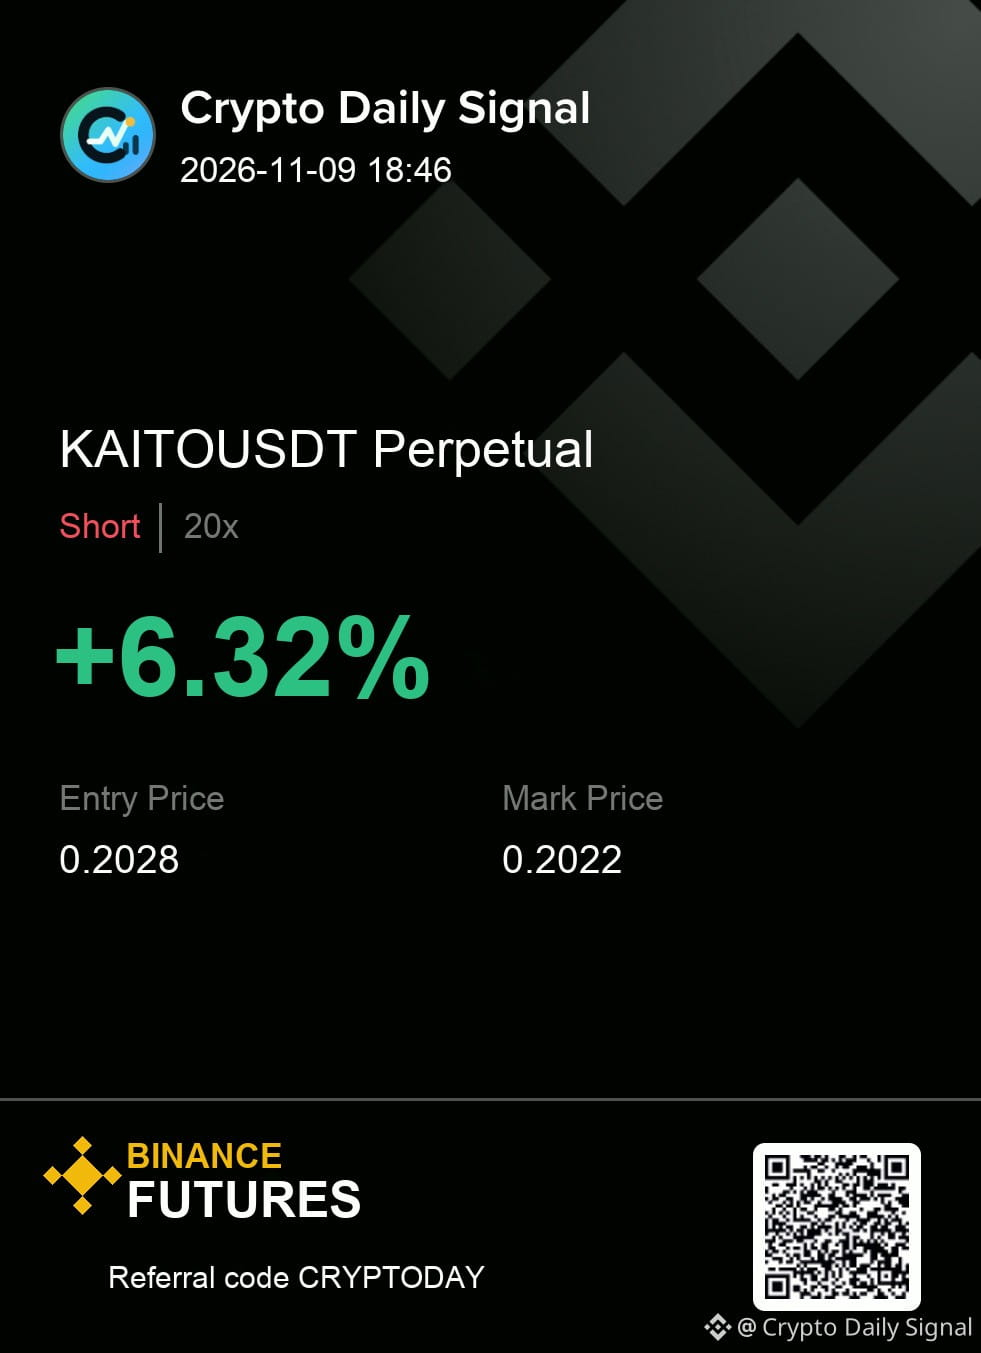
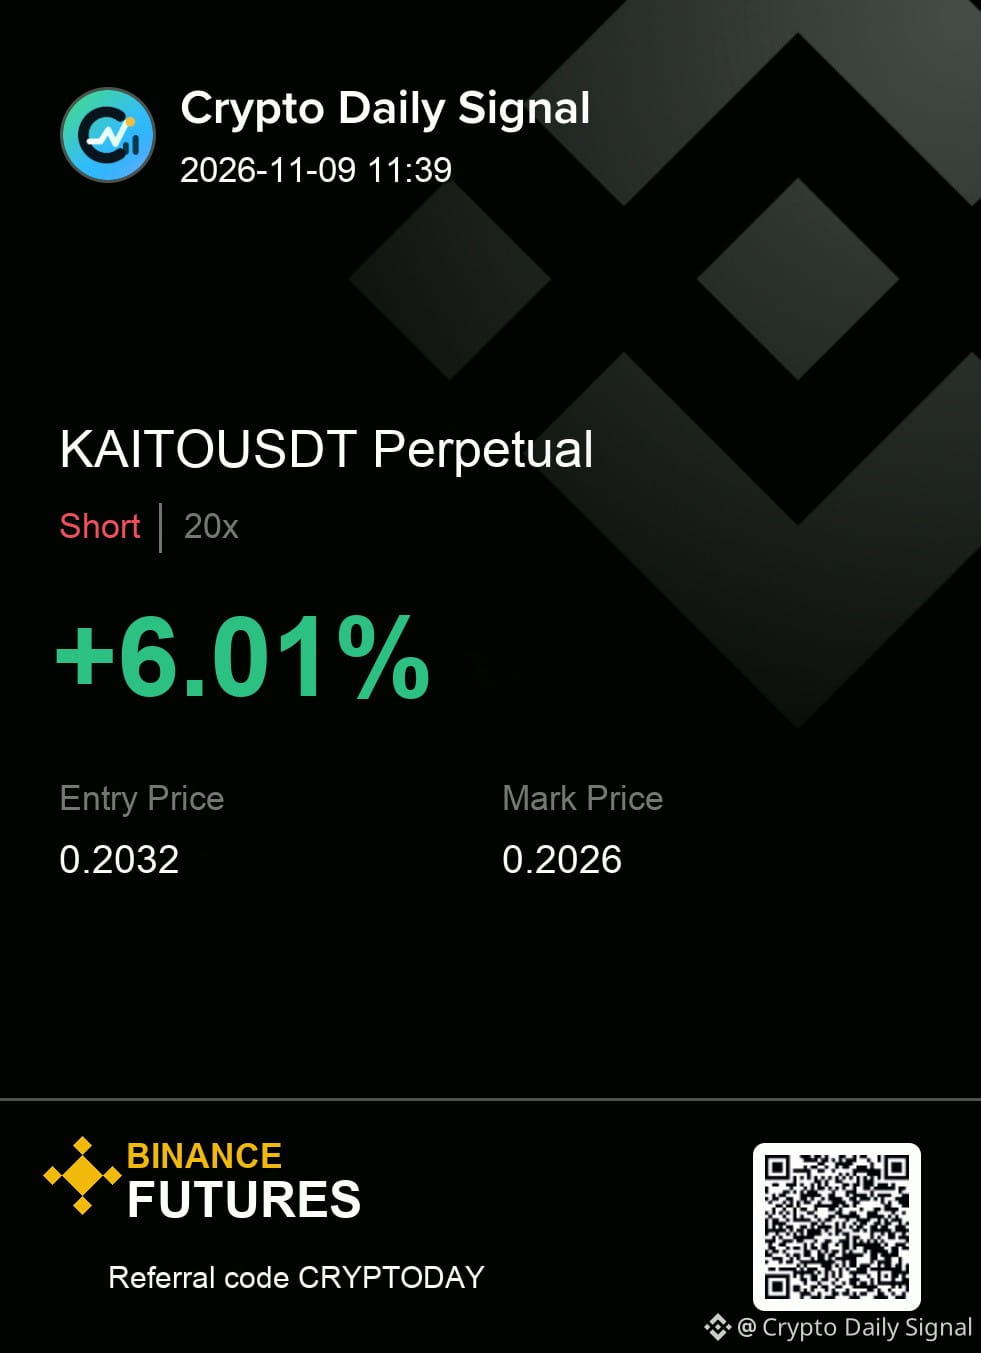
$KAITO — quick take, I still think it requires patience before the short is actionable because while the wider charts maintain a bearish tilt, the momentum on the short-term scale isn't aggressively pushing lower. A strong close above the last local high would instantly invalidate the bearish setup, but holding below that range floor suggests the downward move has more steam to run.
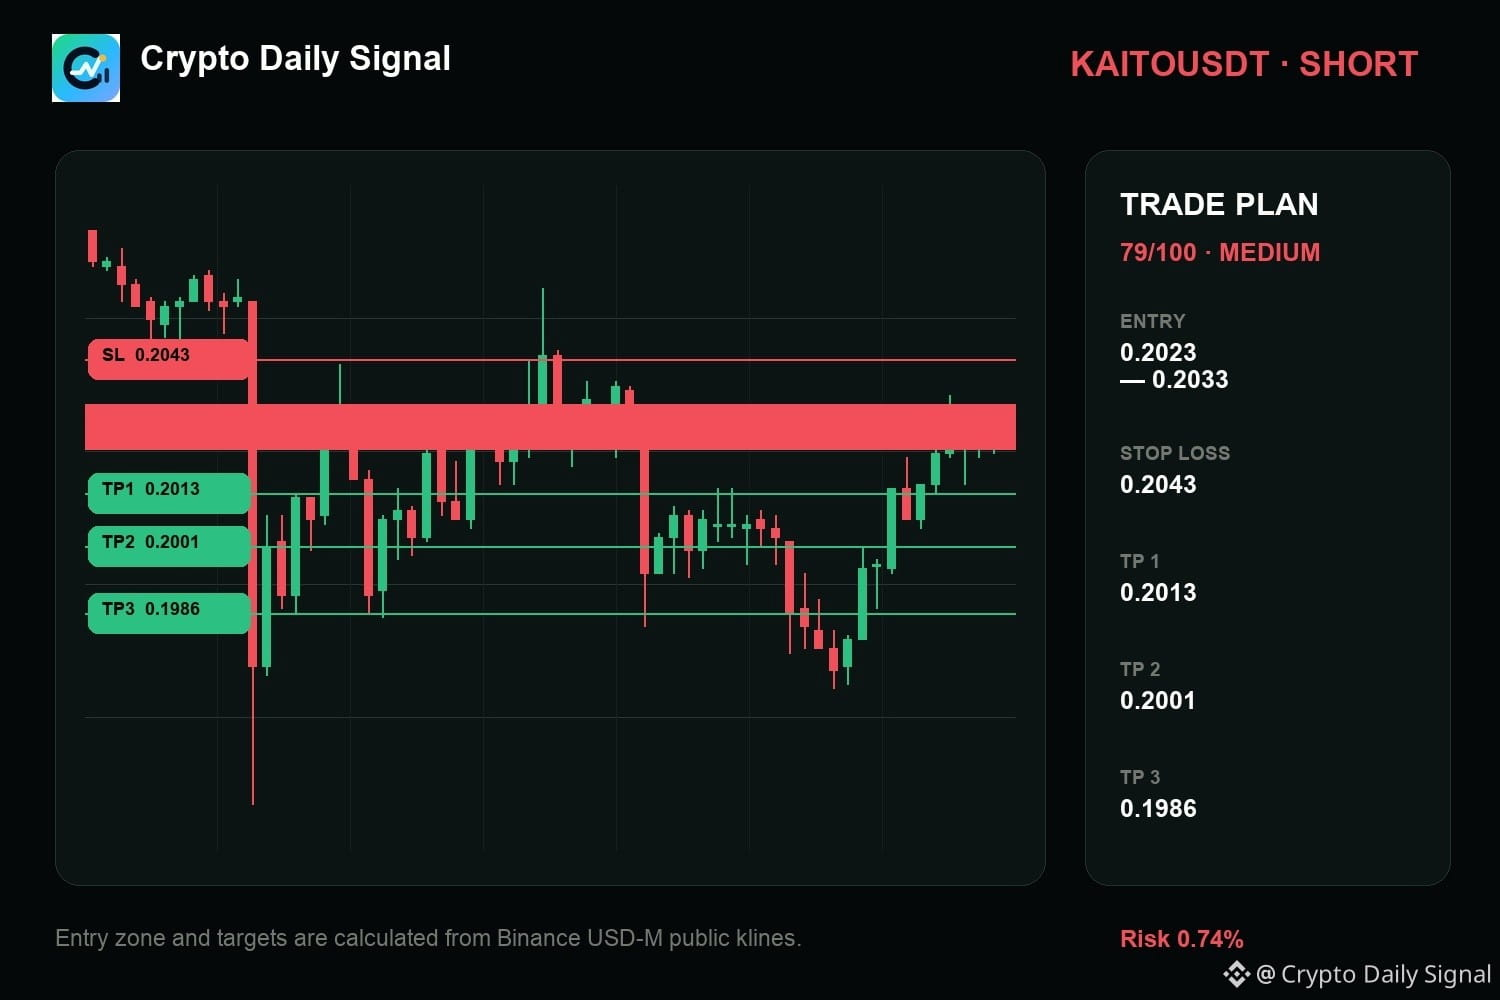
Trade Plan — KAITOUSDT SHORT
Entry: 0.2023 - 0.2033
Stop Loss: 0.2043
TP1: 0.2013 | TP2: 0.2001 | TP3: 0.1986
#TradeSetup
{future}(KAITOUSDT)
$KAITO — quick take, I still think it requires patience before the short is actionable because while the wider charts maintain a bearish tilt, the momentum on the short-term scale isn't aggressively pushing lower. A strong close above the last local high would instantly invalidate the bearish setup, but holding below that range floor suggests the downward move has more steam to run.
Trade Plan — KAITOUSDT SHORT
Entry: 0.2023 - 0.2033
Stop Loss: 0.2043
TP1: 0.2013 | TP2: 0.2001 | TP3: 0.1986
#TradeSetup
Trade Plan — KAITOUSDT SHORT
Entry: 0.2023 - 0.2033
Stop Loss: 0.2043
TP1: 0.2013 | TP2: 0.2001 | TP3: 0.1986
#TradeSetup
8
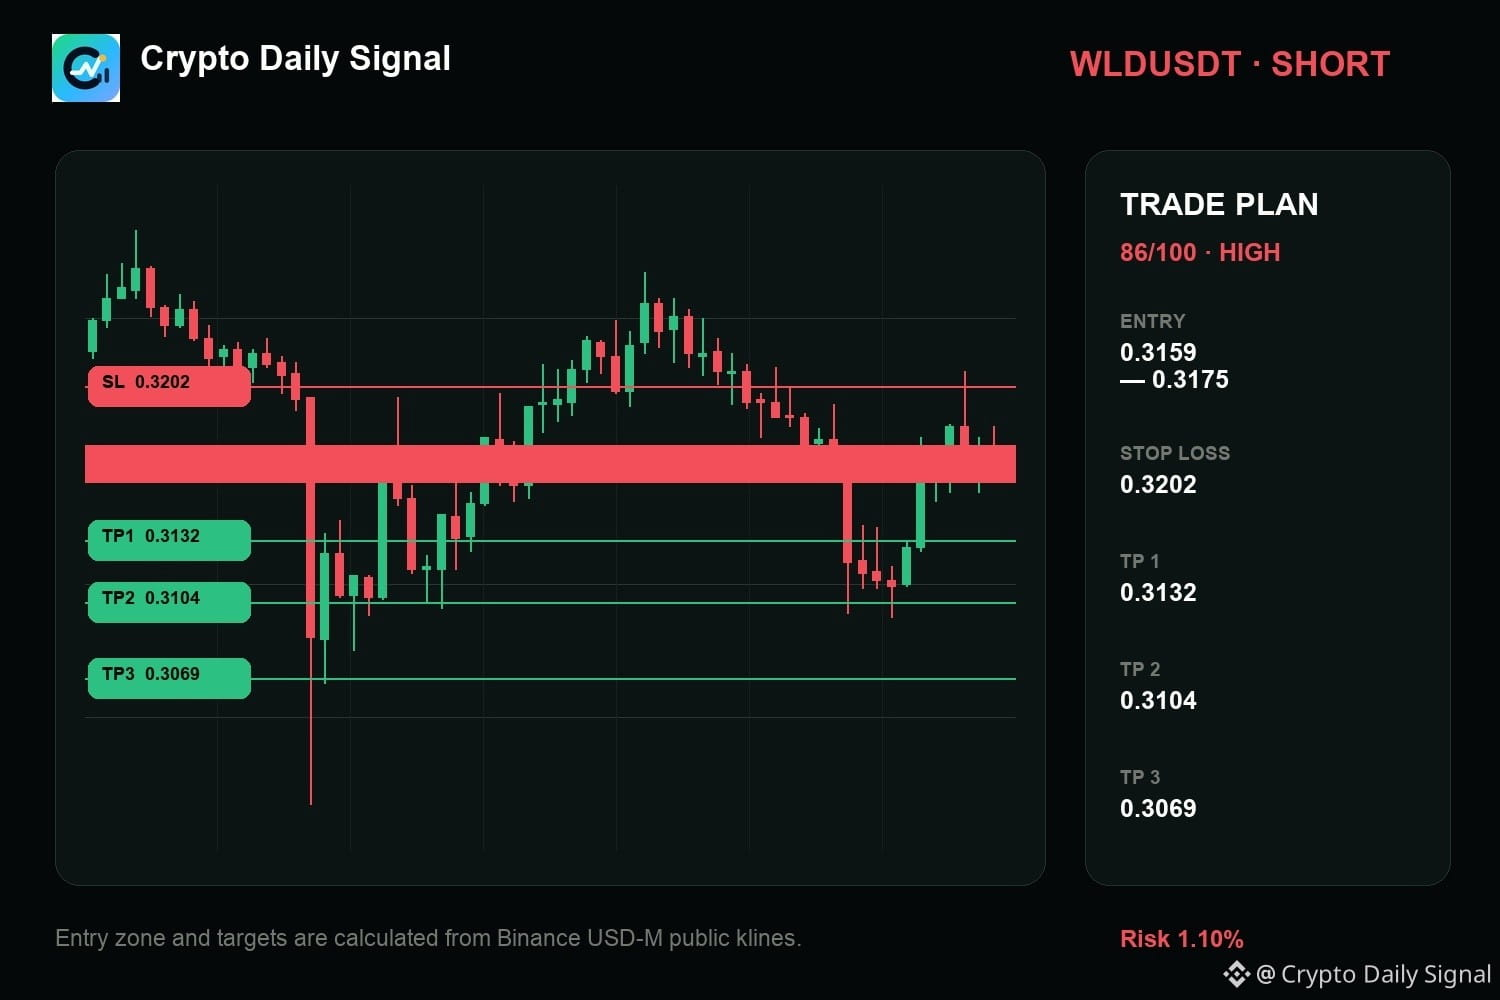
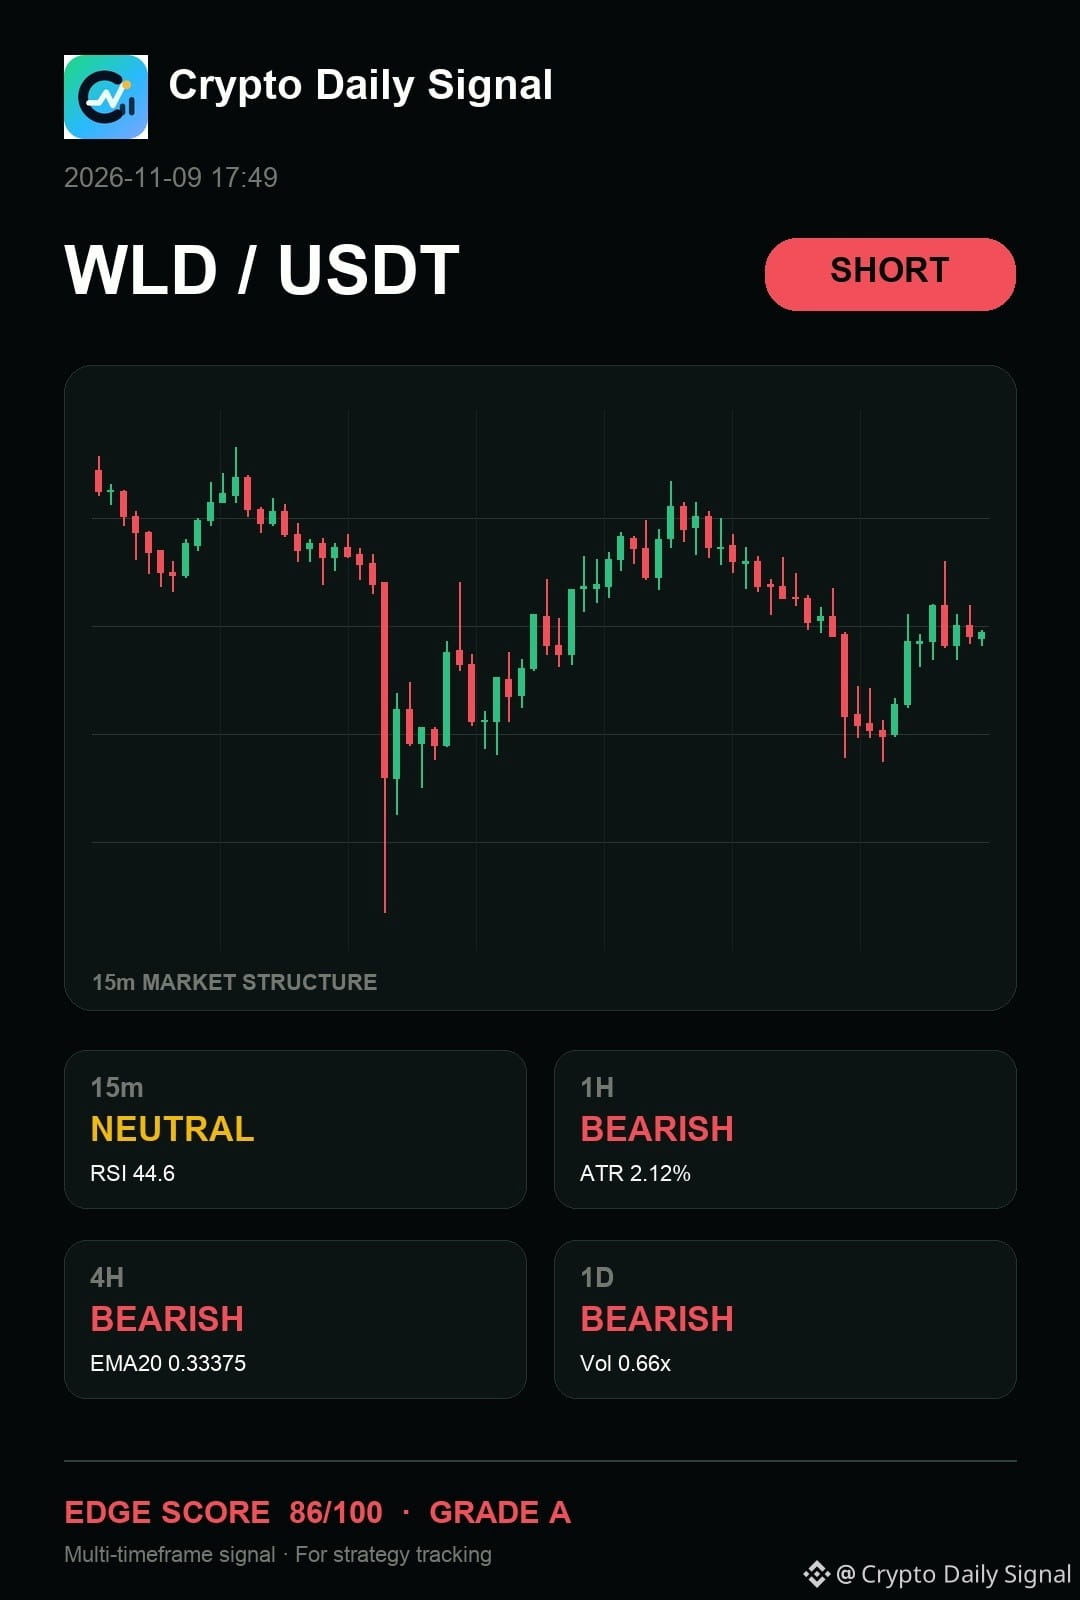
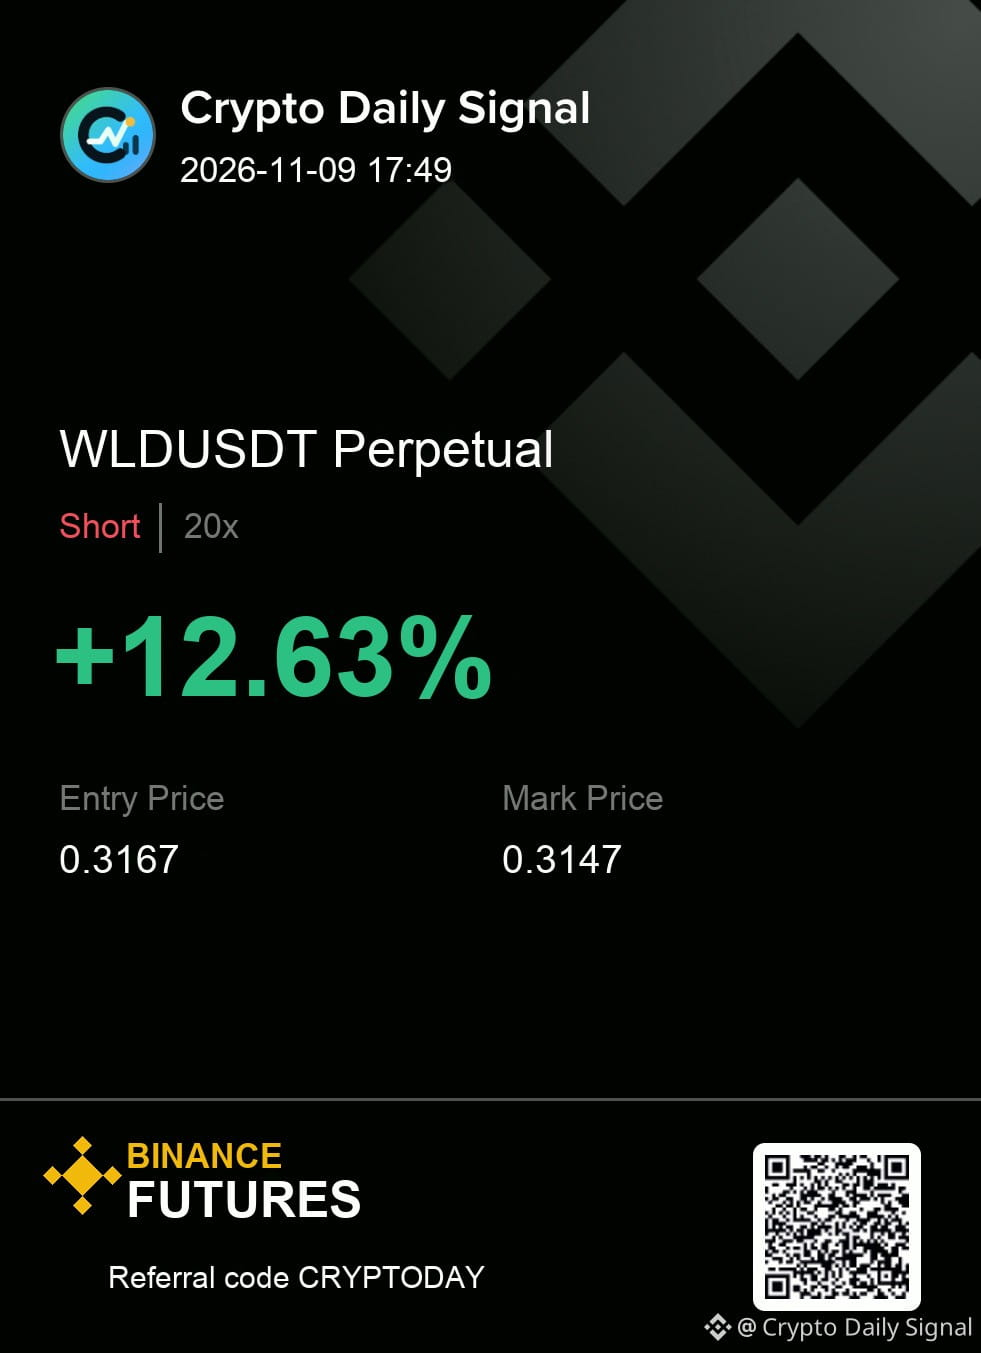
$WLD — right now, I would say it needs confirmation before I press the short. Price is probing the upper edge of its current range, showing a developing trend of lower highs across the hourly and four-hour views. A clear close below that recent range high on a bearish candle is what I need to see to proceed.
My levels for WLDUSDT — SHORT
Entry zone 0.3159 - 0.3175
Risk line 0.3202
Targets 0.3132 / 0.3104 / 0.3069
I am tracking the reaction inside the entry zone. What would make you pass on it?
#TradeSetup
{future}(WLDUSDT)
$WLD — right now, I would say it needs confirmation before I press the short. Price is probing the upper edge of its current range, showing a developing trend of lower highs across the hourly and four-hour views. A clear close below that recent range high on a bearish candle is what I need to see to proceed.
My levels for WLDUSDT — SHORT
Entry zone 0.3159 - 0.3175
Risk line 0.3202
Targets 0.3132 / 0.3104 / 0.3069
I am tracking the reaction inside the entry zone. What would make you pass on it?
#TradeSetup
My levels for WLDUSDT — SHORT
Entry zone 0.3159 - 0.3175
Risk line 0.3202
Targets 0.3132 / 0.3104 / 0.3069
I am tracking the reaction inside the entry zone. What would make you pass on it?
#TradeSetup
7
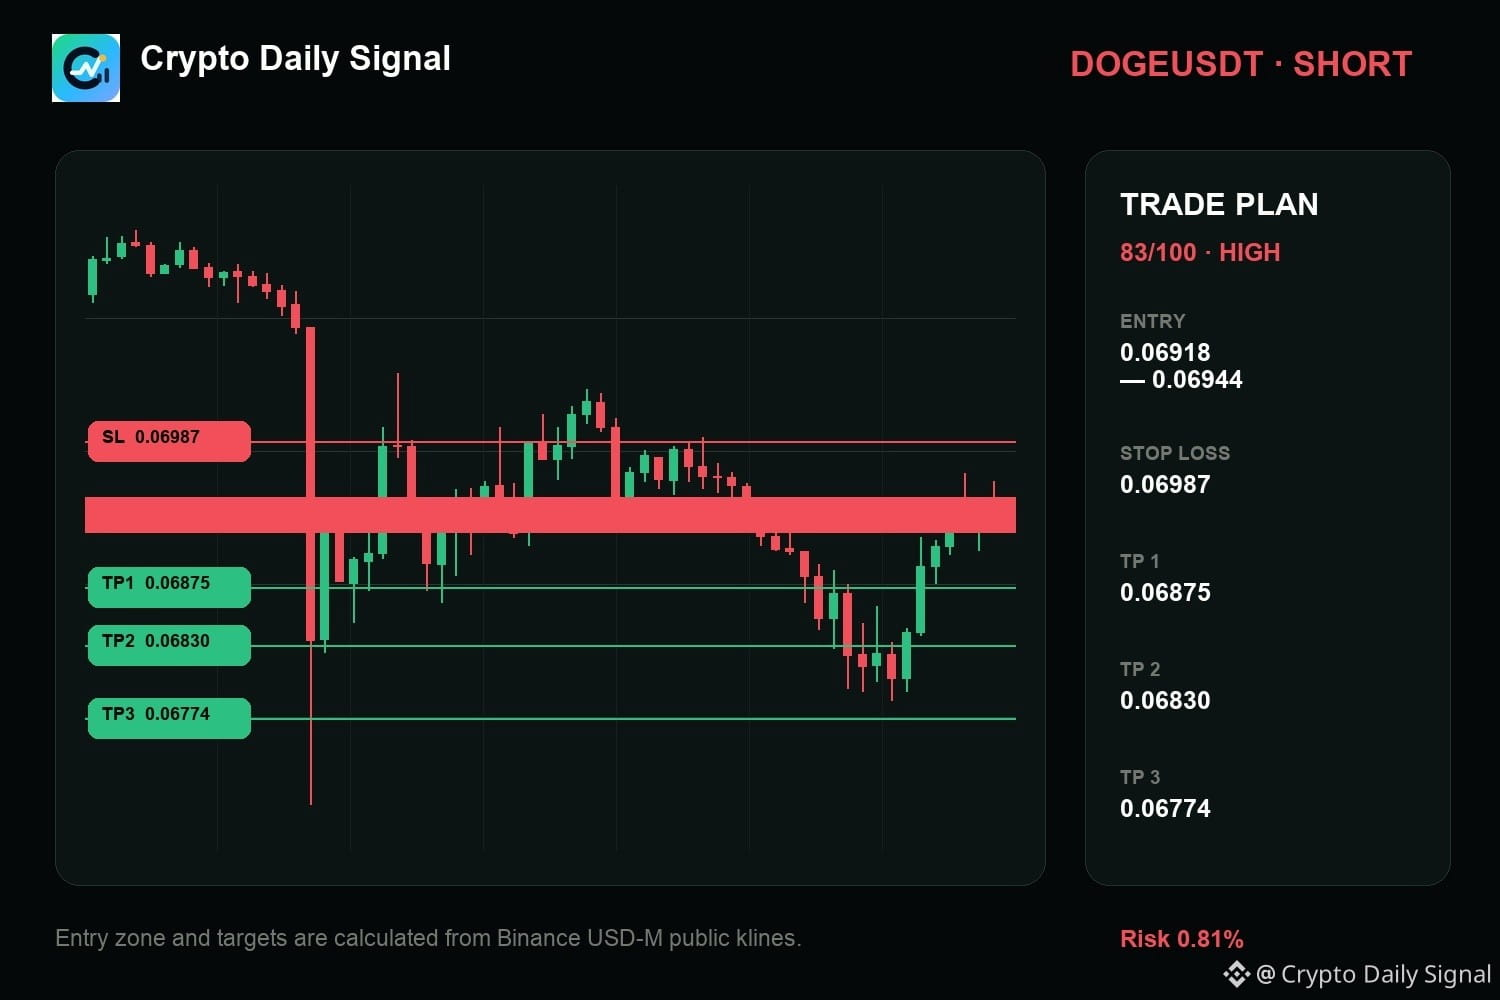
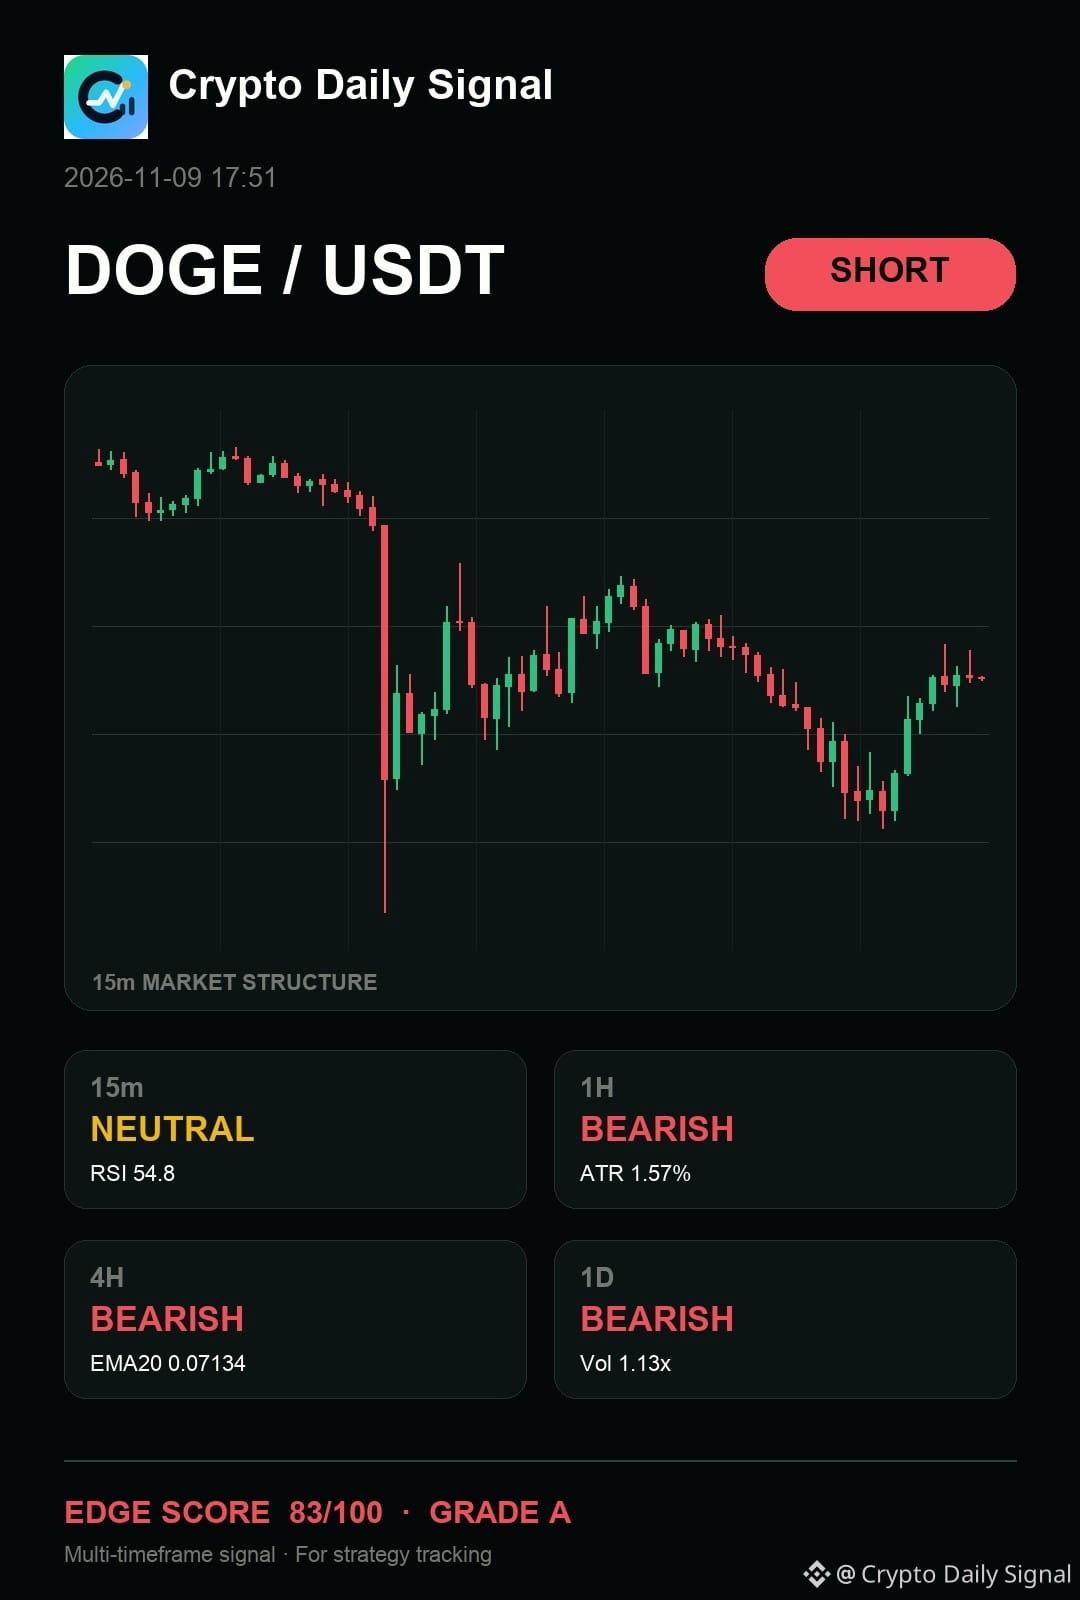
$DOGE — the way I see this move, it still gives sellers the cleaner argument even when you see brief attempts to push higher within the immediate range. The underlying daily and four-hour trends show the pressure is firmly on the downside, demonstrated by the sequence of lower highs. A strong rejection at that lower boundary would make the short signal much more reliable for a move down.
No chase outside the zone; the stop defines the whole idea.
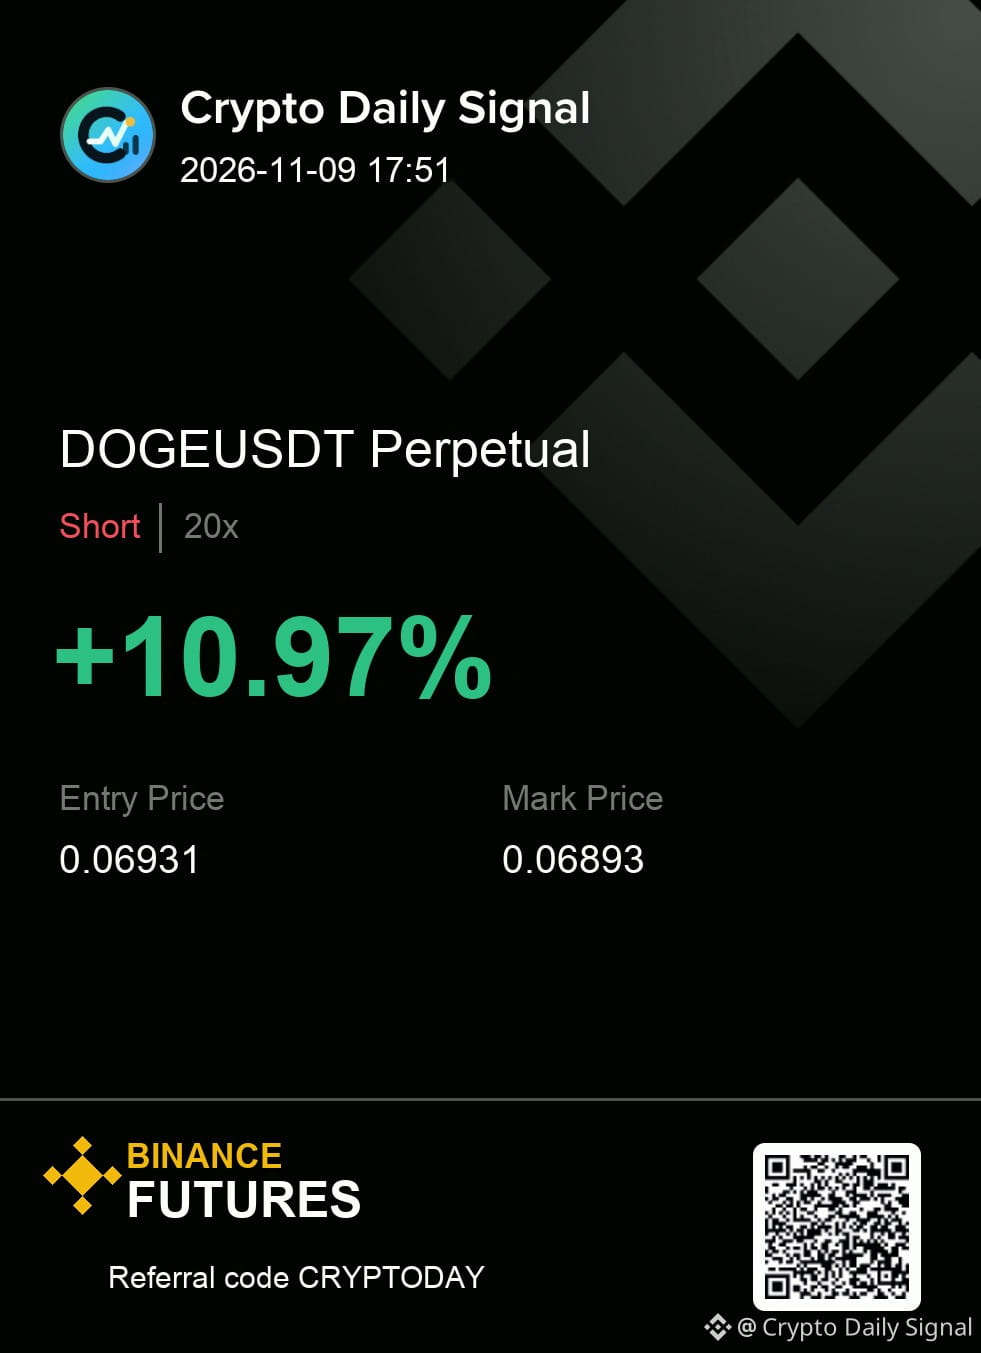
DOGEUSDT SHORT
IN 0.06918 - 0.06944
OUT 0.06987
TP 0.06875 · 0.06830 · 0.06774
#TradeSetup
{future}(DOGEUSDT)
$DOGE — the way I see this move, it still gives sellers the cleaner argument even when you see brief attempts to push higher within the immediate range. The underlying daily and four-hour trends show the pressure is firmly on the downside, demonstrated by the sequence of lower highs. A strong rejection at that lower boundary would make the short signal much more reliable for a move down.
No chase outside the zone; the stop defines the whole idea.
DOGEUSDT SHORT
IN 0.06918 - 0.06944
OUT 0.06987
TP 0.06875 · 0.06830 · 0.06774
#TradeSetup
No chase outside the zone; the stop defines the whole idea.
DOGEUSDT SHORT
IN 0.06918 - 0.06944
OUT 0.06987
TP 0.06875 · 0.06830 · 0.06774
#TradeSetup
5
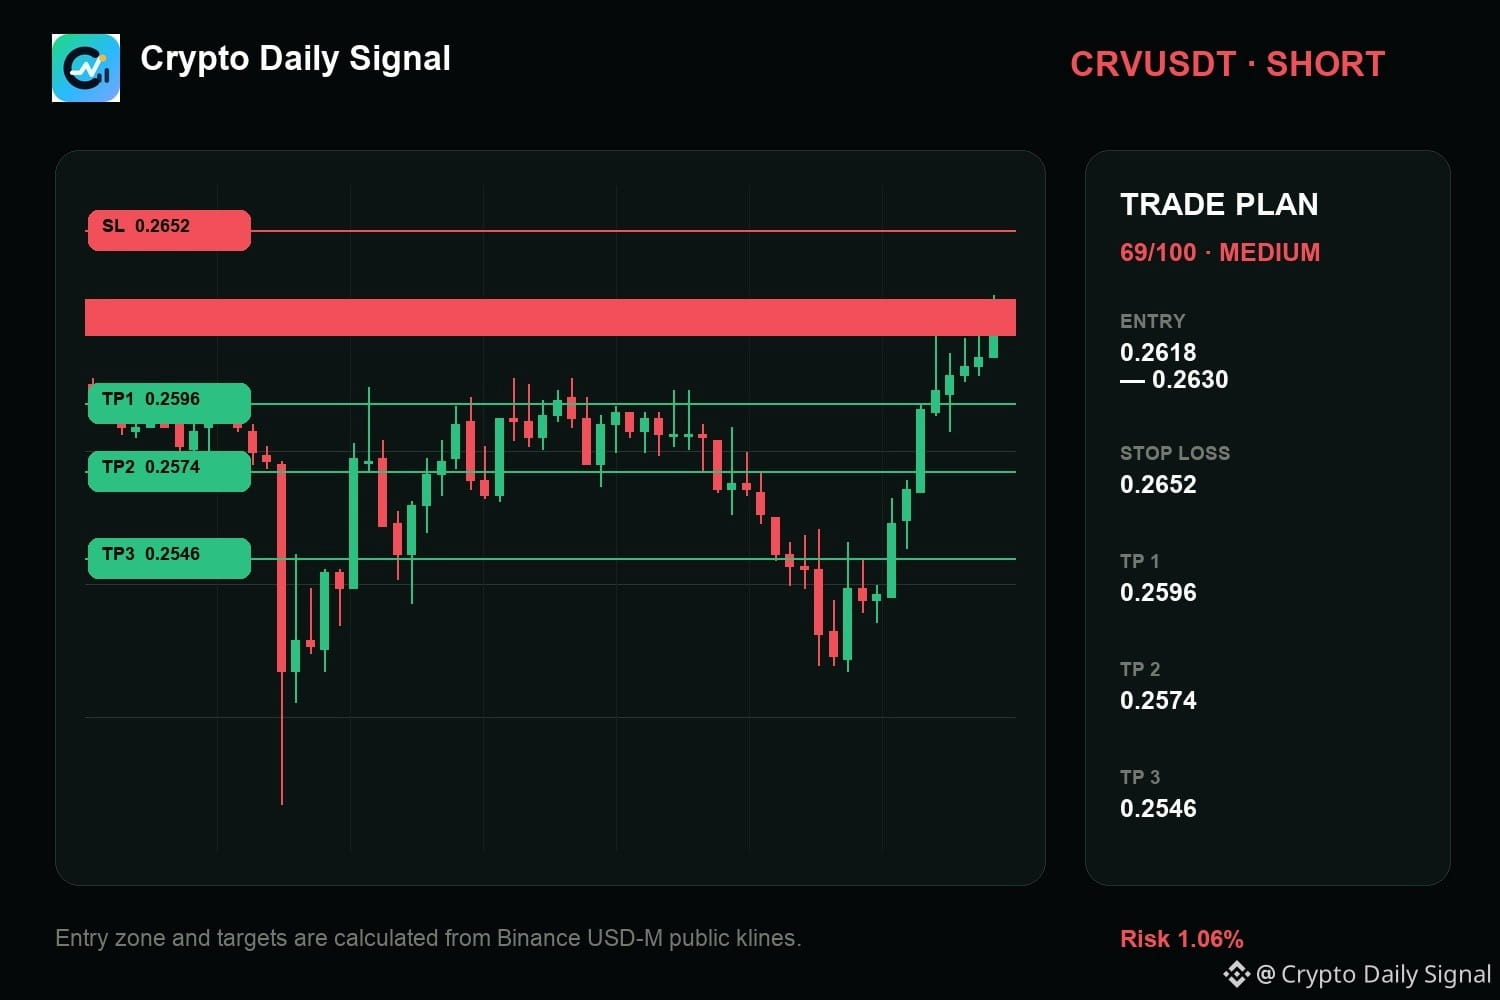
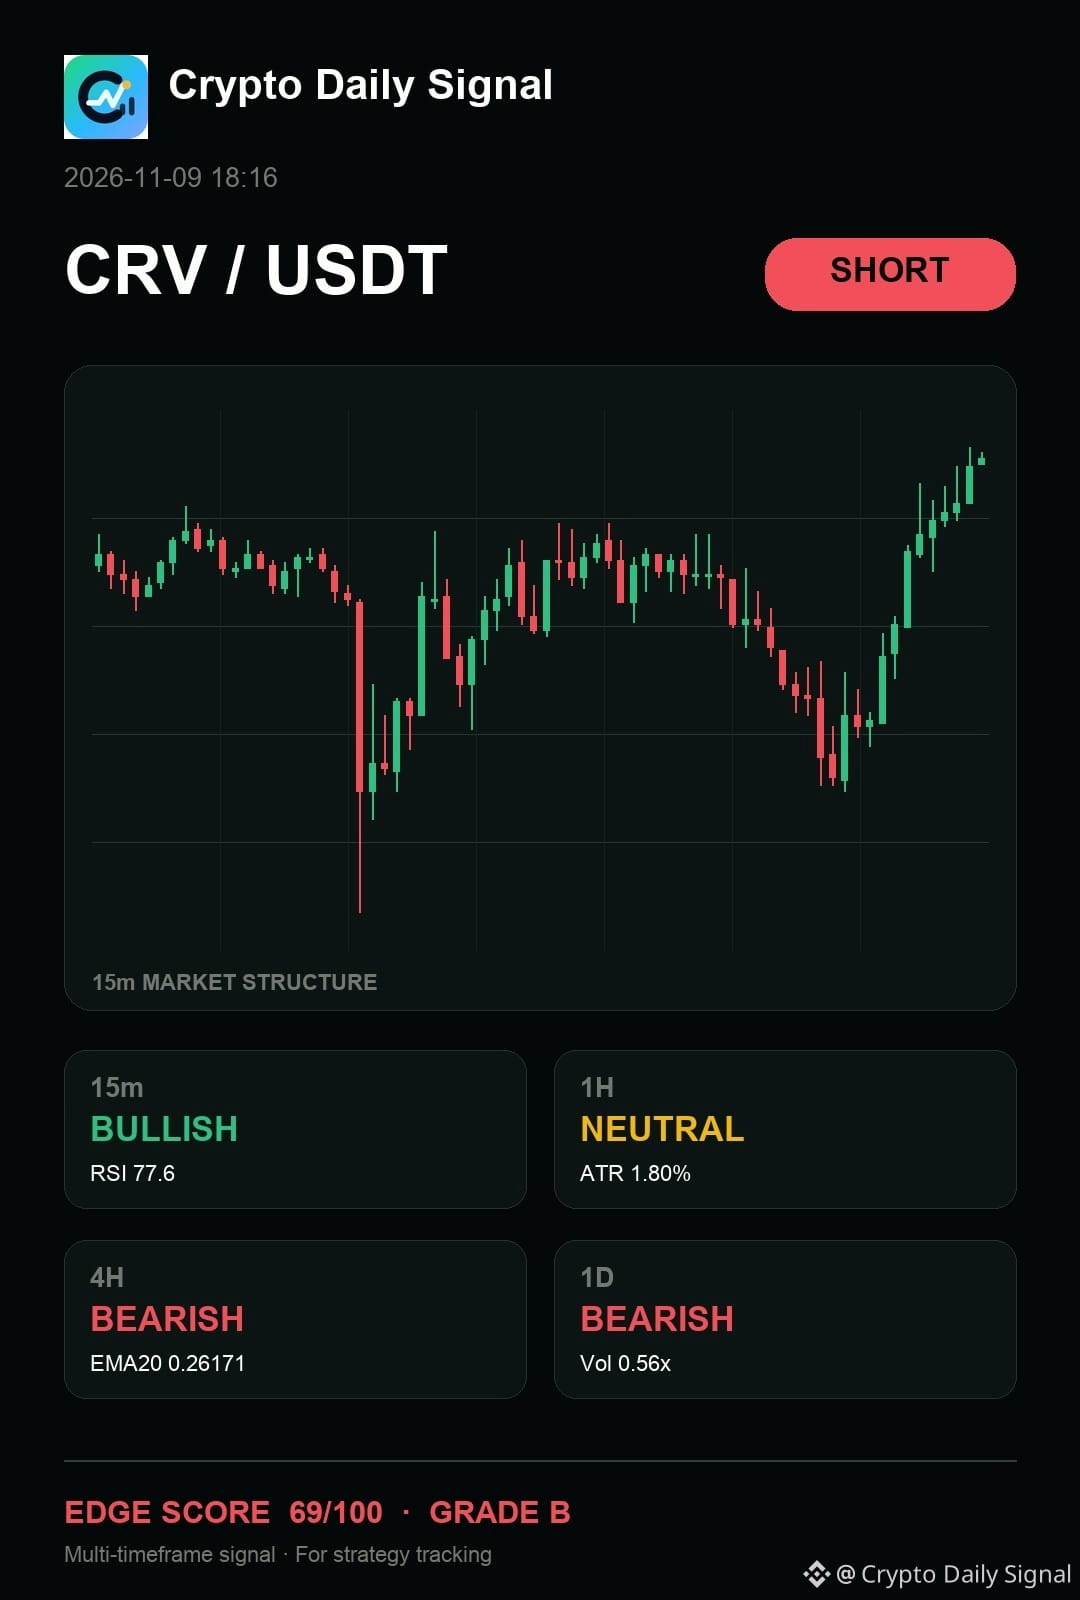
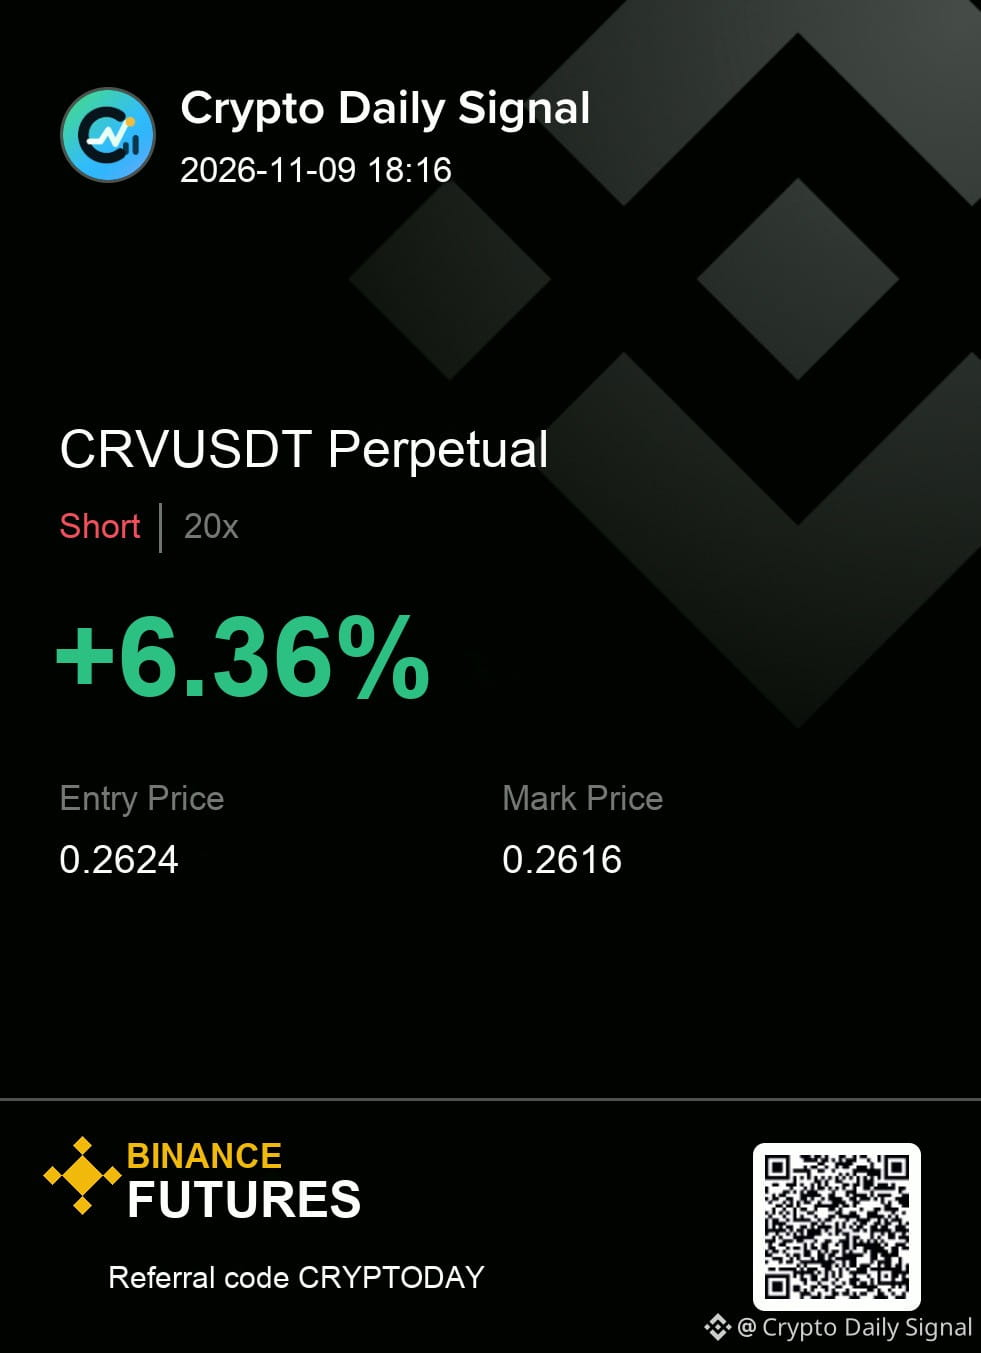
$CRV — from my side, the tape says it continues to favor the short case as the price stays tucked inside a tight trading band. Current rejection wicks suggest downside pressure despite the short-term upward noise. A genuine push below the base of this range would give a much cleaner signal to enter.
Trade Plan — CRVUSDT SHORT
Entry: 0.2618 - 0.2630
Stop Loss: 0.2652
TP1: 0.2596 | TP2: 0.2574 | TP3: 0.2546
What would you need to see before putting risk behind this idea?
#TradeSetup
{future}(CRVUSDT)
$CRV — from my side, the tape says it continues to favor the short case as the price stays tucked inside a tight trading band. Current rejection wicks suggest downside pressure despite the short-term upward noise. A genuine push below the base of this range would give a much cleaner signal to enter.
Trade Plan — CRVUSDT SHORT
Entry: 0.2618 - 0.2630
Stop Loss: 0.2652
TP1: 0.2596 | TP2: 0.2574 | TP3: 0.2546
What would you need to see before putting risk behind this idea?
#TradeSetup
Trade Plan — CRVUSDT SHORT
Entry: 0.2618 - 0.2630
Stop Loss: 0.2652
TP1: 0.2596 | TP2: 0.2574 | TP3: 0.2546
What would you need to see before putting risk behind this idea?
#TradeSetup
8
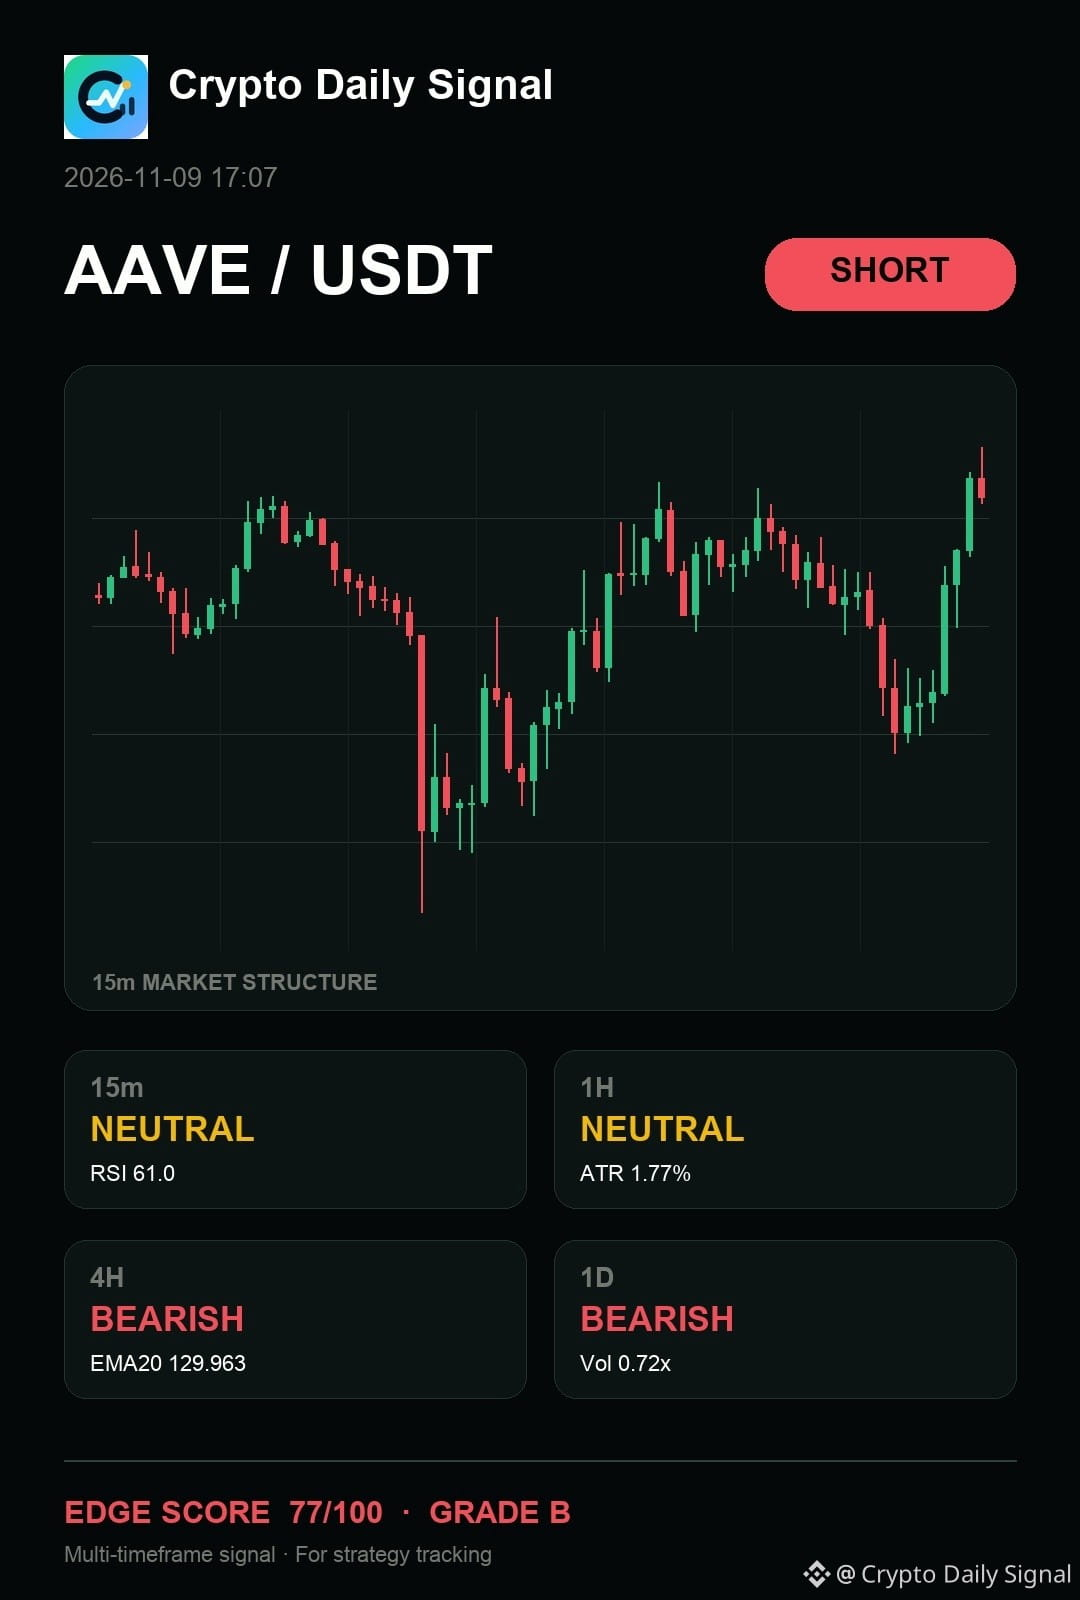
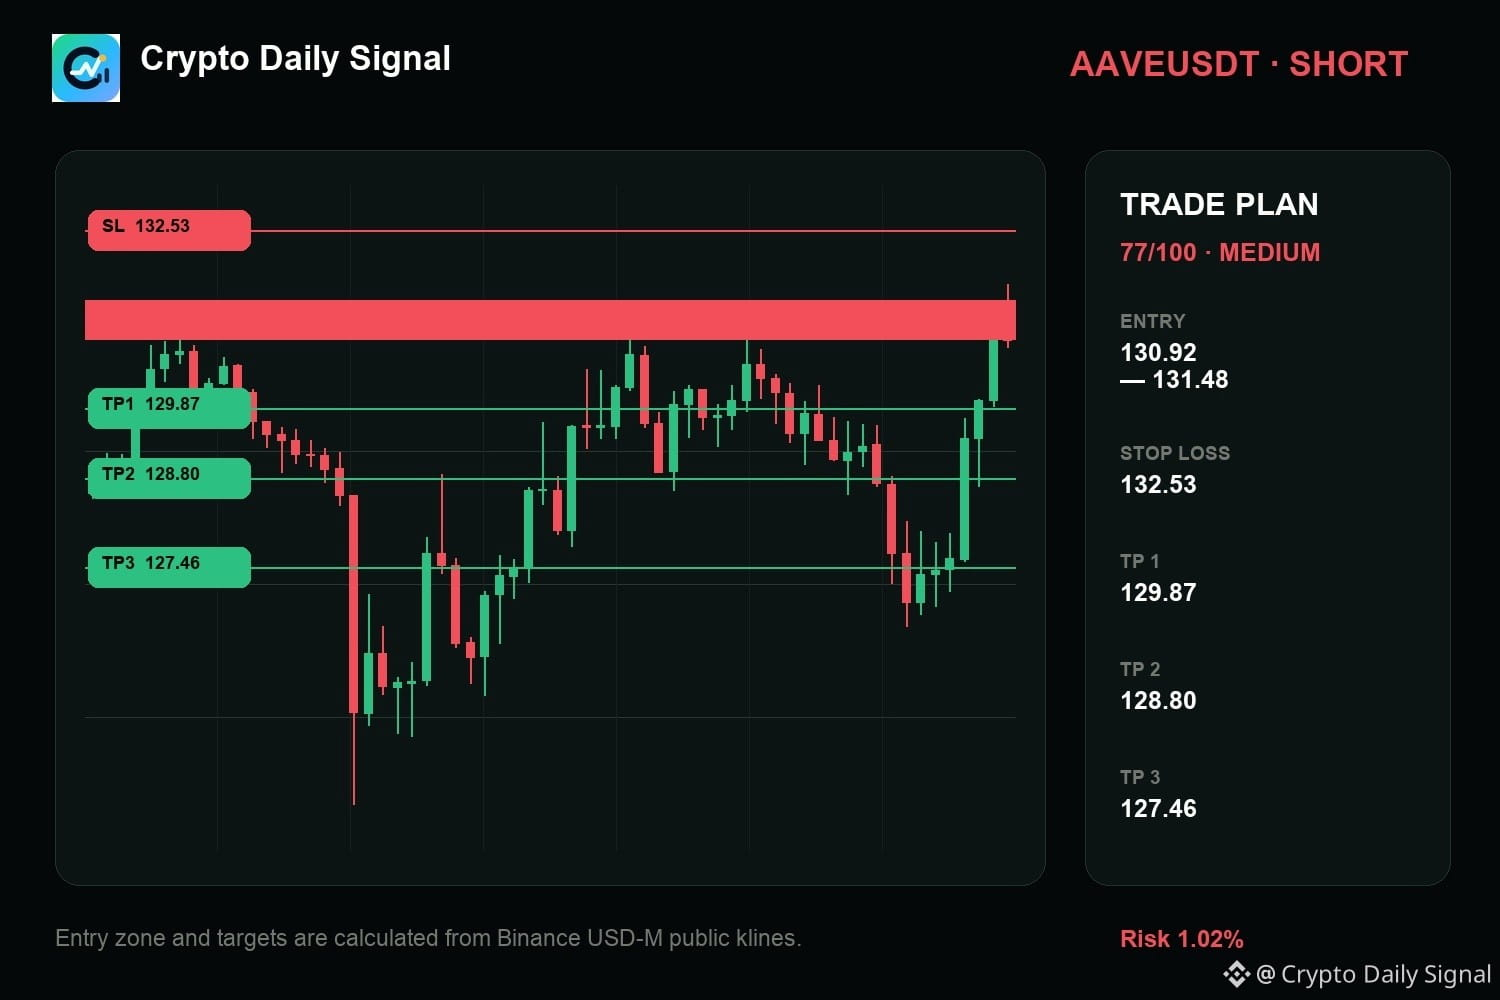
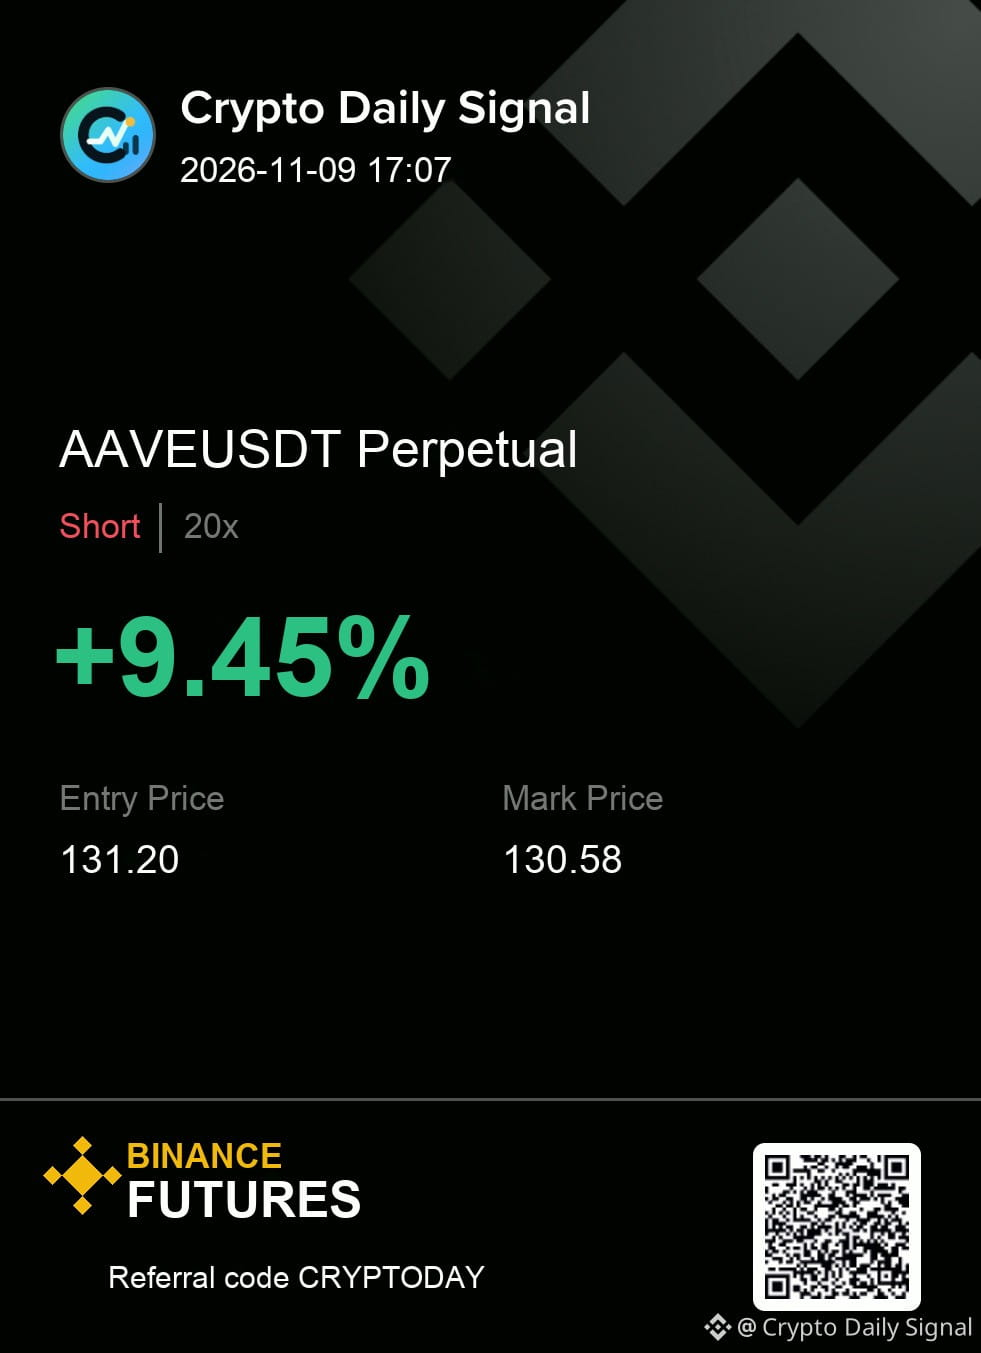
$AAVE has not invalidated the short case even while short-term momentum is fighting back. The price is clearly respecting a defined trading range, but the overarching view on both the daily and four-hour charts remains bearish. A sustained break above the recent high would be needed to change the narrative, otherwise the selling pressure implied by the larger timeframe bias holds.
Trade Plan — AAVEUSDT SHORT
Entry: 130.92 - 131.48
Stop Loss: 132.53
TP1: 129.87 | TP2: 128.80 | TP3: 127.46
#TradeSetup
{future}(AAVEUSDT)
$AAVE has not invalidated the short case even while short-term momentum is fighting back. The price is clearly respecting a defined trading range, but the overarching view on both the daily and four-hour charts remains bearish. A sustained break above the recent high would be needed to change the narrative, otherwise the selling pressure implied by the larger timeframe bias holds.
Trade Plan — AAVEUSDT SHORT
Entry: 130.92 - 131.48
Stop Loss: 132.53
TP1: 129.87 | TP2: 128.80 | TP3: 127.46
#TradeSetup
Trade Plan — AAVEUSDT SHORT
Entry: 130.92 - 131.48
Stop Loss: 132.53
TP1: 129.87 | TP2: 128.80 | TP3: 127.46
#TradeSetup
3
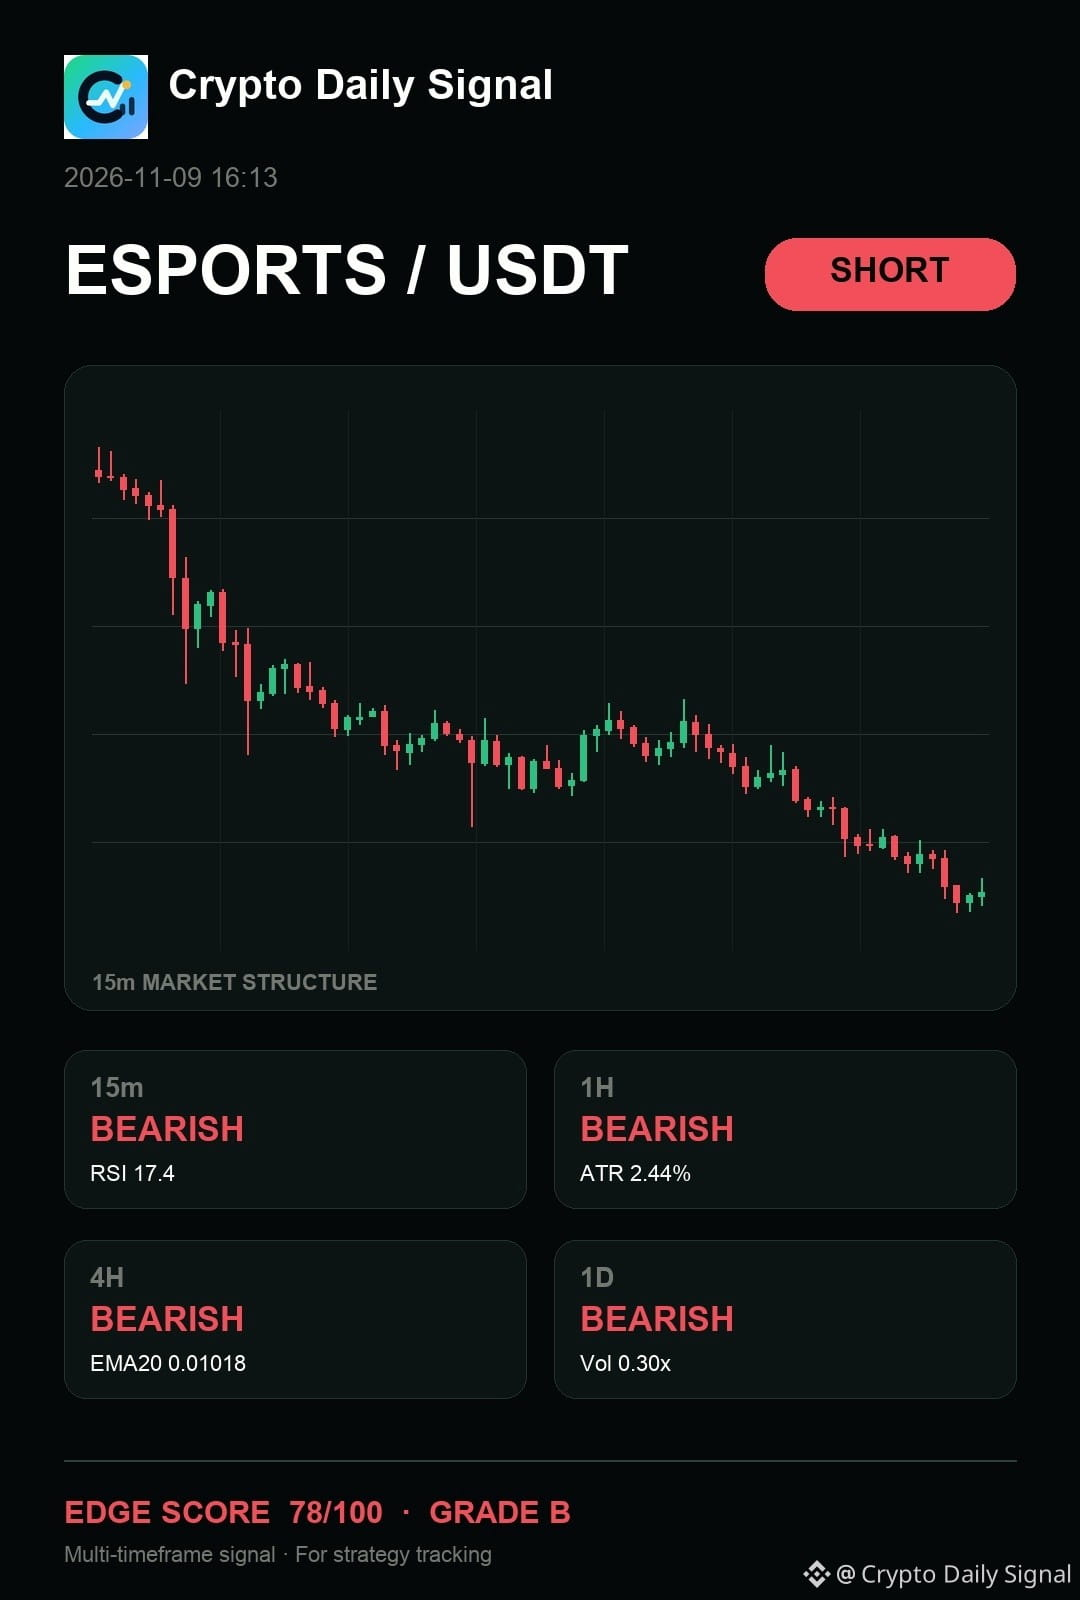
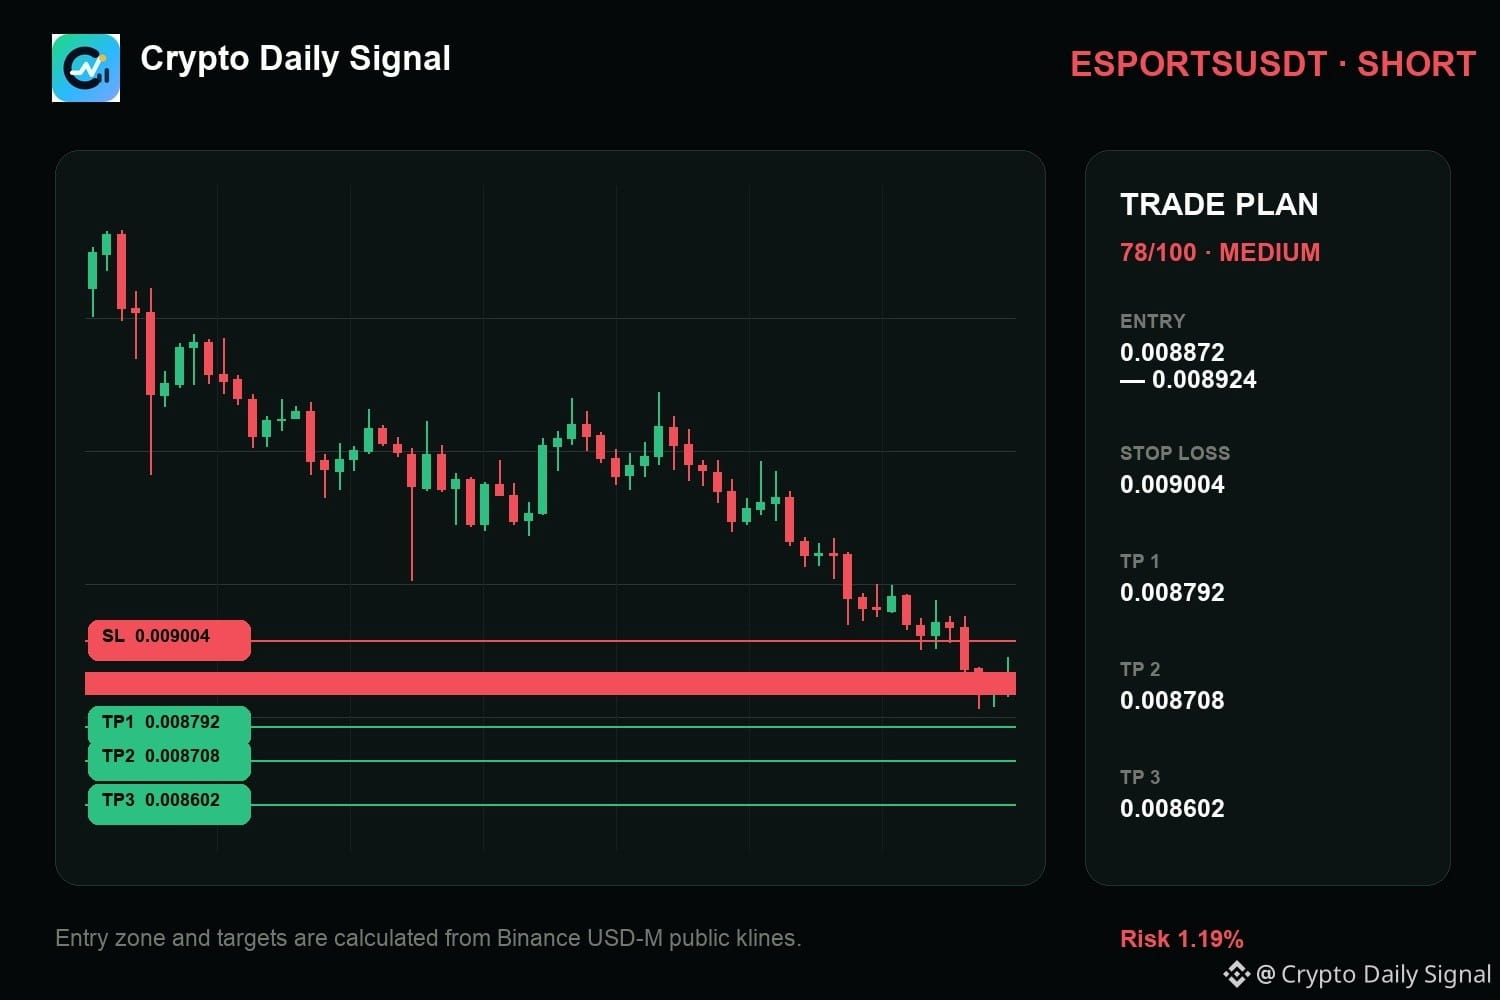
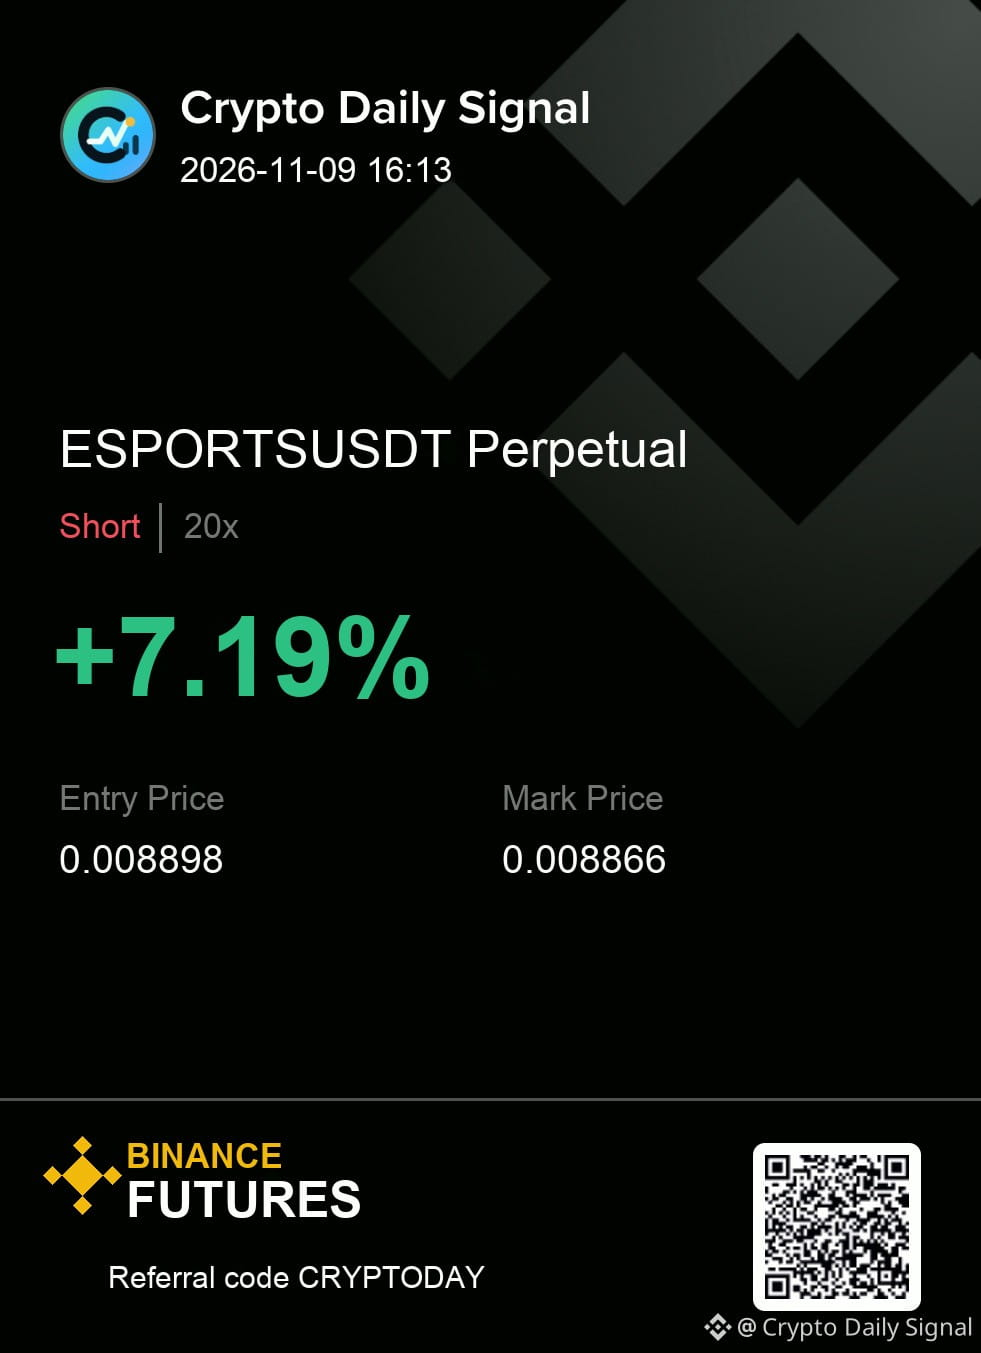
$ESPORTS — okay, my read still says it still gives sellers the cleaner argument as the price forms lower highs against a descending trendline. The current range respects the lower boundary while volume remains quiet. For this to strengthen the short, we need a decisive candle close beneath that range floor.
Execution plan (ESPORTSUSDT — SHORT)
Entry: 0.008872 - 0.008924 | SL: 0.009004
Take profit: 0.008792 → 0.008708 → 0.008602
#TradeSetup
{future}(ESPORTSUSDT)
$ESPORTS — okay, my read still says it still gives sellers the cleaner argument as the price forms lower highs against a descending trendline. The current range respects the lower boundary while volume remains quiet. For this to strengthen the short, we need a decisive candle close beneath that range floor.
Execution plan (ESPORTSUSDT — SHORT)
Entry: 0.008872 - 0.008924 | SL: 0.009004
Take profit: 0.008792 → 0.008708 → 0.008602
#TradeSetup
Execution plan (ESPORTSUSDT — SHORT)
Entry: 0.008872 - 0.008924 | SL: 0.009004
Take profit: 0.008792 → 0.008708 → 0.008602
#TradeSetup
6
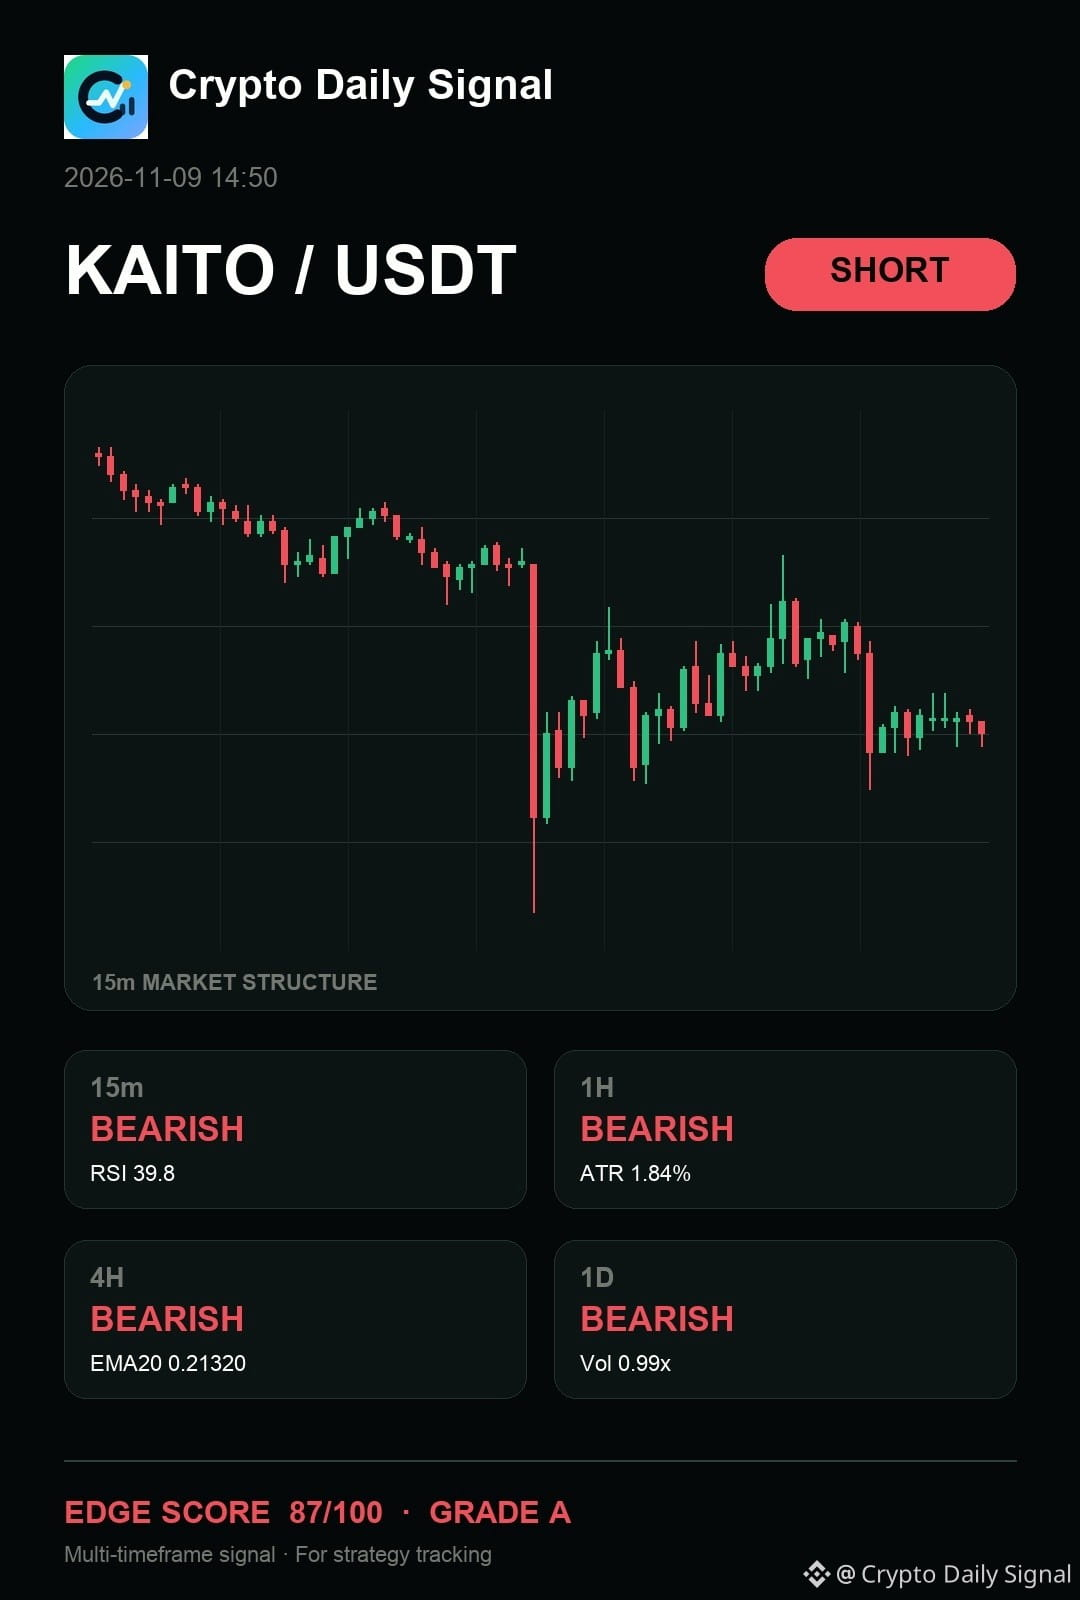
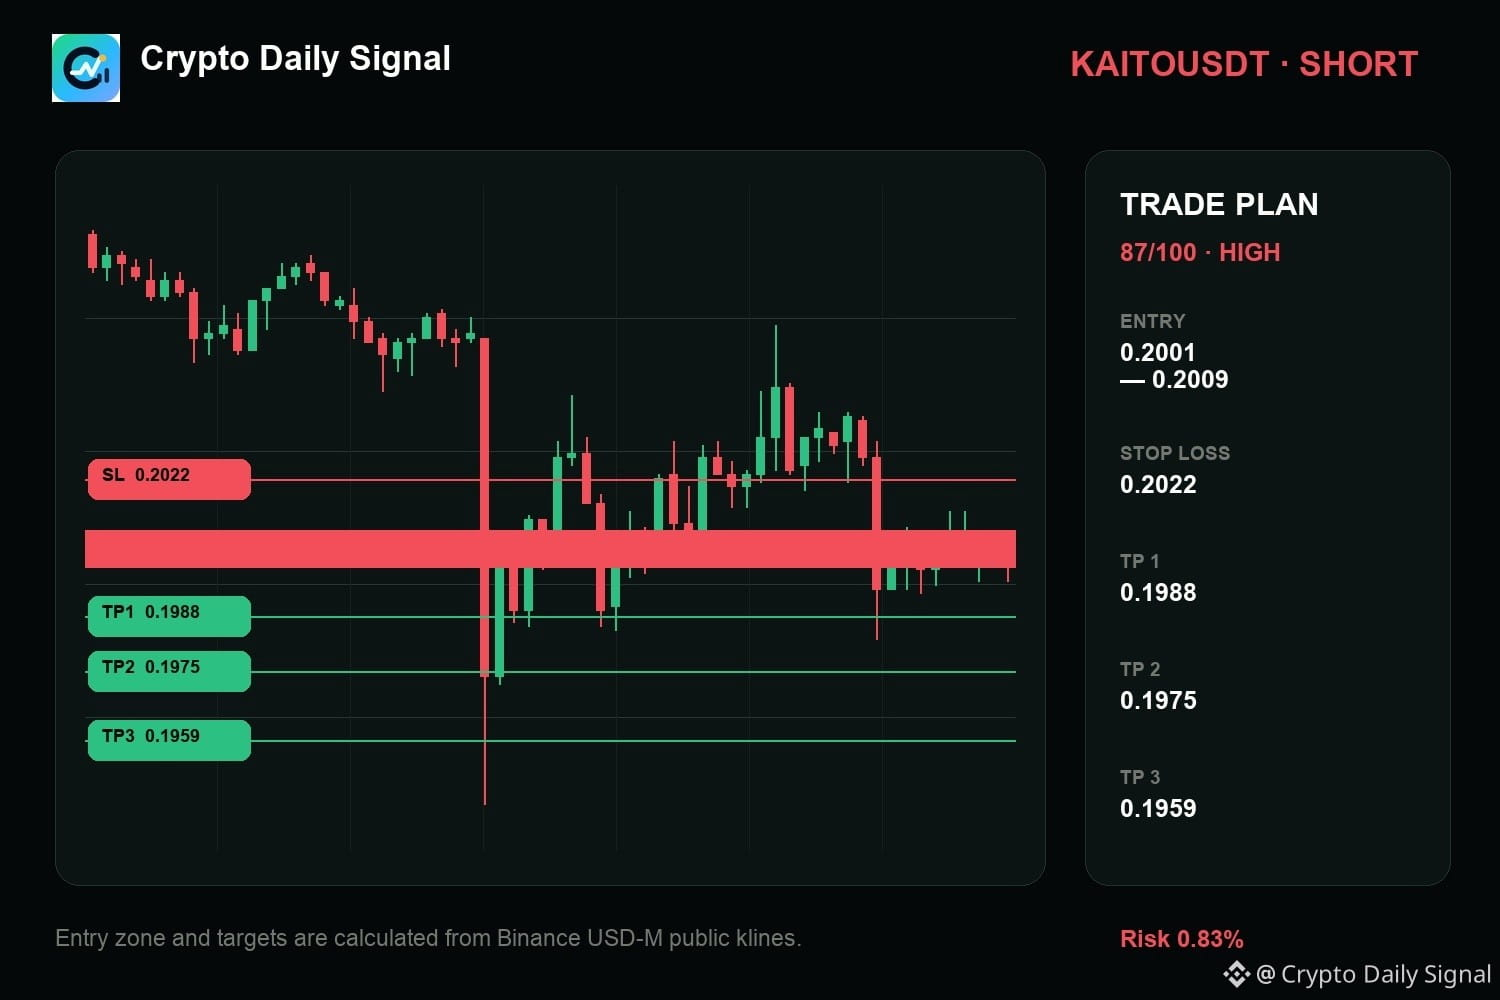
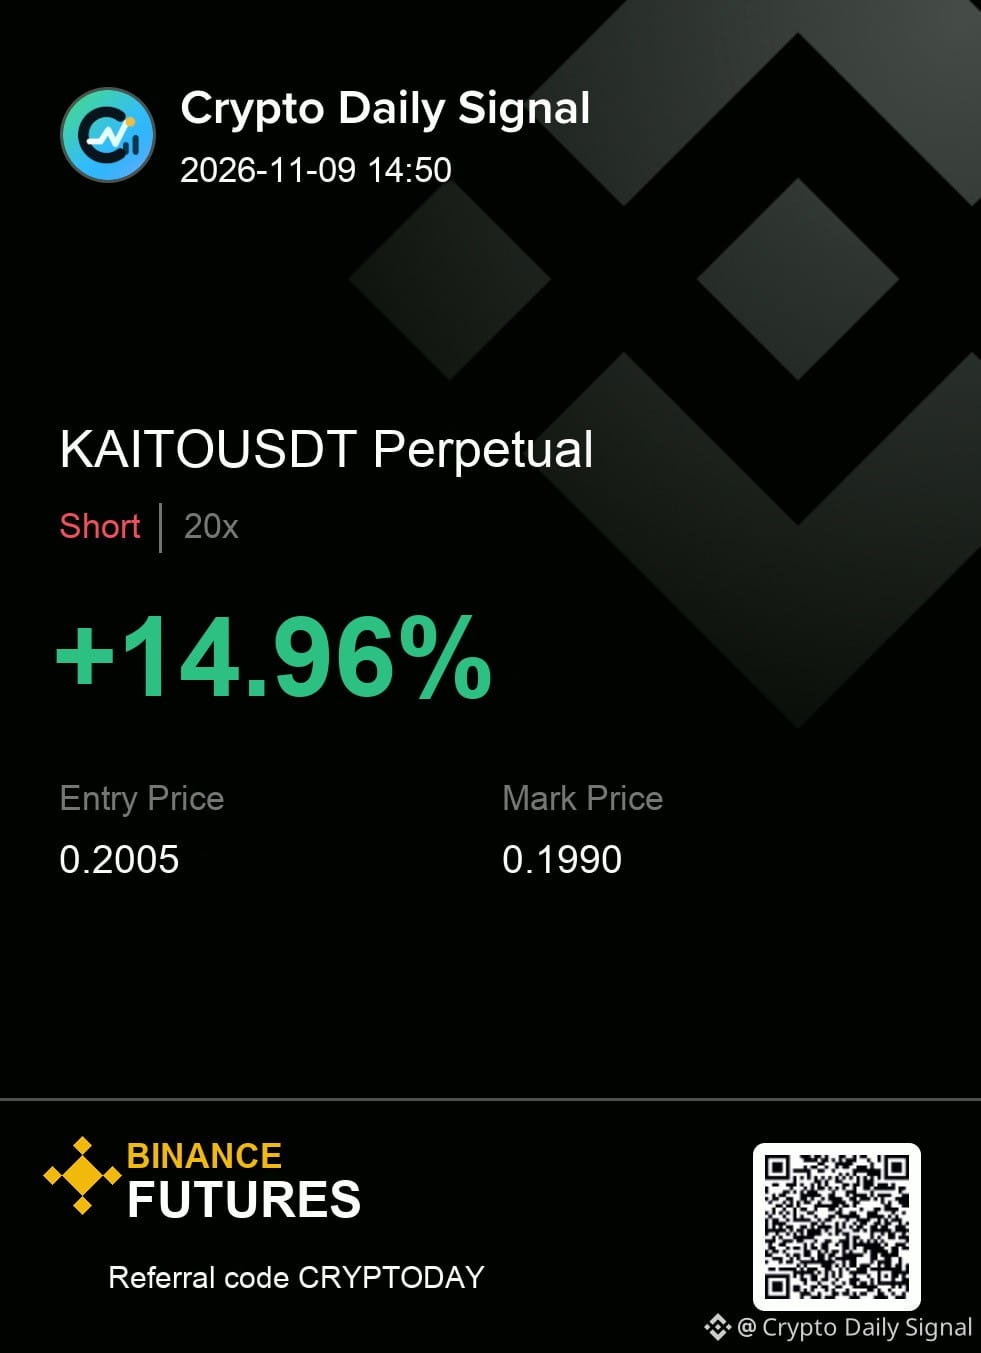
$KAITO — honestly, the chart still says it is one rejection away from a cleaner short. The recent price action shows consistent lower highs and lower lows, confirming the established short-term downward trendline. This short thesis looks stronger if momentum continues to push lower, but a decisive close above that last local high would signal a shift.
SHORT plan for KAITOUSDT
0.2001 - 0.2009 entry | 0.2022 stop
0.1988 → 0.1975 → 0.1959
Would you take it here, or wait for one more confirmation candle?
#TradeSetup
{future}(KAITOUSDT)
$KAITO — honestly, the chart still says it is one rejection away from a cleaner short. The recent price action shows consistent lower highs and lower lows, confirming the established short-term downward trendline. This short thesis looks stronger if momentum continues to push lower, but a decisive close above that last local high would signal a shift.
SHORT plan for KAITOUSDT
0.2001 - 0.2009 entry | 0.2022 stop
0.1988 → 0.1975 → 0.1959
Would you take it here, or wait for one more confirmation candle?
#TradeSetup
SHORT plan for KAITOUSDT
0.2001 - 0.2009 entry | 0.2022 stop
0.1988 → 0.1975 → 0.1959
Would you take it here, or wait for one more confirmation candle?
#TradeSetup
21
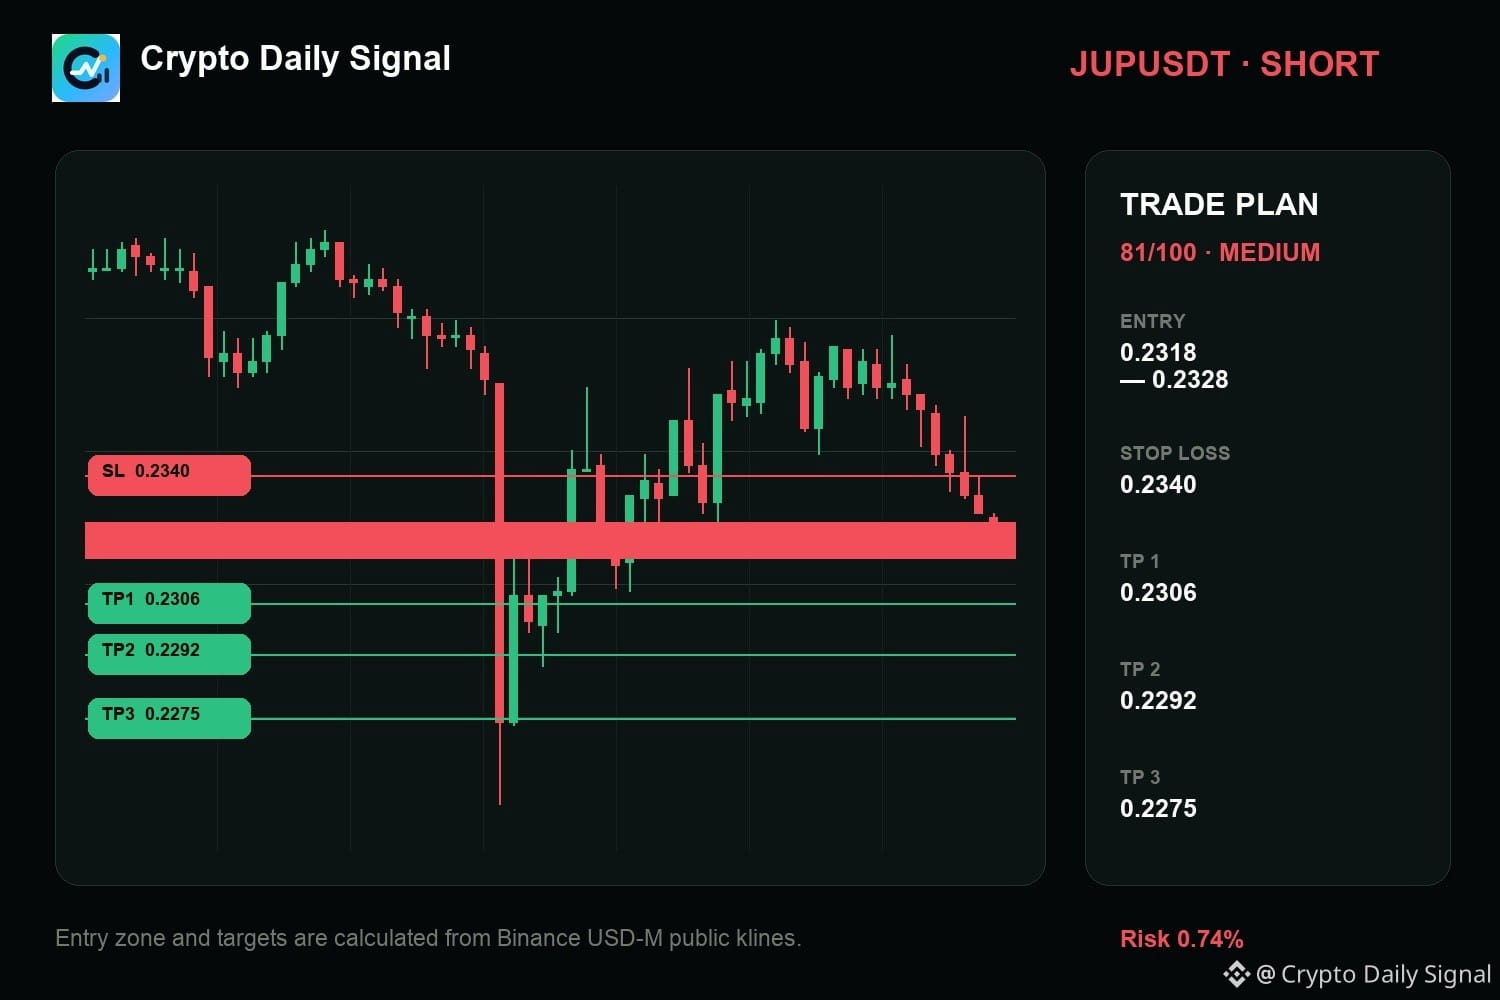
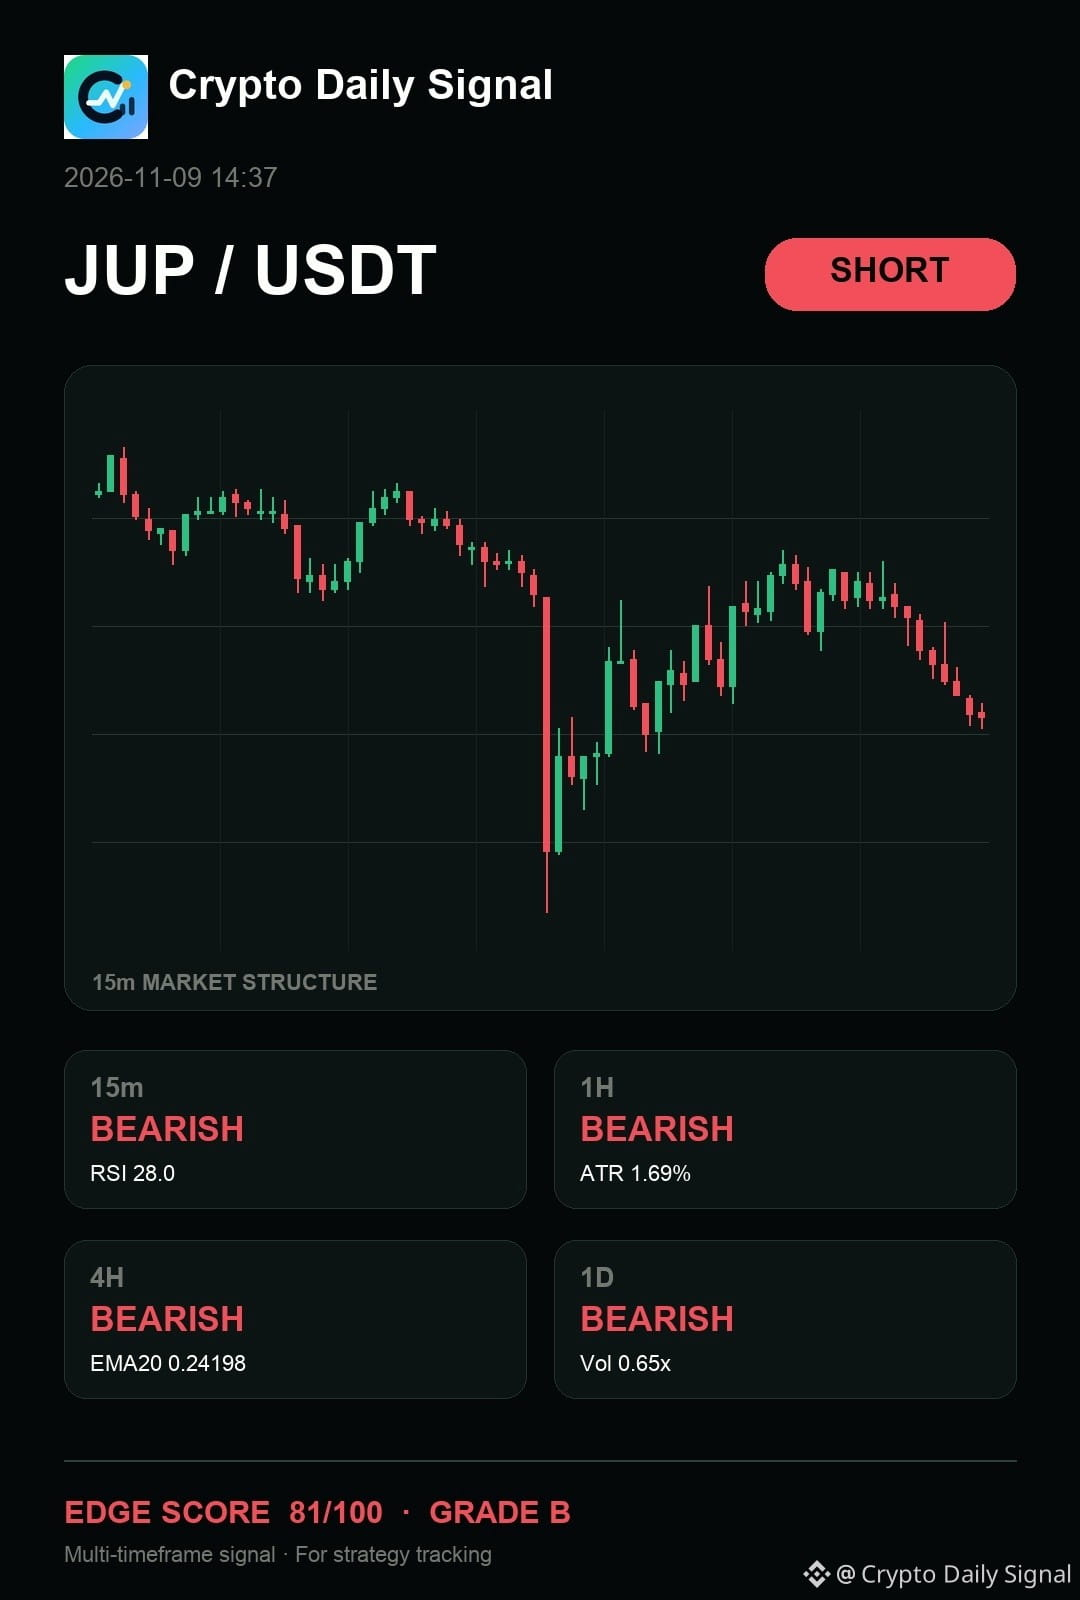
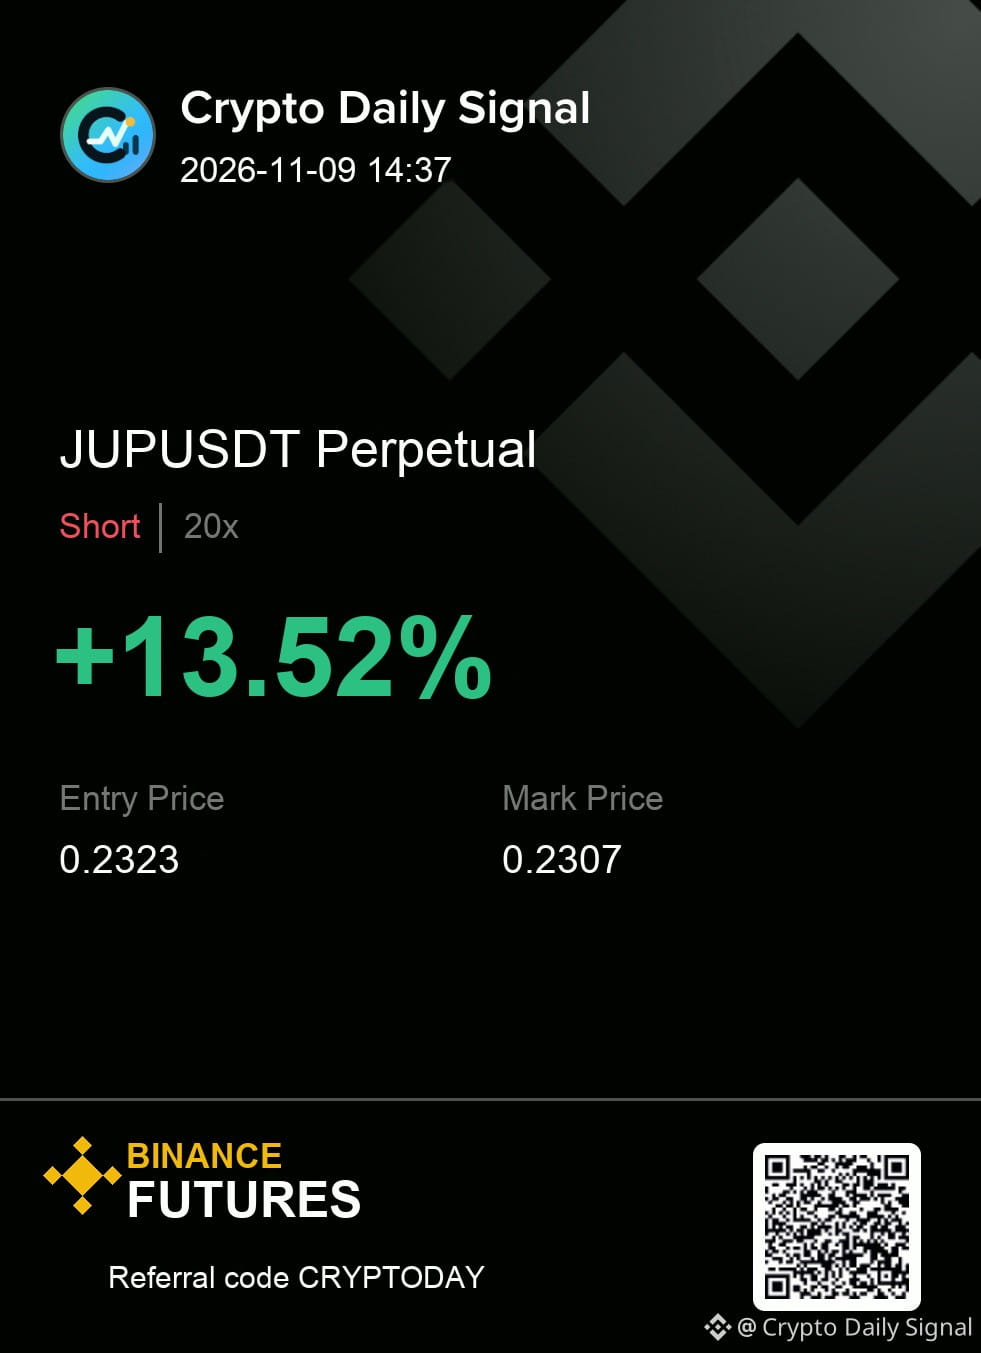
$JUP sits on my short-side watchlist as the price tests the bottom of its recent consolidation zone. We're seeing repeated upper wick rejection candles, and the overall look on the daily and four-hour timeframes remains bearish. A clear close below that established floor would confirm the downside path. If it breaks strongly above the high that started this range, the argument reverses.
JUPUSDT | SHORT
Entry 0.2318 - 0.2328
Invalidation 0.2340
Targets 0.2306 / 0.2292 / 0.2275
Clean enough to execute, or still too early for you?
#TradeSetup
{future}(JUPUSDT)
$JUP sits on my short-side watchlist as the price tests the bottom of its recent consolidation zone. We're seeing repeated upper wick rejection candles, and the overall look on the daily and four-hour timeframes remains bearish. A clear close below that established floor would confirm the downside path. If it breaks strongly above the high that started this range, the argument reverses.
JUPUSDT | SHORT
Entry 0.2318 - 0.2328
Invalidation 0.2340
Targets 0.2306 / 0.2292 / 0.2275
Clean enough to execute, or still too early for you?
#TradeSetup
JUPUSDT | SHORT
Entry 0.2318 - 0.2328
Invalidation 0.2340
Targets 0.2306 / 0.2292 / 0.2275
Clean enough to execute, or still too early for you?
#TradeSetup
9
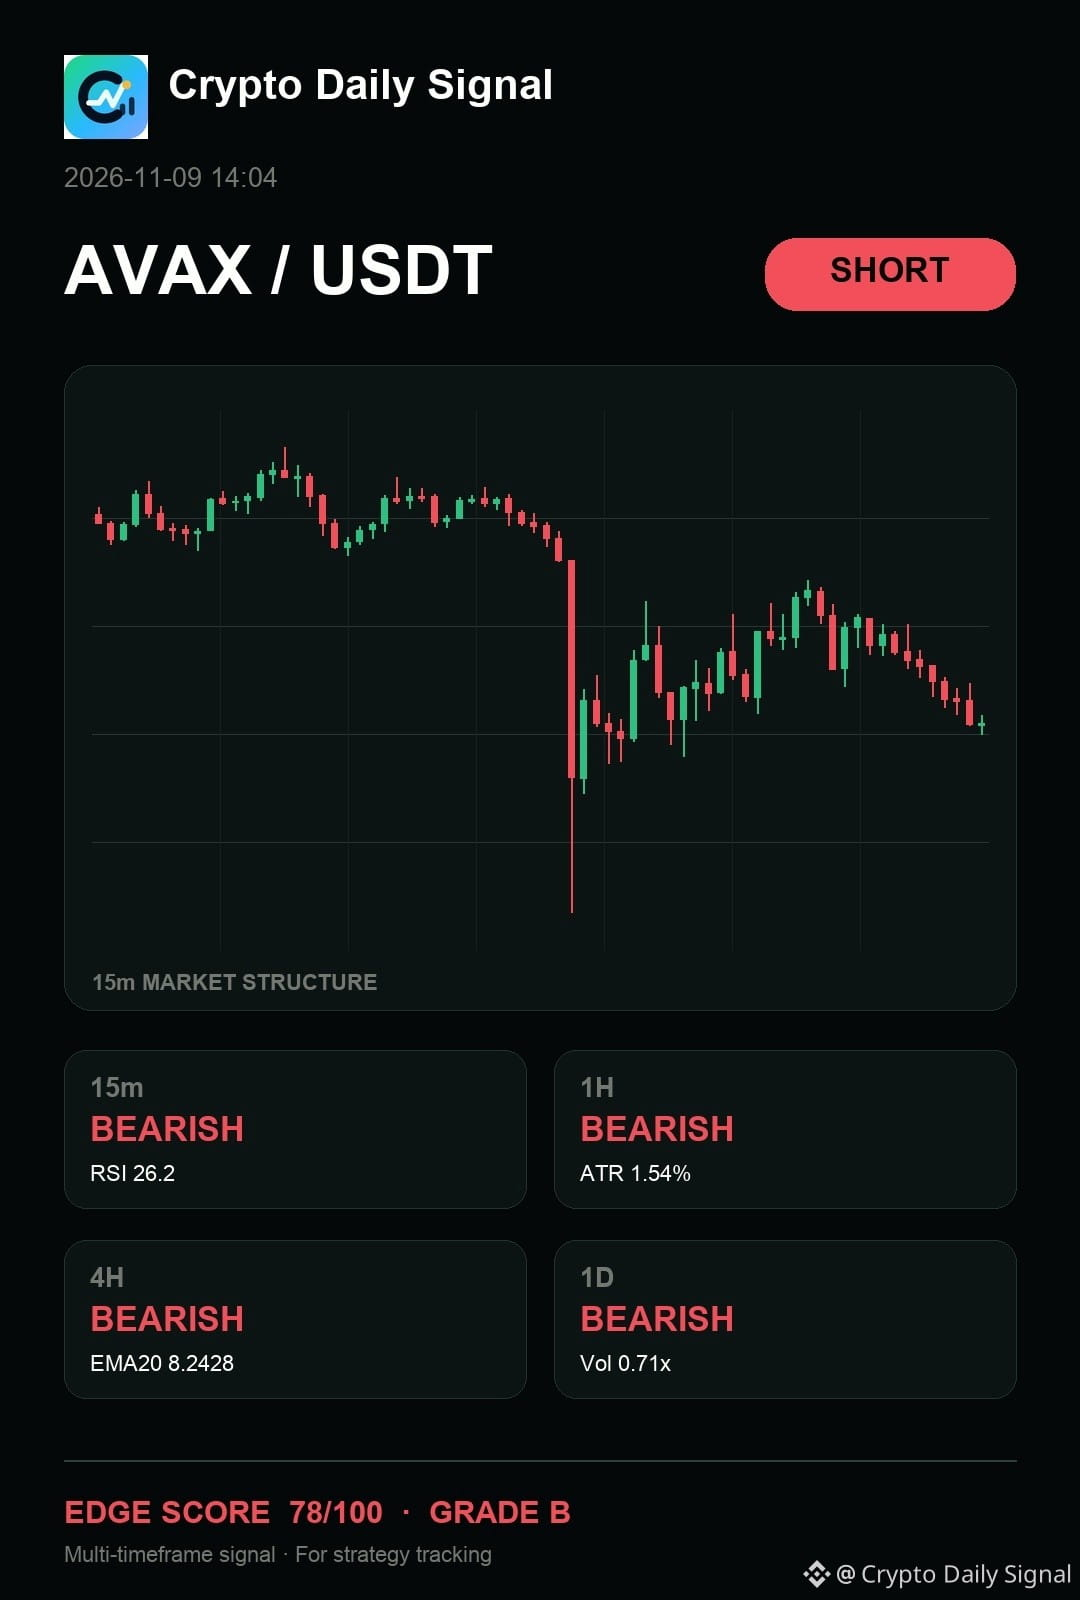
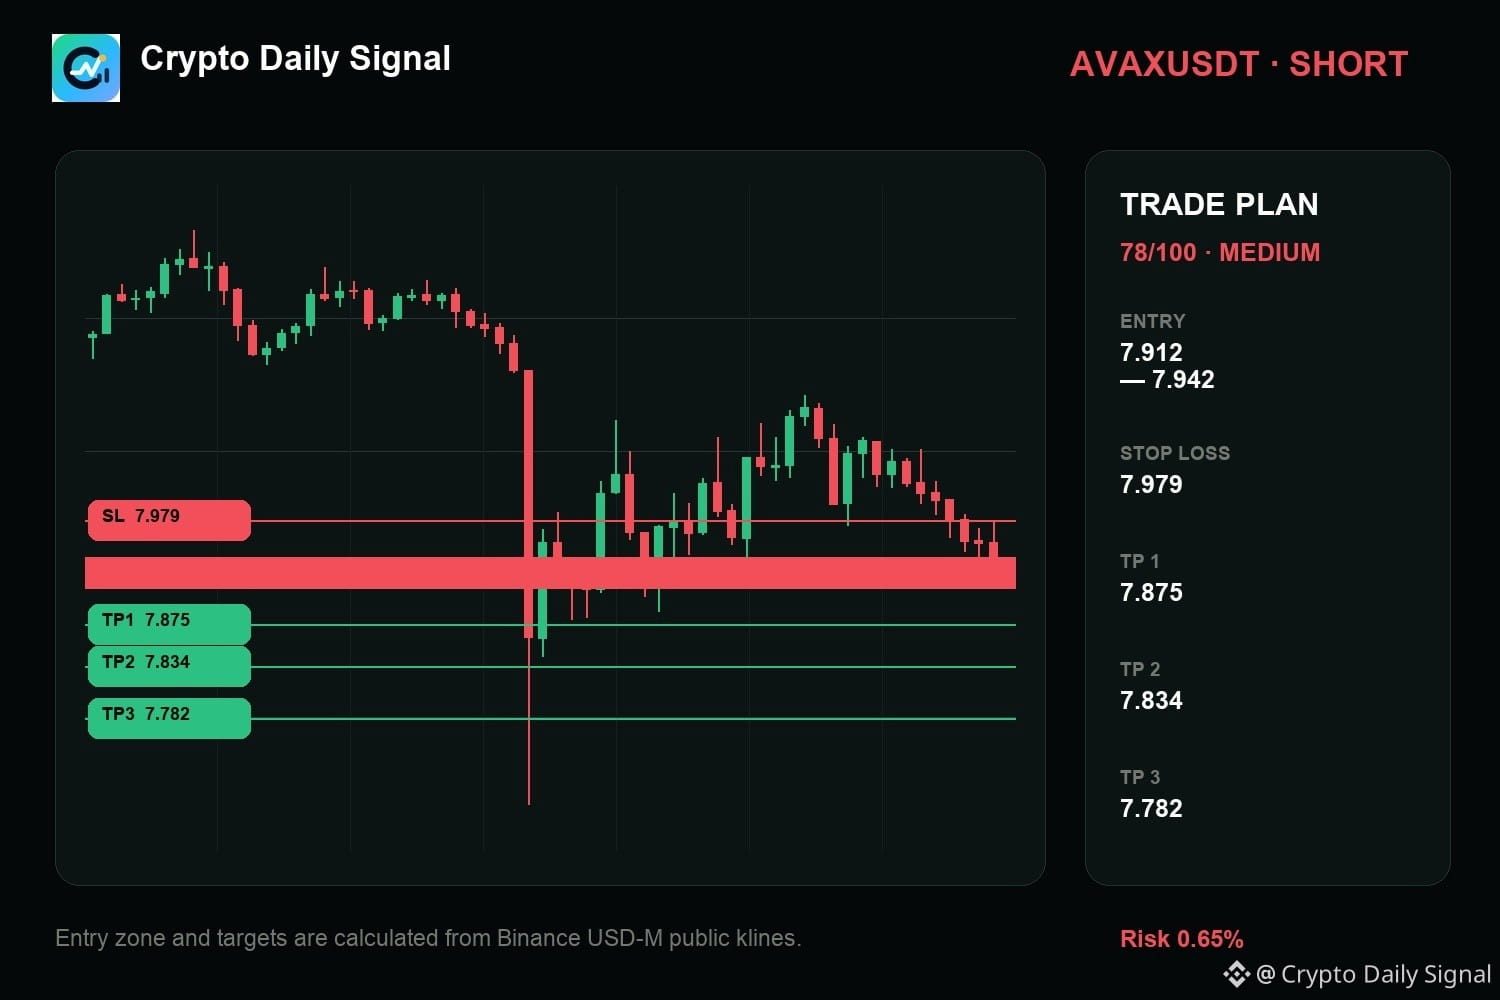
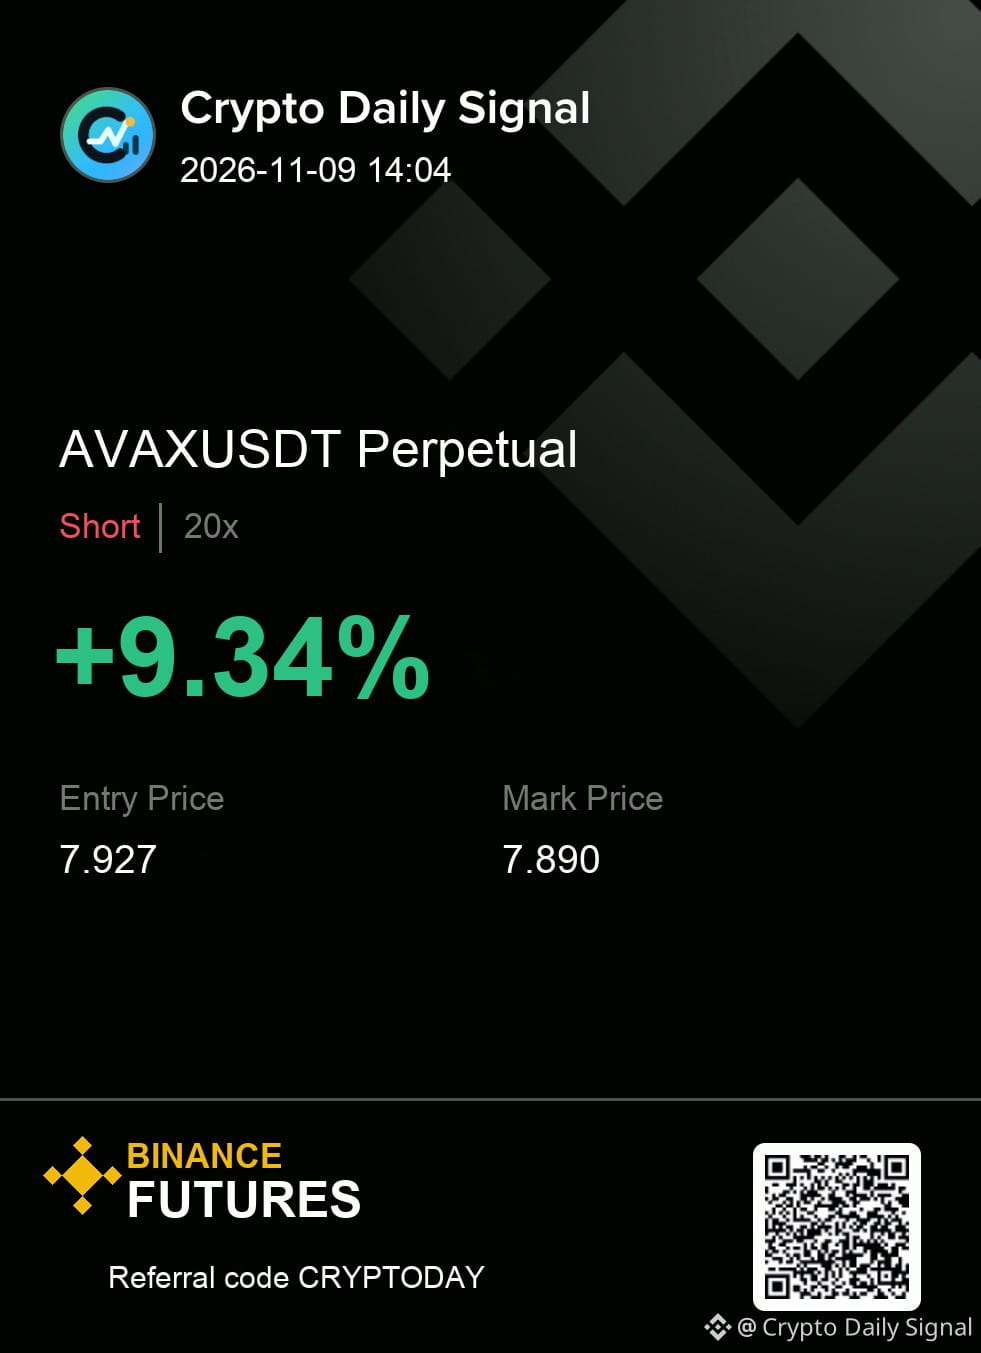
$AVAX — quick take, I still think it stays on my short list for now. The higher-timeframe picture reads bearish, and the four-hour leg remains bearish. Let price prove the zone rather than chasing momentum; if the risk boundary fails, I move on without arguing with it.
SHORT plan for AVAXUSDT
7.912 - 7.942 entry | 7.979 stop
7.875 → 7.834 → 7.782
#TradeSetup
{future}(AVAXUSDT)
$AVAX — quick take, I still think it stays on my short list for now. The higher-timeframe picture reads bearish, and the four-hour leg remains bearish. Let price prove the zone rather than chasing momentum; if the risk boundary fails, I move on without arguing with it.
SHORT plan for AVAXUSDT
7.912 - 7.942 entry | 7.979 stop
7.875 → 7.834 → 7.782
#TradeSetup
SHORT plan for AVAXUSDT
7.912 - 7.942 entry | 7.979 stop
7.875 → 7.834 → 7.782
#TradeSetup
13
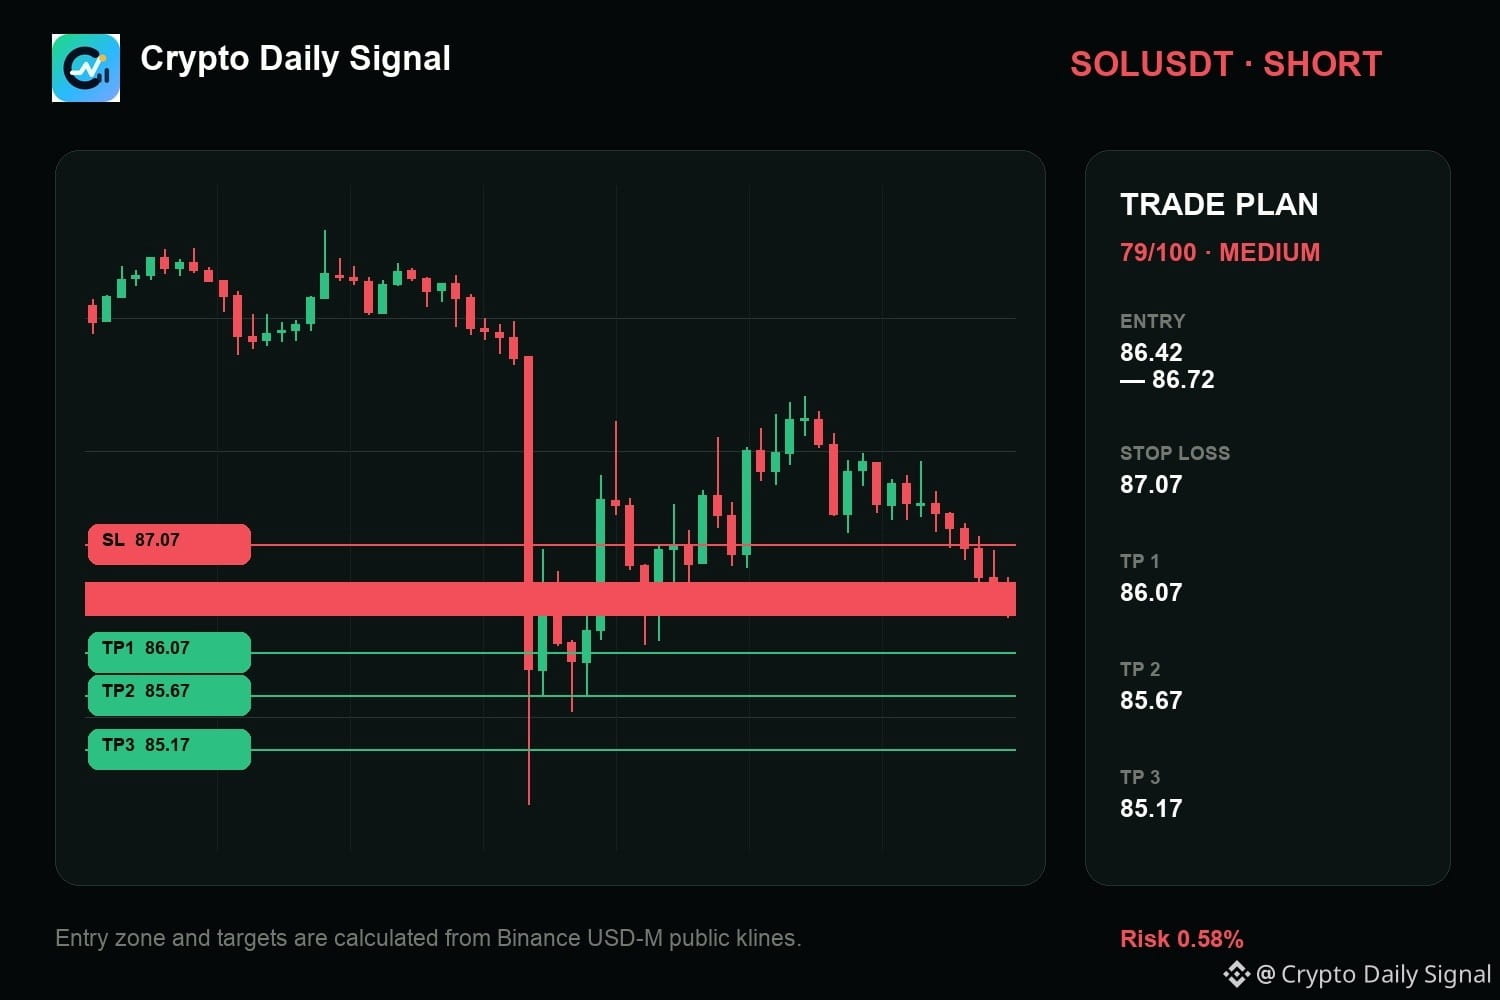
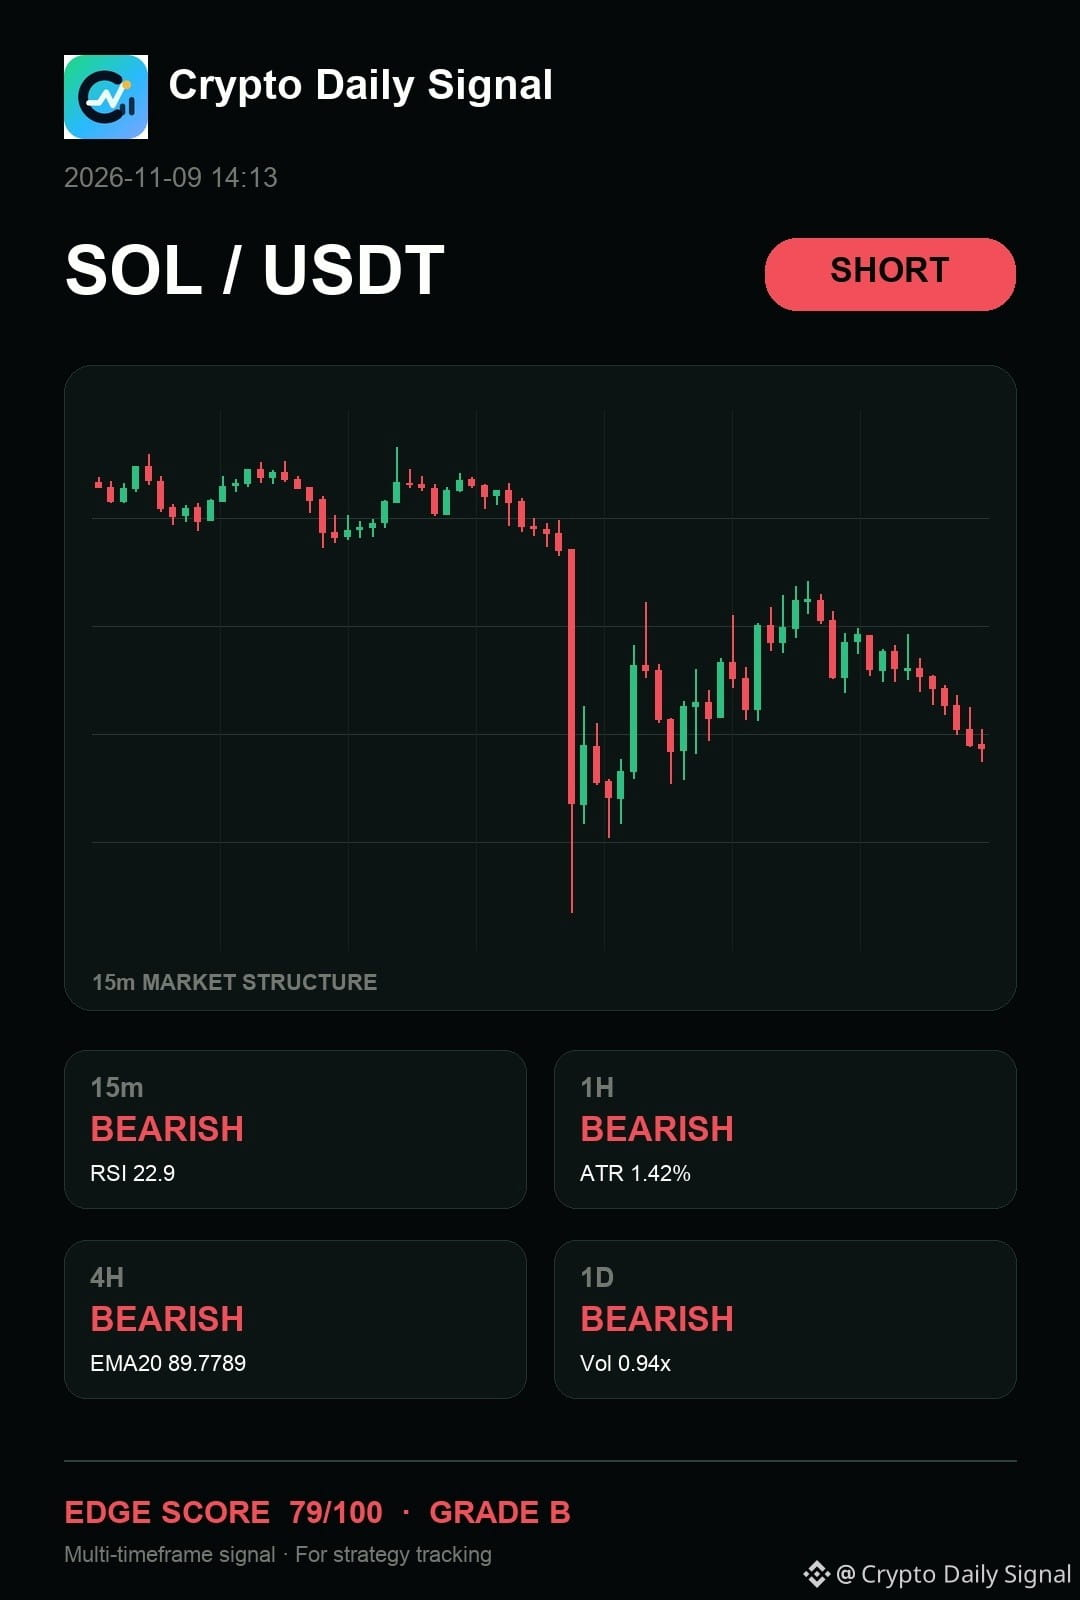
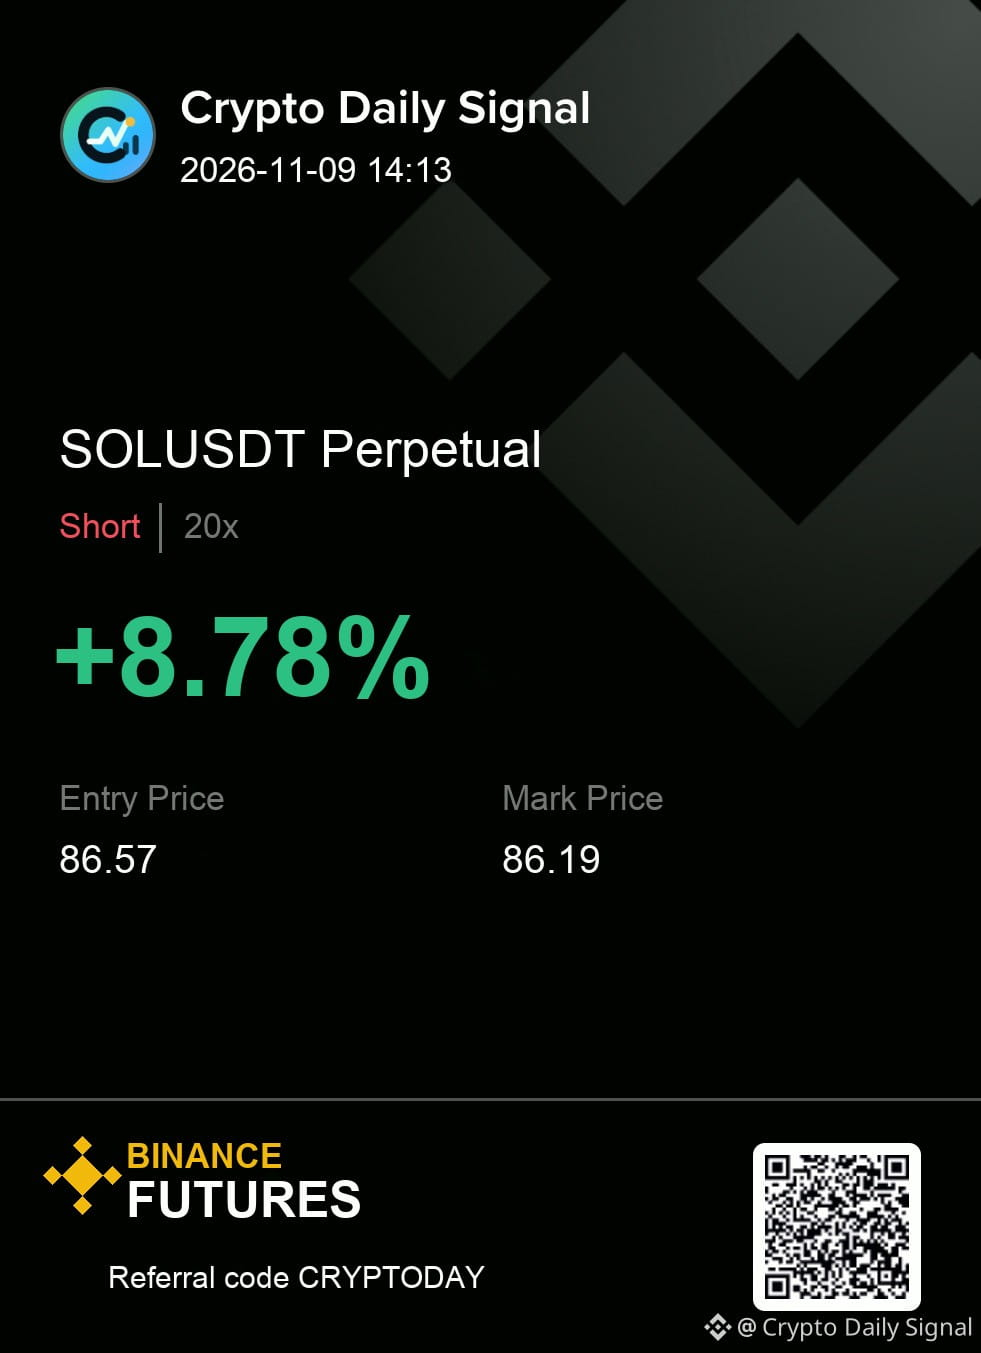
$SOL — honestly, the chart still says it keeps the bearish thesis active because the recent upward push failed to overcome the descending trendline, with the price rejecting higher levels. The market structure shows a sequence of lower highs across shorter timeframes, confirming the broader downward bias. A breach beneath the immediate swing low would strengthen this bearish case, while a recovery above that recent high cancels the setup.
Confirmation first or early entry — which side of that trade-off are you on?
Levels — SOLUSDT
Zone: 86.42 - 86.72
Cut: 87.07
Scale: 86.07 | 85.67 | 85.17
#TradeSetup
{future}(SOLUSDT)
$SOL — honestly, the chart still says it keeps the bearish thesis active because the recent upward push failed to overcome the descending trendline, with the price rejecting higher levels. The market structure shows a sequence of lower highs across shorter timeframes, confirming the broader downward bias. A breach beneath the immediate swing low would strengthen this bearish case, while a recovery above that recent high cancels the setup.
Confirmation first or early entry — which side of that trade-off are you on?
Levels — SOLUSDT
Zone: 86.42 - 86.72
Cut: 87.07
Scale: 86.07 | 85.67 | 85.17
#TradeSetup
Confirmation first or early entry — which side of that trade-off are you on?
Levels — SOLUSDT
Zone: 86.42 - 86.72
Cut: 87.07
Scale: 86.07 | 85.67 | 85.17
#TradeSetup
4
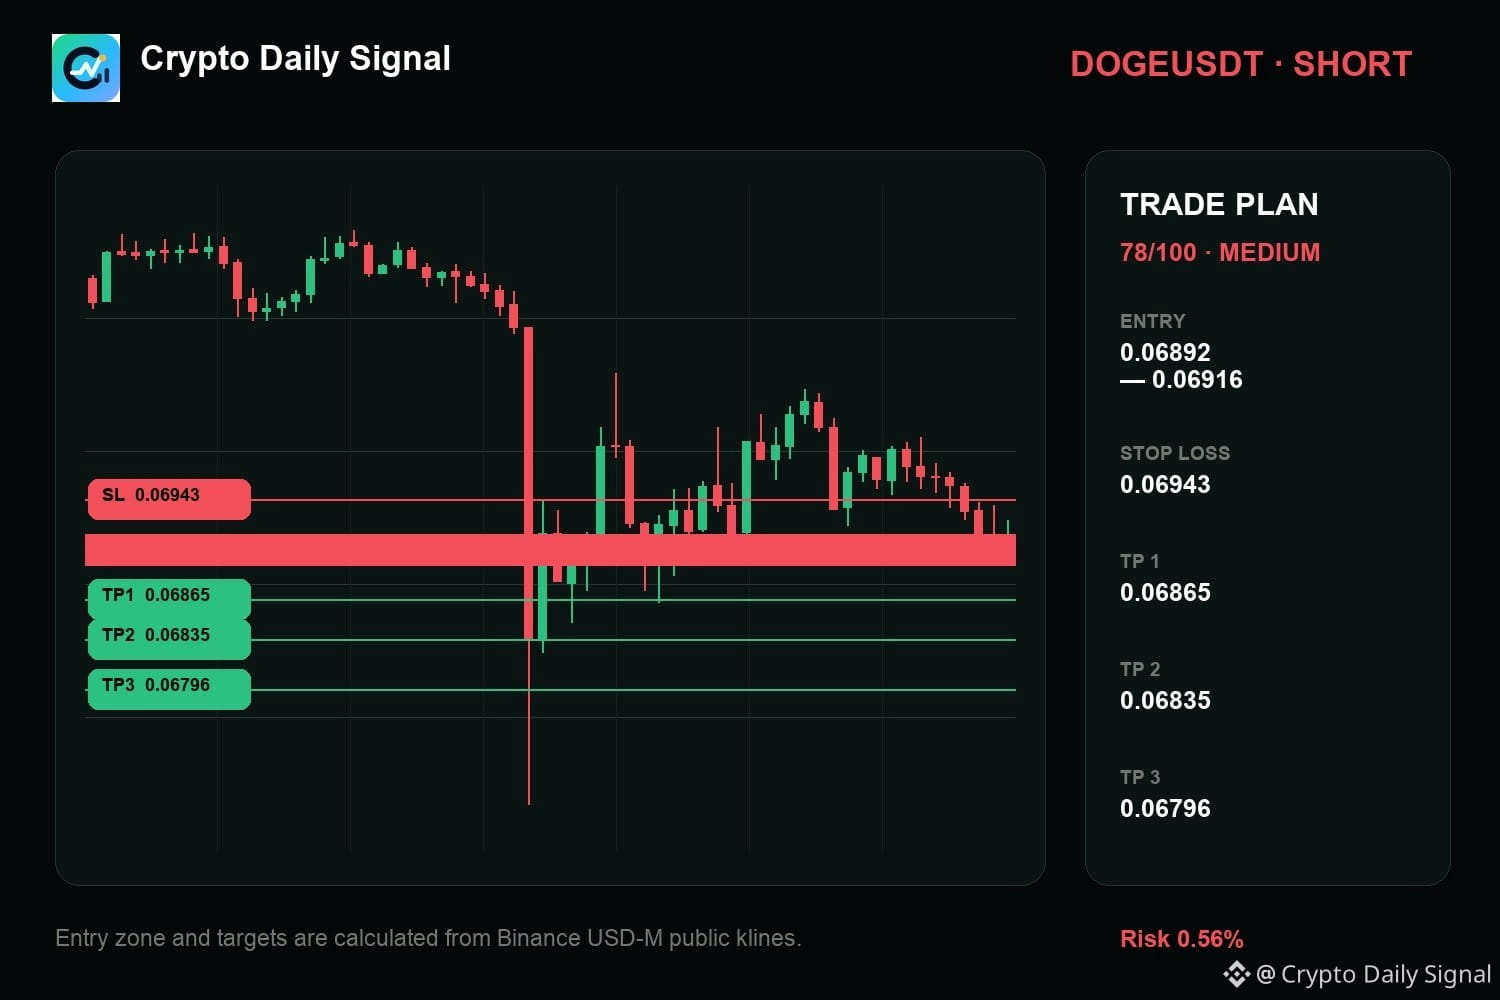
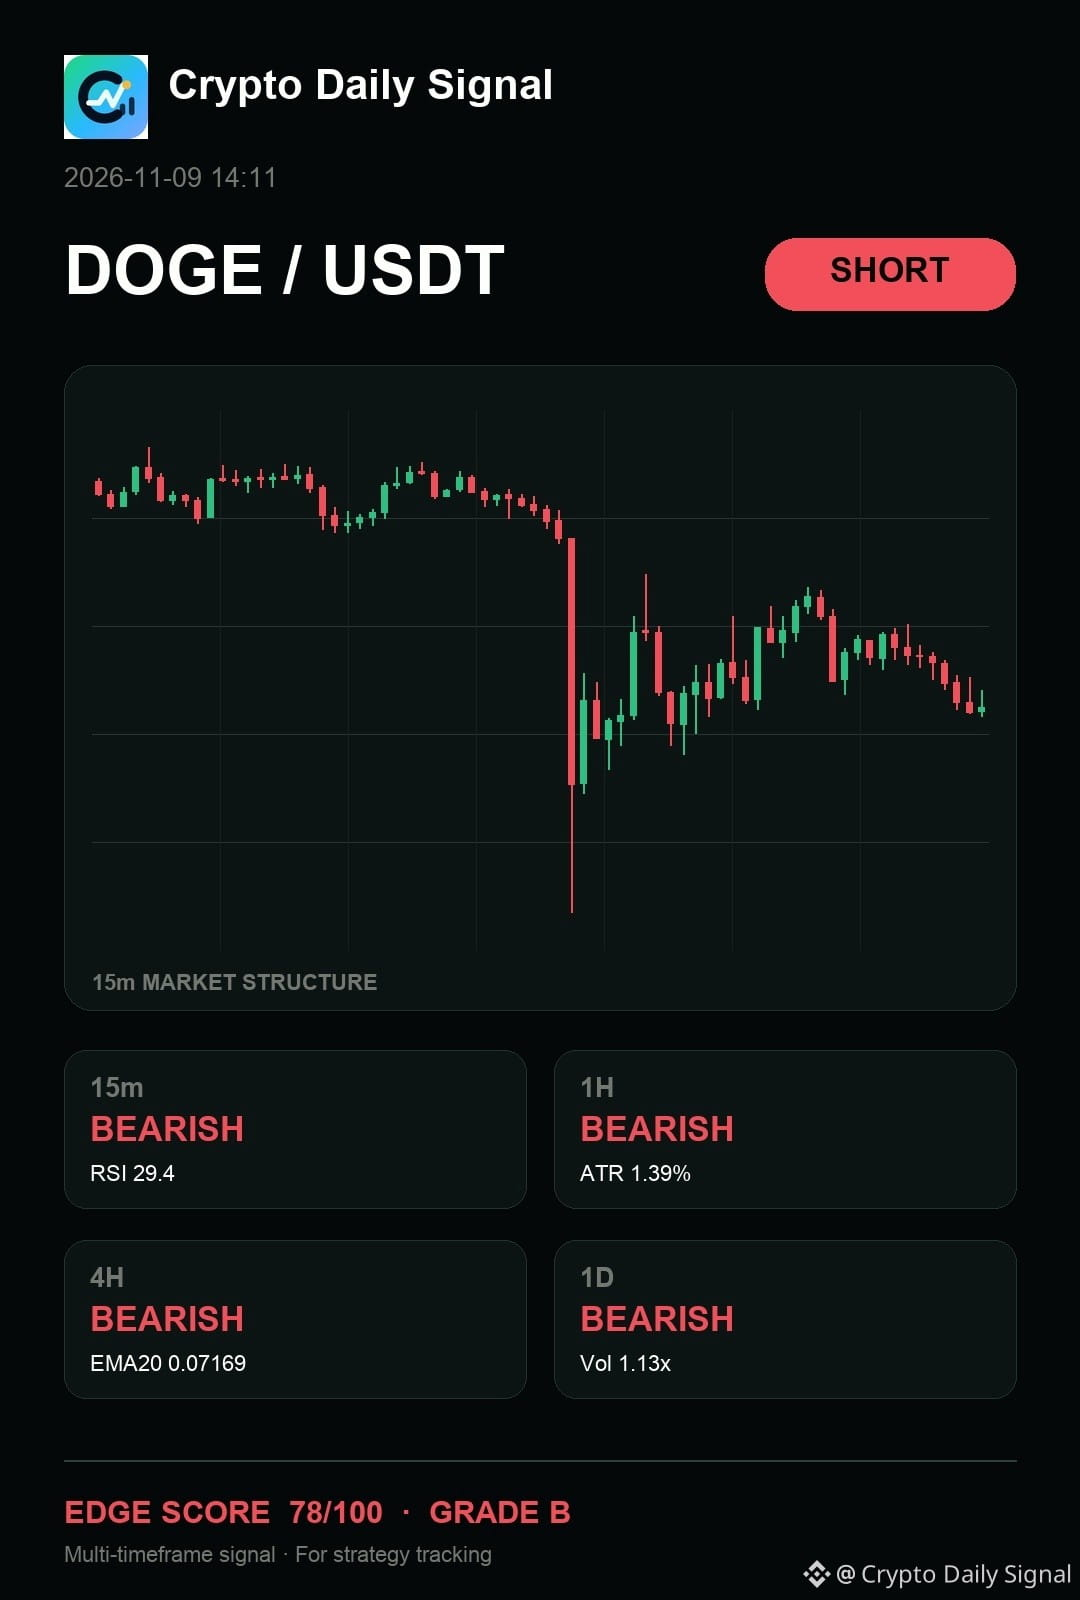
$DOGE — from my side, the tape says it keeps the bearish thesis active as the price tucks inside a clear descending channel formation. Bearish rejection is showing up near the top of this range, and a close below the bottom of that short-term structure would make the move clearer.
SHORT plan for DOGEUSDT
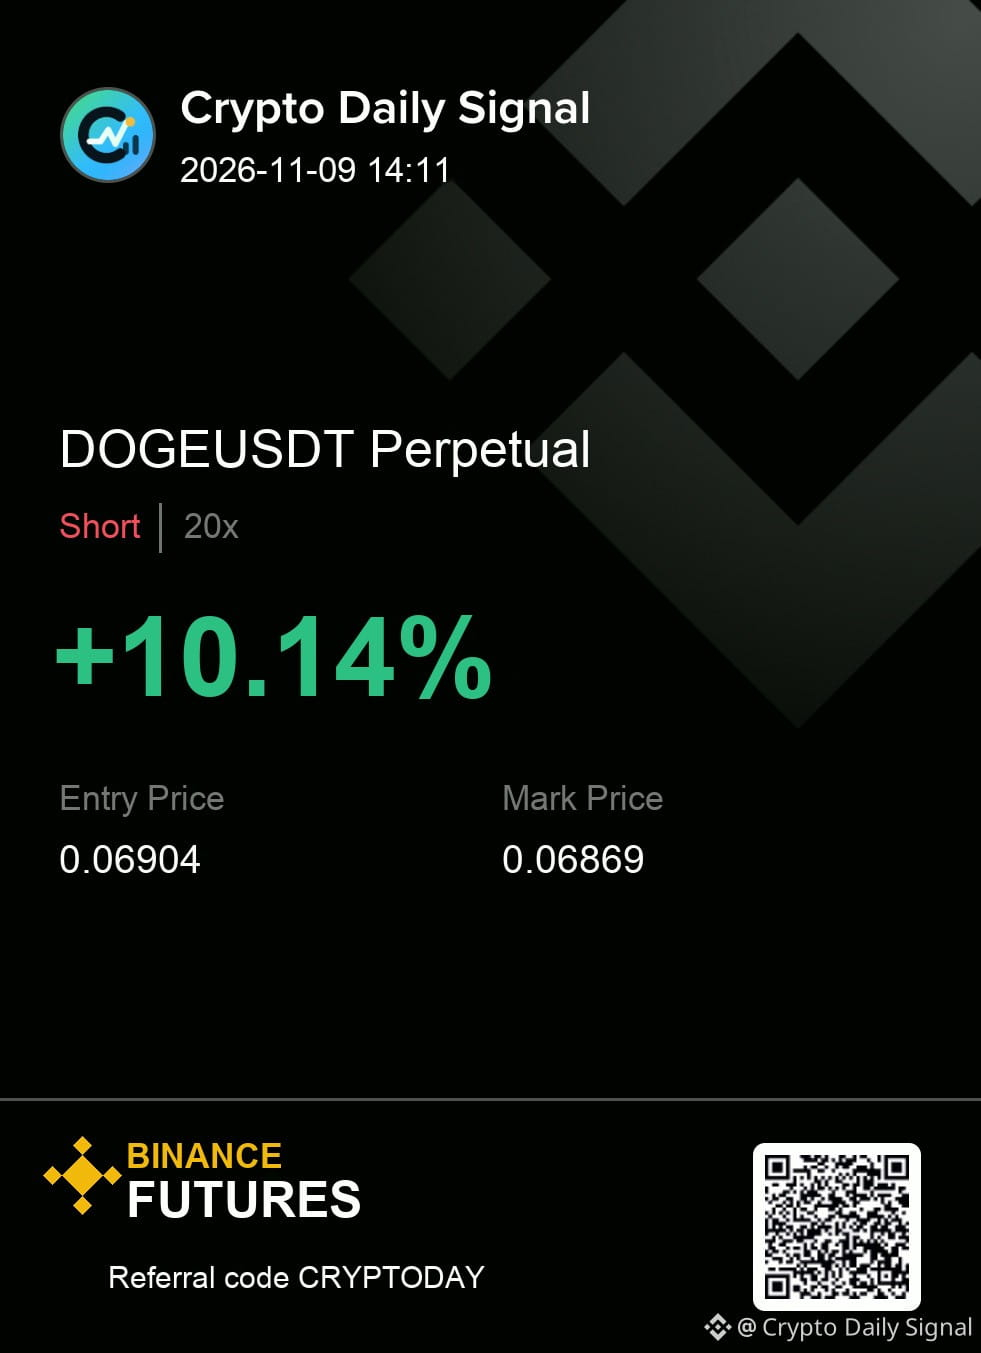
0.06892 - 0.06916 entry | 0.06943 stop
0.06865 → 0.06835 → 0.06796
#TradeSetup
{future}(DOGEUSDT)
$DOGE — from my side, the tape says it keeps the bearish thesis active as the price tucks inside a clear descending channel formation. Bearish rejection is showing up near the top of this range, and a close below the bottom of that short-term structure would make the move clearer.
SHORT plan for DOGEUSDT
0.06892 - 0.06916 entry | 0.06943 stop
0.06865 → 0.06835 → 0.06796
#TradeSetup
SHORT plan for DOGEUSDT
0.06892 - 0.06916 entry | 0.06943 stop
0.06865 → 0.06835 → 0.06796
#TradeSetup
12
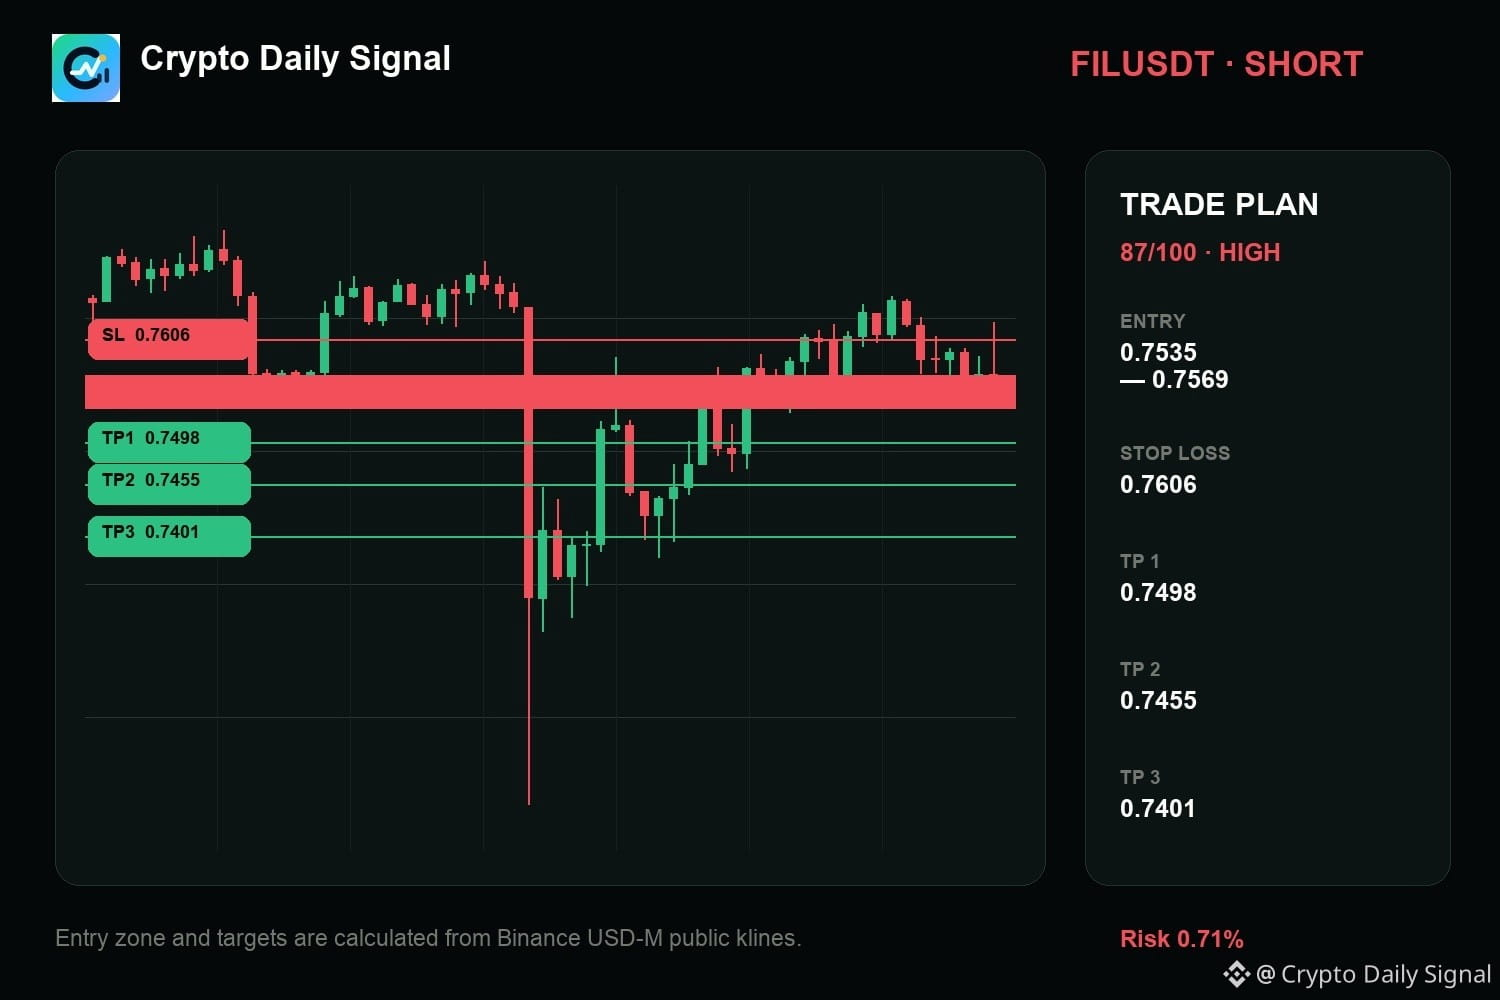
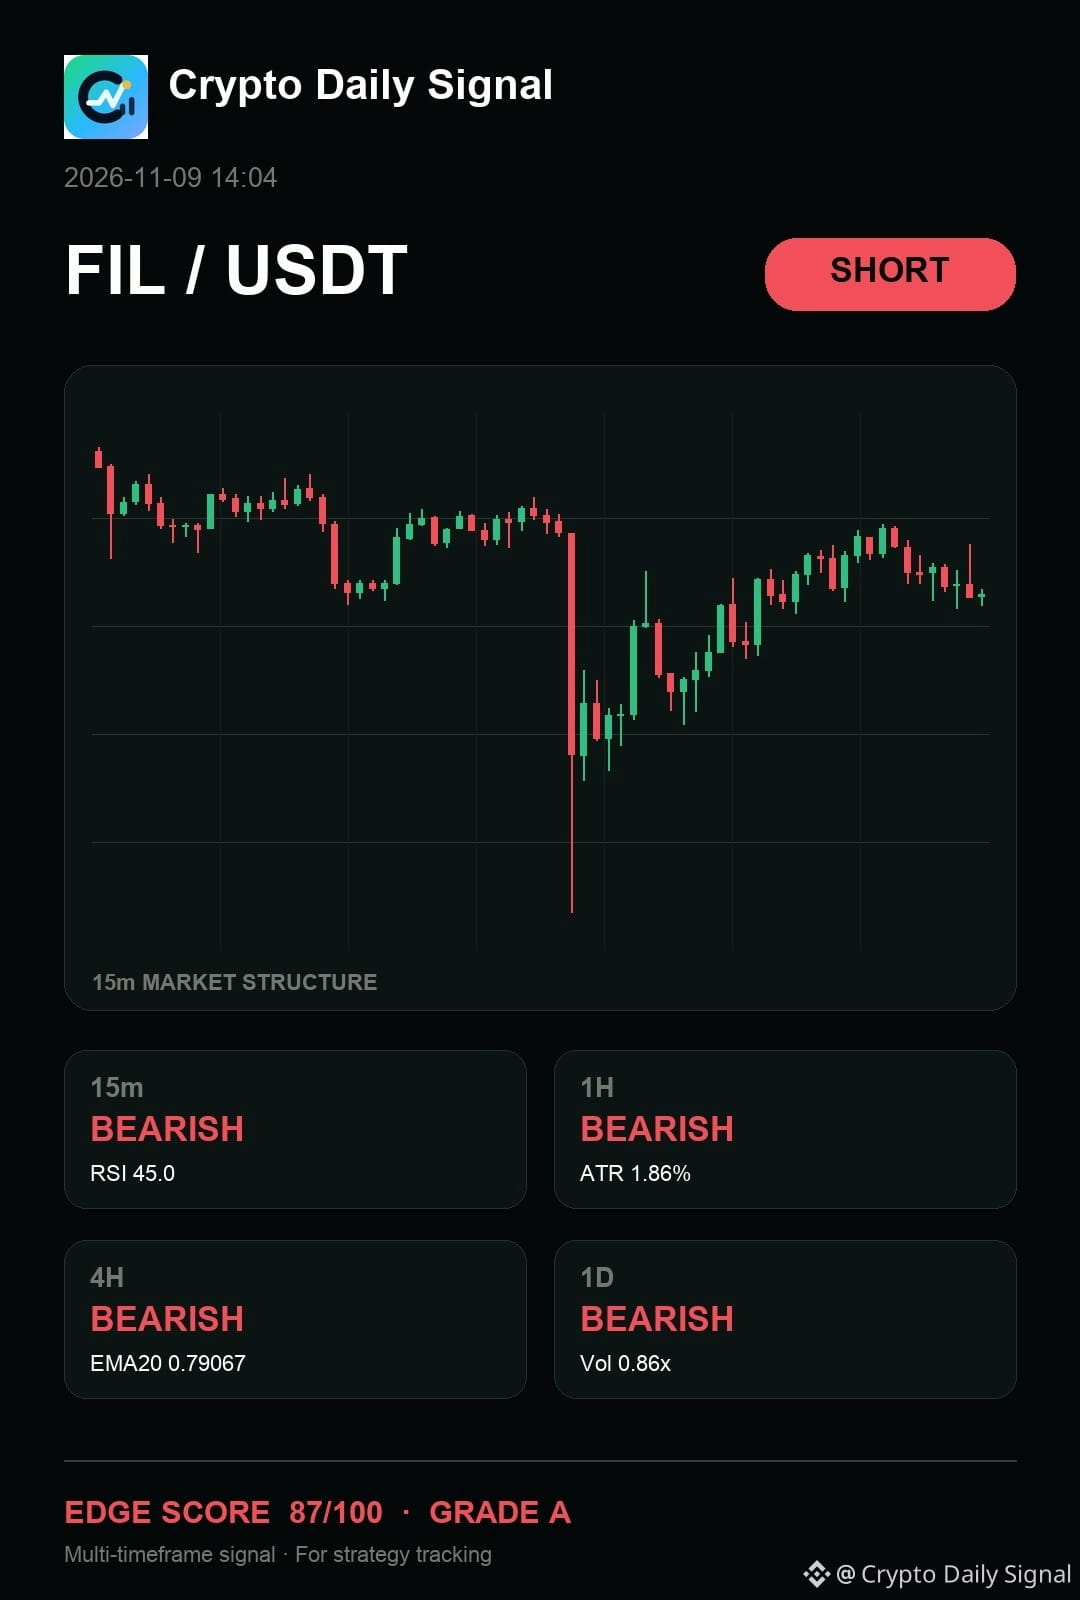
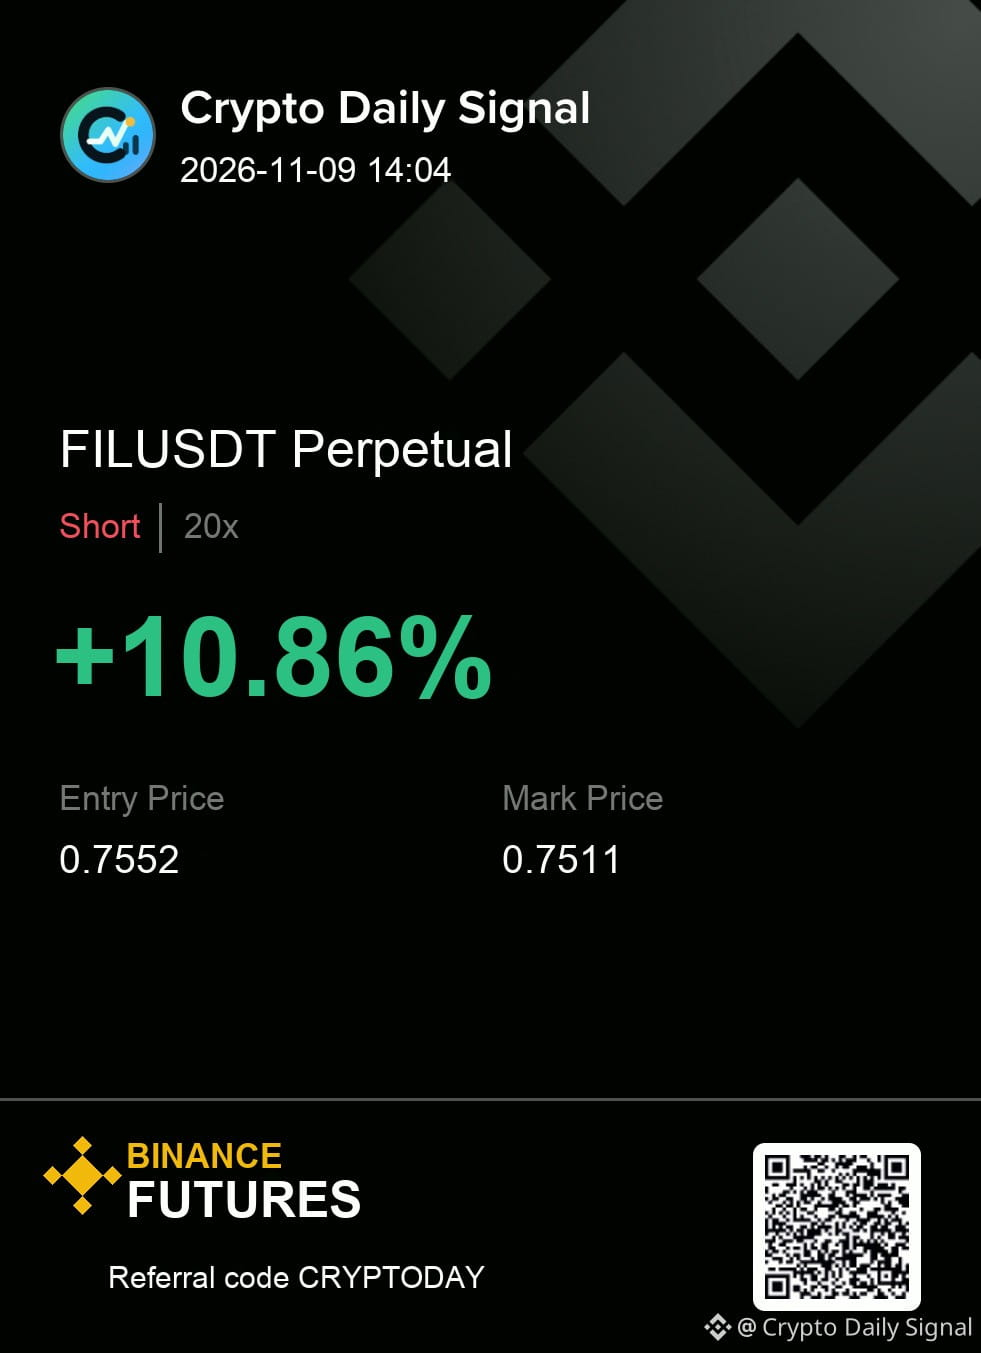
$FIL still offers the cleaner bearish argument as the price struggles within a tight range while lower highs develop across shorter timeframes. A sustained drop below the immediate range bottom would confirm this view, though a strong rally out of that zone weakens the case instantly.
Worth tracking from here, or does the range still need more time?
FILUSDT SHORT map
Entry → 0.7535 - 0.7569
SL → 0.7606
TP → 0.7498 · 0.7455 · 0.7401
#TradeSetup
{future}(FILUSDT)
$FIL still offers the cleaner bearish argument as the price struggles within a tight range while lower highs develop across shorter timeframes. A sustained drop below the immediate range bottom would confirm this view, though a strong rally out of that zone weakens the case instantly.
Worth tracking from here, or does the range still need more time?
FILUSDT SHORT map
Entry → 0.7535 - 0.7569
SL → 0.7606
TP → 0.7498 · 0.7455 · 0.7401
#TradeSetup
Worth tracking from here, or does the range still need more time?
FILUSDT SHORT map
Entry → 0.7535 - 0.7569
SL → 0.7606
TP → 0.7498 · 0.7455 · 0.7401
#TradeSetup
14
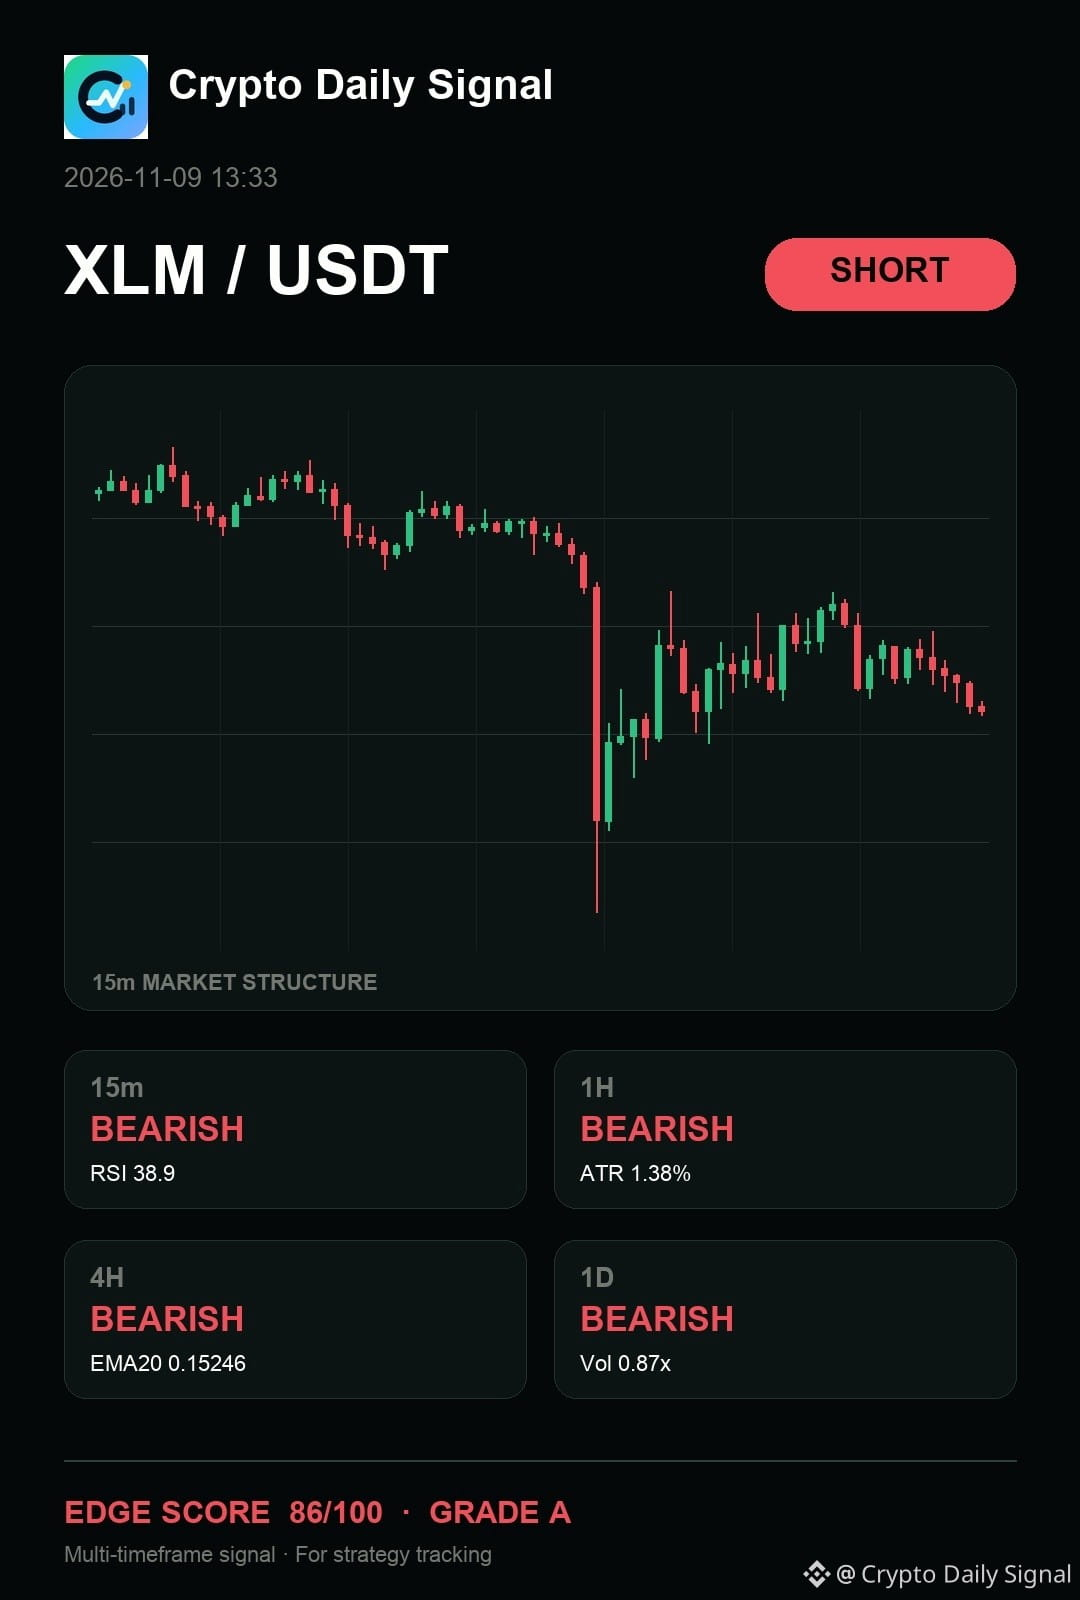
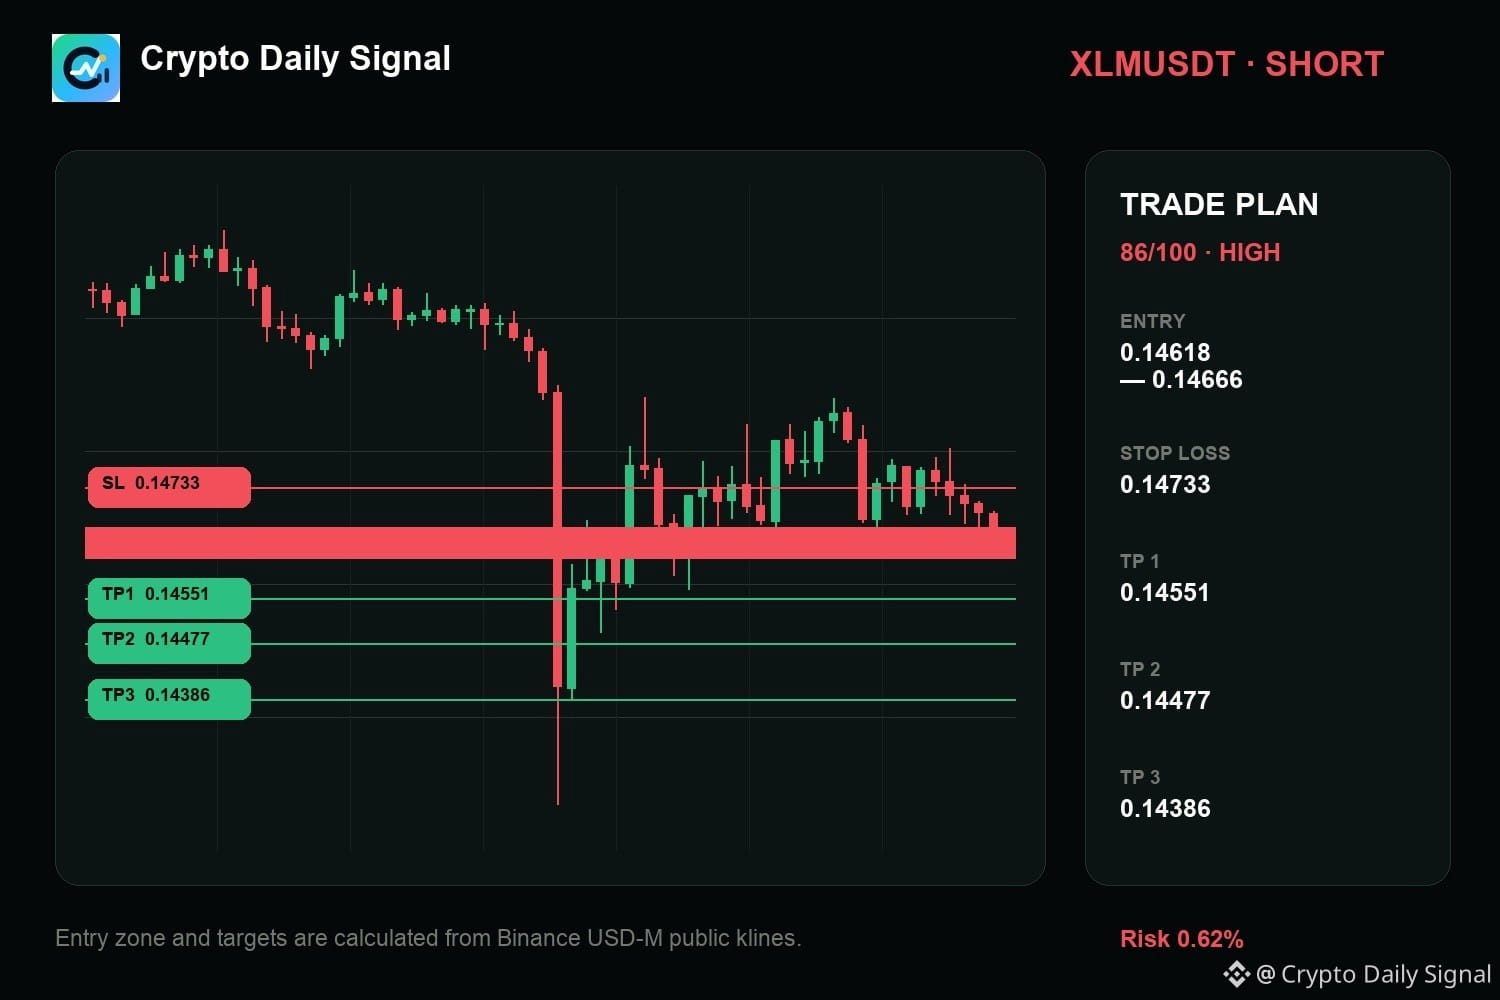
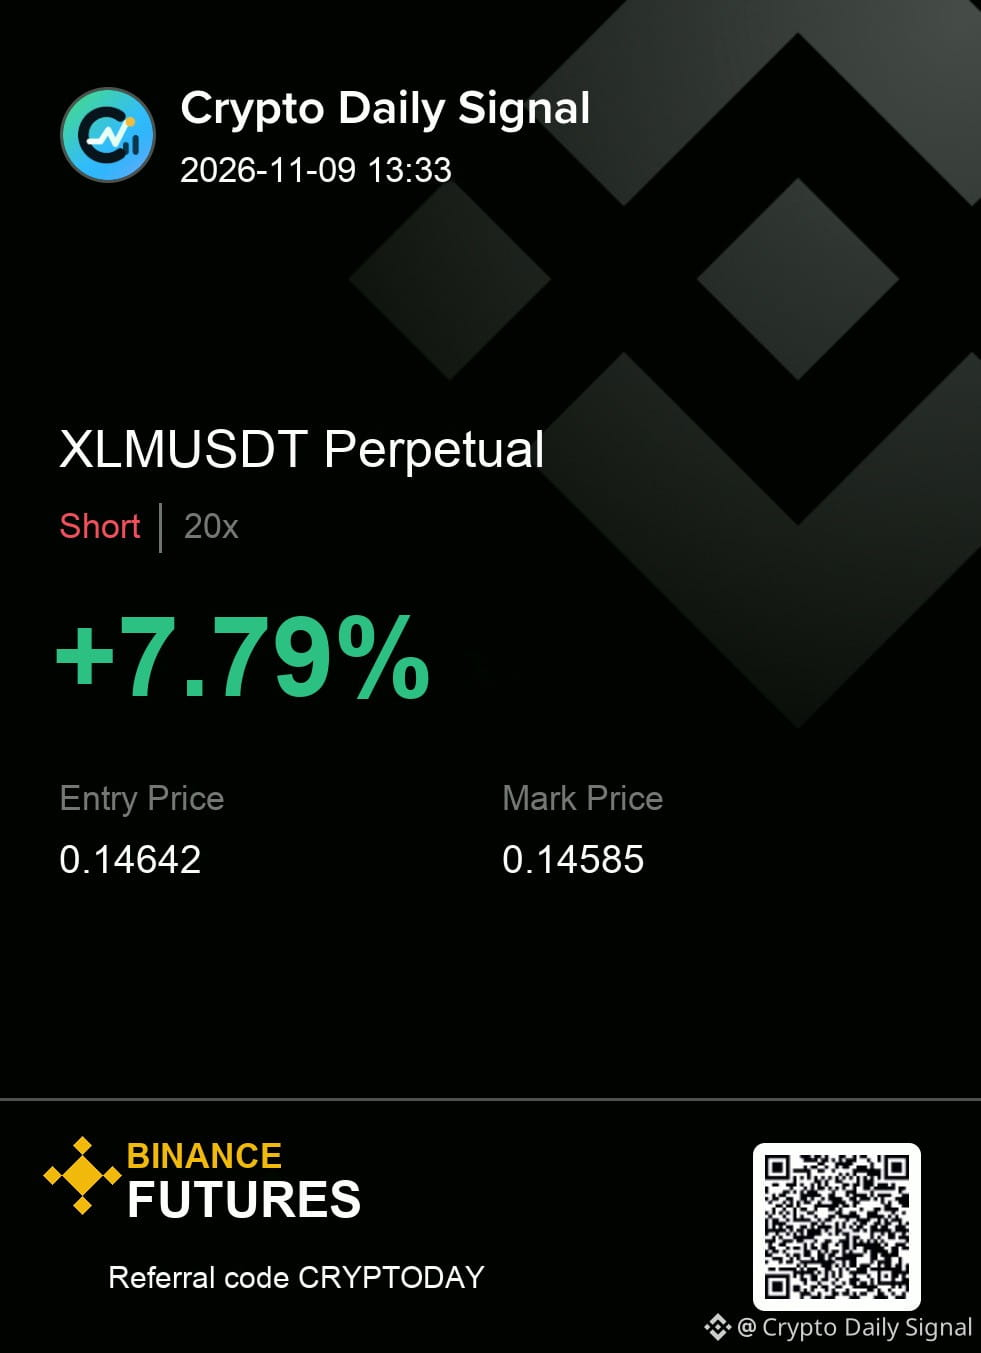
$XLM — ngl, the cleanest read is that it has my attention on the sell side as long as it stays below the immediate prior swing low. The downward trend across the daily and four-hour views is supported by clear lower highs printing in the short-term picture. A convincing close above that recent swing high would quickly erase this bearish expectation.
Levels — XLMUSDT
Zone: 0.14618 - 0.14666
Cut: 0.14733
Scale: 0.14551 | 0.14477 | 0.14386
#TradeSetup
{future}(XLMUSDT)
$XLM — ngl, the cleanest read is that it has my attention on the sell side as long as it stays below the immediate prior swing low. The downward trend across the daily and four-hour views is supported by clear lower highs printing in the short-term picture. A convincing close above that recent swing high would quickly erase this bearish expectation.
Levels — XLMUSDT
Zone: 0.14618 - 0.14666
Cut: 0.14733
Scale: 0.14551 | 0.14477 | 0.14386
#TradeSetup
Levels — XLMUSDT
Zone: 0.14618 - 0.14666
Cut: 0.14733
Scale: 0.14551 | 0.14477 | 0.14386
#TradeSetup
8
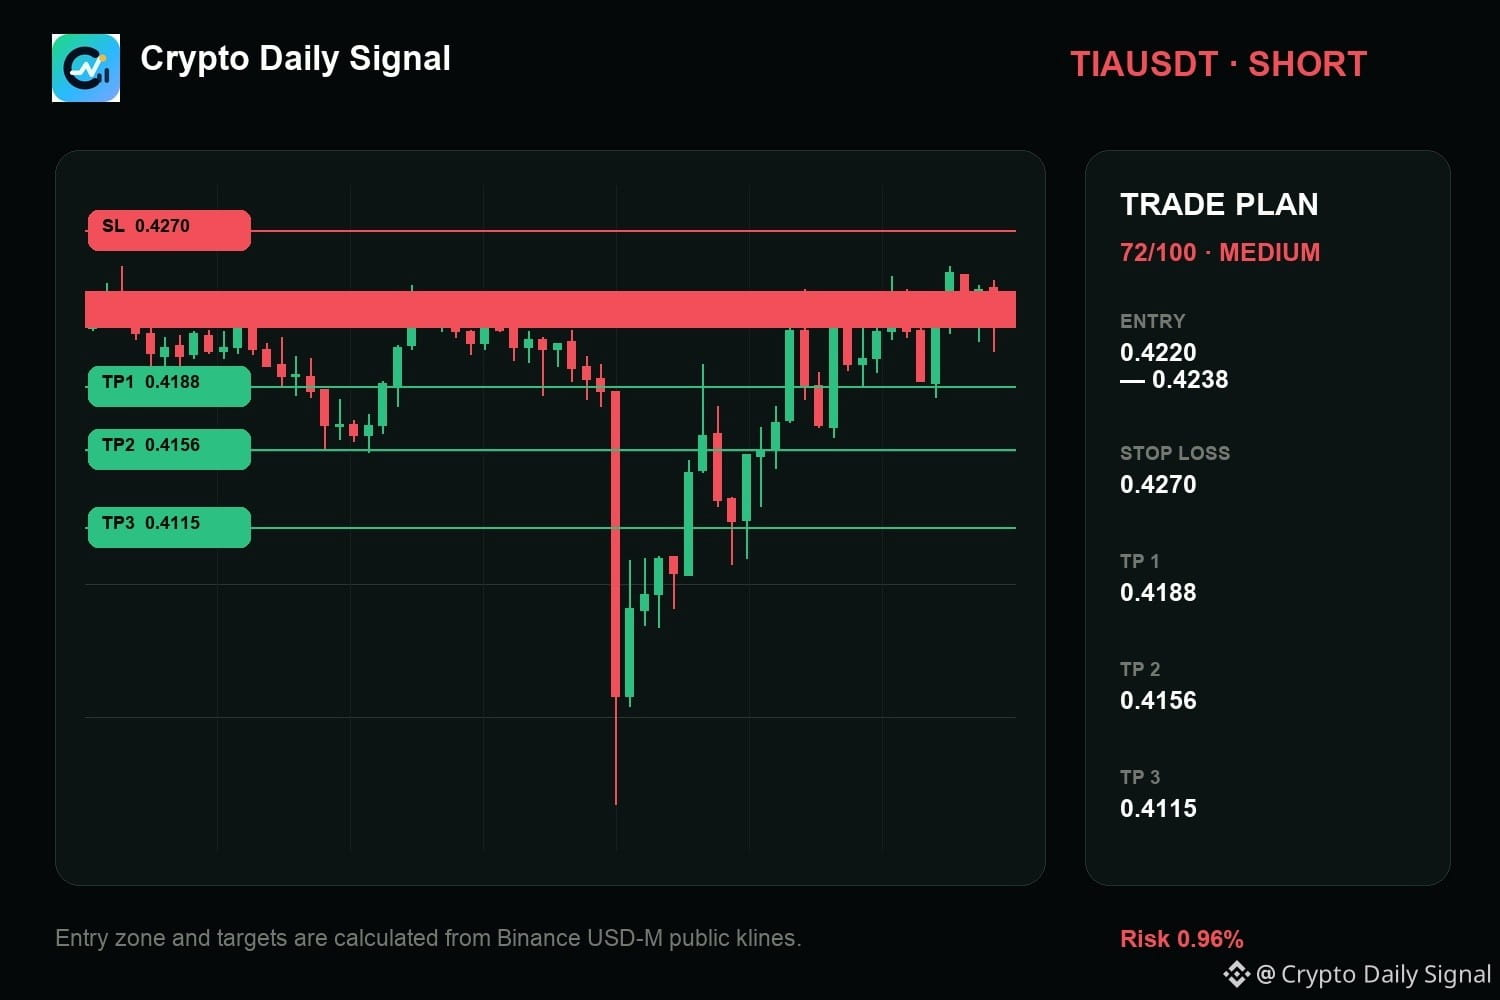
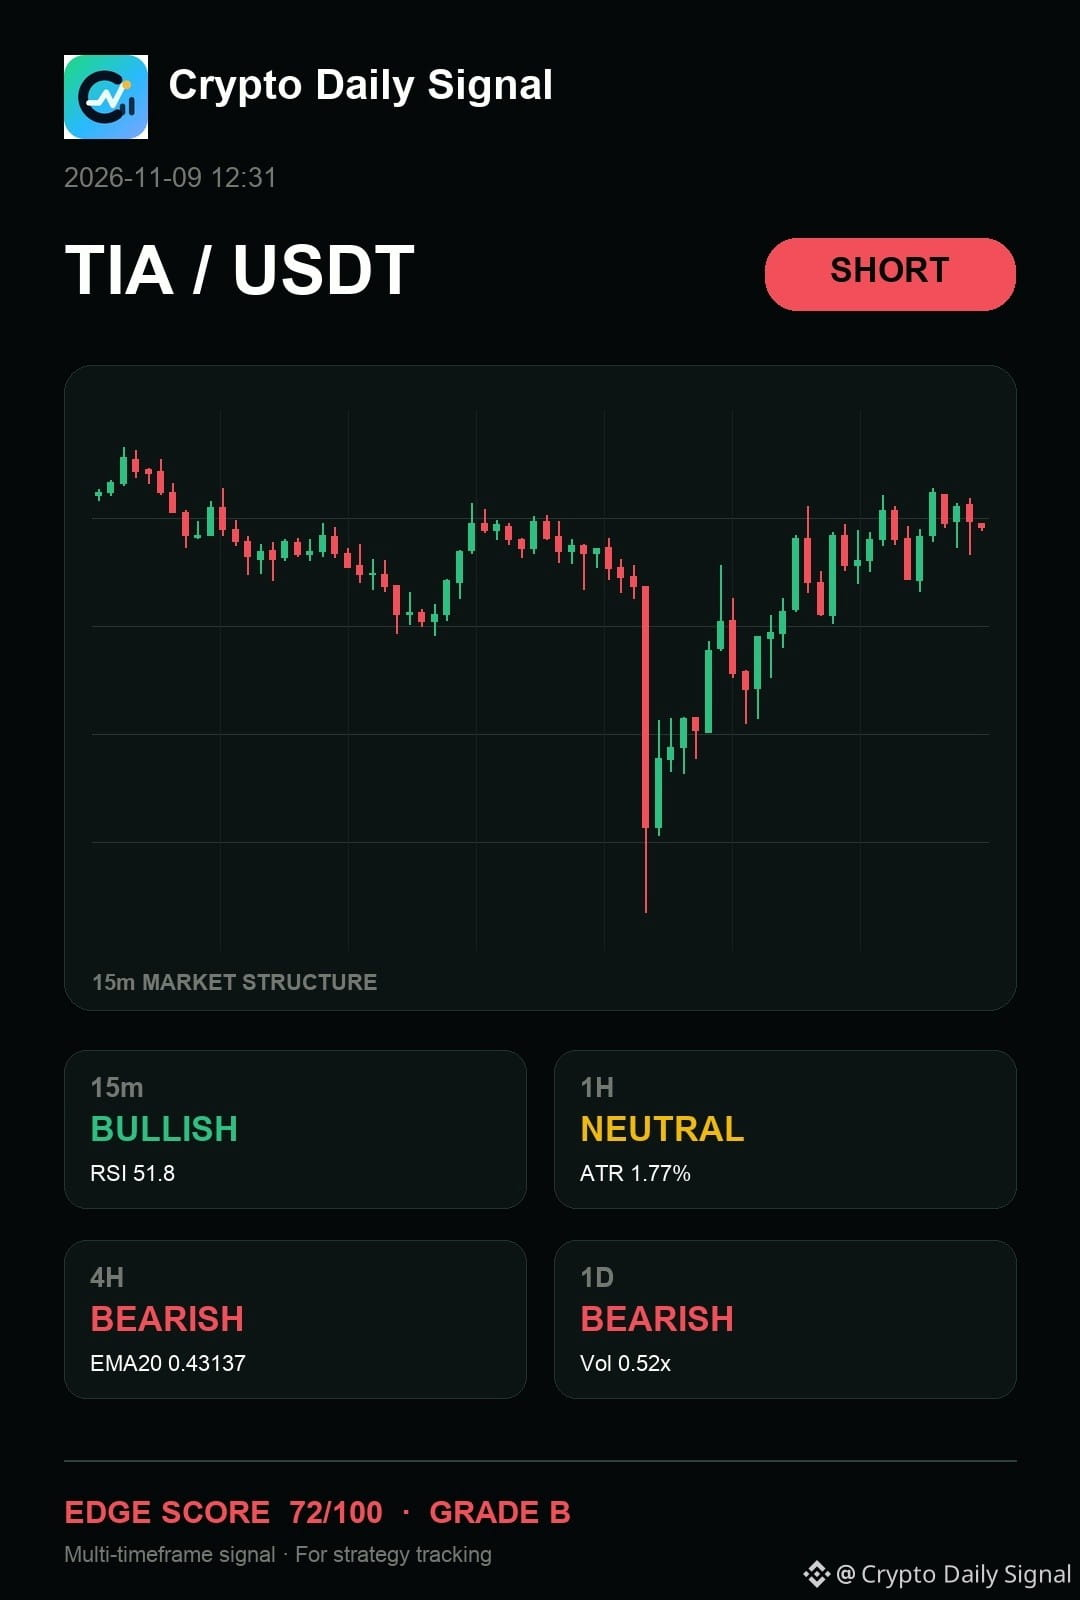
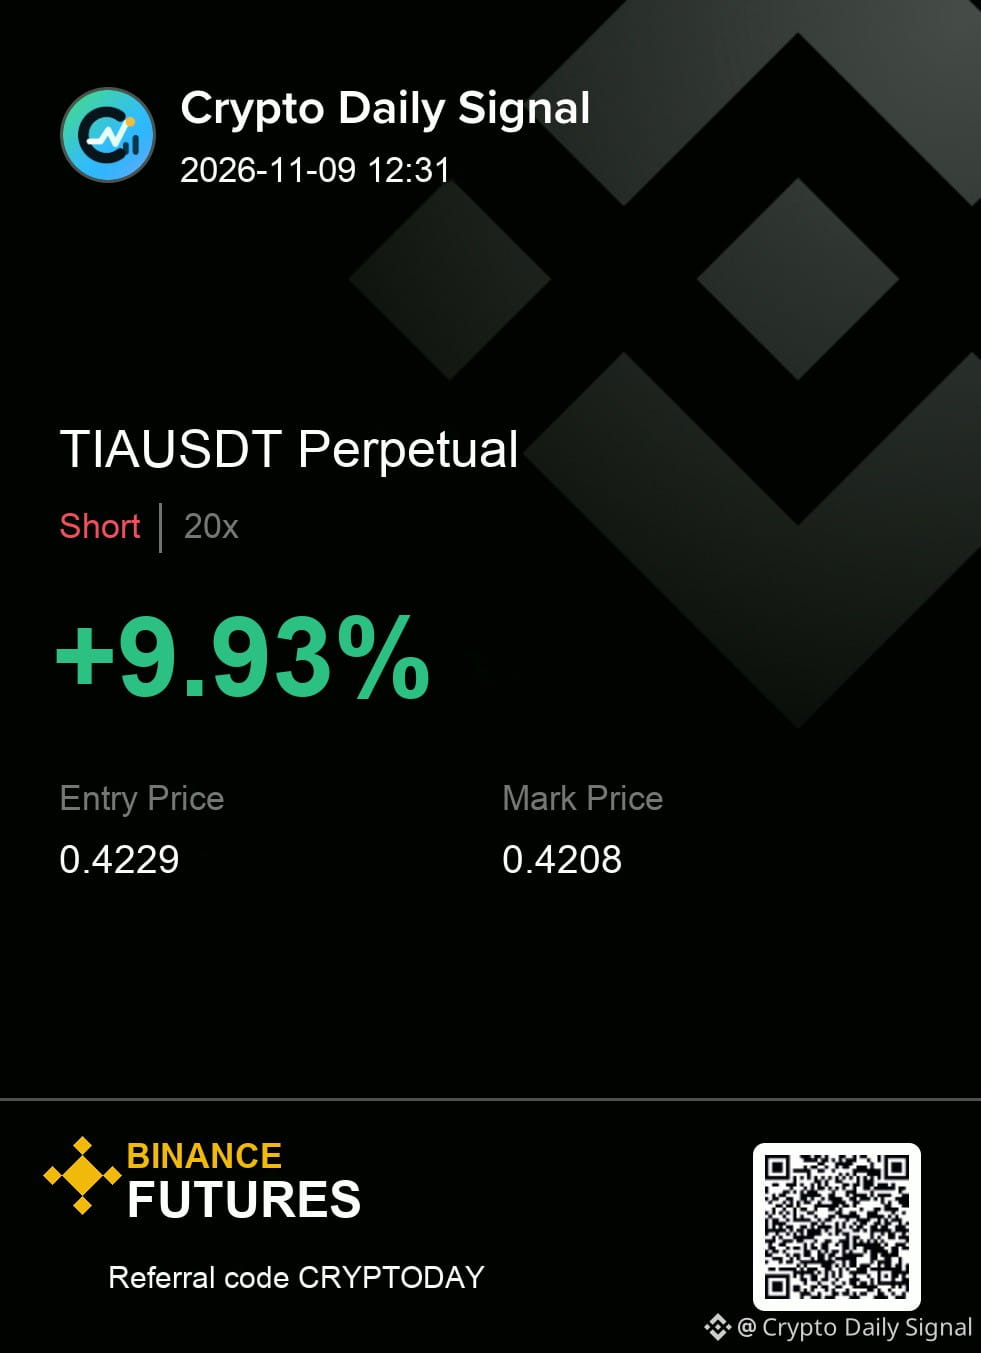
$TIA — ngl, the cleanest read is that it continues to favor the short case as the price stays tucked inside a tight trading range, supported by bearish readings on the daily and four-hour charts. The recent move rejecting the upper boundary suggests the downtrend isn't giving up yet. A decisive close below the range floor would strengthen this short outlook.
My levels for TIAUSDT — SHORT
Entry zone 0.4220 - 0.4238
Risk line 0.4270
Targets 0.4188 / 0.4156 / 0.4115
The levels matter more than the prediction. Size it accordingly.
#TradeSetup
{future}(TIAUSDT)
$TIA — ngl, the cleanest read is that it continues to favor the short case as the price stays tucked inside a tight trading range, supported by bearish readings on the daily and four-hour charts. The recent move rejecting the upper boundary suggests the downtrend isn't giving up yet. A decisive close below the range floor would strengthen this short outlook.
My levels for TIAUSDT — SHORT
Entry zone 0.4220 - 0.4238
Risk line 0.4270
Targets 0.4188 / 0.4156 / 0.4115
The levels matter more than the prediction. Size it accordingly.
#TradeSetup
My levels for TIAUSDT — SHORT
Entry zone 0.4220 - 0.4238
Risk line 0.4270
Targets 0.4188 / 0.4156 / 0.4115
The levels matter more than the prediction. Size it accordingly.
#TradeSetup
17
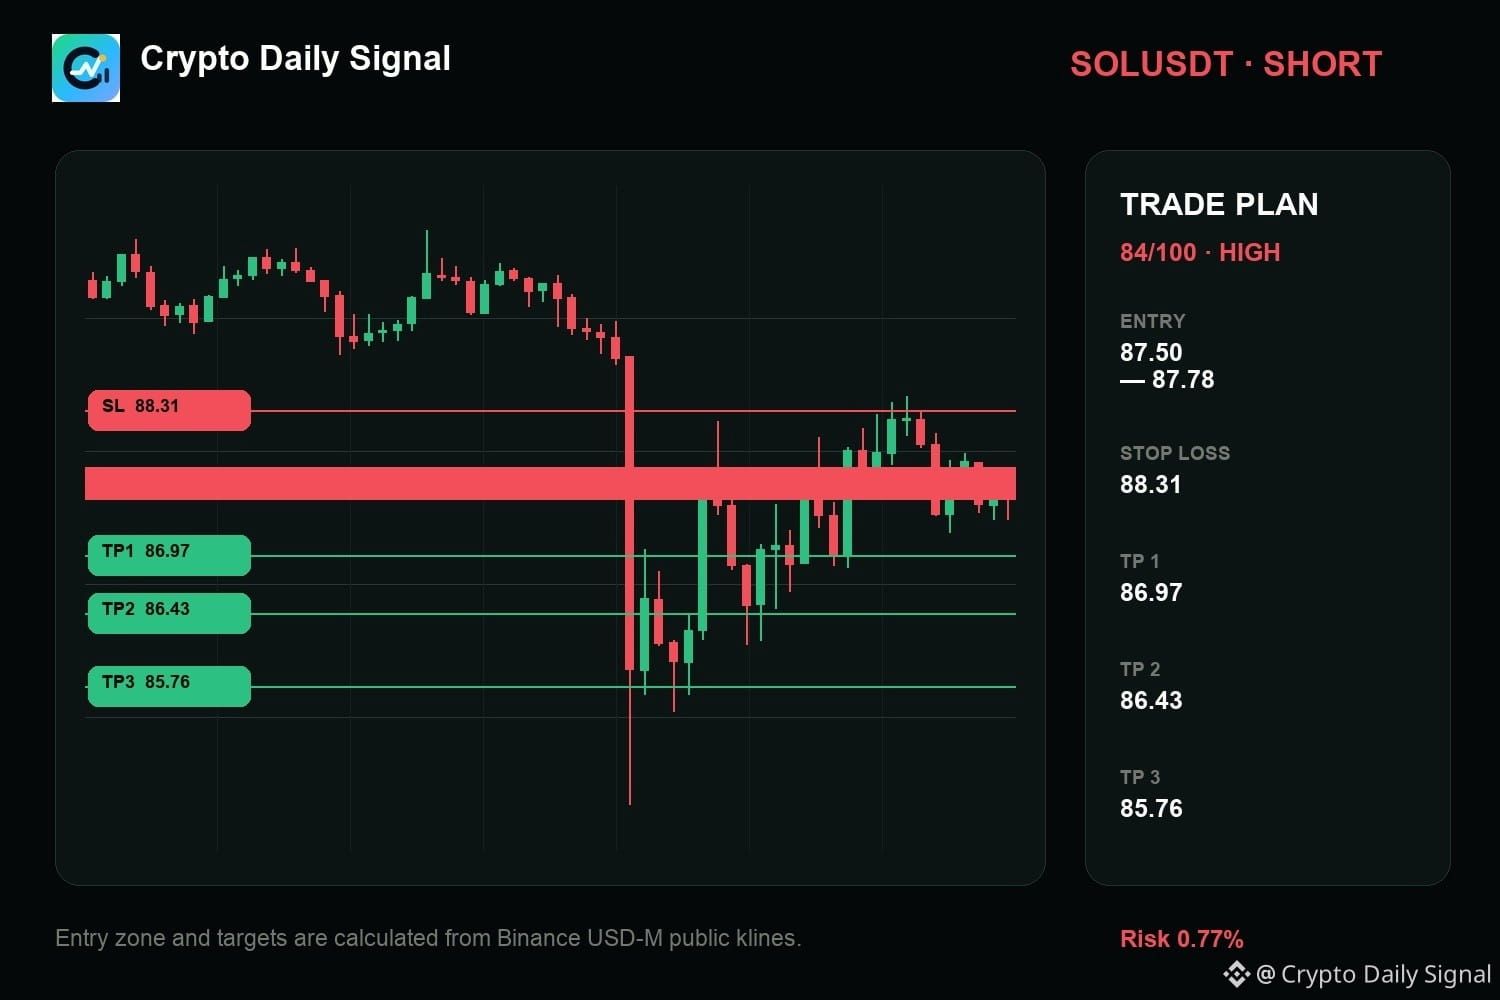
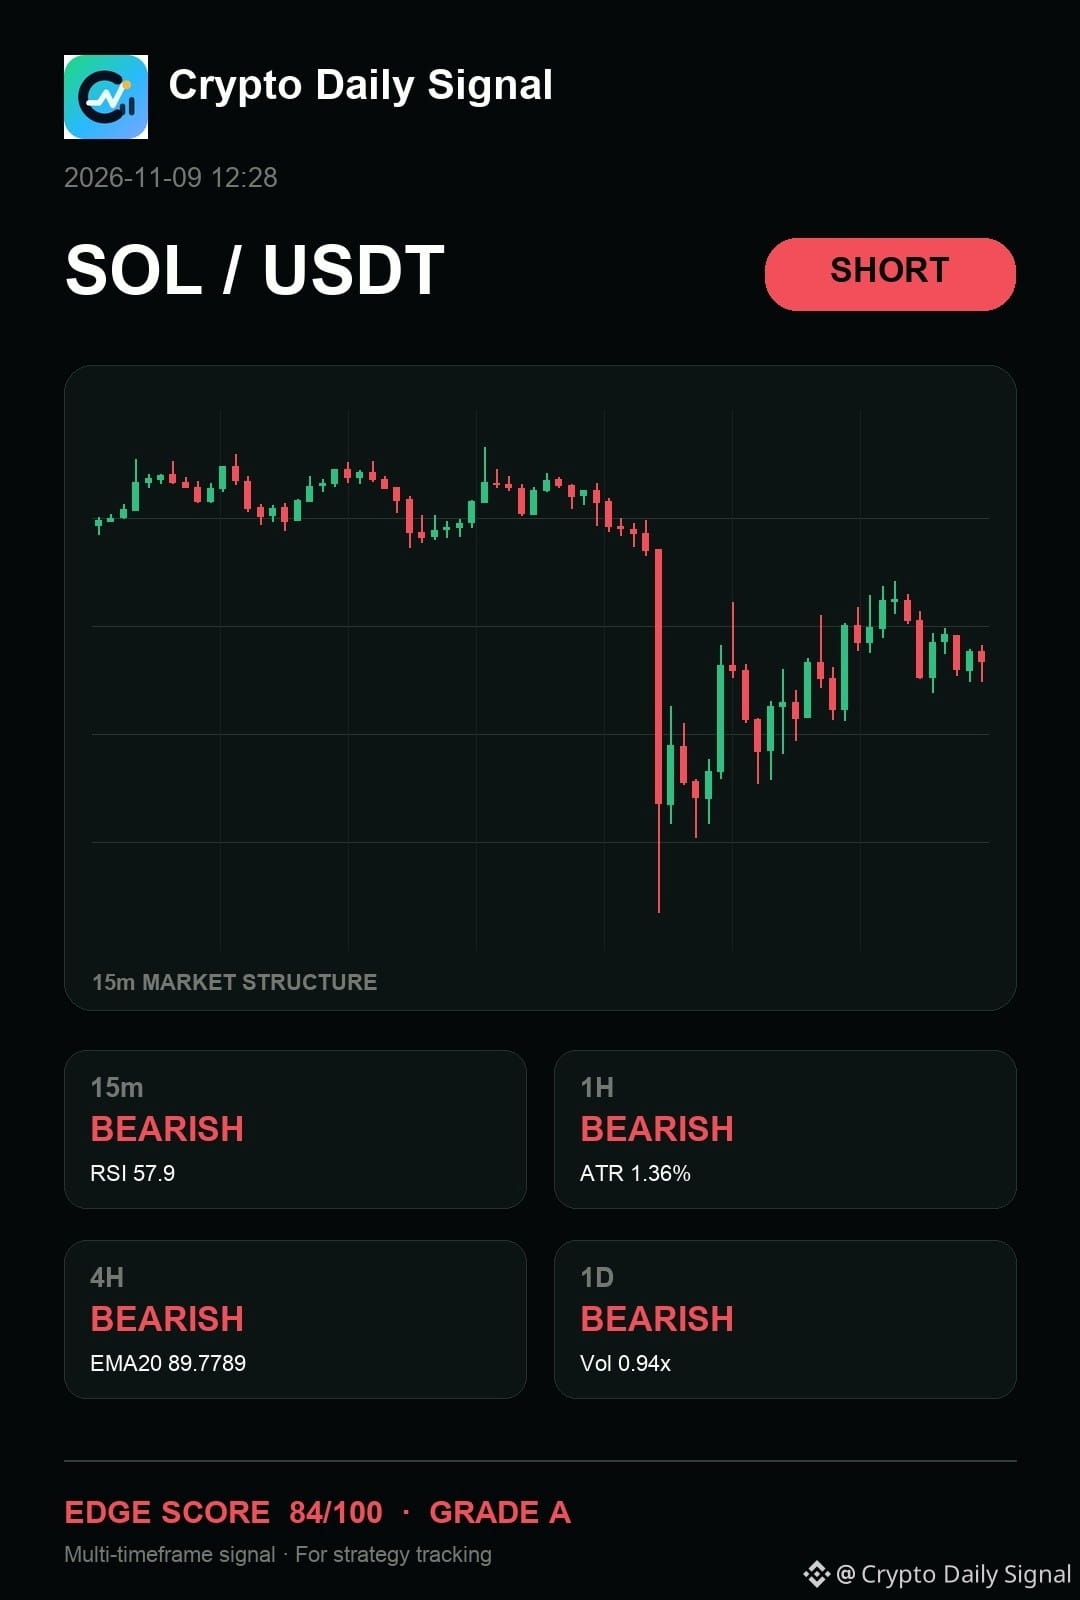
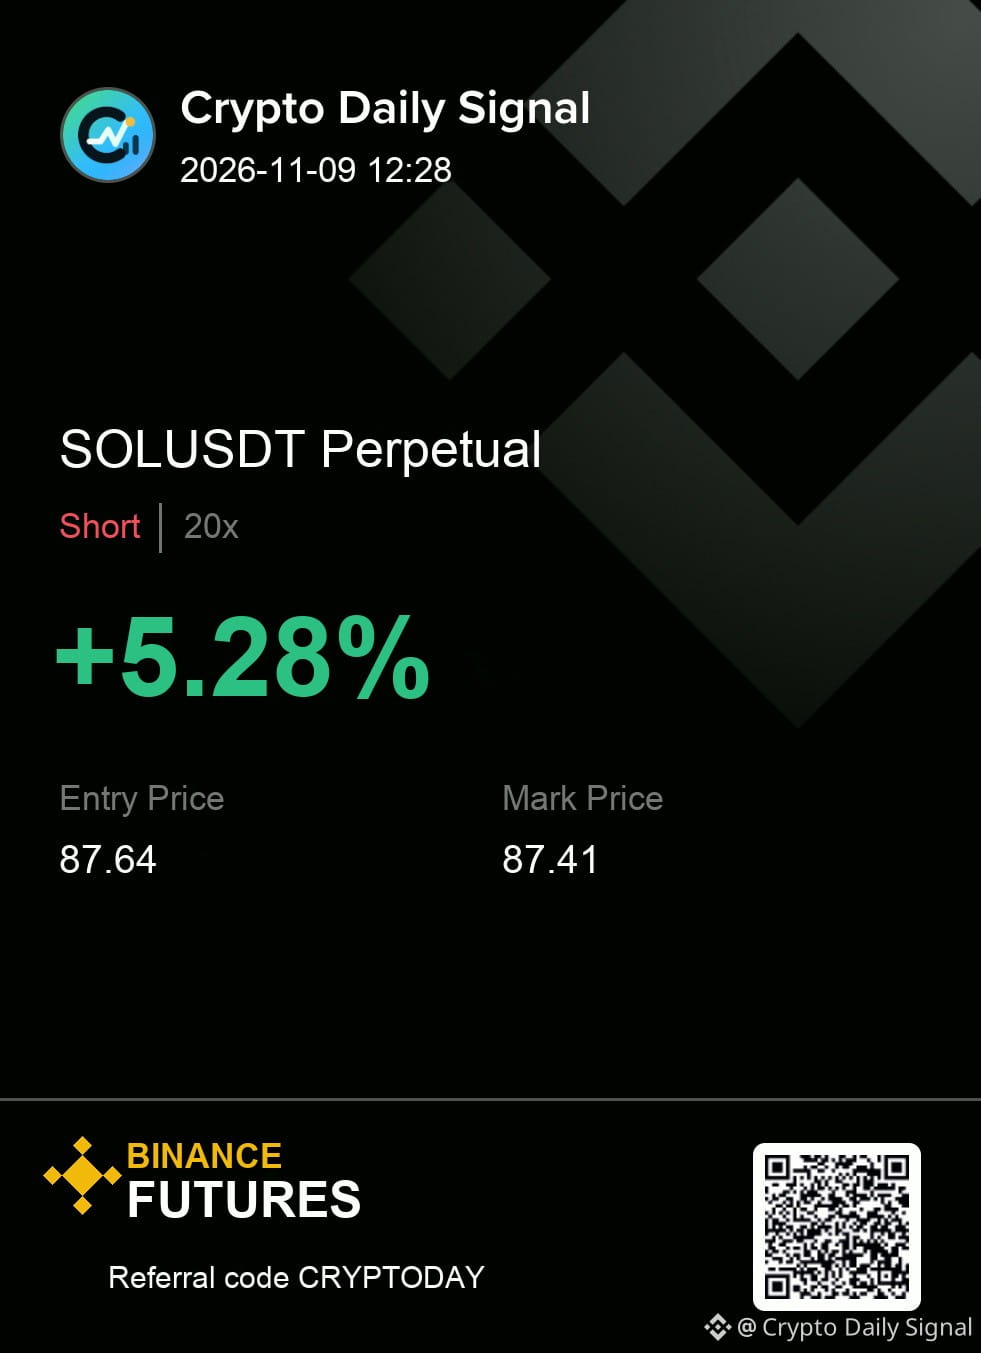
$SOL — look, my read is simple: it has a short map worth monitoring. Broader price action remains bearish and the four-hour structure is bearish. I want confirmation from the zone before adding risk, because a move through the cut level would cancel the thesis immediately.
SOLUSDT | SHORT
Entry 87.50 - 87.78
Invalidation 88.31
Targets 86.97 / 86.43 / 85.76
#TradeSetup
{future}(SOLUSDT)
$SOL — look, my read is simple: it has a short map worth monitoring. Broader price action remains bearish and the four-hour structure is bearish. I want confirmation from the zone before adding risk, because a move through the cut level would cancel the thesis immediately.
SOLUSDT | SHORT
Entry 87.50 - 87.78
Invalidation 88.31
Targets 86.97 / 86.43 / 85.76
#TradeSetup
SOLUSDT | SHORT
Entry 87.50 - 87.78
Invalidation 88.31
Targets 86.97 / 86.43 / 85.76
#TradeSetup
7
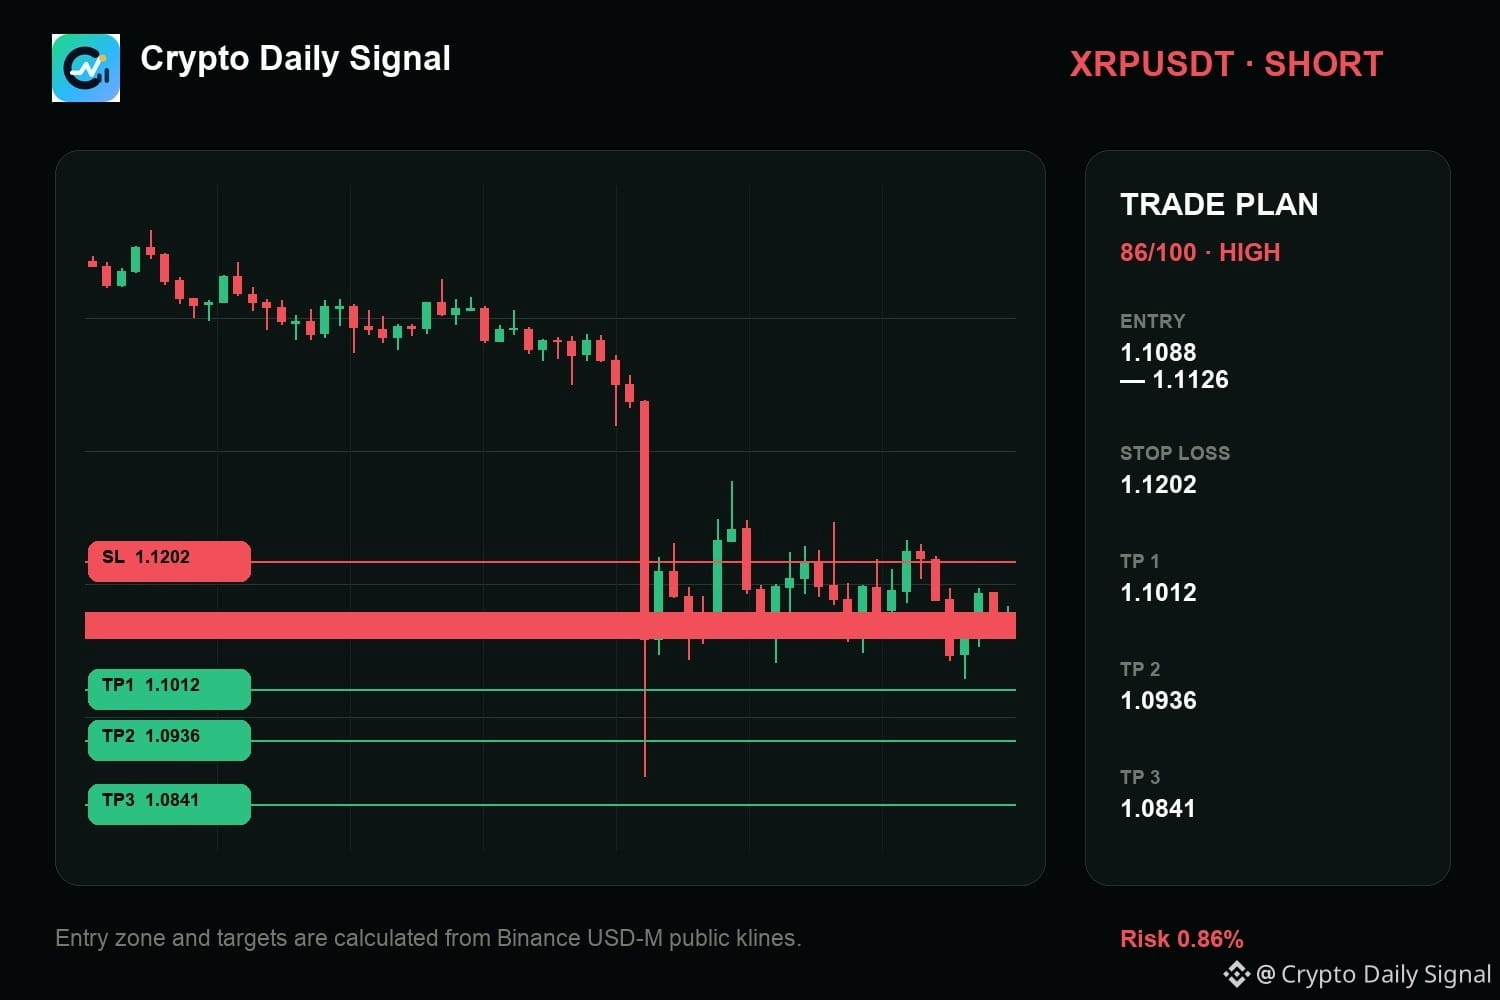
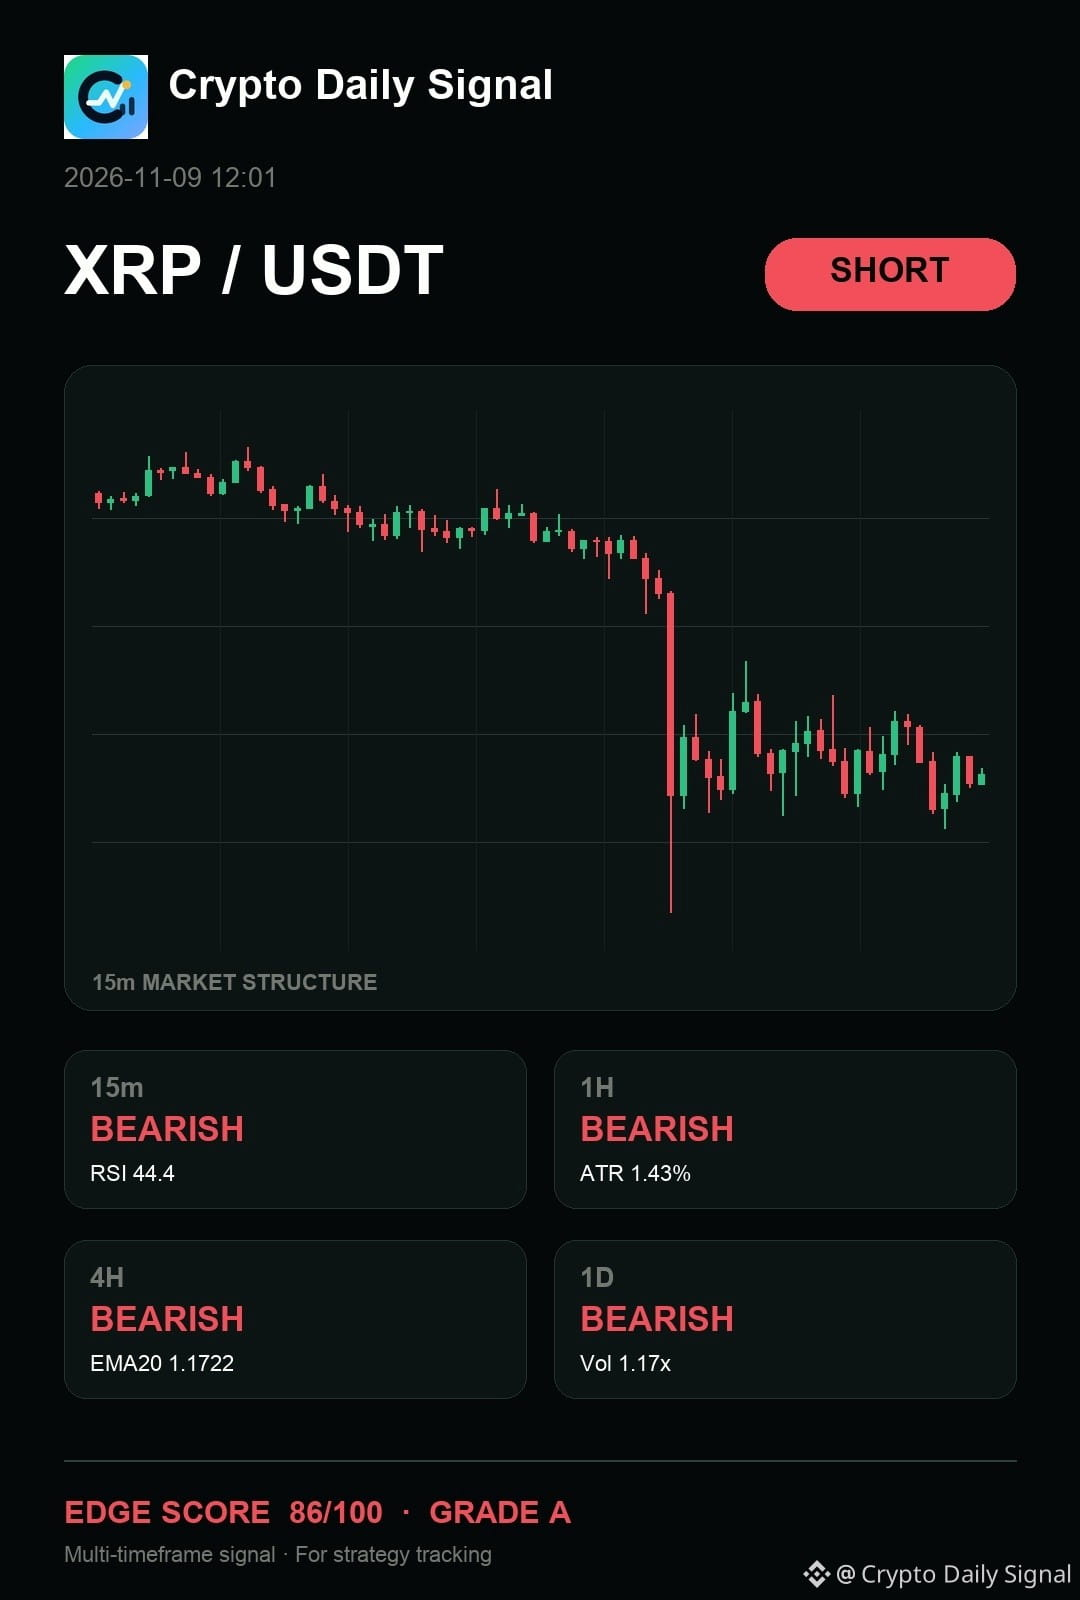
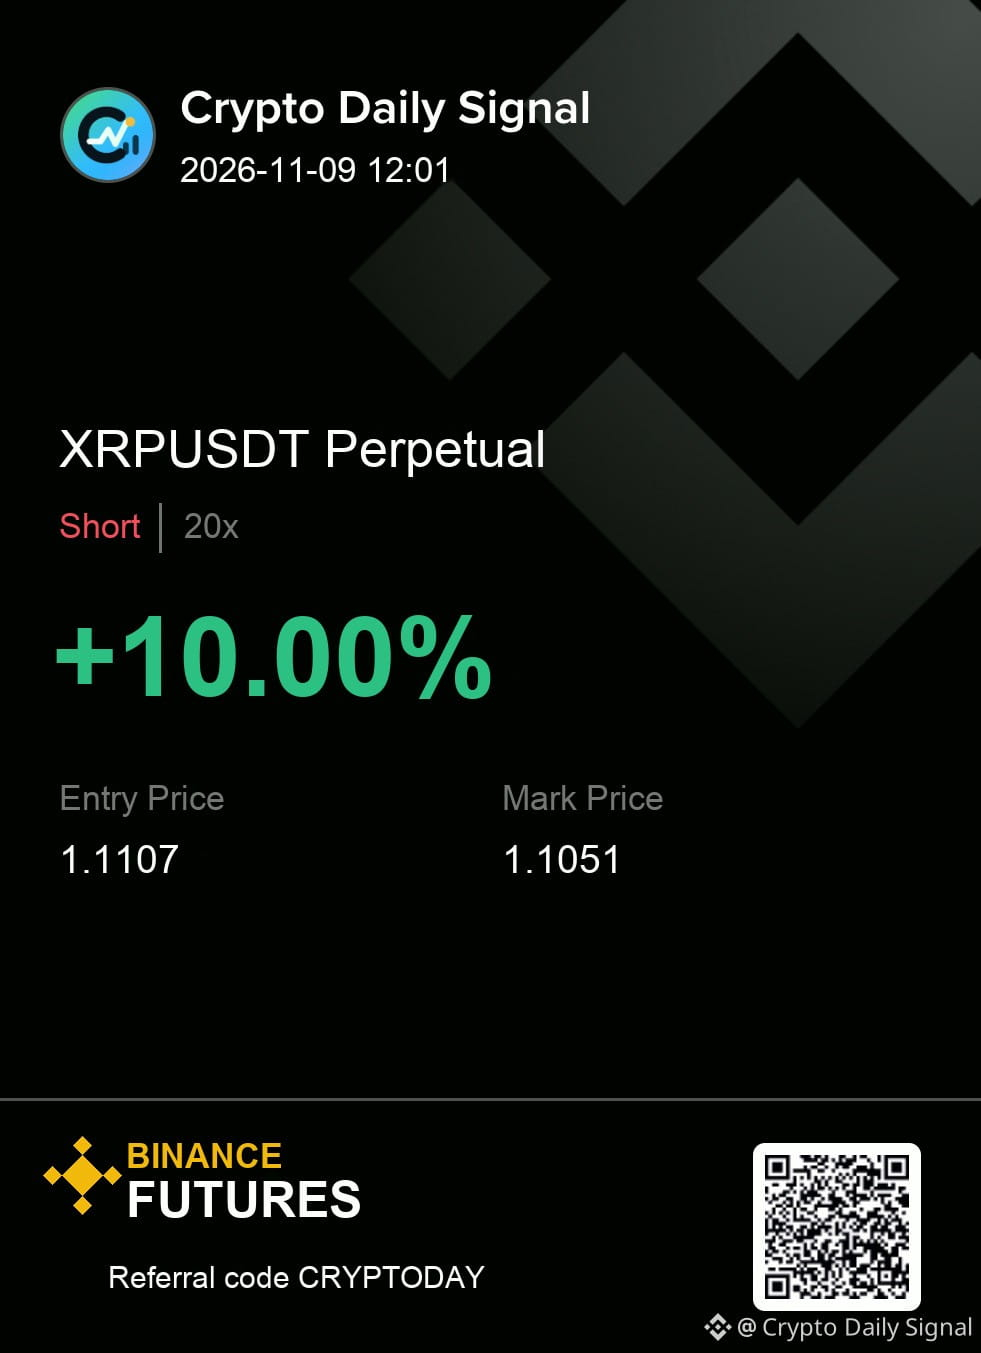
$XRP — honestly, the chart still says it sits on my short-side watchlist. The pattern is showing lower highs and lower lows, keeping the bias clearly bearish across the shorter timeframes. A decisive move below the range floor on a bearish candle would trigger action. A strong close above the recent high invalidates this bearish outlook.
Execution plan (XRPUSDT — SHORT)
Entry: 1.1088 - 1.1126 | SL: 1.1202
Take profit: 1.1012 → 1.0936 → 1.0841
#TradeSetup
{future}(XRPUSDT)
$XRP — honestly, the chart still says it sits on my short-side watchlist. The pattern is showing lower highs and lower lows, keeping the bias clearly bearish across the shorter timeframes. A decisive move below the range floor on a bearish candle would trigger action. A strong close above the recent high invalidates this bearish outlook.
Execution plan (XRPUSDT — SHORT)
Entry: 1.1088 - 1.1126 | SL: 1.1202
Take profit: 1.1012 → 1.0936 → 1.0841
#TradeSetup
Execution plan (XRPUSDT — SHORT)
Entry: 1.1088 - 1.1126 | SL: 1.1202
Take profit: 1.1012 → 1.0936 → 1.0841
#TradeSetup
6
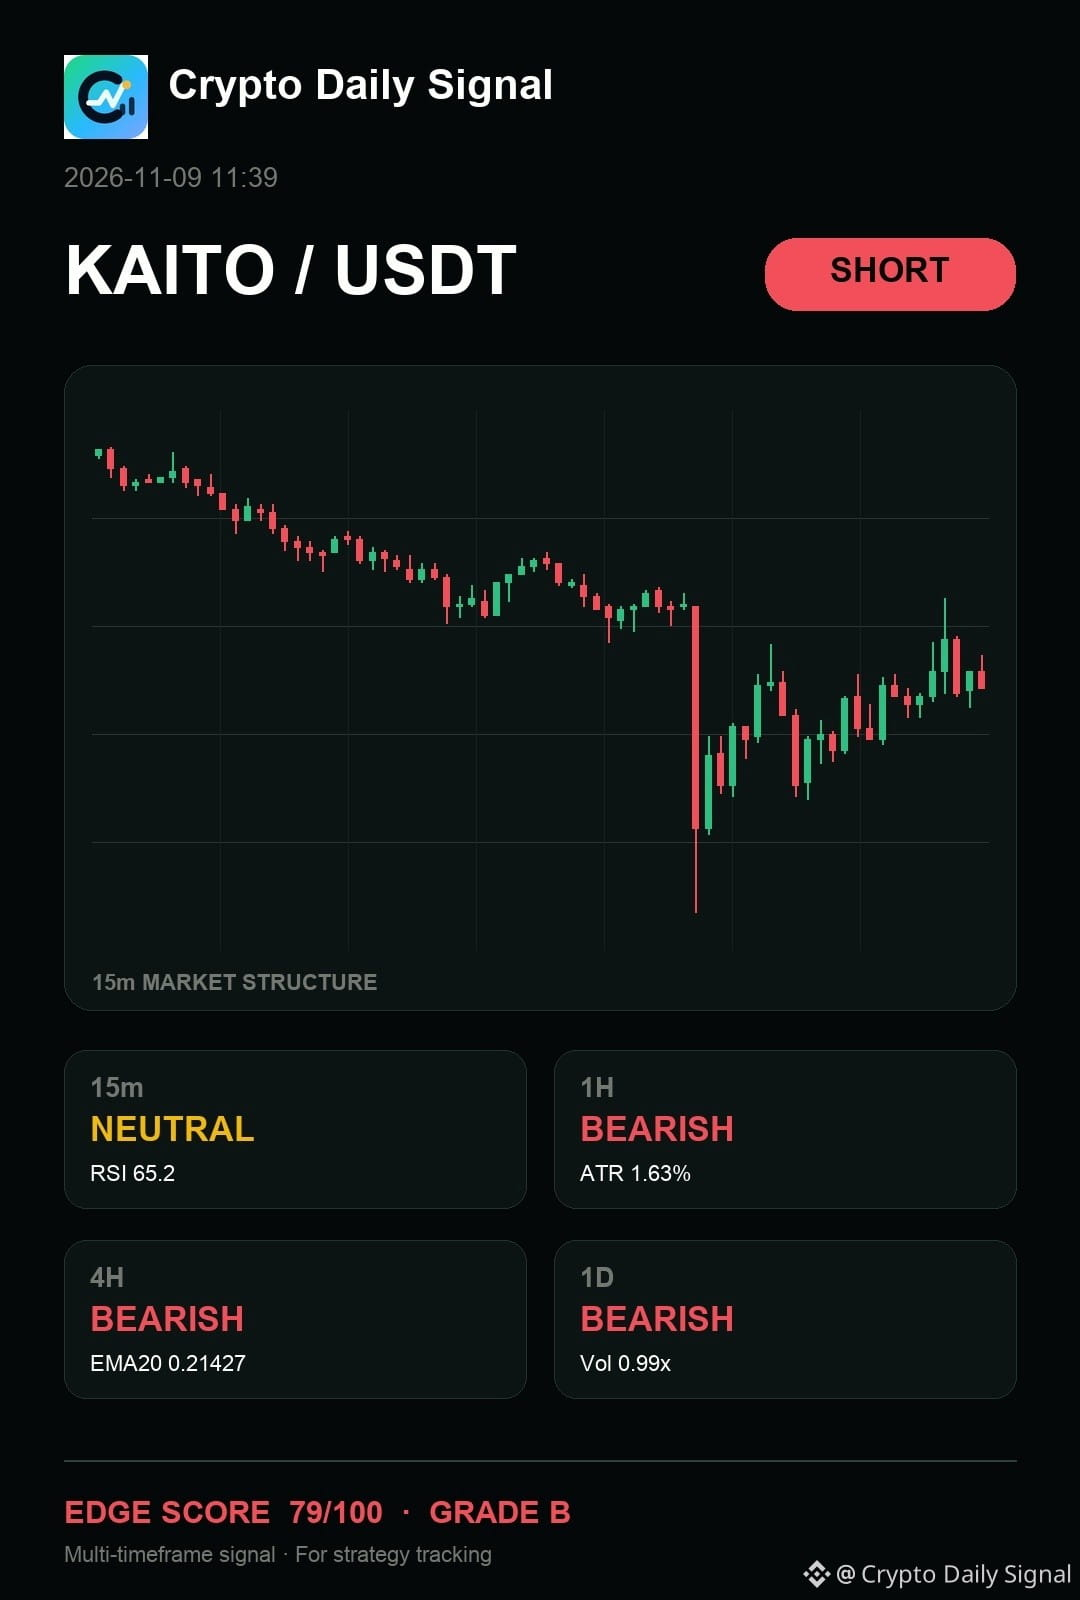
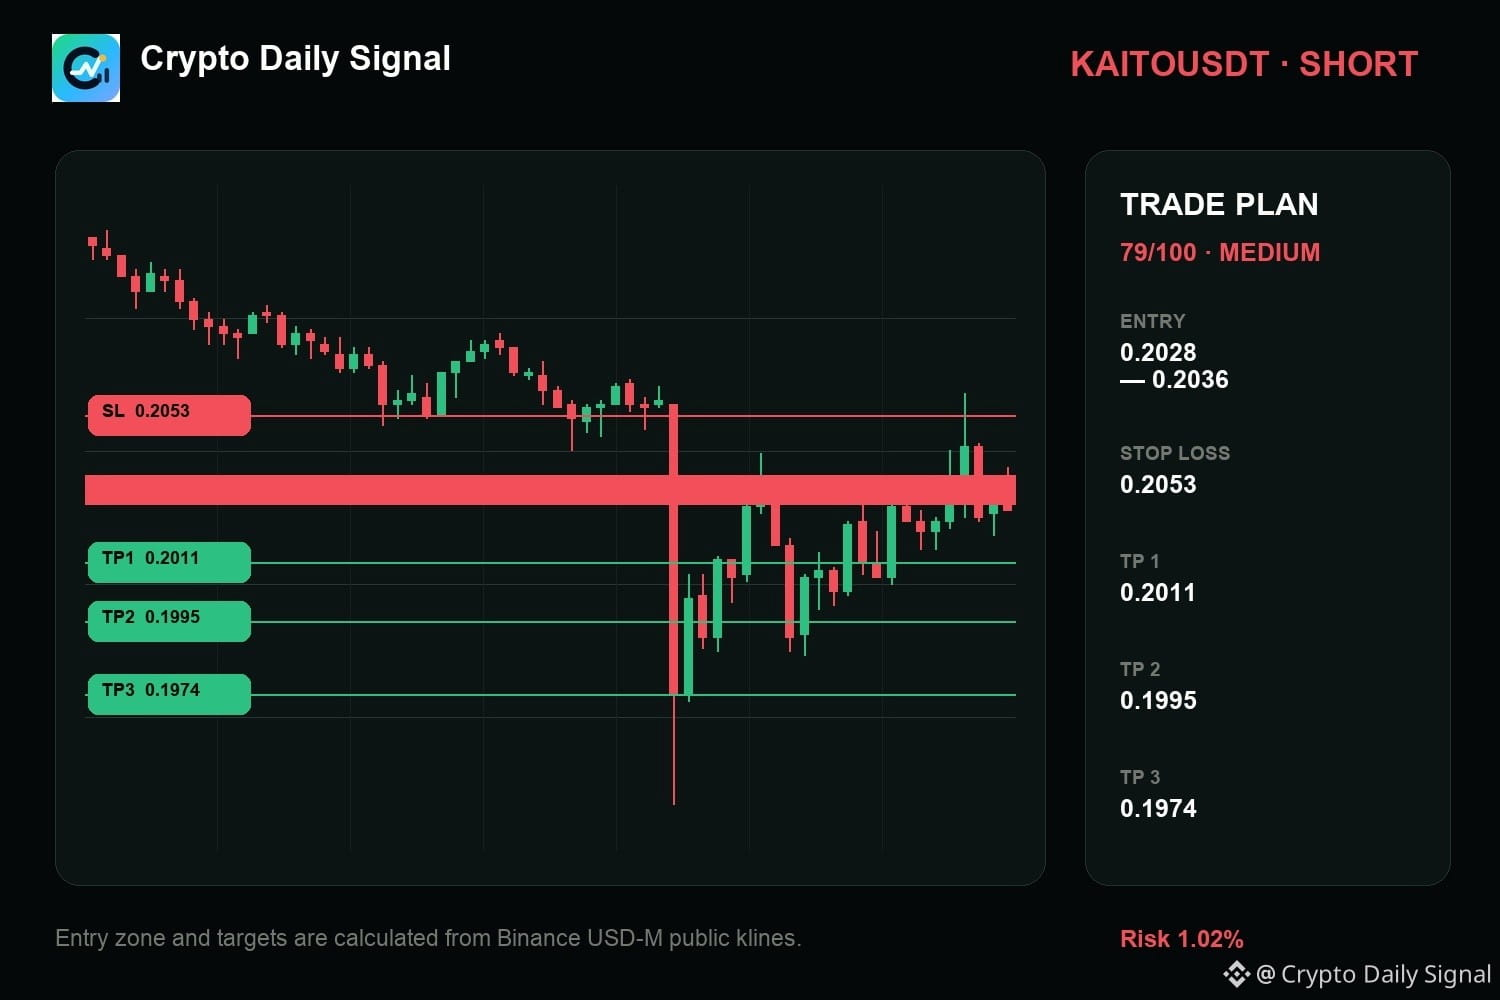
$KAITO — for me, the core read is that it remains a short watch for me because the recent price action paints a clear bearish picture on the higher timeframes. The candles are forming lower highs, which suggests selling pressure is currently in control below the descending trendline. A break below immediate support would confirm the downside move, though a strong rally above the recent swing high would signal a shift.
Levels — KAITOUSDT
Zone: 0.2028 - 0.2036
Cut: 0.2053
Scale: 0.2011 | 0.1995 | 0.1974
Would you take it here, or wait for one more confirmation candle?
#TradeSetup
{future}(KAITOUSDT)
$KAITO — for me, the core read is that it remains a short watch for me because the recent price action paints a clear bearish picture on the higher timeframes. The candles are forming lower highs, which suggests selling pressure is currently in control below the descending trendline. A break below immediate support would confirm the downside move, though a strong rally above the recent swing high would signal a shift.
Levels — KAITOUSDT
Zone: 0.2028 - 0.2036
Cut: 0.2053
Scale: 0.2011 | 0.1995 | 0.1974
Would you take it here, or wait for one more confirmation candle?
#TradeSetup
Levels — KAITOUSDT
Zone: 0.2028 - 0.2036
Cut: 0.2053
Scale: 0.2011 | 0.1995 | 0.1974
Would you take it here, or wait for one more confirmation candle?
#TradeSetup
10
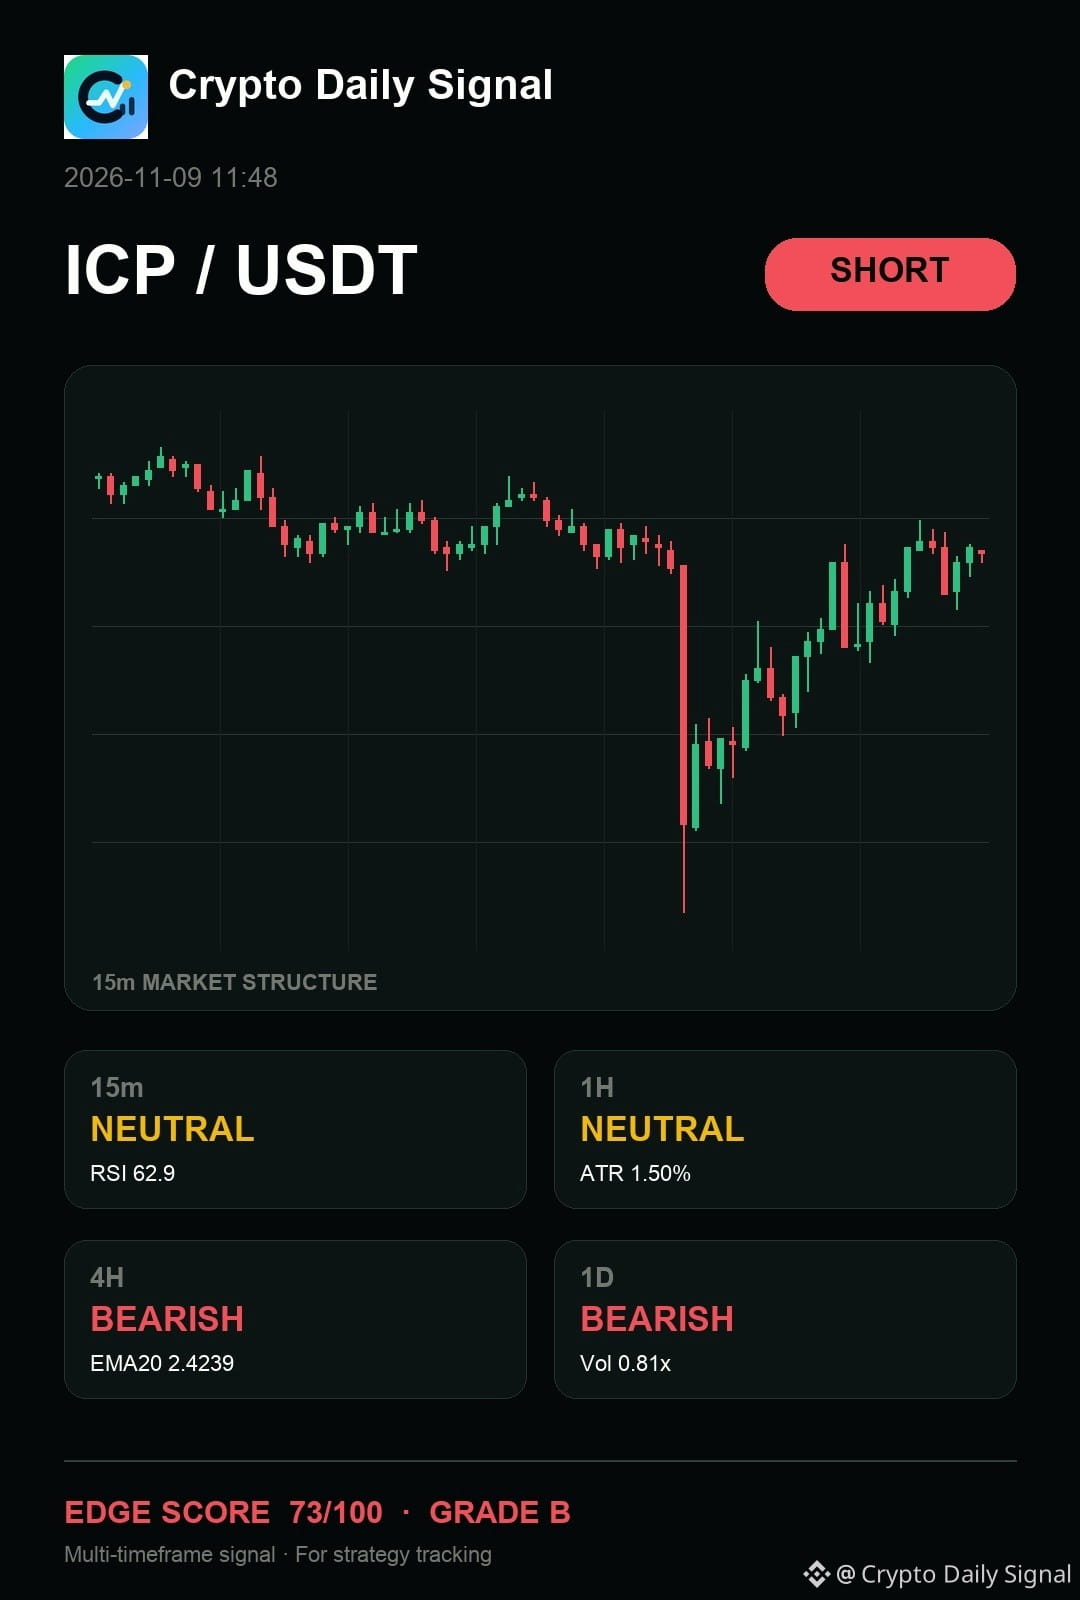
$ICP — ngl, the cleanest read is that it still gives sellers the cleaner argument as the current price stays near the bottom of its recent range. Bearish signals are showing up on the daily and four-hour charts, even though the short-term movement lacks real force. For this downside to play out, we need a clear break below that range floor.
The levels matter more than the prediction. Size it accordingly.
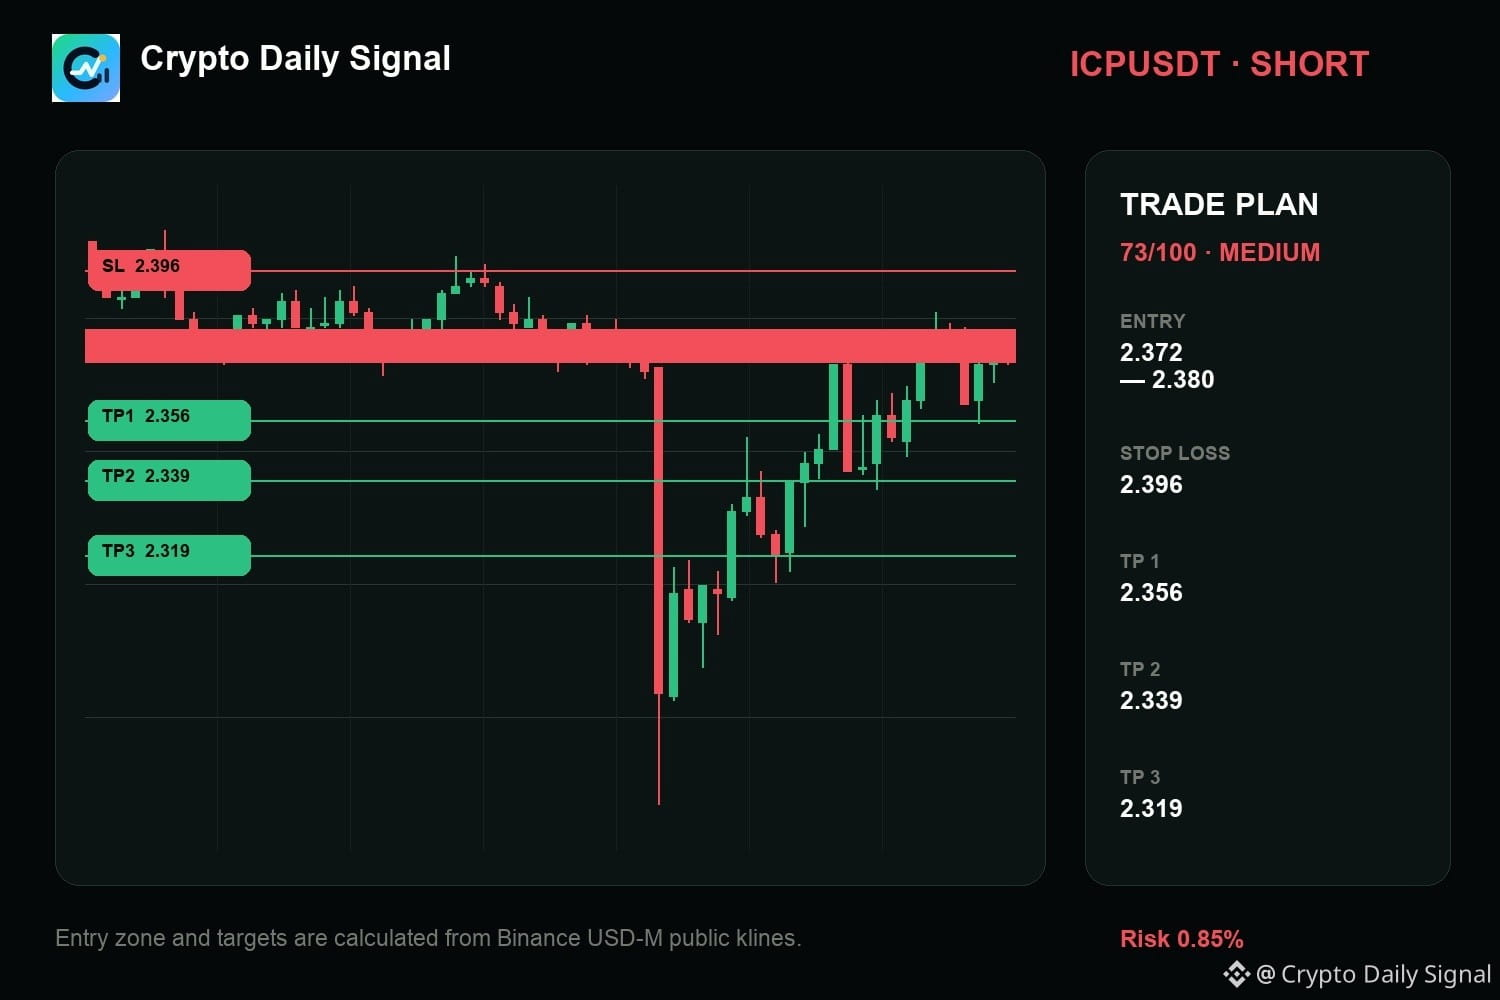
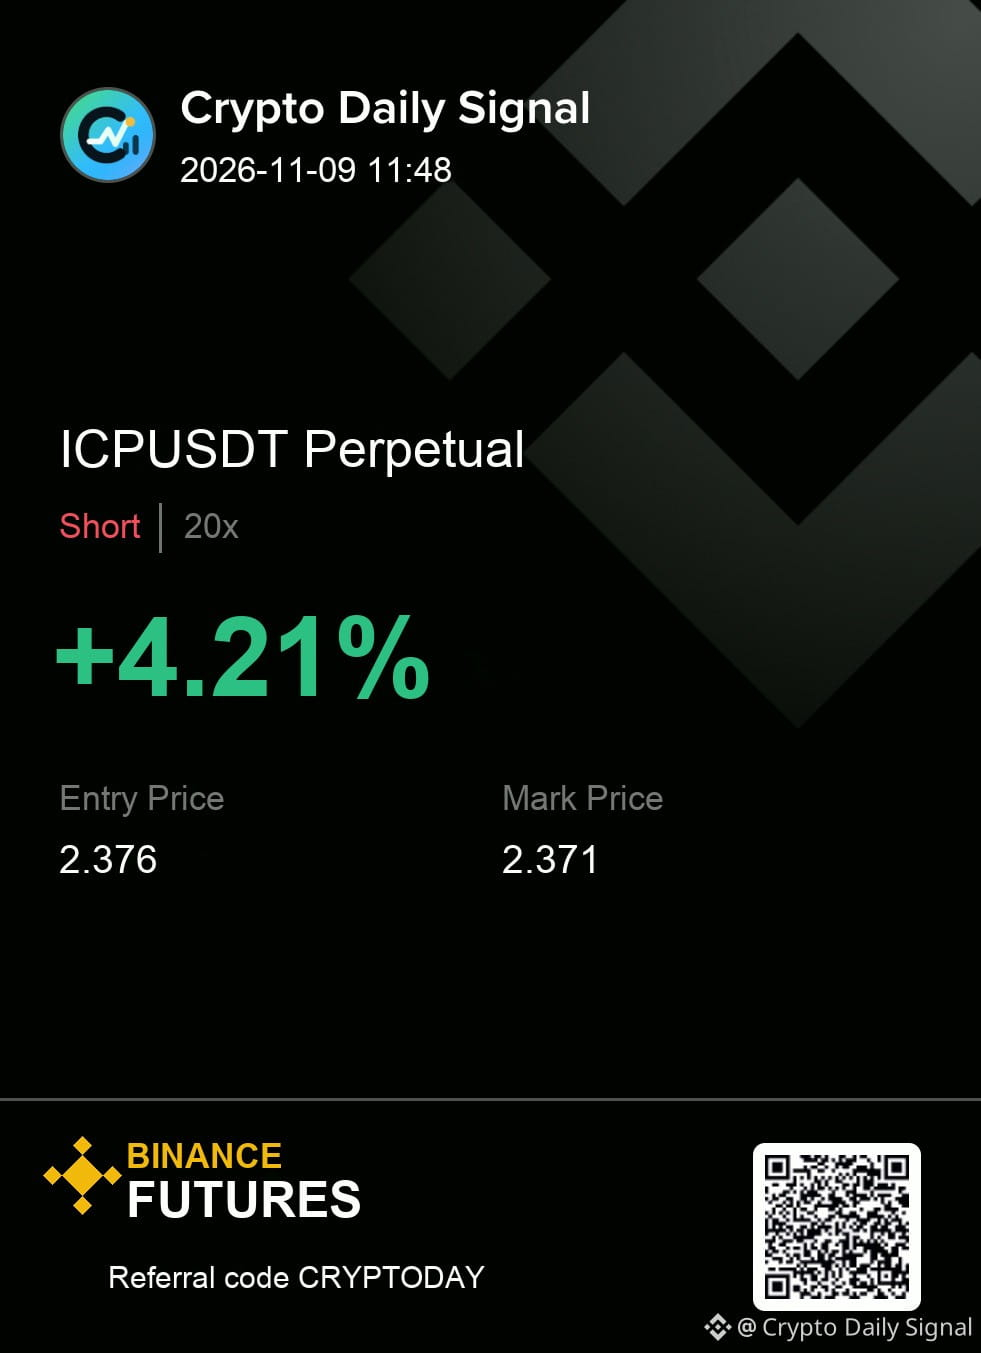
ICPUSDT SHORT
IN 2.372 - 2.380
OUT 2.396
TP 2.356 · 2.339 · 2.319
#TradeSetup
{future}(ICPUSDT)
$ICP — ngl, the cleanest read is that it still gives sellers the cleaner argument as the current price stays near the bottom of its recent range. Bearish signals are showing up on the daily and four-hour charts, even though the short-term movement lacks real force. For this downside to play out, we need a clear break below that range floor.
The levels matter more than the prediction. Size it accordingly.
ICPUSDT SHORT
IN 2.372 - 2.380
OUT 2.396
TP 2.356 · 2.339 · 2.319
#TradeSetup
The levels matter more than the prediction. Size it accordingly.
ICPUSDT SHORT
IN 2.372 - 2.380
OUT 2.396
TP 2.356 · 2.339 · 2.319
#TradeSetup
18
Log in to explore more content
Join global crypto users on Binance Square
⚡️ Get latest and useful information about crypto.
💬 Trusted by the world’s largest crypto exchange.
👍 Discover real insights from verified creators.
Email / Phone number
Trending Topics
1
#NvidiaInvestigatesAfterHuang’sAffairApology
54,669 views
639 Discussing
2
#BitcoinFiveWeeklyLosses
68,920 views
1,080 Discussing
3
#AIChipSlumpNasdaq
38,072 views
646 Discussing
4
#CPITestsDecemberRateOutlook
507,139 views
2,108 Discussing
5
#AnthropicRejectsIPODelayValuationinQuestion
2,407 views
65 Discussing
6
#StrategyBitcoinHoldingsMoveIntoUnrealizedLoss
3,354 views
66 Discussing
7
#TrumpConfirmsCoOwnershipOfWorldLibertyFinancial
69 views
6 Discussing
8
#EthereumSpotETFsPost$365MWeeklyOutflow
4,462 views
50 Discussing
9
#TradFiForBeginners
285,298 views
2,512 Discussing
10
#KeplrAdvisesSocialLoginUsersToTransferAssets
100,951 views
737 Discussing