
#theanalystsnotebook
theanalystsnotebook
560 views
4 Discussing
Hot
Latest

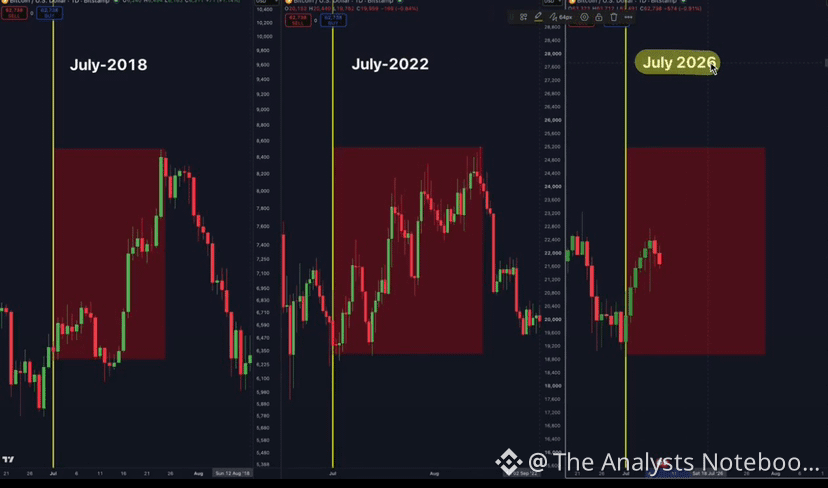
📓 THE JULY RELIEF RALLY PATTERN — 2018, 2022, AND NOW
Every bear market has a bounce that feels like the bottom. Historically, July delivers it.
The pattern:
🔸 July 2018 — $BTC bounced $5.8K → $8.4K. Real bottom: $3.2K in December.
🔸 July 2022 — BTC bounced $19K → $24K. Real bottom: $15.5K in November.
🔸 July 2026 — BTC bounced $58K → $64K. Currently +6.3% on the week.
Why this looks like those:
• Driven by short covering ($450M+ shorts liquidated), not fresh demand
• Above the 20D EMA, rejected below the 50D ($65.8K), far below the 200D ($76K)
• Fear & Greed at 23 — Extreme Fear despite the recovery
Why it might not be:
• No internal blow-up — no FTX, no Terra. This drawdown is macro (Warsh Fed killing rate-cut hopes), and macro can reverse without anything breaking
• ETF flows just flipped positive (+$46.6M)
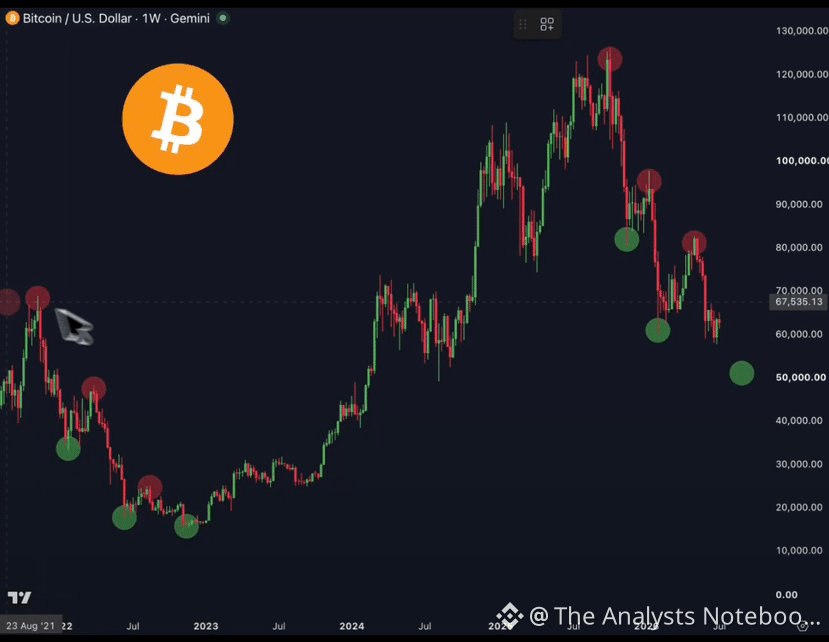
The decider: $65.7K–$65.8K. A clean daily close above = genuine recovery. Rejection = lower high, and the 2018/2022 script stays live. Below, $60K must hold.
History doesn’t repeat. When it rhymes this loudly, manage risk like it might.
Not financial advice. DYOR.
#Bitcoin #$BTC #TheAnalystsNotebook
Every bear market has a bounce that feels like the bottom. Historically, July delivers it.
The pattern:
🔸 July 2018 — $BTC bounced $5.8K → $8.4K. Real bottom: $3.2K in December.
🔸 July 2022 — BTC bounced $19K → $24K. Real bottom: $15.5K in November.
🔸 July 2026 — BTC bounced $58K → $64K. Currently +6.3% on the week.
Why this looks like those:
• Driven by short covering ($450M+ shorts liquidated), not fresh demand
• Above the 20D EMA, rejected below the 50D ($65.8K), far below the 200D ($76K)
• Fear & Greed at 23 — Extreme Fear despite the recovery
Why it might not be:
• No internal blow-up — no FTX, no Terra. This drawdown is macro (Warsh Fed killing rate-cut hopes), and macro can reverse without anything breaking
• ETF flows just flipped positive (+$46.6M)
The decider: $65.7K–$65.8K. A clean daily close above = genuine recovery. Rejection = lower high, and the 2018/2022 script stays live. Below, $60K must hold.
History doesn’t repeat. When it rhymes this loudly, manage risk like it might.
Not financial advice. DYOR.
#Bitcoin #$BTC #TheAnalystsNotebook
📓 “THE WORST IS OVER” — THE MOST EXPENSIVE SENTENCE IN CRYPTO
Mid-2022. $BTC reclaims $20K after the June flush to $17.6K. Rallies to $24K. Timeline declares the bottom is in.
Then November: FTX. BTC prints $15.5K — another -22% below the level everyone thought was safe.
The lesson wasn’t the price. It was the psychology. Relief rallies exist precisely because the majority wants the pain to be over. That demand for hope IS the exit liquidity.
July 2026 rhymes:
• BTC reclaimed $64K from the $58K lows — +6% on the week
• The bounce is short-covering ($450M+ shorts liquidated), not spot demand
• Fear & Greed at 23 — fear persists, but “bottom is in” calls are multiplying
The honest difference: 2022’s final flush needed a catalyst (FTX). Nothing has broken internally this cycle — the damage is macro (Fed). No catalyst, no guaranteed capitulation. But no confirmation either.
What confirms recovery: a daily close above $65.8K + sustained ETF inflows.
What keeps the 2022 script alive: rejection there, and a weekly close back under $60K.
Trade the levels, not the relief.
DYOR.
PC- Crypto Rover
#Bitcoin #$BTC C #TheAnalystsNotebook
Mid-2022. $BTC reclaims $20K after the June flush to $17.6K. Rallies to $24K. Timeline declares the bottom is in.
Then November: FTX. BTC prints $15.5K — another -22% below the level everyone thought was safe.
The lesson wasn’t the price. It was the psychology. Relief rallies exist precisely because the majority wants the pain to be over. That demand for hope IS the exit liquidity.
July 2026 rhymes:
• BTC reclaimed $64K from the $58K lows — +6% on the week
• The bounce is short-covering ($450M+ shorts liquidated), not spot demand
• Fear & Greed at 23 — fear persists, but “bottom is in” calls are multiplying
The honest difference: 2022’s final flush needed a catalyst (FTX). Nothing has broken internally this cycle — the damage is macro (Fed). No catalyst, no guaranteed capitulation. But no confirmation either.
What confirms recovery: a daily close above $65.8K + sustained ETF inflows.
What keeps the 2022 script alive: rejection there, and a weekly close back under $60K.
Trade the levels, not the relief.
DYOR.
PC- Crypto Rover
#Bitcoin #$BTC C #TheAnalystsNotebook
📓 ETF FLOWS FLIP GREEN — SIGNAL OR PAUSE?
Monday’s numbers are real:
🔸 $BTC spot ETFs: +$265.7M — largest daily inflow in over a month
🔸 $ETH spot ETFs: +$20.7M, led by BlackRock’s ETHA (+$23.3M)
🔸 IBIT absorbed $209M of the BTC total. Only GBTC bled (-$44M)
🔸 BTC ETF assets recovered to $77.3B from the June 30 low of $71B
🔸 Combined BTC + ETH ETF AUM: ~$87B
Before posting “we’re back” — the context:
• Last week was still net negative: -$526.6M for BTC, the eighth consecutive red week
• June was the worst ETF month since launch (-$4.1B out)
• This is the second green session in three — not a confirmed streak
• The trigger was macro, not crypto: weak June payrolls (57K jobs) cooled Fed hike odds, and institutions stepped back in
Why it matters anyway: ETF flows now explain roughly 45% of weekly BTC price movement. The 10-day outflow streak was programmatic selling — custodians dumping spot to meet redemptions. Stopping that bleeding is step one of every bottom.
Confirmation checklist: consecutive green sessions, IBIT staying positive, BTC holding $63K into the July 14 CPI print.
One green Monday isn’t a trend. It’s a tell.
Not financial advice. DYOR.
#Bitcoin #ETH #ETF #TheAnalystsNotebook
Monday’s numbers are real:
🔸 $BTC spot ETFs: +$265.7M — largest daily inflow in over a month
🔸 $ETH spot ETFs: +$20.7M, led by BlackRock’s ETHA (+$23.3M)
🔸 IBIT absorbed $209M of the BTC total. Only GBTC bled (-$44M)
🔸 BTC ETF assets recovered to $77.3B from the June 30 low of $71B
🔸 Combined BTC + ETH ETF AUM: ~$87B
Before posting “we’re back” — the context:
• Last week was still net negative: -$526.6M for BTC, the eighth consecutive red week
• June was the worst ETF month since launch (-$4.1B out)
• This is the second green session in three — not a confirmed streak
• The trigger was macro, not crypto: weak June payrolls (57K jobs) cooled Fed hike odds, and institutions stepped back in
Why it matters anyway: ETF flows now explain roughly 45% of weekly BTC price movement. The 10-day outflow streak was programmatic selling — custodians dumping spot to meet redemptions. Stopping that bleeding is step one of every bottom.
Confirmation checklist: consecutive green sessions, IBIT staying positive, BTC holding $63K into the July 14 CPI print.
One green Monday isn’t a trend. It’s a tell.
Not financial advice. DYOR.
#Bitcoin #ETH #ETF #TheAnalystsNotebook
Log in to explore more content