

#shortingalert
shortingalert
53,003 views
38 Discussing
Hot
Latest

Article
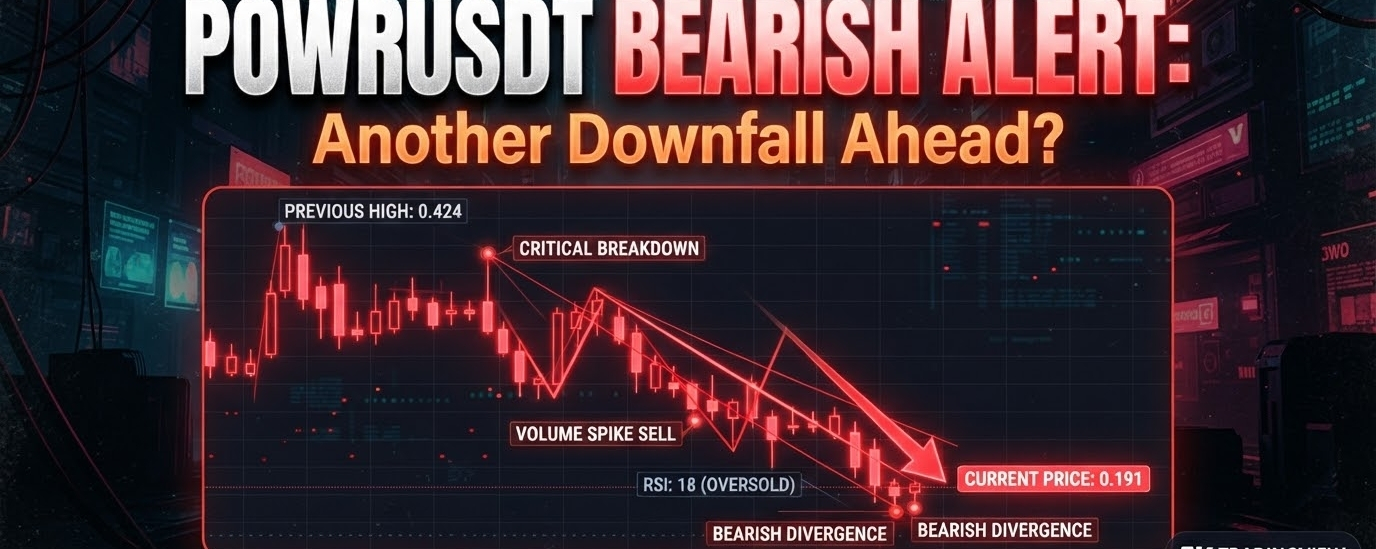
POWRUSDT BEARISH ALERT: Is Another Downfall Waiting Ahead? The Charts Reveal a Risky Setup!Powerledger ($POWR ) is showing a market structure that deserves serious attention, as recent price movements, trading volume and momentum indicators suggest that the recovery could face significant selling pressure.
📉 Updated K-Line Analysis
The latest available K-line data shows considerable volatility, with POWR trading around the $0.058 to $0.070 region across different market data snapshots on November 1, 2026. Recent daily candles have demonstrated sharp price movements, but the inability to establish a convincing breakout above nearby resistance raises concerns about another bearish move.
{spot}(POWRUSDT)
The $0.060 to $0.070 region deserves close attention, as selling pressure around this area could trigger another downward correction. A sustained loss of the $0.055 support zone could expose lower levels around $0.052 and potentially $0.049.
🔻 Fair Value Gap (FVG): A Warning Sign?
The potential supply region around $0.058 to $0.061 deserves attention when examining lower timeframe price action. If price revisits this area and faces rejection, sellers could regain control and push POWR towards lower support levels.
However, a confirmed bearish FVG requires checking the actual three candle structure on the selected timeframe, so this zone should be treated as a potential resistance area rather than a verified imbalance.
📊 StochRSI and Volume Analysis
The latest available StochRSI reading on the technical snapshot was 0.00, indicating an oversold condition. Although this reflects considerable downside momentum, it also warns traders that a temporary relief bounce could develop before another move lower.
Trading activity has also increased significantly, with reported 24 hour spot volume reaching approximately $7.4 million in one market snapshot. Higher volume during volatile price movements makes the next support and resistance reaction particularly important.
💰 Market Capitalization and Historical Peak
Powerledger's market capitalization was reported around $33 million to $39 million across different market data providers, reflecting differences in their live price snapshots. Its circulating supply stands at approximately 573 million POWR.
One historical figure makes the current valuation particularly striking: POWR previously reached an all time high of approximately $1.89 to $2.01 in January 2018, depending on the data provider. At current reported prices, the token remains more than 96% below that historic peak.
⚠️ Final Outlook: Could POWR Face Another Downfall?
The #bearish scenario becomes more convincing if POWR fails to reclaim the $0.060 to $0.061 region and subsequently loses support around $0.055. A breakdown could open the door towards $0.052 and $0.049, potentially creating another difficult phase for buyers.
#ShortingAlert #MarketSentimentToday #signal #Write2Earn
POWRUSDT BEARISH ALERT: Is Another Downfall Waiting Ahead? The Charts Reveal a Risky Setup!
Powerledger ($POWR ) is showing a market structure that deserves serious attention, as recent price movements, trading volume and momentum indicators suggest that the recovery could face significant selling pressure.
📉 Updated K-Line Analysis
The latest available K-line data shows considerable volatility, with POWR trading around the $0.058 to $0.070 region across different market data snapshots on November 1, 2026. Recent daily candles have demonstrated sharp price movements, but the inability to establish a convincing breakout above nearby resistance raises concerns about another bearish move.
The $0.060 to $0.070 region deserves close attention, as selling pressure around this area could trigger another downward correction. A sustained loss of the $0.055 support zone could expose lower levels around $0.052 and potentially $0.049.
🔻 Fair Value Gap (FVG): A Warning Sign?
The potential supply region around $0.058 to $0.061 deserves attention when examining lower timeframe price action. If price revisits this area and faces rejection, sellers could regain control and push POWR towards lower support levels.
However, a confirmed bearish FVG requires checking the actual three candle structure on the selected timeframe, so this zone should be treated as a potential resistance area rather than a verified imbalance.
📊 StochRSI and Volume Analysis
The latest available StochRSI reading on the technical snapshot was 0.00, indicating an oversold condition. Although this reflects considerable downside momentum, it also warns traders that a temporary relief bounce could develop before another move lower.
Trading activity has also increased significantly, with reported 24 hour spot volume reaching approximately $7.4 million in one market snapshot. Higher volume during volatile price movements makes the next support and resistance reaction particularly important.
💰 Market Capitalization and Historical Peak
Powerledger's market capitalization was reported around $33 million to $39 million across different market data providers, reflecting differences in their live price snapshots. Its circulating supply stands at approximately 573 million POWR.
One historical figure makes the current valuation particularly striking: POWR previously reached an all time high of approximately $1.89 to $2.01 in January 2018, depending on the data provider. At current reported prices, the token remains more than 96% below that historic peak.
⚠️ Final Outlook: Could POWR Face Another Downfall?
The #bearish scenario becomes more convincing if POWR fails to reclaim the $0.060 to $0.061 region and subsequently loses support around $0.055. A breakdown could open the door towards $0.052 and $0.049, potentially creating another difficult phase for buyers.
#ShortingAlert #MarketSentimentToday #signal #Write2Earn
162

·
--
Bearish
Sorry to anyone longing $BSB
{alpha}(560x595deaad1eb5476ff1e649fdb7efc36f1e4679cc)
, but it's heading to zero. I've been in crypto for 6+ years and seen this pattern before.
I successfully shorted it up to $2.74 and closed in profit. If it pumps back to $1, I’ll short it again, but I’m not chasing it down. It likely goes lower from here.
#cryptotrading #ShortingAlert #bearish #CryptoMarket #altcoins
Sorry to anyone longing $BSB
, but it's heading to zero. I've been in crypto for 6+ years and seen this pattern before.
I successfully shorted it up to $2.74 and closed in profit. If it pumps back to $1, I’ll short it again, but I’m not chasing it down. It likely goes lower from here.
#cryptotrading #ShortingAlert #bearish #CryptoMarket #altcoins
1
390

·
--
Bullish
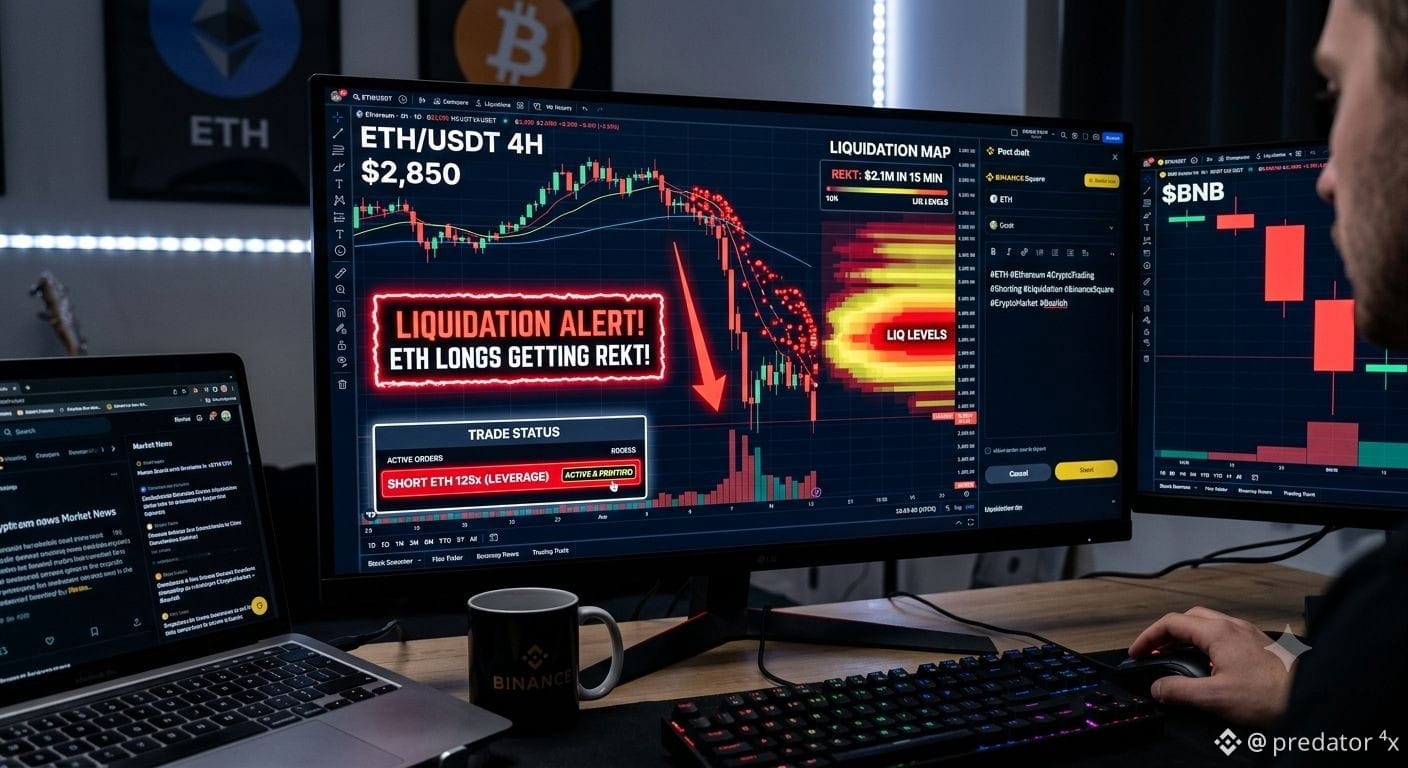
$ETH Good news is just a trap for the FOMO crowd. Look at these sitting ducks loading up on longs just to get rekt.
The confluence of factors is clear:
Network congestion & gas fee volatility.
Whale distribution at key resistance levels.
Macro uncertainty pushing capital out of risk assets.
All of these signs point to a major move DOWN. These late longs are going to be absolute liquidity for the market makers. I’ve already opened a 125x Short position—don't be the exit liquidity for them. Hope you all are shorting this move with us.
Easy money. $BNB short is also active and printing.
#ETH🔥🔥🔥🔥🔥🔥 #Ethereum #CryptoTrading #ShortingAlert
63

·
--
Bearish
💣 SPCXUSDT: An Explosion of PROFIT or RISK? Short Setup Inside! 📉
💥 Analysis 💥
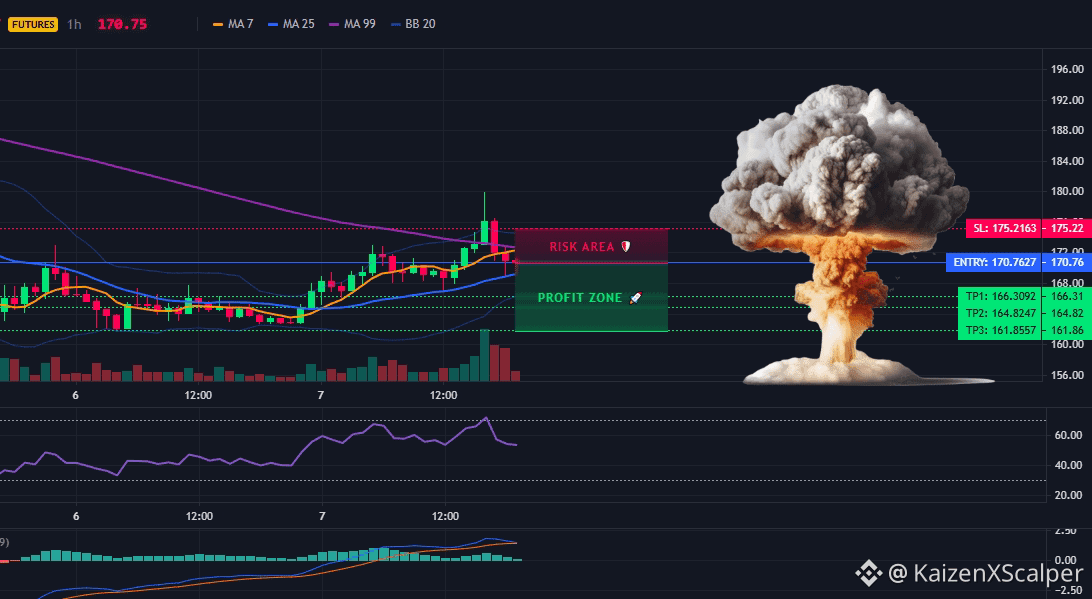
This 1h chart visualizes an imminent explosion! The visual cues and data point towards a potential massive shorting opportunity, with a high degree of confidence visually suggested.
📊 Setup Locked In:
Entry: 170.76 (Short)
Stop Loss (SL): 175.21 (A firm cap on risk in this explosive zone)
Take Profit Targets: 166.30 / 164.82 / 161.85 (Tiered targets for the downward blast)
🛡️ Risk First: Trade smart and defensively. Always use low leverage, strict risk management, or buy on Spot. Survival is key to longevity! Don't let the explosive graphic deceive you—risk is real.
Rules for Longevity:
🔑 Crucial Rule: Hit TP1? Immediately book 50% profit and move your Stop Loss to the Entry Price. This is non-negotiable for locking in gains and ensuring a risk-free ride for the rest. 🚀
💡 Expectations: Remember, trading is about probability. Out of 10 signals, a set may have 2-3 stop losses. This is perfectly normal and a part of the game. Stay consistent, keep leverage low, and book profits quickly. 💰
📢 Don't Miss Out! My signals are about high-potential precision. Hit that follow button! for consistent setups. 🔔
👉 Click here to trade $SPCX
{future}(SPCXUSDT)
#SPCX #CryptoSignals #BinanceSquare #ShortingAlert #TradingSetup
💣 SPCXUSDT: An Explosion of PROFIT or RISK? Short Setup Inside! 📉
💥 Analysis 💥
This 1h chart visualizes an imminent explosion! The visual cues and data point towards a potential massive shorting opportunity, with a high degree of confidence visually suggested.
📊 Setup Locked In:
Entry: 170.76 (Short)
Stop Loss (SL): 175.21 (A firm cap on risk in this explosive zone)
Take Profit Targets: 166.30 / 164.82 / 161.85 (Tiered targets for the downward blast)
🛡️ Risk First: Trade smart and defensively. Always use low leverage, strict risk management, or buy on Spot. Survival is key to longevity! Don't let the explosive graphic deceive you—risk is real.
Rules for Longevity:
🔑 Crucial Rule: Hit TP1? Immediately book 50% profit and move your Stop Loss to the Entry Price. This is non-negotiable for locking in gains and ensuring a risk-free ride for the rest. 🚀
💡 Expectations: Remember, trading is about probability. Out of 10 signals, a set may have 2-3 stop losses. This is perfectly normal and a part of the game. Stay consistent, keep leverage low, and book profits quickly. 💰
📢 Don't Miss Out! My signals are about high-potential precision. Hit that follow button! for consistent setups. 🔔
👉 Click here to trade $SPCX
#SPCX #CryptoSignals #BinanceSquare #ShortingAlert #TradingSetup
1
452

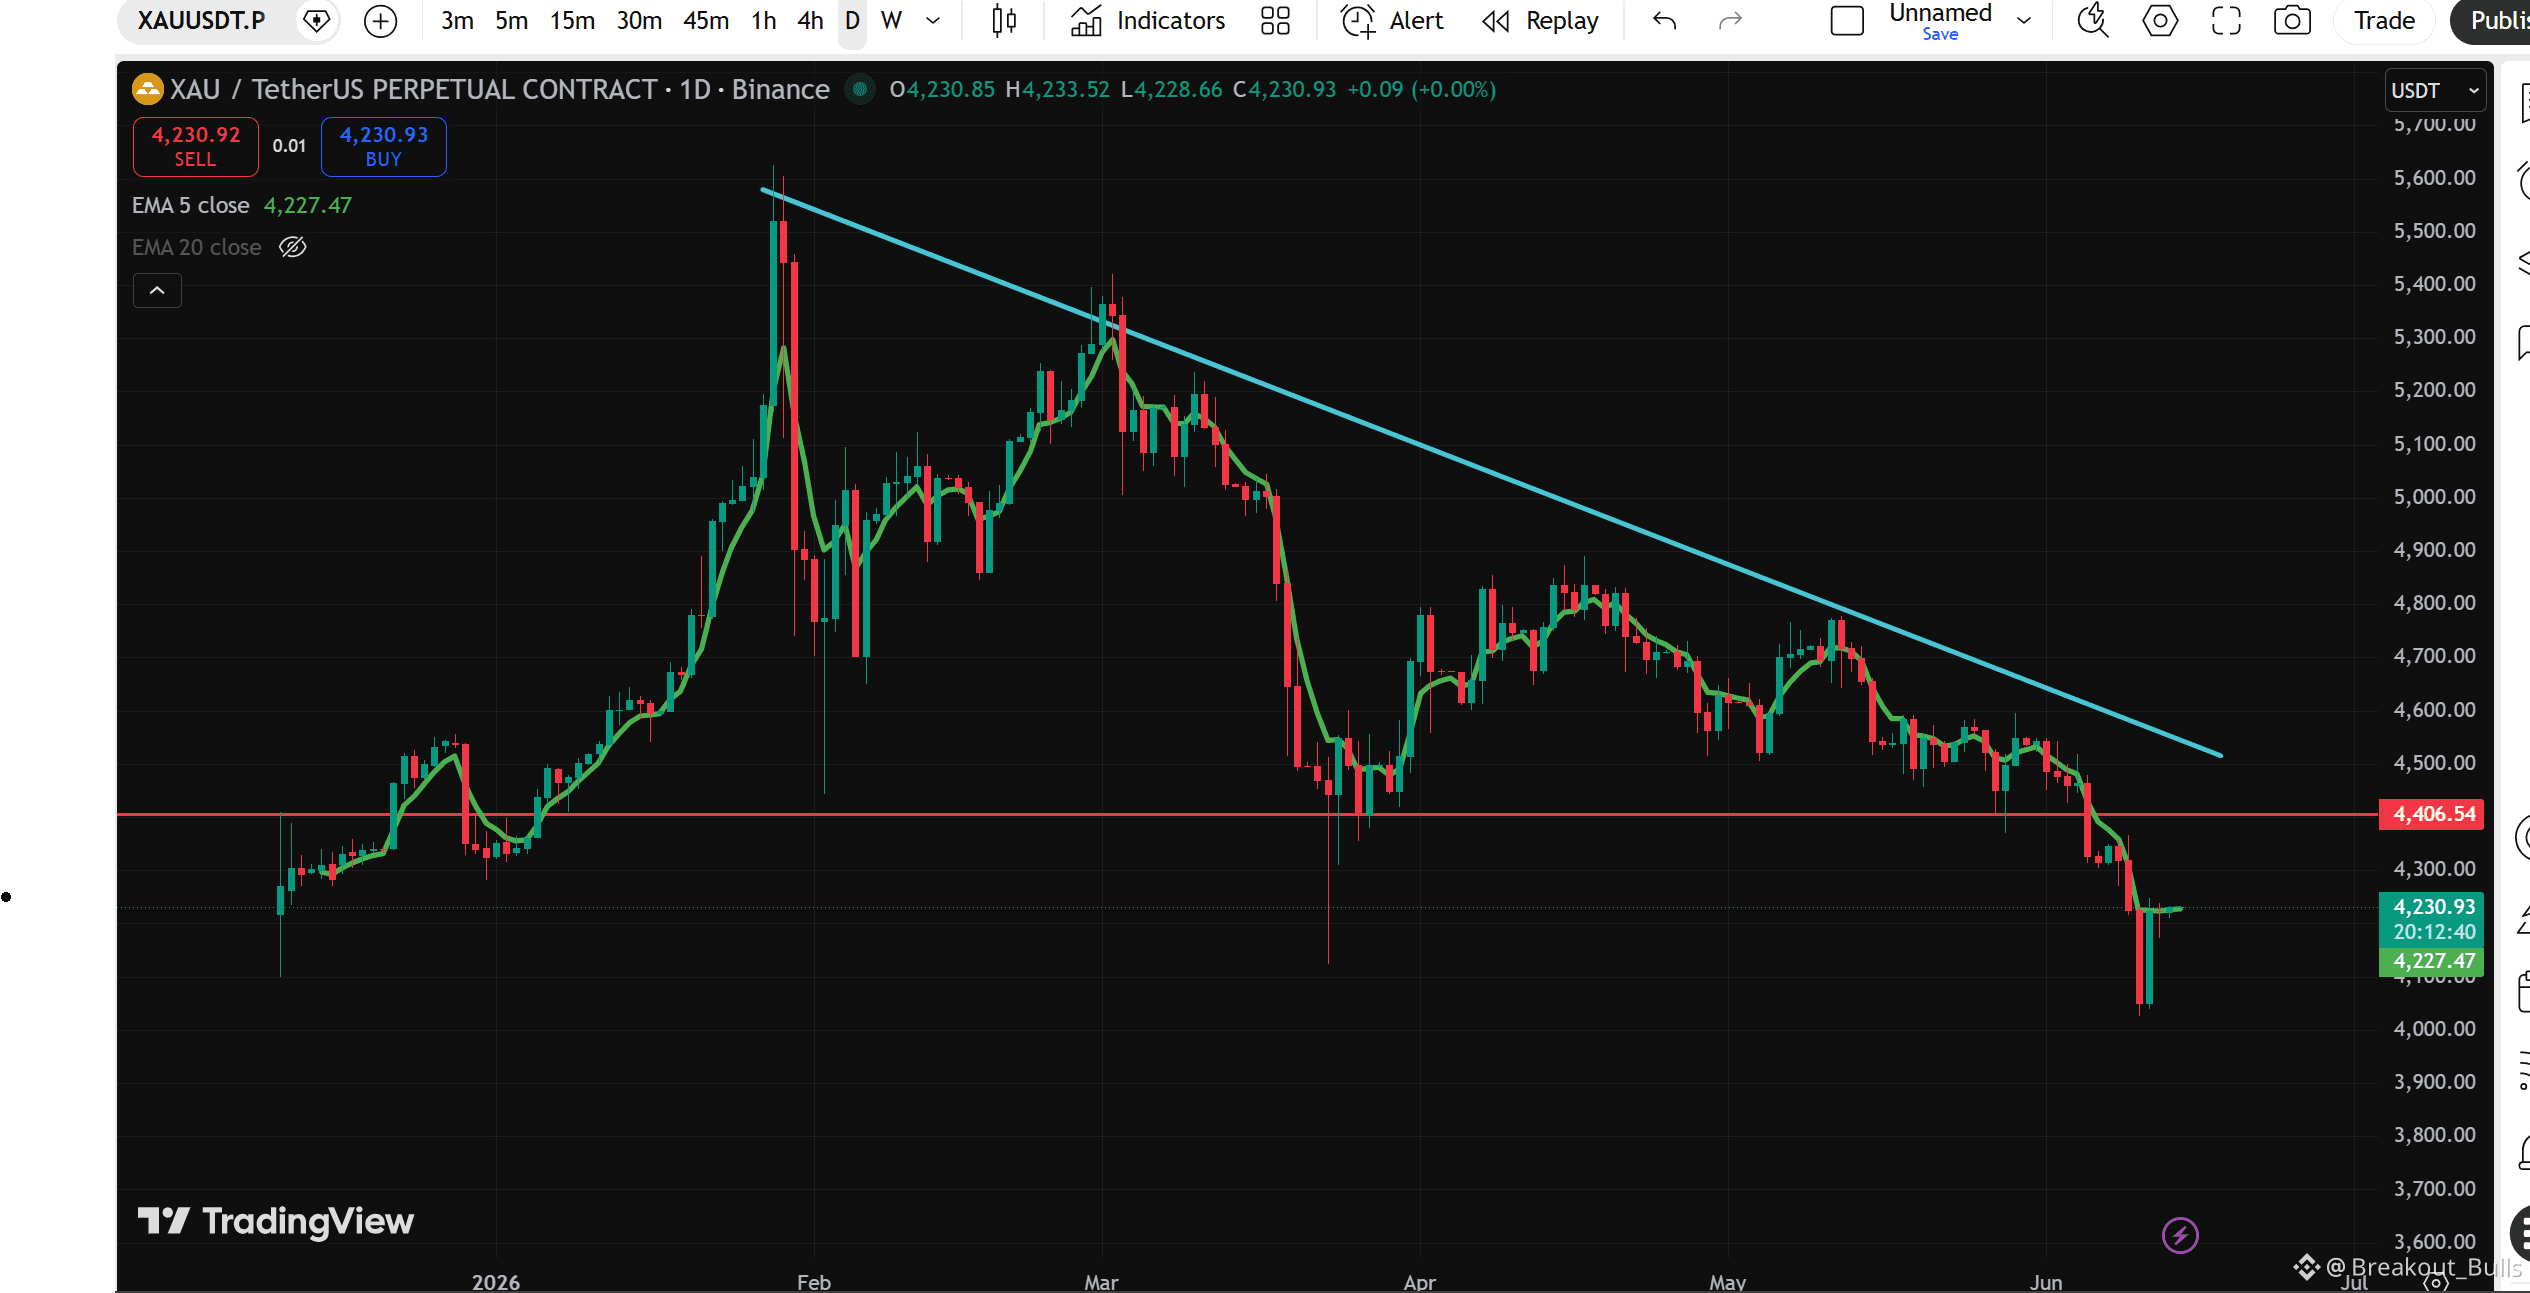
🪤 IS THIS $XAU BOUNCE JUST A DEAD CAT? 🐈📉
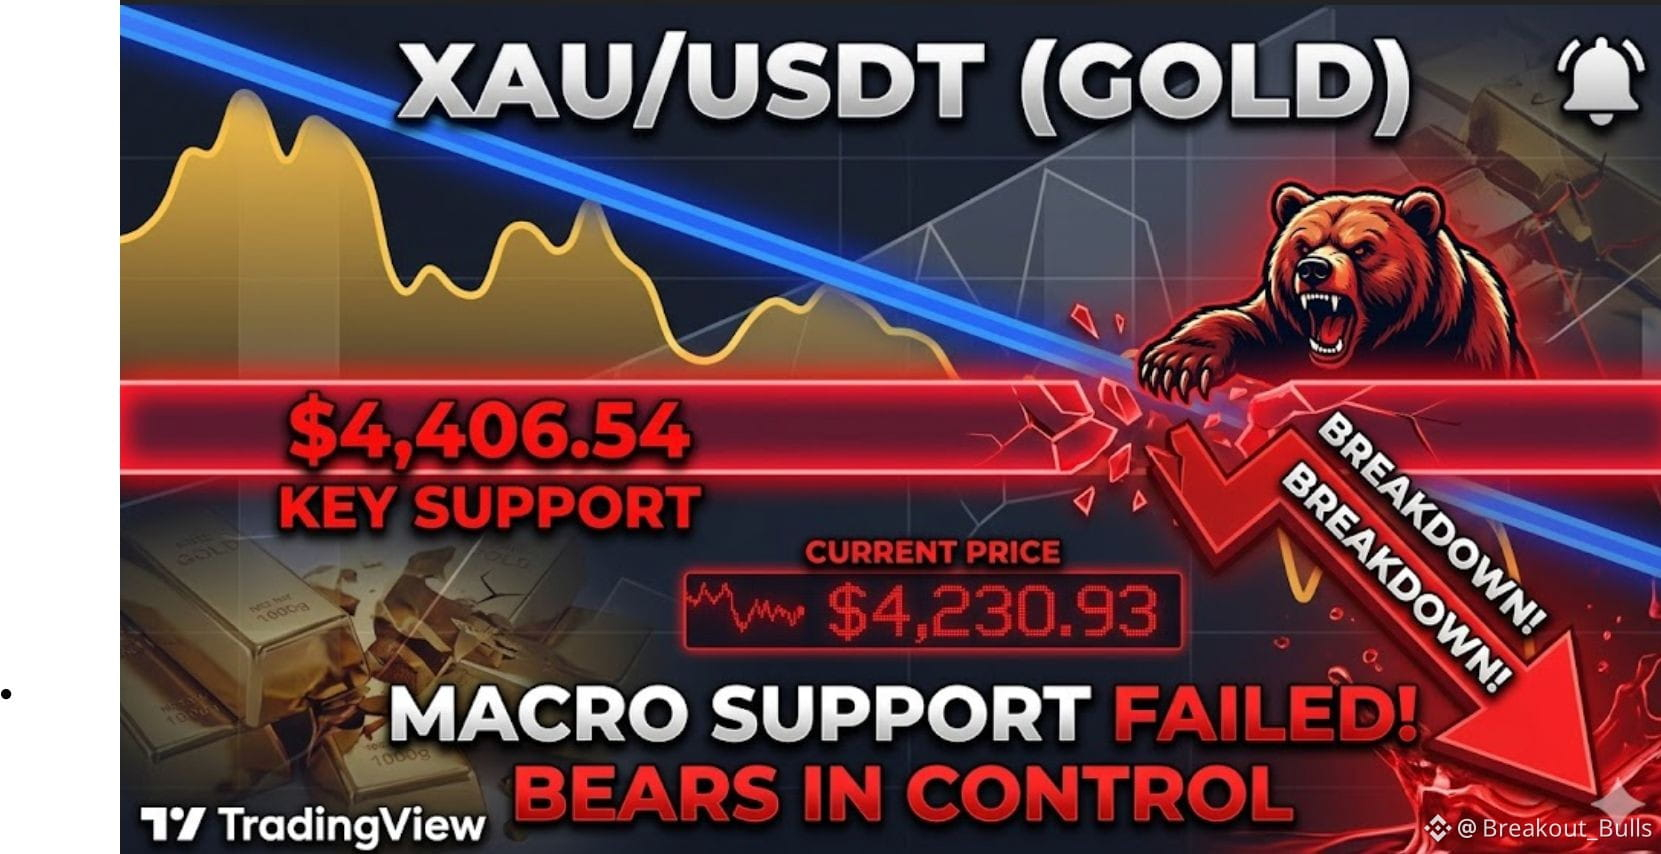
The $XAU daily chart is painting a textbook technical breakdown, and late longs might be walking straight into a trap! 🕸️💸
The Structure: The market trend is undeniable. Every single rally toward the blue descending trendline has been aggressively sold off by the bears. 🐋📉
The Flip: We officially lost the most important structural pivot on the chart at $4,406.54. What was once an ironclad safety net is now a heavy overhead wall. 🧱💥
The Setup: Currently trading at $4,230.93, we are seeing a minor relief bounce from the local bottom. However, any push back toward the $4,406 zone is now primed to act as a classic Support-Turned-Resistance retest. 🔄⚔️
Don't get chopped up trying to catch a falling knife in a confirmed downtrend! Where is your ultimate bottom target? 👇
$XAU
{future}(XAUUSDT)
{future}(XAGUSDT)
{spot}(BTCUSDT)
#XAU #GOLD #XAUUSD #TradingSetup #ShortingAlert
🪤 IS THIS $XAU BOUNCE JUST A DEAD CAT? 🐈📉
The $XAU daily chart is painting a textbook technical breakdown, and late longs might be walking straight into a trap! 🕸️💸
The Structure: The market trend is undeniable. Every single rally toward the blue descending trendline has been aggressively sold off by the bears. 🐋📉
The Flip: We officially lost the most important structural pivot on the chart at $4,406.54. What was once an ironclad safety net is now a heavy overhead wall. 🧱💥
The Setup: Currently trading at $4,230.93, we are seeing a minor relief bounce from the local bottom. However, any push back toward the $4,406 zone is now primed to act as a classic Support-Turned-Resistance retest. 🔄⚔️
Don't get chopped up trying to catch a falling knife in a confirmed downtrend! Where is your ultimate bottom target? 👇
$XAU
#XAU #GOLD #XAUUSD #TradingSetup #ShortingAlert
105

·
--
Bearish
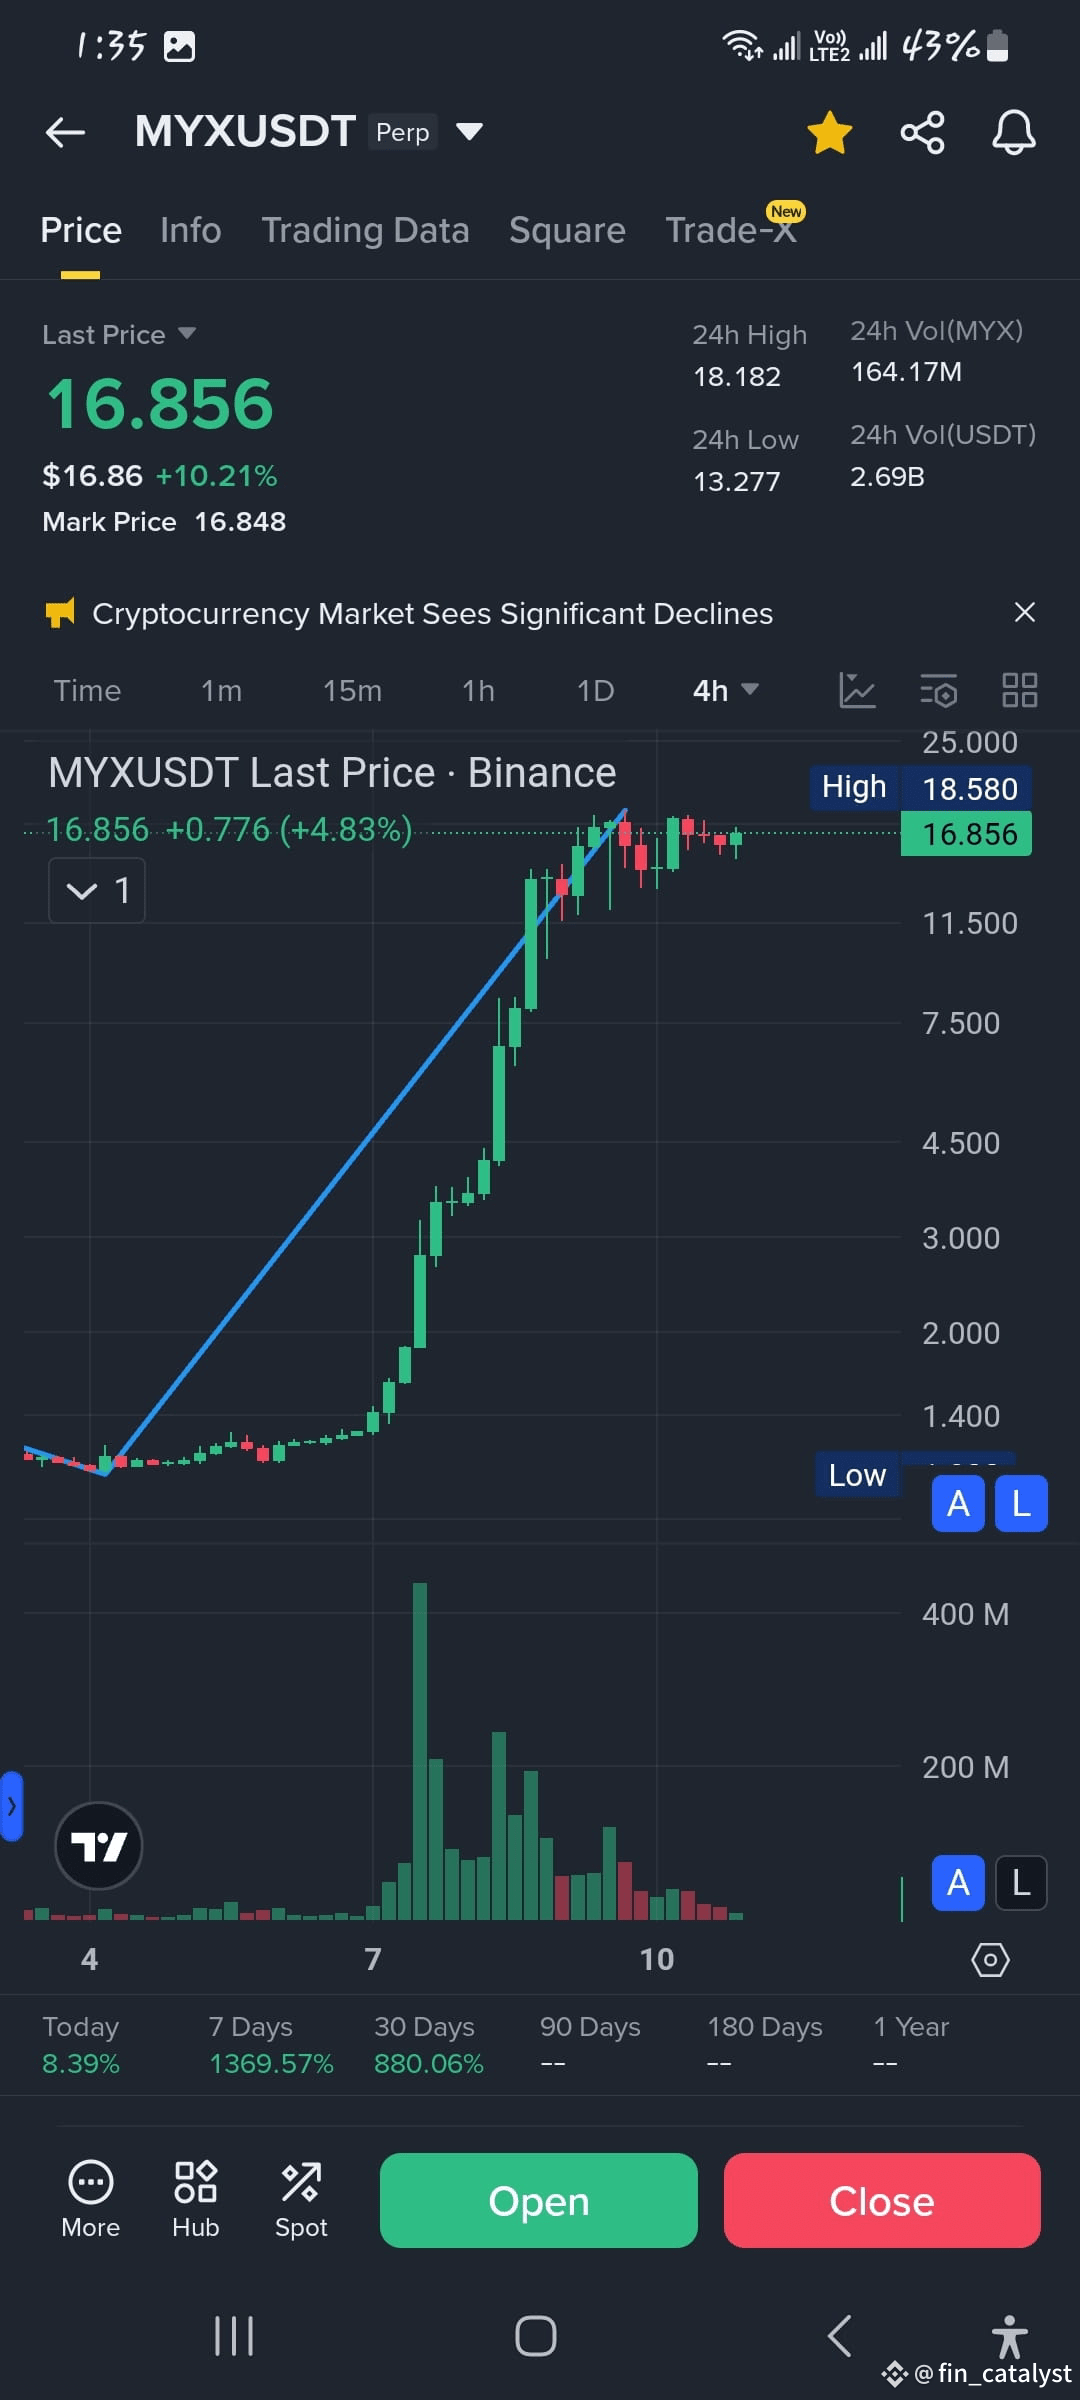
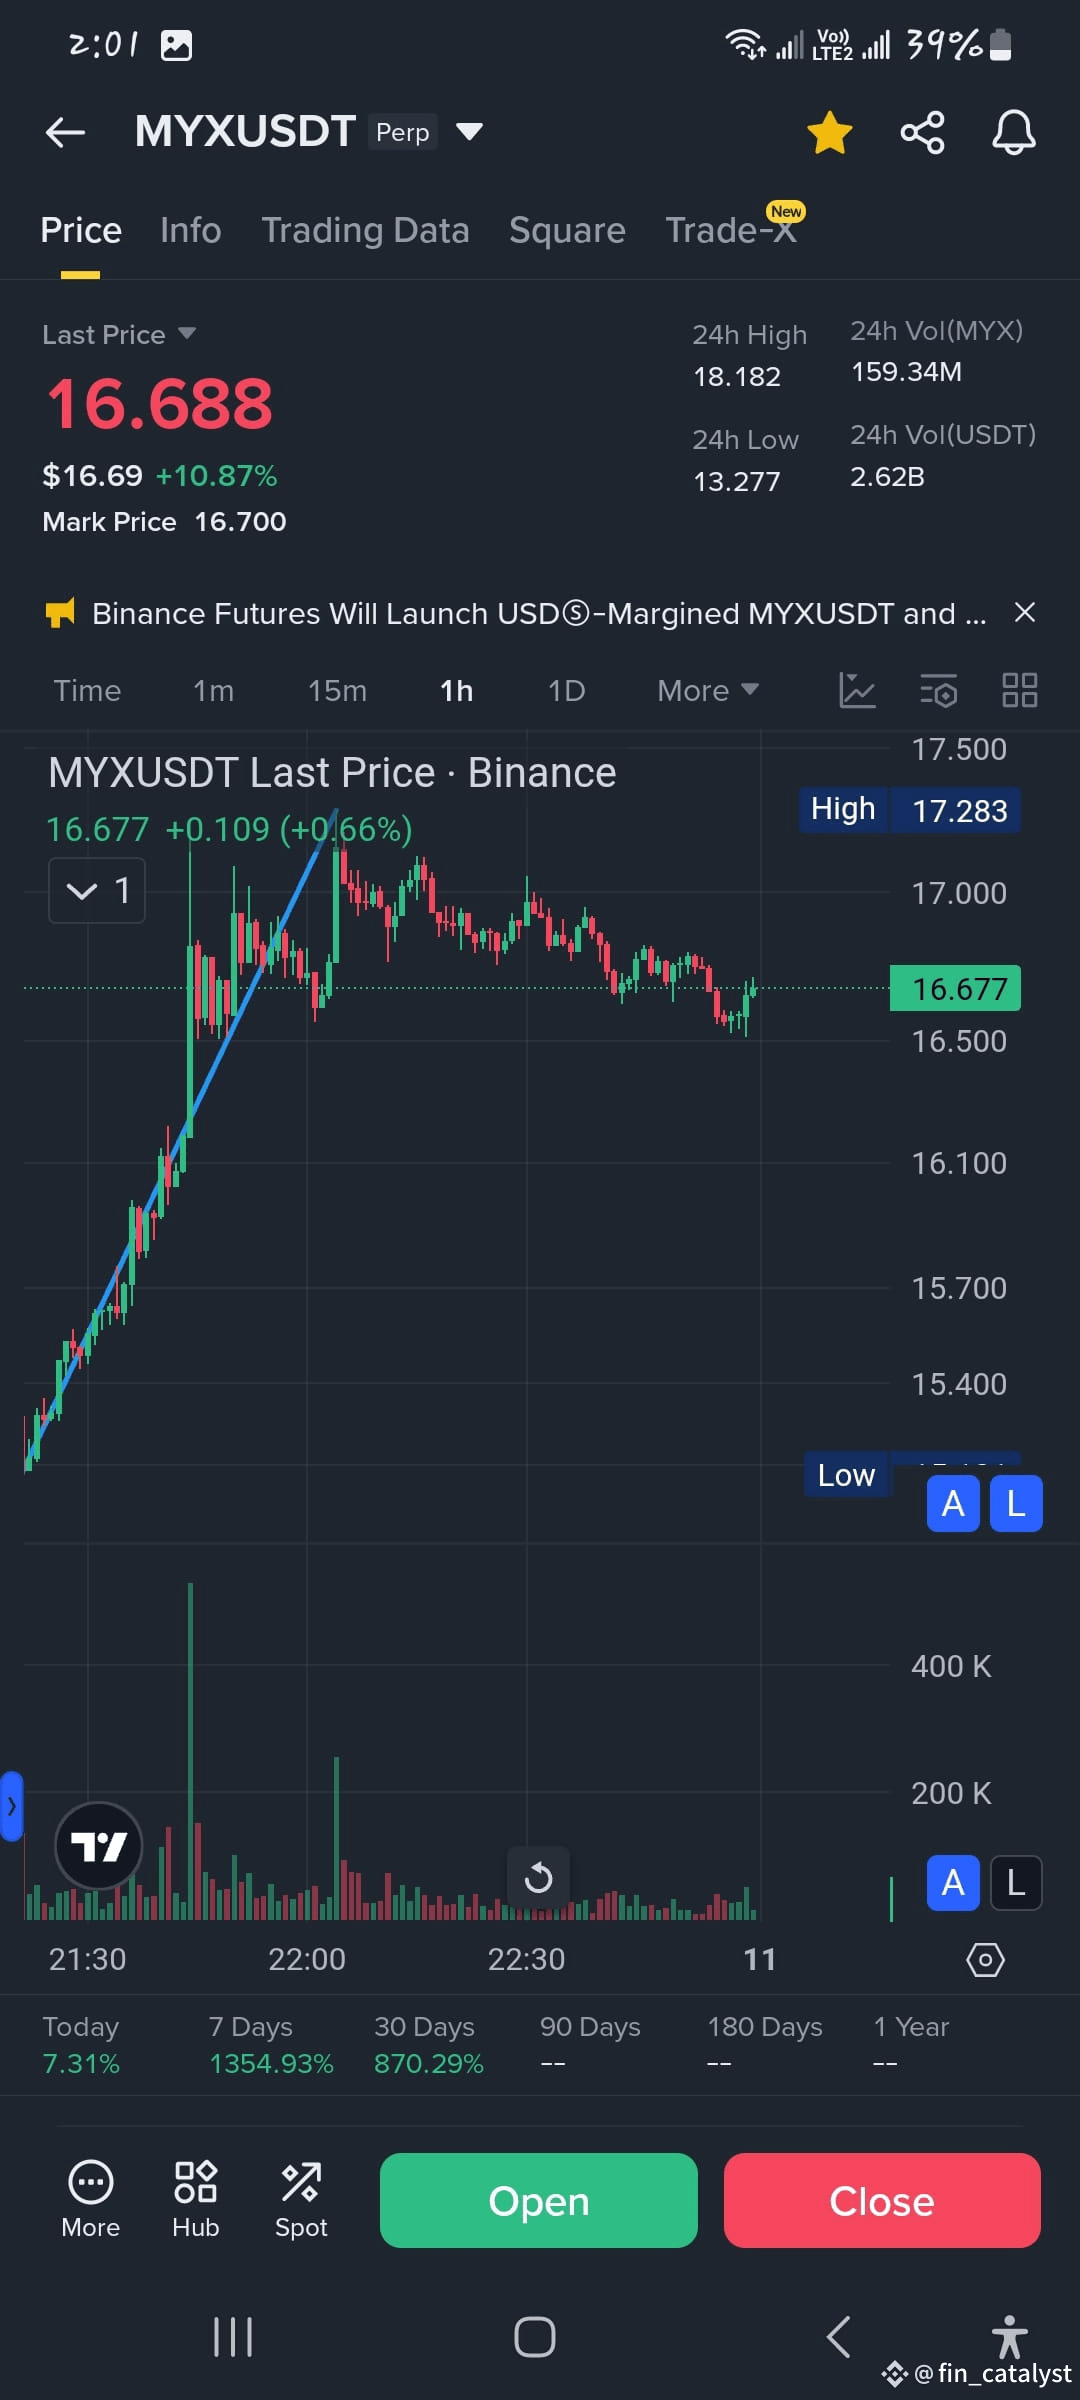
🤯 $MYX
The Bearish Breakdown Plan! 🤯
ENTRY: Short below $16.500 💥
SL: $17.300 🛡️
TP: $15.800 and $15.000 💰
The bullish party looks over. The chart is screaming Double Top, a classic reversal pattern! 📉 The bears are taking control of the wheel. 🐻
Ready to ride the downside? Here’s the plan:
Let's see if the bears have what it takes! 👇
#myxusd #Crypto #Trading #BEARISH📉 #DoubleTopPattern #ShortingAlert #BinanceSquareTalks
1
7
10.8k

·
--
Bearish
💥 TOTAL LIQUIDATION CARNAGE! THE FUTURES MARKET IS BLEEDING OUT! 🩸📉
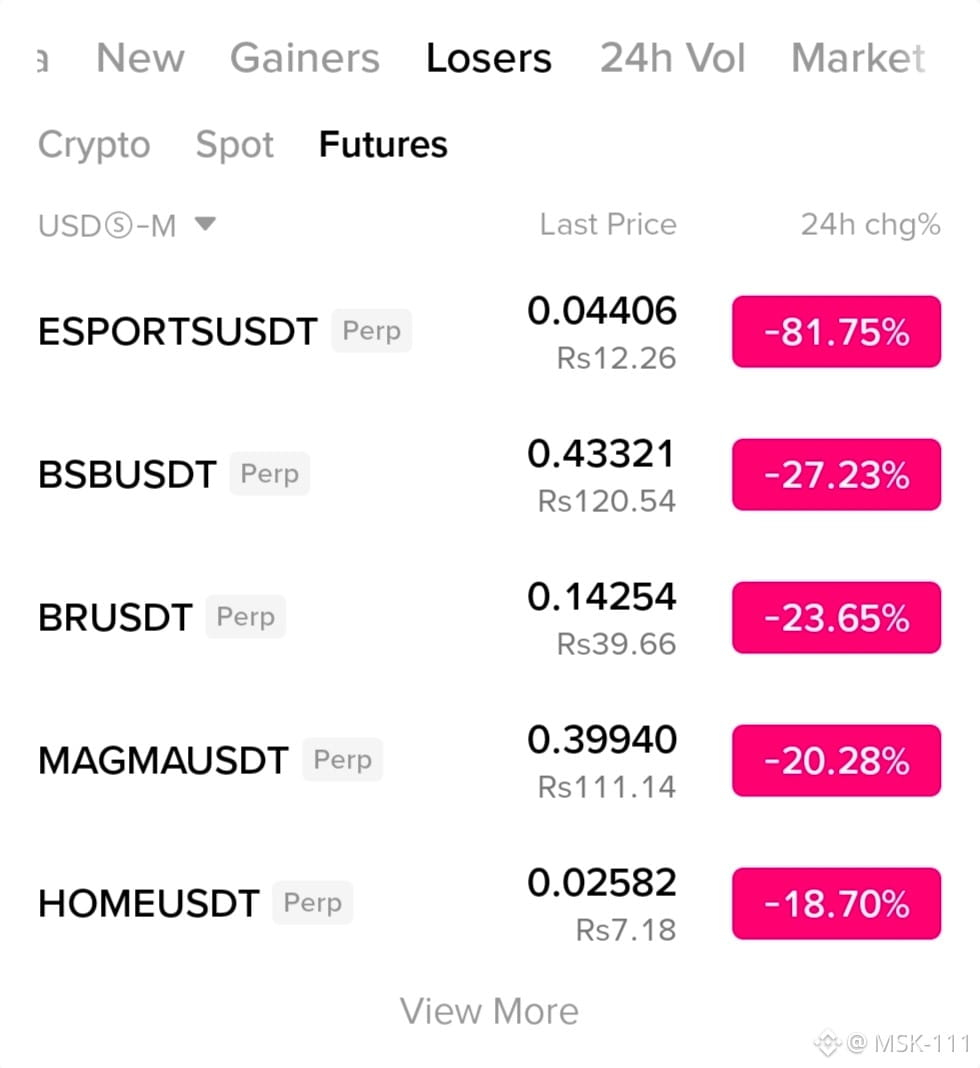
The longs are getting absolutely wiped off the map! Look at the brutal wreckage on the Binance Futures Top Losers list.! When leverage goes wrong, it goes wrong fast! 💀⚠️
🎮 $ESPORTS /USDT is facing an absolute, unprecedented apocalypse—nuking a massive -81.75% down to $0.04406! 🤯📉
🏦 BSB/USDT getting slammed hard, crashing -27.23%!
🥩 $BR /USDT taking a severe beating, dropping -23.65%!
🌋 $MAGMA /USDT melting away, down a heavy -20.28%!
🏠 HOME/USDT breaking down even further with a -18.70% hit!
This is absolute maximum pain for the bulls, but you already know what they say—one person's liquidation is another person's perfect short entry! 🤑💸
Are you brave enough to step in and buy this dip, or are you riding the short trend all the way down? 👇 Drop your positions and let’s see who survived this carnage! 📉🔥
#Crypto #BinanceSquare #FuturesLiquidation #CryptoCrash #ShortingAlert
1
483
Log in to explore more content
Join global crypto users on Binance Square
⚡️ Get latest and useful information about crypto.
💬 Trusted by the world’s largest crypto exchange.
👍 Discover real insights from verified creators.
Email / Phone number
Trending Topics
1
#WithdrawalsBack: 15 networks live
348 views
21 Discussing
2
#BinanceUpdatesProofofReservesAddresses
33,478 views
752 Discussing
3
#BinanceToResumePhaseOneOfWithdrawals
65,817 views
1,006 Discussing
4
#BinanceHadAlreadyCovered$6BofHackLoss
5,183 views
97 Discussing
5
#FBIConfirmsNorthKoreaIsResponsibleForBinanceCryptoHack
30,523 views
111 Discussing
6
#BinanceSAFUFundTransferCompleted7499BTC
139,261 views
1,847 Discussing
7
#CZDismissesClaimsBinanceHackWasPredicted
27,420 views
423 Discussing
8
#BinanceRecovery90% of stolen assets
267,981 views
258 Discussing
9
#B14gReportsUnauthorizedTransferOfAbout97MCORE
8,911 views
157 Discussing
10
#USSpotETHETFsPost23StraightDaysOfNetOutflows
8,473 views
140 Discussing