
#sophchartnotes
sophchartnotes
3 views
2 Discussing
Hot
Latest

·
--
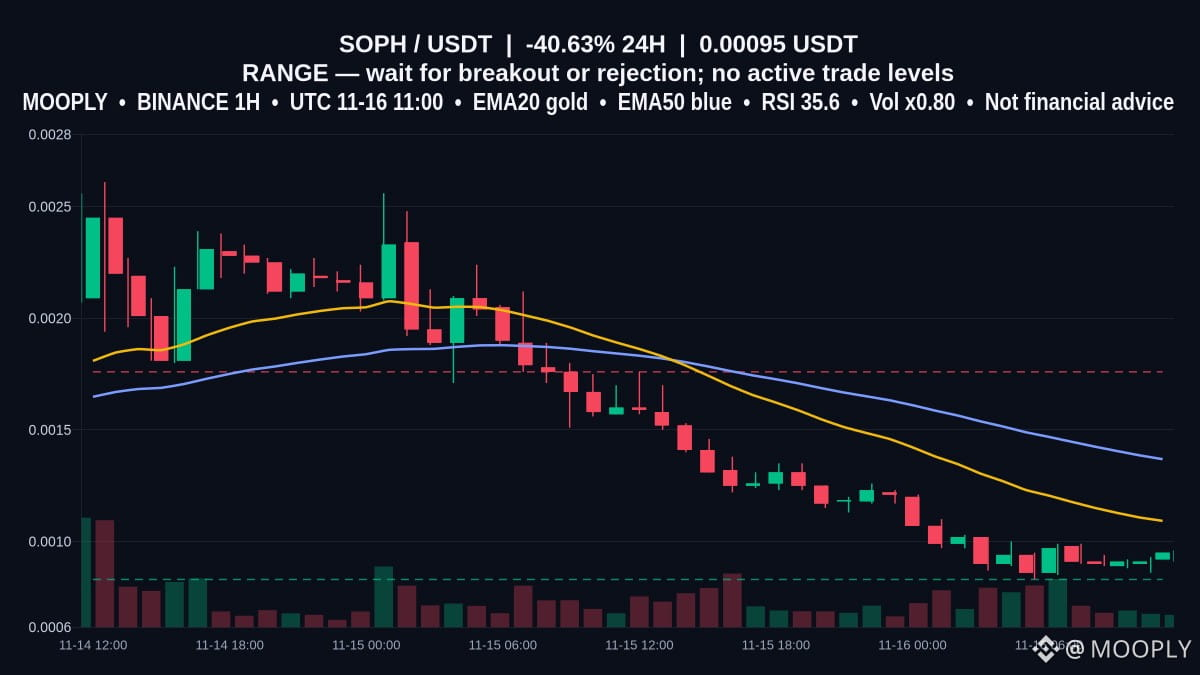
Contrarian take: $SOPH plunged 40.6% in 24h to 0.00095, yet the 1h chart keeps EMA20 (0.0010924) and EMA50 (0.0013687) above price. RSI ~35.6 and MACD negative show weak momentum, while volume is below the daily average (volRatio 0.8) despite a recent 6h uptick.
This is RANGE: clear support at 0.00083 and resistance at 0.00176. If support holds with rising volume and ATR14-confirmed 1h candles, expect a capped bounce toward the EMAs; if support breaks on heavier volume, expect continuation lower.
Would a confirmed 1h close below 0.00083 with increasing volume validate a breakdown?
↔ RANGE watch
Support: 0.0008300 | Resistance: 0.0017600
Bull scenario: confirmation above resistance
Bear scenario: confirmation below support
Entry: N/A | TP1: N/A | TP2: N/A | TP3: N/A | SL: N/A
No confirmed trade until a breakout or rejection.
Not financial advice.
#SOPHChartNotes #StopLossDiscipline #RangeReactionIdeas
Contrarian take: $SOPH plunged 40.6% in 24h to 0.00095, yet the 1h chart keeps EMA20 (0.0010924) and EMA50 (0.0013687) above price. RSI ~35.6 and MACD negative show weak momentum, while volume is below the daily average (volRatio 0.8) despite a recent 6h uptick.
This is RANGE: clear support at 0.00083 and resistance at 0.00176. If support holds with rising volume and ATR14-confirmed 1h candles, expect a capped bounce toward the EMAs; if support breaks on heavier volume, expect continuation lower.
Would a confirmed 1h close below 0.00083 with increasing volume validate a breakdown?
↔ RANGE watch
Support: 0.0008300 | Resistance: 0.0017600
Bull scenario: confirmation above resistance
Bear scenario: confirmation below support
Entry: N/A | TP1: N/A | TP2: N/A | TP3: N/A | SL: N/A
No confirmed trade until a breakout or rejection.
Not financial advice.
#SOPHChartNotes #StopLossDiscipline #RangeReactionIdeas
This is RANGE: clear support at 0.00083 and resistance at 0.00176. If support holds with rising volume and ATR14-confirmed 1h candles, expect a capped bounce toward the EMAs; if support breaks on heavier volume, expect continuation lower.
Would a confirmed 1h close below 0.00083 with increasing volume validate a breakdown?
↔ RANGE watch
Support: 0.0008300 | Resistance: 0.0017600
Bull scenario: confirmation above resistance
Bear scenario: confirmation below support
Entry: N/A | TP1: N/A | TP2: N/A | TP3: N/A | SL: N/A
No confirmed trade until a breakout or rejection.
Not financial advice.
#SOPHChartNotes #StopLossDiscipline #RangeReactionIdeas
6
Log in to explore more content
Join global crypto users on Binance Square
⚡️ Get latest and useful information about crypto.
💬 Trusted by the world’s largest crypto exchange.
👍 Discover real insights from verified creators.
Email / Phone number
Trending Topics
1
#NvidiaBoardNotConsideringHuang’sReturnasCEO
0 views
2 Discussing
2
#CypherpunkReports$306MQ3NetProfit
0 views
0 Discussing
3
#OPTIMJACKAttackInfectsAtLeast186Websites
0 views
0 Discussing
4
#StrategySells2.09MMSTRSharesFor$244.7M
1 views
7 Discussing
5
#A Packed Week of Earnings and Data Tests Markets
64,071 views
400 Discussing
6
#AnthropicIPOTestsInvestorAppetiteForAI
120,905 views
1,389 Discussing
7
#StablecoinMarketShrinksAtFastestPaceSinceTerraLuna
0 views
0 Discussing
8
#BitcoinExtendsLosingStreakToSixWeeks
96,346 views
750 Discussing
9
#XRPFallsTo$0.89LowestSinceNovember2024
14,968 views
74 Discussing
10
#SP500AndNasdaqFuturesHitQuarterlyLows
27,805 views
249 Discussing