
#sndkb
sndkb
106,583 views
2,650 Discussing
Hot
Latest

·
--
Traders are watching whether $SNDKB can turn this retest into continuation.
$SNDKB – Price is trying to stabilize near support, and buyers are watching for continuation from this area.
Trading Plan LONG $SNDKB (max 10x)
🎯 Entry: 946.42 - 954.03
🛑 SL: 944.24
✅ TP1: 963.56
✅ TP2: 975.93
✅ TP3: 990.22
• Fresh 24h volatility is creating a cleaner setup
• Relative volume is keeping this chart active on watchlists
Would you long the retest on $SNDKB, or wait for a reclaim first?
Trade $SNDKB here 👇
#SNDKB #Crypto #PriceAction
Traders are watching whether $SNDKB can turn this retest into continuation.
$SNDKB – Price is trying to stabilize near support, and buyers are watching for continuation from this area.
Trading Plan LONG $SNDKB (max 10x)
🎯 Entry: 946.42 - 954.03
🛑 SL: 944.24
✅ TP1: 963.56
✅ TP2: 975.93
✅ TP3: 990.22
• Fresh 24h volatility is creating a cleaner setup
• Relative volume is keeping this chart active on watchlists
Would you long the retest on $SNDKB , or wait for a reclaim first?
Trade $SNDKB here 👇
#SNDKB #Crypto #PriceAction
$SNDKB – Price is trying to stabilize near support, and buyers are watching for continuation from this area.
Trading Plan LONG $SNDKB (max 10x)
🎯 Entry: 946.42 - 954.03
🛑 SL: 944.24
✅ TP1: 963.56
✅ TP2: 975.93
✅ TP3: 990.22
• Fresh 24h volatility is creating a cleaner setup
• Relative volume is keeping this chart active on watchlists
Would you long the retest on $SNDKB , or wait for a reclaim first?
Trade $SNDKB here 👇
#SNDKB #Crypto #PriceAction
7

·
--
$SNDKB +8.35% | $CRWVB +8.29% | $BEB +7.79%
#SNDKB rose to $952.60, up +8.35% with $82.0 M of volume. The jump feels solid on that level of turnover.
#CRWVB climbed to $56.98, gaining +8.29% on $1.8 M of volume. Momentum appears strong despite the smaller trade size.
#BEB advanced to $204.68, up +7.79% with $3.4 M of volume. The price lift is notable given the moderate volume.
A watchful eye on SNDKB’s volume trend could signal whether this rally sustains.
#Write2Earn #Binance
$SNDKB +8.35% | $CRWVB +8.29% | $BEB +7.79%
#SNDKB rose to $952.60, up +8.35% with $82.0 M of volume. The jump feels solid on that level of turnover.
#CRWVB climbed to $56.98, gaining +8.29% on $1.8 M of volume. Momentum appears strong despite the smaller trade size.
#BEB advanced to $204.68, up +7.79% with $3.4 M of volume. The price lift is notable given the moderate volume.
A watchful eye on SNDKB’s volume trend could signal whether this rally sustains.
#Write2Earn #Binance
#SNDKB rose to $952.60, up +8.35% with $82.0 M of volume. The jump feels solid on that level of turnover.
#CRWVB climbed to $56.98, gaining +8.29% on $1.8 M of volume. Momentum appears strong despite the smaller trade size.
#BEB advanced to $204.68, up +7.79% with $3.4 M of volume. The price lift is notable given the moderate volume.
A watchful eye on SNDKB’s volume trend could signal whether this rally sustains.
#Write2Earn #Binance
30

·
--
$SNDKB looks ready for a strong push higher
Buyers are very active with volume at 1.7x normal
🎯 Buy $SNDKB 943.9411 to 959.2647
Stop loss 936.0343
Targets 986.4486 / 1006.61 / 1036.86
RSI sits right at 55 so it has room to run
Holding strong up 10.1% on the day
Sitting inside the zone as I type this
Tap $SNDKB to buy
Last 7 days of my calls, 29 hit target and 74 hit stop
#SNDKB #TradingSignals
$SNDKB looks ready for a strong push higher
Buyers are very active with volume at 1.7x normal
🎯 Buy $SNDKB 943.9411 to 959.2647
Stop loss 936.0343
Targets 986.4486 / 1006.61 / 1036.86
RSI sits right at 55 so it has room to run
Holding strong up 10.1% on the day
Sitting inside the zone as I type this
Tap $SNDKB to buy
Last 7 days of my calls, 29 hit target and 74 hit stop
#SNDKB #TradingSignals
Buyers are very active with volume at 1.7x normal
🎯 Buy $SNDKB 943.9411 to 959.2647
Stop loss 936.0343
Targets 986.4486 / 1006.61 / 1036.86
RSI sits right at 55 so it has room to run
Holding strong up 10.1% on the day
Sitting inside the zone as I type this
Tap $SNDKB to buy
Last 7 days of my calls, 29 hit target and 74 hit stop
#SNDKB #TradingSignals

·
--
$SNDKB +14.10% | $INTWB +13.79% | $NBISB +13.71%
#SNDKB is trading at $985.32, up +14.10% with $81.6 M of volume. The surge suggests strong buying interest, though the price may meet resistance near the $1,000 level.
#INTWB sits at $6.52, gaining +13.79% on $3.0 M of volume. The modest turnover hints at a tighter order book, so price swings could be sharper.
#NBISB moves to $157.36, up +13.71% with $5.1 M of volume. Momentum appears solid, yet the rally could wobble if broader market sentiment shifts.
📌 Keep an eye on how the differing volume scales might dictate the next short‑term direction for each token.
#Write2Earn #Binance
$SNDKB +14.10% | $INTWB +13.79% | $NBISB +13.71%
#SNDKB is trading at $985.32, up +14.10% with $81.6 M of volume. The surge suggests strong buying interest, though the price may meet resistance near the $1,000 level.
#INTWB sits at $6.52, gaining +13.79% on $3.0 M of volume. The modest turnover hints at a tighter order book, so price swings could be sharper.
#NBISB moves to $157.36, up +13.71% with $5.1 M of volume. Momentum appears solid, yet the rally could wobble if broader market sentiment shifts.
📌 Keep an eye on how the differing volume scales might dictate the next short‑term direction for each token.
#Write2Earn #Binance
#SNDKB is trading at $985.32, up +14.10% with $81.6 M of volume. The surge suggests strong buying interest, though the price may meet resistance near the $1,000 level.
#INTWB sits at $6.52, gaining +13.79% on $3.0 M of volume. The modest turnover hints at a tighter order book, so price swings could be sharper.
#NBISB moves to $157.36, up +13.71% with $5.1 M of volume. Momentum appears solid, yet the rally could wobble if broader market sentiment shifts.
📌 Keep an eye on how the differing volume scales might dictate the next short‑term direction for each token.
#Write2Earn #Binance
1

·
--
Bearish
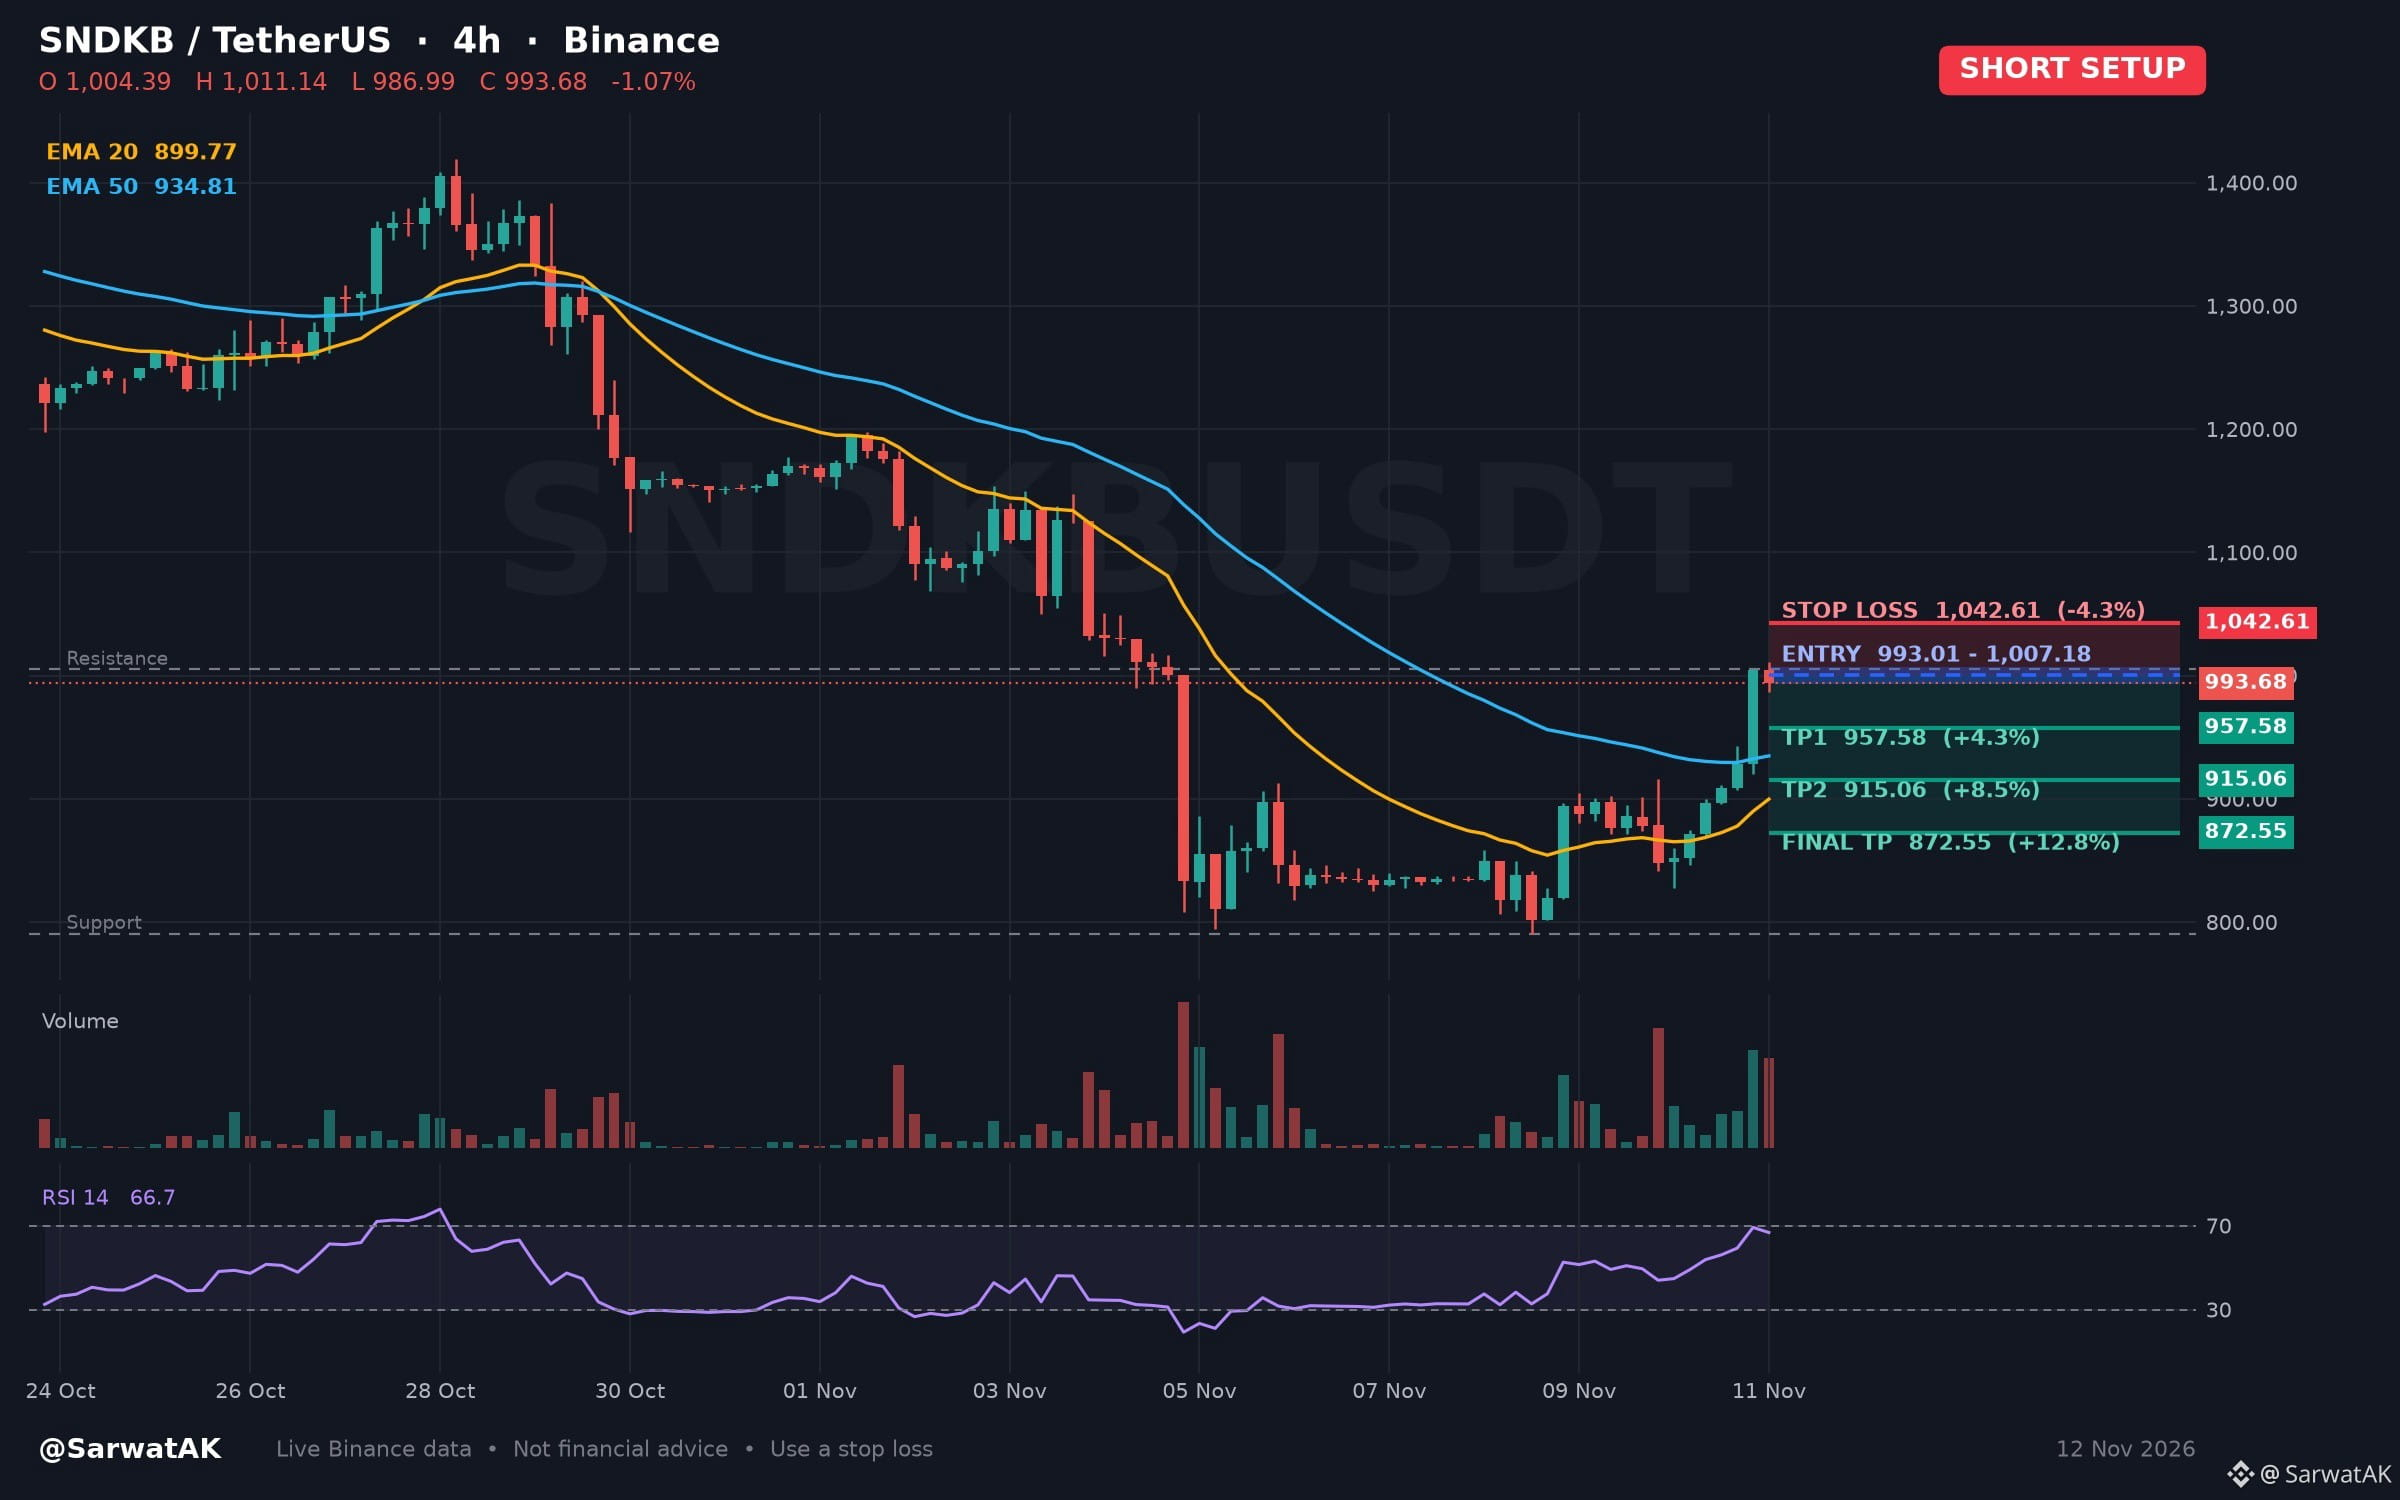
$SNDKB SHORT SETUP ... NEXT TARGET 872.55
Testing Swing High Resistance Amid Neutral Four Hour Momentum
Entry: 993.01 - 1,007.18 (Short)
TP1: 957.58
TP2: 915.06
Final TP: 872.55
SL: 1,042.61
Ascending over the past day, price is currently testing its twenty-candle swing high. With the four-hour relative strength index in neutral territory, traders often observe whether momentum sustains a breakout or encounters resistance.
As long as price stays below 1,007.18, structure stays heavy
Must use stop loss while trading
Trade $SNDKB
Not financial advice. Always DYOR.
🙏 Tips are always welcome and truly appreciated. Thank you for supporting Open to Discussion.
Like & Follow for Daily Trade Analytics & Insider News. @SarwatAK
#SNDKB #Altseason #TradingSignals
{spot}(SNDKBUSDT)
$SNDKB SHORT SETUP ... NEXT TARGET 872.55
Testing Swing High Resistance Amid Neutral Four Hour Momentum
Entry: 993.01 - 1,007.18 (Short)
TP1: 957.58
TP2: 915.06
Final TP: 872.55
SL: 1,042.61
Ascending over the past day, price is currently testing its twenty-candle swing high. With the four-hour relative strength index in neutral territory, traders often observe whether momentum sustains a breakout or encounters resistance.
As long as price stays below 1,007.18, structure stays heavy
Must use stop loss while trading
Trade $SNDKB
Not financial advice. Always DYOR.
🙏 Tips are always welcome and truly appreciated. Thank you for supporting Open to Discussion.
Like & Follow for Daily Trade Analytics & Insider News. @SarwatAK
#SNDKB #Altseason #TradingSignals
Testing Swing High Resistance Amid Neutral Four Hour Momentum
Entry: 993.01 - 1,007.18 (Short)
TP1: 957.58
TP2: 915.06
Final TP: 872.55
SL: 1,042.61
Ascending over the past day, price is currently testing its twenty-candle swing high. With the four-hour relative strength index in neutral territory, traders often observe whether momentum sustains a breakout or encounters resistance.
As long as price stays below 1,007.18, structure stays heavy
Must use stop loss while trading
Trade $SNDKB
Not financial advice. Always DYOR.
🙏 Tips are always welcome and truly appreciated. Thank you for supporting Open to Discussion.
Like & Follow for Daily Trade Analytics & Insider News. @SarwatAK
#SNDKB #Altseason #TradingSignals
3


$SNDKB: Why We Separate Observation, Interpretation, and Caveat in Every Post
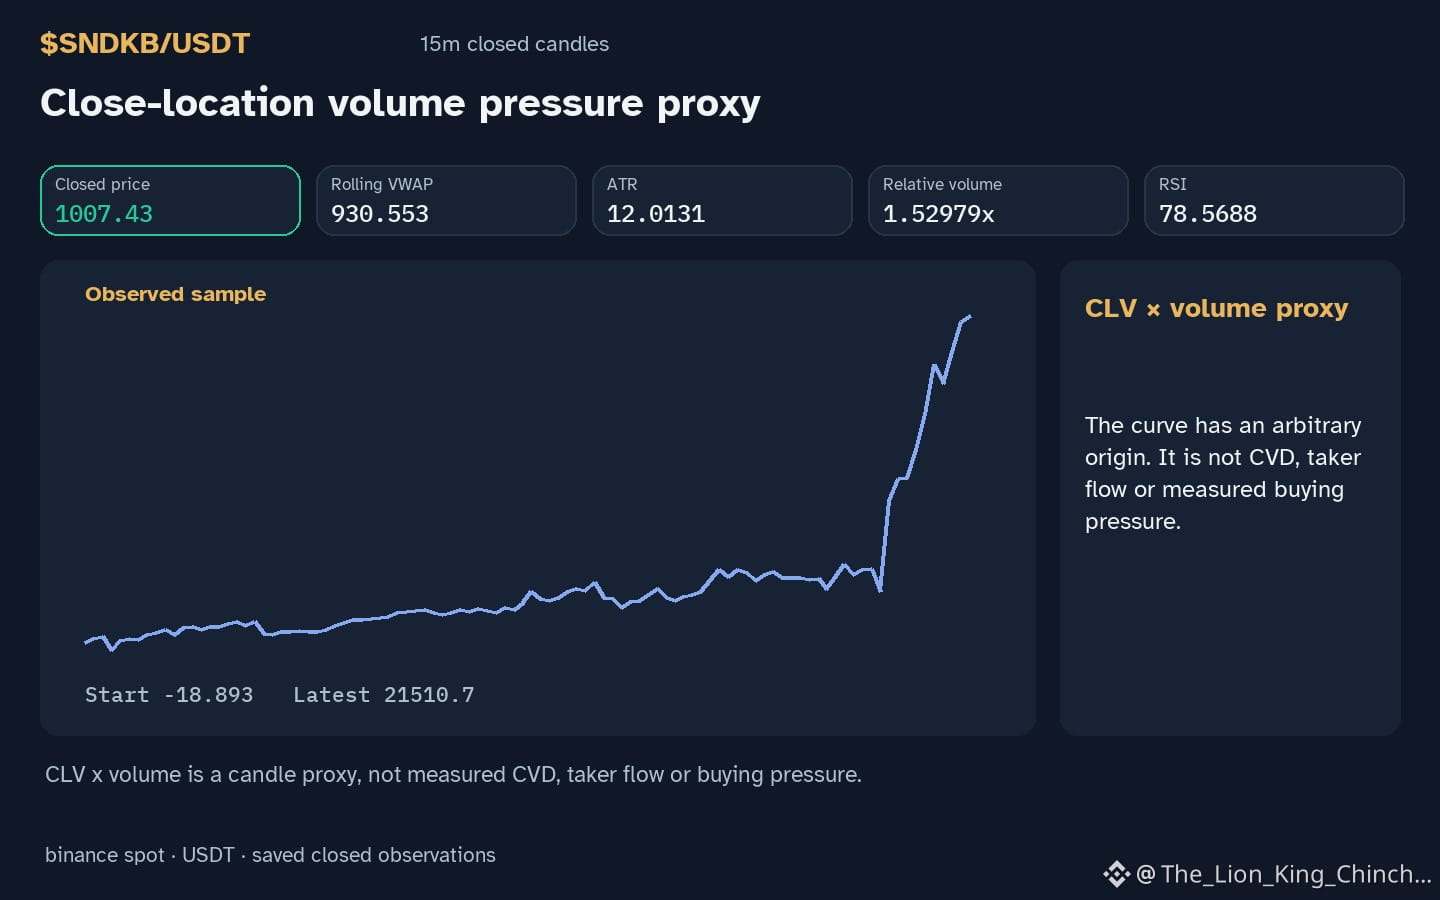
What does it mean when $SNDKB trades above resistance, the hourly direction is up, and volume sits 1.53x the baseline? The raw data tells us only that price moved higher in a short interval while more trades occurred than usual. That fact alone does not prove a sustained rally, nor does it guarantee a breakout.
A three‑layer architecture for trustworthy writing can help readers keep this distinction clear. The first layer records the observation. here the range is above resistance, the hourly direction is up, and volume is above baseline. The second layer proposes an interpretation, such as "the market may be testing a new upward bias," but it must be framed as a hypothesis, not a conclusion. The third layer adds a caveat, reminding that the same pattern could arise from a temporary pump, a news spike, or simply random noise.
To illustrate the risk of over‑interpretation, consider a counterexample: a similar setup yesterday for another asset dissolved into a rapid reversal within the next hour. If the next closed candle for $SNDKB shows a daily change 20.4383% down, the upward interpretation would be weakened.
Readers can reassess by watching for a confirming signal. such as a sustained RSI 78.6 above neutral for several periods. or a clear failure to hold the new level. Until then, the observation remains a neutral piece of evidence, and the interpretation stays tentative.
Probabilistic market research, not a recommendation or guaranteed return.
#SNDKB #CryptoCommunity
$SNDKB : Why We Separate Observation, Interpretation, and Caveat in Every Post
What does it mean when $SNDKB trades above resistance, the hourly direction is up, and volume sits 1.53x the baseline? The raw data tells us only that price moved higher in a short interval while more trades occurred than usual. That fact alone does not prove a sustained rally, nor does it guarantee a breakout.
A three‑layer architecture for trustworthy writing can help readers keep this distinction clear. The first layer records the observation. here the range is above resistance, the hourly direction is up, and volume is above baseline. The second layer proposes an interpretation, such as "the market may be testing a new upward bias," but it must be framed as a hypothesis, not a conclusion. The third layer adds a caveat, reminding that the same pattern could arise from a temporary pump, a news spike, or simply random noise.
To illustrate the risk of over‑interpretation, consider a counterexample: a similar setup yesterday for another asset dissolved into a rapid reversal within the next hour. If the next closed candle for $SNDKB shows a daily change 20.4383% down, the upward interpretation would be weakened.
Readers can reassess by watching for a confirming signal. such as a sustained RSI 78.6 above neutral for several periods. or a clear failure to hold the new level. Until then, the observation remains a neutral piece of evidence, and the interpretation stays tentative.
Probabilistic market research, not a recommendation or guaranteed return.
#SNDKB #CryptoCommunity
What does it mean when $SNDKB trades above resistance, the hourly direction is up, and volume sits 1.53x the baseline? The raw data tells us only that price moved higher in a short interval while more trades occurred than usual. That fact alone does not prove a sustained rally, nor does it guarantee a breakout.
A three‑layer architecture for trustworthy writing can help readers keep this distinction clear. The first layer records the observation. here the range is above resistance, the hourly direction is up, and volume is above baseline. The second layer proposes an interpretation, such as "the market may be testing a new upward bias," but it must be framed as a hypothesis, not a conclusion. The third layer adds a caveat, reminding that the same pattern could arise from a temporary pump, a news spike, or simply random noise.
To illustrate the risk of over‑interpretation, consider a counterexample: a similar setup yesterday for another asset dissolved into a rapid reversal within the next hour. If the next closed candle for $SNDKB shows a daily change 20.4383% down, the upward interpretation would be weakened.
Readers can reassess by watching for a confirming signal. such as a sustained RSI 78.6 above neutral for several periods. or a clear failure to hold the new level. Until then, the observation remains a neutral piece of evidence, and the interpretation stays tentative.
Probabilistic market research, not a recommendation or guaranteed return.
#SNDKB #CryptoCommunity
53
·
--
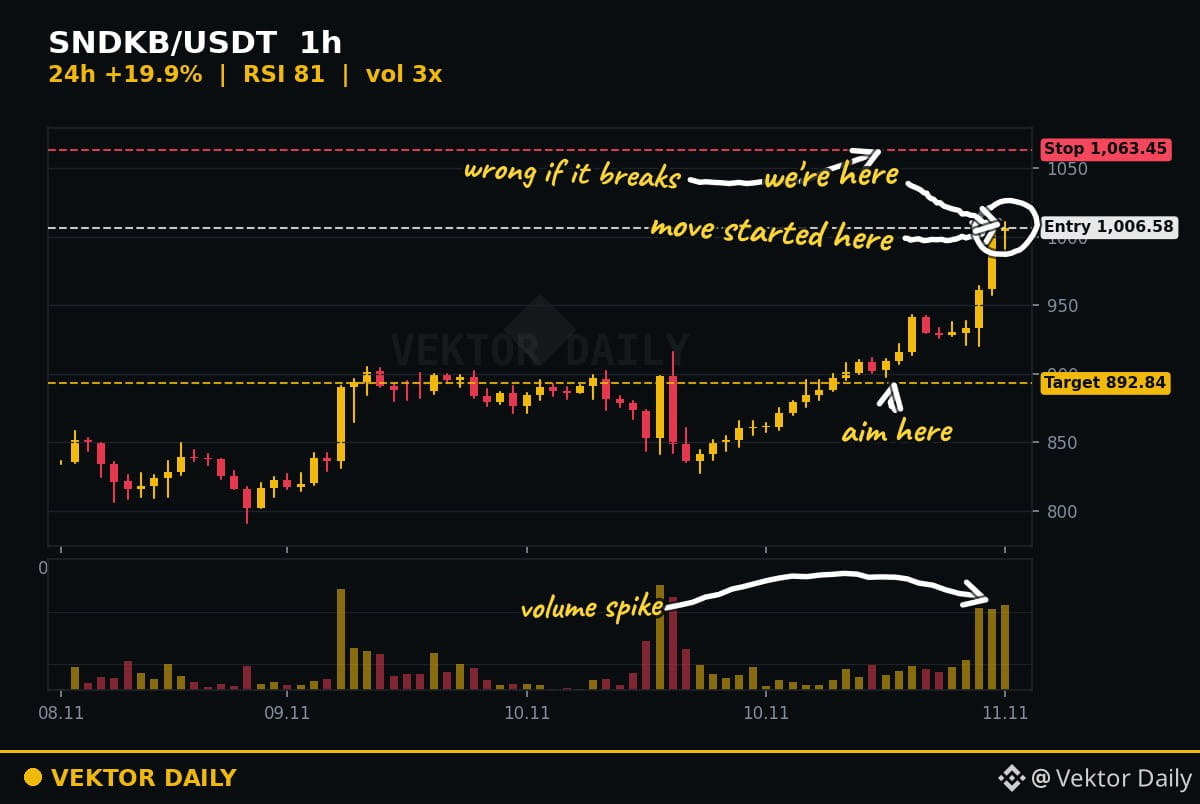
$SNDKB is flying 20.4 percent today. My 1h RSI says hold off 📉
Price sits at 1007.43 right now
That is sitting at 98 percent of the 24h range
1h RSI is deep into 81
Volume printed 70.0M today which is 1.4x the 7 day average
I need an hourly close and hold above 1011.14 to change my mind
Or I want a pullback that holds 827.7700 and bounces 🛑
It could keep running without you
A bad entry costs more than a missed move
Chasing $SNDKB here, or waiting for 827.7700?
#SNDKB #RiskManagement
$SNDKB is flying 20.4 percent today. My 1h RSI says hold off 📉
Price sits at 1007.43 right now
That is sitting at 98 percent of the 24h range
1h RSI is deep into 81
Volume printed 70.0M today which is 1.4x the 7 day average
I need an hourly close and hold above 1011.14 to change my mind
Or I want a pullback that holds 827.7700 and bounces 🛑
It could keep running without you
A bad entry costs more than a missed move
Chasing $SNDKB here, or waiting for 827.7700?
#SNDKB #RiskManagement
Price sits at 1007.43 right now
That is sitting at 98 percent of the 24h range
1h RSI is deep into 81
Volume printed 70.0M today which is 1.4x the 7 day average
I need an hourly close and hold above 1011.14 to change my mind
Or I want a pullback that holds 827.7700 and bounces 🛑
It could keep running without you
A bad entry costs more than a missed move
Chasing $SNDKB here, or waiting for 827.7700?
#SNDKB #RiskManagement
6

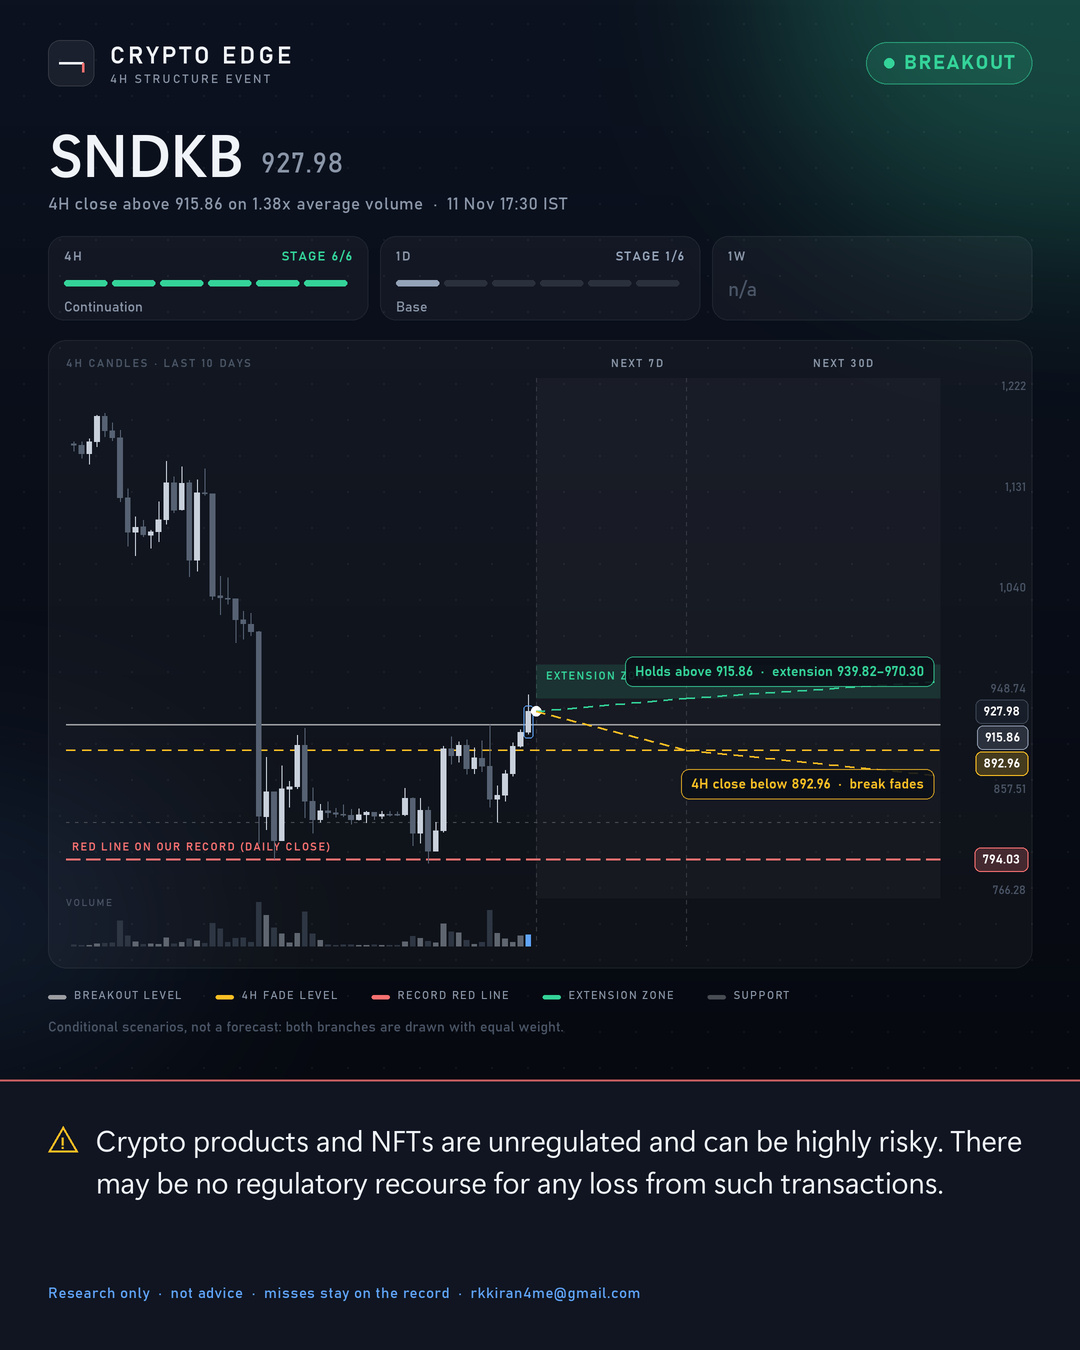
$SNDKB is pushing through resistance on the 4H chart 👀
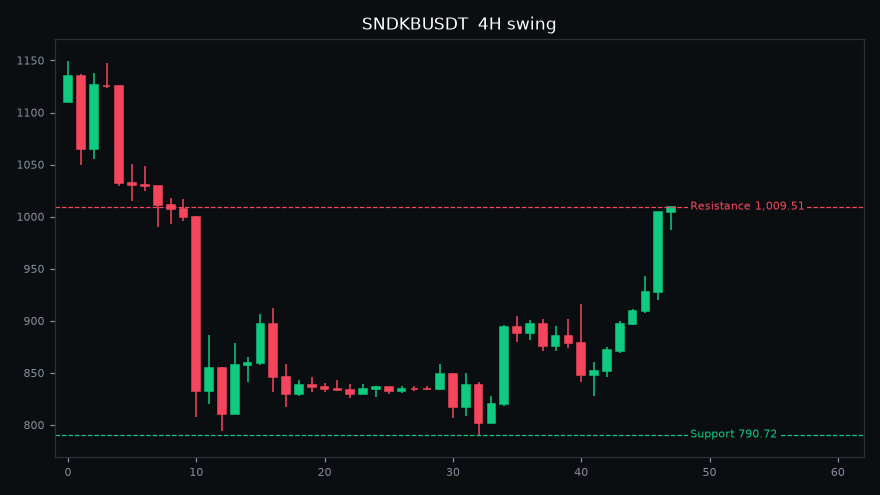
Price is around 927.98, after a 4H close above 915.86 on about 1.4x its usual volume. That level matters because price turned lower there before, so I'm watching whether it holds rather than chasing the move.
If #SNDKB holds above 915.86, the chart suggests room toward the 939.82–970.30 area. If it slips back under 892.96 on a 4H close, the break has failed and a pullback toward 827.77 could follow.
On the record, SNDKB's setup is still judged on one line only: a daily close below 794.03.
Holds above 915.86 or slips back under 892.96? Your read below 👇
Research, not advice. #CryptoEdge #MarketStructure
Full track record: https://cryptoedge-therecord.rkkiran4me.workers.dev
$SNDKB is pushing through resistance on the 4H chart 👀
Price is around 927.98, after a 4H close above 915.86 on about 1.4x its usual volume. That level matters because price turned lower there before, so I'm watching whether it holds rather than chasing the move.
If #SNDKB holds above 915.86, the chart suggests room toward the 939.82–970.30 area. If it slips back under 892.96 on a 4H close, the break has failed and a pullback toward 827.77 could follow.
On the record, SNDKB's setup is still judged on one line only: a daily close below 794.03.
Holds above 915.86 or slips back under 892.96? Your read below 👇
Research, not advice. #CryptoEdge #MarketStructure
Full track record: https://cryptoedge-therecord.rkkiran4me.workers.dev
Price is around 927.98, after a 4H close above 915.86 on about 1.4x its usual volume. That level matters because price turned lower there before, so I'm watching whether it holds rather than chasing the move.
If #SNDKB holds above 915.86, the chart suggests room toward the 939.82–970.30 area. If it slips back under 892.96 on a 4H close, the break has failed and a pullback toward 827.77 could follow.
On the record, SNDKB's setup is still judged on one line only: a daily close below 794.03.
Holds above 915.86 or slips back under 892.96? Your read below 👇
Research, not advice. #CryptoEdge #MarketStructure
Full track record: https://cryptoedge-therecord.rkkiran4me.workers.dev
236



·
--
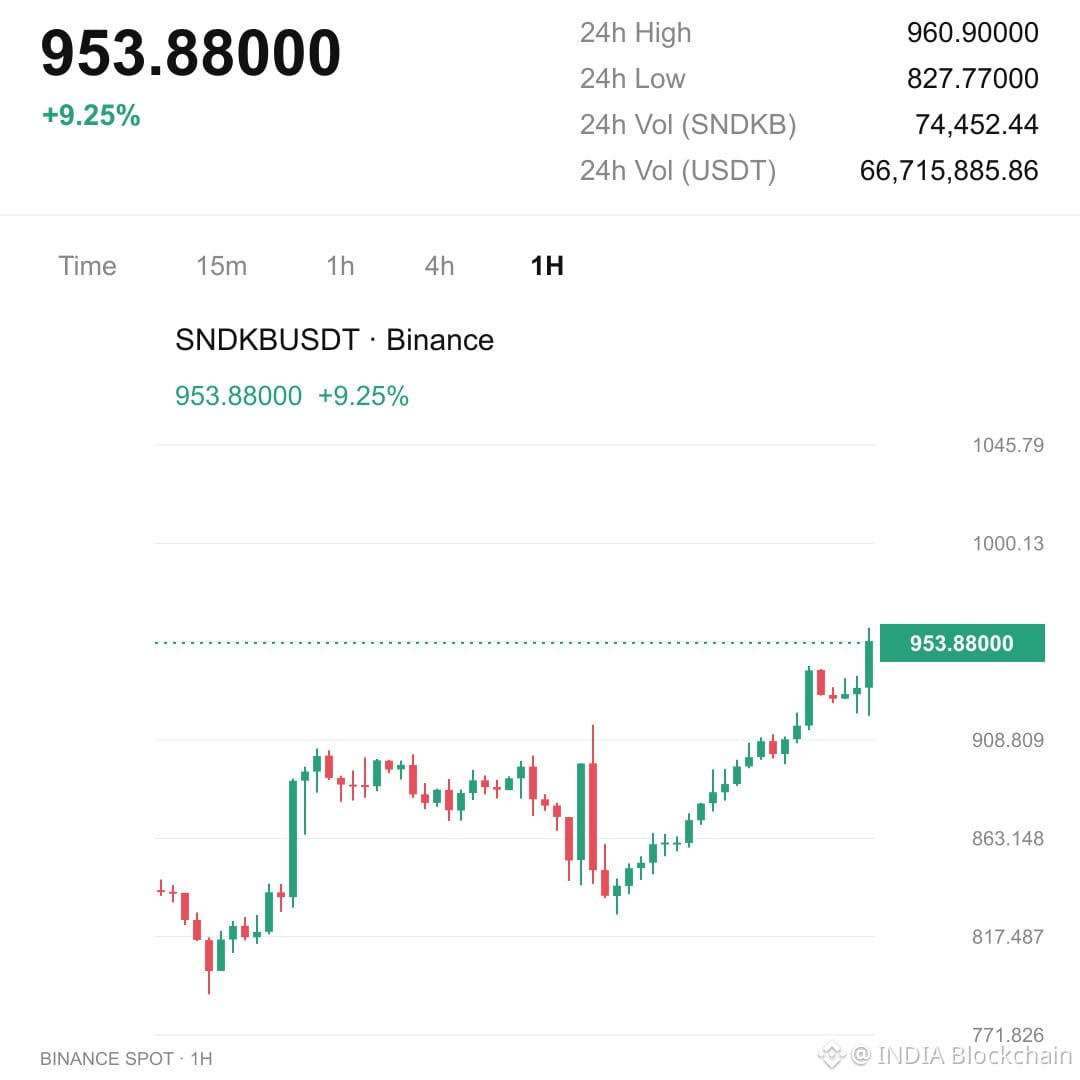
Data Surge: $SNDKB Powers Ahead on Binance Spot
Price action – $SNDKB trades at $947.78 on Binance Spot (SNDKB/USDT), up 9.84% over the past 24 hours with solid volume. $SNDKB matters as soaring demand for data storage, driven by AI and edge‑computing workloads, underpins SanDisk’s growth outlook.
Key levels – immediate support around $910, resistance near $980, with a mid‑range pivot at $945 serving as a reference point for intraday swings.
Short outlook – Bullish continuation is evident; momentum is building and dips near $910 look buyable. If the sector trend holds, the bStock could test the $1,020 ceiling in the near term.
#SNDKB #TokenizedStocks #BinanceSquare
Data Surge: $SNDKB Powers Ahead on Binance Spot
Price action – $SNDKB trades at $947.78 on Binance Spot (SNDKB/USDT), up 9.84% over the past 24 hours with solid volume. $SNDKB matters as soaring demand for data storage, driven by AI and edge‑computing workloads, underpins SanDisk’s growth outlook.
Key levels – immediate support around $910, resistance near $980, with a mid‑range pivot at $945 serving as a reference point for intraday swings.
Short outlook – Bullish continuation is evident; momentum is building and dips near $910 look buyable. If the sector trend holds, the bStock could test the $1,020 ceiling in the near term.
#SNDKB #TokenizedStocks #BinanceSquare
Price action – $SNDKB trades at $947.78 on Binance Spot (SNDKB/USDT), up 9.84% over the past 24 hours with solid volume. $SNDKB matters as soaring demand for data storage, driven by AI and edge‑computing workloads, underpins SanDisk’s growth outlook.
Key levels – immediate support around $910, resistance near $980, with a mid‑range pivot at $945 serving as a reference point for intraday swings.
Short outlook – Bullish continuation is evident; momentum is building and dips near $910 look buyable. If the sector trend holds, the bStock could test the $1,020 ceiling in the near term.
#SNDKB #TokenizedStocks #BinanceSquare
2
·
--
$SNDKB +6.80% | $MUB +6.62% | $SKHYB +6.51%
#SNDKB pushed up to $933.27, climbing +6.80% on a solid $68.9 M of volume, suggesting strong buying pressure behind the move.
#MUB rose to $773.20, up +6.62% with $24.0 M changing hands, a notable lift for a mid‑cap that’s seeing renewed interest.
#SKHYB nudged higher to $140.36, gaining +6.51% on $8.6 M of volume, a modest flow but enough to keep the token in the green.
🧐 The spread in trading volume may dictate which of these gains can hold versus those that could wobble on thinner liquidity.
#Write2Earn #Binance
$SNDKB +6.80% | $MUB +6.62% | $SKHYB +6.51%
#SNDKB pushed up to $933.27, climbing +6.80% on a solid $68.9 M of volume, suggesting strong buying pressure behind the move.
#MUB rose to $773.20, up +6.62% with $24.0 M changing hands, a notable lift for a mid‑cap that’s seeing renewed interest.
#SKHYB nudged higher to $140.36, gaining +6.51% on $8.6 M of volume, a modest flow but enough to keep the token in the green.
🧐 The spread in trading volume may dictate which of these gains can hold versus those that could wobble on thinner liquidity.
#Write2Earn #Binance
#SNDKB pushed up to $933.27, climbing +6.80% on a solid $68.9 M of volume, suggesting strong buying pressure behind the move.
#MUB rose to $773.20, up +6.62% with $24.0 M changing hands, a notable lift for a mid‑cap that’s seeing renewed interest.
#SKHYB nudged higher to $140.36, gaining +6.51% on $8.6 M of volume, a modest flow but enough to keep the token in the green.
🧐 The spread in trading volume may dictate which of these gains can hold versus those that could wobble on thinner liquidity.
#Write2Earn #Binance
1

·
--
Can a 2.88 percent daily gain sustain momentum near $913.92?
$SNDKB shows steady price strength on $62.97M volume, trading near the upper boundary of its recent 827.77 to 915.86 range.
Watch for a confirmed hourly close above the 915.86 high to signal continuation. Conversely, a drop below the 909.14 recent hourly close increases downside risk toward the mid-range.
Will a breakout above 915.86 confirm buyer strength, or does failing to hold 909.14 invalidate the setup?
Tap $SNDKB for the live chart. #SNDKB #BinanceSquare
Can a 2.88 percent daily gain sustain momentum near $913.92?
$SNDKB shows steady price strength on $62.97M volume, trading near the upper boundary of its recent 827.77 to 915.86 range.
Watch for a confirmed hourly close above the 915.86 high to signal continuation. Conversely, a drop below the 909.14 recent hourly close increases downside risk toward the mid-range.
Will a breakout above 915.86 confirm buyer strength, or does failing to hold 909.14 invalidate the setup?
Tap $SNDKB for the live chart. #SNDKB #BinanceSquare
$SNDKB shows steady price strength on $62.97M volume, trading near the upper boundary of its recent 827.77 to 915.86 range.
Watch for a confirmed hourly close above the 915.86 high to signal continuation. Conversely, a drop below the 909.14 recent hourly close increases downside risk toward the mid-range.
Will a breakout above 915.86 confirm buyer strength, or does failing to hold 909.14 invalidate the setup?
Tap $SNDKB for the live chart. #SNDKB #BinanceSquare
3

·
--
$SNDKB holds at $881.76 on $53.94M volume, testing its range boundaries.
The latest hourly close sits at 879.31 following a 0.89% uptick, though hourly volume remains subdued at 0.37x the 23-hour average.
A bullish scenario requires reclaiming the 915.86 high with rising volume. Conversely, failing to hold the 827.77 low invalidates immediate momentum and exposes downside risk.
Will you wait for a volume-backed breakout above 915.86, or does a drop toward 827.77 invalidate your entry plan?
Tap $SNDKB for the live chart. #SNDKB #BinanceSquare
$SNDKB holds at $881.76 on $53.94M volume, testing its range boundaries.
The latest hourly close sits at 879.31 following a 0.89% uptick, though hourly volume remains subdued at 0.37x the 23-hour average.
A bullish scenario requires reclaiming the 915.86 high with rising volume. Conversely, failing to hold the 827.77 low invalidates immediate momentum and exposes downside risk.
Will you wait for a volume-backed breakout above 915.86, or does a drop toward 827.77 invalidate your entry plan?
Tap $SNDKB for the live chart. #SNDKB #BinanceSquare
The latest hourly close sits at 879.31 following a 0.89% uptick, though hourly volume remains subdued at 0.37x the 23-hour average.
A bullish scenario requires reclaiming the 915.86 high with rising volume. Conversely, failing to hold the 827.77 low invalidates immediate momentum and exposes downside risk.
Will you wait for a volume-backed breakout above 915.86, or does a drop toward 827.77 invalidate your entry plan?
Tap $SNDKB for the live chart. #SNDKB #BinanceSquare
45
·
--
$SNDKB trades at $858.89, down 3.41% on $61.78M daily volume.
Recent price action shows the asset holding above the 23-hour range low of $827.77, while the latest hourly close ticked up 1.01% to $860.42 despite subdued volume running at 0.65x of the hourly average.
The bullish case relies on defending the lower boundary to target a push back toward the $915.86 high. Conversely, losing the recent low invalidates this setup.
Will a sustained break above the hourly close confirm continuation, or does a drop below the low invalidate the bounce?
Tap $SNDKB for the live chart. #SNDKB #BinanceSquare
$SNDKB trades at $858.89, down 3.41% on $61.78M daily volume.
Recent price action shows the asset holding above the 23-hour range low of $827.77, while the latest hourly close ticked up 1.01% to $860.42 despite subdued volume running at 0.65x of the hourly average.
The bullish case relies on defending the lower boundary to target a push back toward the $915.86 high. Conversely, losing the recent low invalidates this setup.
Will a sustained break above the hourly close confirm continuation, or does a drop below the low invalidate the bounce?
Tap $SNDKB for the live chart. #SNDKB #BinanceSquare
Recent price action shows the asset holding above the 23-hour range low of $827.77, while the latest hourly close ticked up 1.01% to $860.42 despite subdued volume running at 0.65x of the hourly average.
The bullish case relies on defending the lower boundary to target a push back toward the $915.86 high. Conversely, losing the recent low invalidates this setup.
Will a sustained break above the hourly close confirm continuation, or does a drop below the low invalidate the bounce?
Tap $SNDKB for the live chart. #SNDKB #BinanceSquare
5
·
--
$SNDKB -4.68% | $UNI -4.82% | $HYPE -3.96%
#SNDKB sits at $856.38, down -4.68% on $61.1 M of volume.
#UNI trades at $6.70, off -4.82% with $44.7 M moving, the governance token behind Uniswap’s Ethereum‑based AMM DEX.
#HYPE is priced at $72.03, slipping -3.96% on $43.4 M of volume.
👀 The order book depth shows SNDKB still commanding the most hands‑on volume, though the gap with UNI is narrowing—worth watching if the shift sustains.
#Write2Earn #Binance
$SNDKB -4.68% | $UNI -4.82% | $HYPE -3.96%
#SNDKB sits at $856.38, down -4.68% on $61.1 M of volume.
#UNI trades at $6.70, off -4.82% with $44.7 M moving, the governance token behind Uniswap’s Ethereum‑based AMM DEX.
#HYPE is priced at $72.03, slipping -3.96% on $43.4 M of volume.
👀 The order book depth shows SNDKB still commanding the most hands‑on volume, though the gap with UNI is narrowing—worth watching if the shift sustains.
#Write2Earn #Binance
#SNDKB sits at $856.38, down -4.68% on $61.1 M of volume.
#UNI trades at $6.70, off -4.82% with $44.7 M moving, the governance token behind Uniswap’s Ethereum‑based AMM DEX.
#HYPE is priced at $72.03, slipping -3.96% on $43.4 M of volume.
👀 The order book depth shows SNDKB still commanding the most hands‑on volume, though the gap with UNI is narrowing—worth watching if the shift sustains.
#Write2Earn #Binance
12

🚨 MACRO SHOCK WIPES 600 BILLION AS FED RATE FEARS HIT $SNDKB HARD! 📉
Wall Street just took a massive hit with six hundred billion vanishing from equities at the opening bell. 📊 Macro tremors like this always send immediate shockwaves through risk assets as the market prices in aggressive central bank tightening. ⚡
When institutional capital retreats from traditional equities, digital tokens face heavy liquidations before finding true demand floors. 🔍 Keep your eyes glued to order flow and volume absorption rather than trying to catch falling knives too early. 💡
💬 Are you rotating entirely into stablecoins until this macro storm clears, or scaling in during the flush? 👇
⚠️ Not financial advice. Always manage your risk. 🛡️
🏷️ #SNDKB #Macro #RiskOff #Crypto #Trading
🔥 💎
🚨 MACRO SHOCK WIPES 600 BILLION AS FED RATE FEARS HIT $SNDKB HARD! 📉
Wall Street just took a massive hit with six hundred billion vanishing from equities at the opening bell. 📊 Macro tremors like this always send immediate shockwaves through risk assets as the market prices in aggressive central bank tightening. ⚡
When institutional capital retreats from traditional equities, digital tokens face heavy liquidations before finding true demand floors. 🔍 Keep your eyes glued to order flow and volume absorption rather than trying to catch falling knives too early. 💡
💬 Are you rotating entirely into stablecoins until this macro storm clears, or scaling in during the flush? 👇
⚠️ Not financial advice. Always manage your risk. 🛡️
🏷️ #SNDKB #Macro #RiskOff #Crypto #Trading
🔥 💎
Wall Street just took a massive hit with six hundred billion vanishing from equities at the opening bell. 📊 Macro tremors like this always send immediate shockwaves through risk assets as the market prices in aggressive central bank tightening. ⚡
When institutional capital retreats from traditional equities, digital tokens face heavy liquidations before finding true demand floors. 🔍 Keep your eyes glued to order flow and volume absorption rather than trying to catch falling knives too early. 💡
💬 Are you rotating entirely into stablecoins until this macro storm clears, or scaling in during the flush? 👇
⚠️ Not financial advice. Always manage your risk. 🛡️
🏷️ #SNDKB #Macro #RiskOff #Crypto #Trading
🔥 💎
1
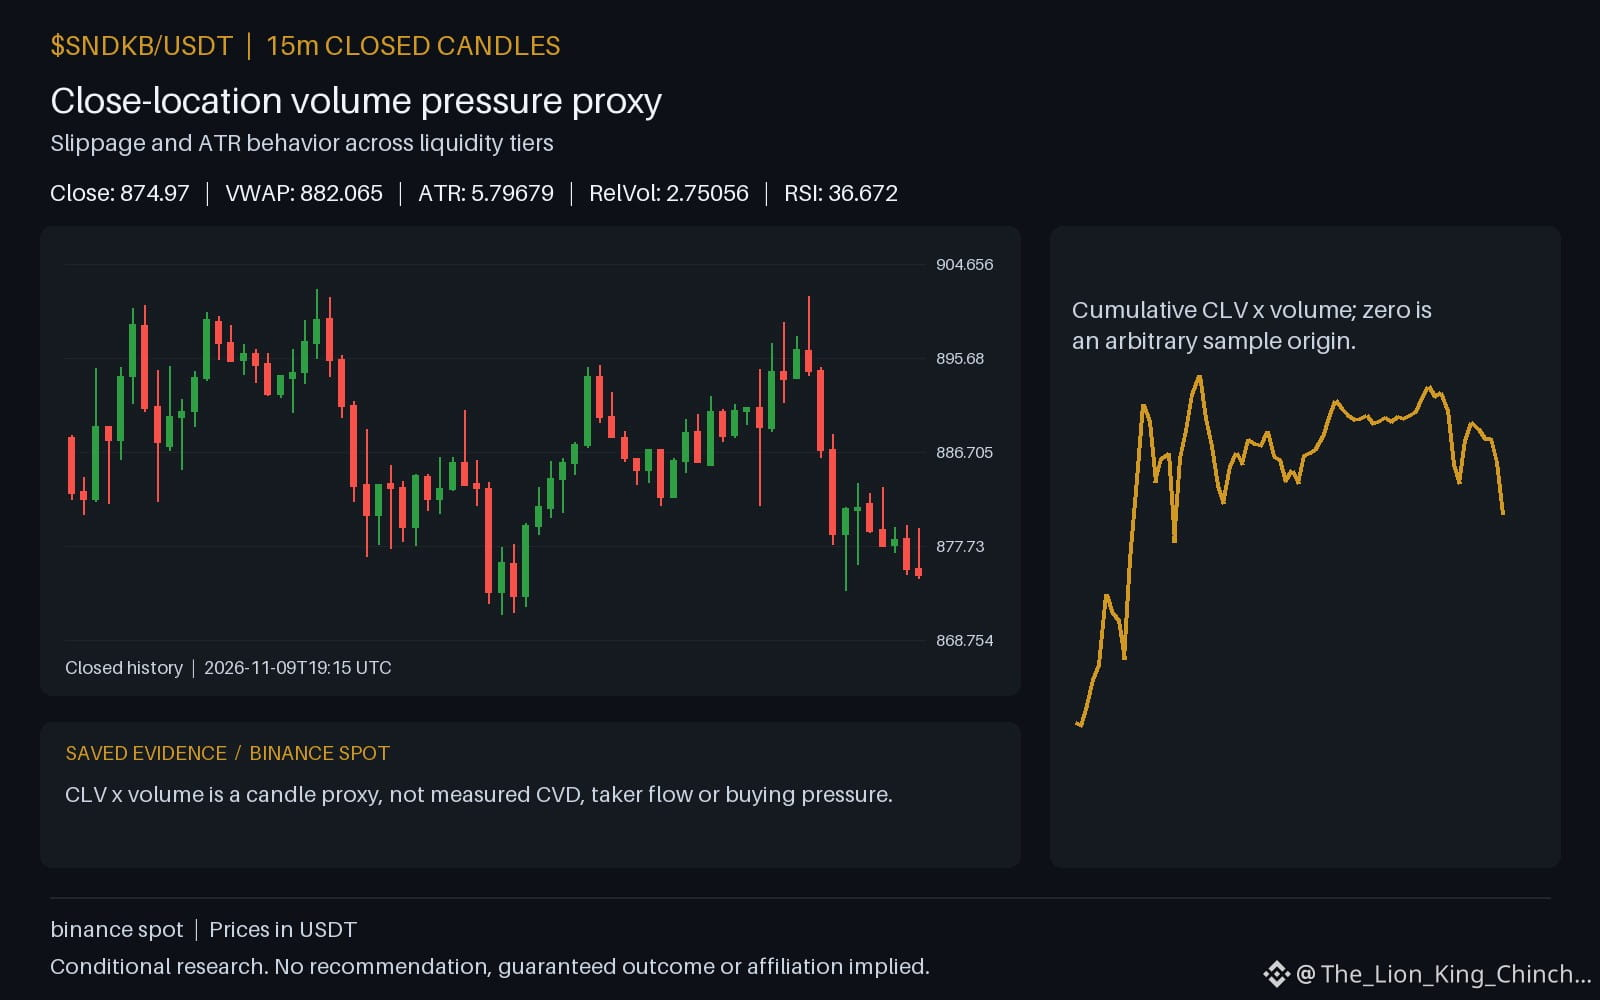
$SNDKB: Liquidity Tier Effects on Slippage and ATR
A common assumption is that lower liquidity always produces higher slippage, and that the average true range (ATR) will rise proportionally. The observation for the primary asset shows an hourly direction down with volume above baseline, while peer ETH also moves down but with strong volume, and peer INIT moves down with weaker volume. This contrast creates a thought experiment about how ATR reacts across tiers.
The counterexample considers that even with higher volume, a thinly traded coin can display a modest ATR if price moves stay within a narrow band. Conversely, a highly liquid asset may exhibit a larger ATR when a sudden shift overwhelms market depth. The hourly ATR reading for the primary asset uses 5.79679, while peers display their own 5.79679 values that are not directly comparable because liquidity conditions differ.
What could change the reading is a shift in order flow that expands the effective spread, causing slippage to grow faster than ATR. To reassess, one could monitor the relative volume 2.75056 alongside the ATR on an hourly chart and note when the spread widens beyond the typical 5.79679 range. This self‑check highlights the limits of assuming a fixed relationship between slippage and ATR across liquidity tiers. 🙂
Probabilistic market research, not a recommendation or guaranteed return.
For a wider view: $ETH has hourly direction down and volume above its baseline; $INIT has hourly direction down and volume not above its baseline. This alone does not establish correlation.
Would you keep the same rule after missing a move?
#SNDKB #ETH #INIT
$SNDKB : Liquidity Tier Effects on Slippage and ATR
A common assumption is that lower liquidity always produces higher slippage, and that the average true range (ATR) will rise proportionally. The observation for the primary asset shows an hourly direction down with volume above baseline, while peer ETH also moves down but with strong volume, and peer INIT moves down with weaker volume. This contrast creates a thought experiment about how ATR reacts across tiers.
The counterexample considers that even with higher volume, a thinly traded coin can display a modest ATR if price moves stay within a narrow band. Conversely, a highly liquid asset may exhibit a larger ATR when a sudden shift overwhelms market depth. The hourly ATR reading for the primary asset uses 5.79679, while peers display their own 5.79679 values that are not directly comparable because liquidity conditions differ.
What could change the reading is a shift in order flow that expands the effective spread, causing slippage to grow faster than ATR. To reassess, one could monitor the relative volume 2.75056 alongside the ATR on an hourly chart and note when the spread widens beyond the typical 5.79679 range. This self‑check highlights the limits of assuming a fixed relationship between slippage and ATR across liquidity tiers. 🙂
Probabilistic market research, not a recommendation or guaranteed return.
For a wider view: $ETH has hourly direction down and volume above its baseline; $INIT has hourly direction down and volume not above its baseline. This alone does not establish correlation.
Would you keep the same rule after missing a move?
#SNDKB #ETH #INIT
A common assumption is that lower liquidity always produces higher slippage, and that the average true range (ATR) will rise proportionally. The observation for the primary asset shows an hourly direction down with volume above baseline, while peer ETH also moves down but with strong volume, and peer INIT moves down with weaker volume. This contrast creates a thought experiment about how ATR reacts across tiers.
The counterexample considers that even with higher volume, a thinly traded coin can display a modest ATR if price moves stay within a narrow band. Conversely, a highly liquid asset may exhibit a larger ATR when a sudden shift overwhelms market depth. The hourly ATR reading for the primary asset uses 5.79679, while peers display their own 5.79679 values that are not directly comparable because liquidity conditions differ.
What could change the reading is a shift in order flow that expands the effective spread, causing slippage to grow faster than ATR. To reassess, one could monitor the relative volume 2.75056 alongside the ATR on an hourly chart and note when the spread widens beyond the typical 5.79679 range. This self‑check highlights the limits of assuming a fixed relationship between slippage and ATR across liquidity tiers. 🙂
Probabilistic market research, not a recommendation or guaranteed return.
For a wider view: $ETH has hourly direction down and volume above its baseline; $INIT has hourly direction down and volume not above its baseline. This alone does not establish correlation.
Would you keep the same rule after missing a move?
#SNDKB #ETH #INIT
43
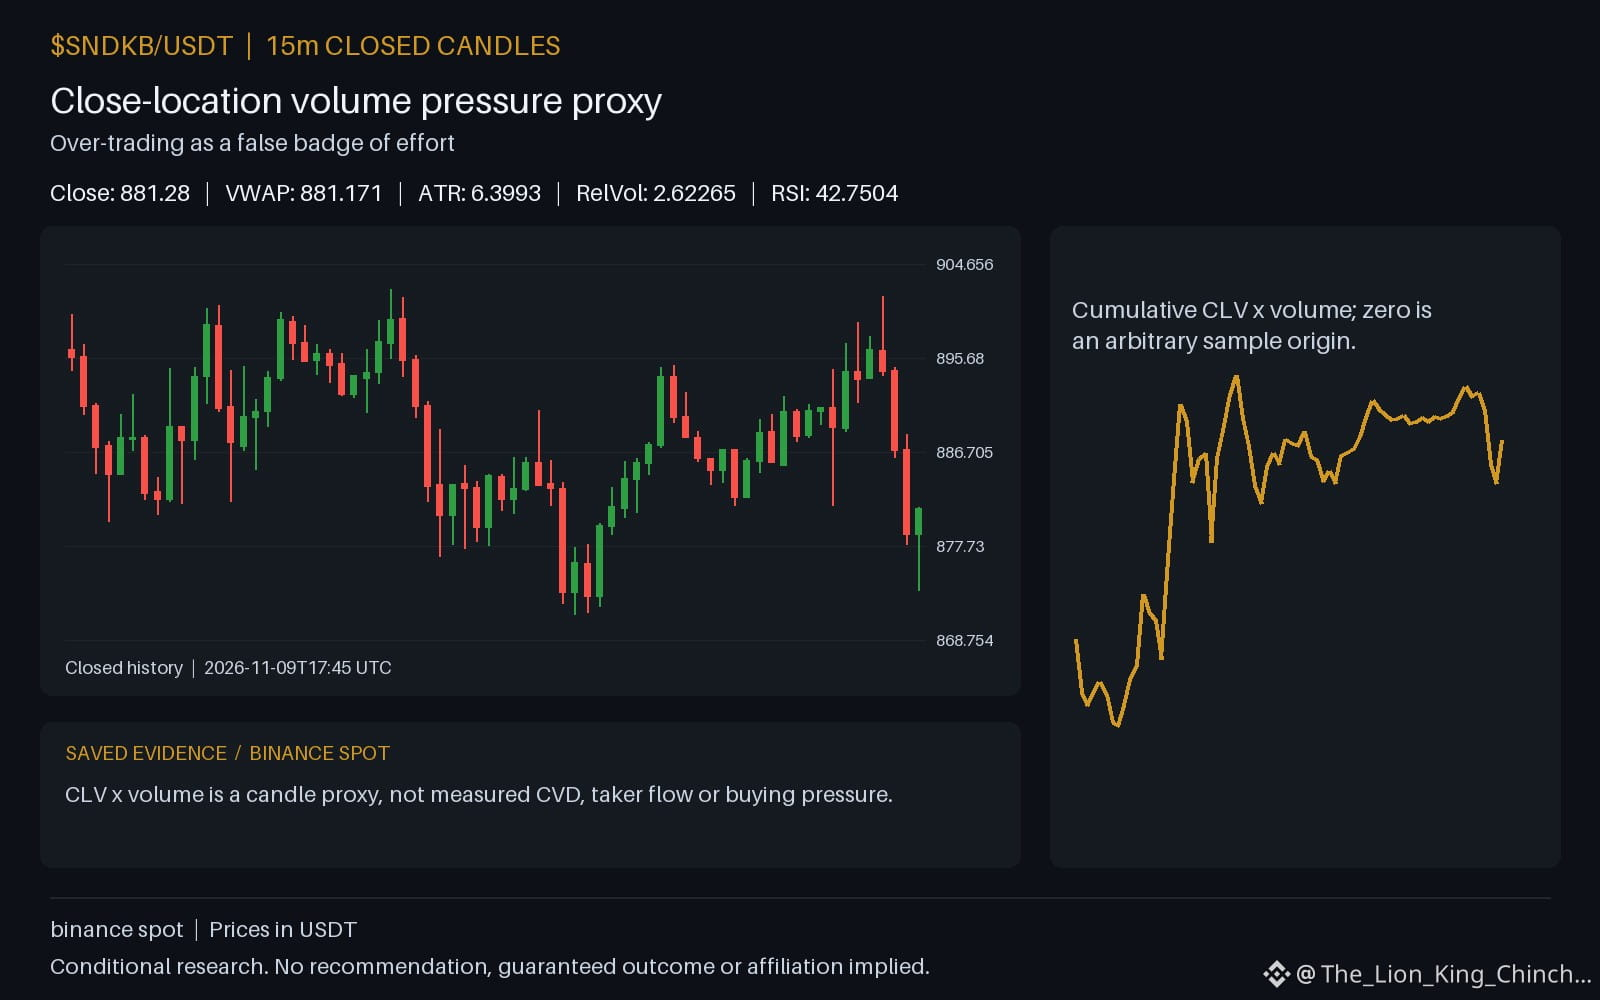
Activity vs Productivity in $SNDKB Charts
Does doing more work lead to better results? In crypto, we often equate the number of trades with the level of professional effort. This thought experiment explores if over-trading serves as a false badge of productivity. When a market shows high activity, a researcher might feel that staying busy is the only way to capture value. Currently, $SNDKB has an hourly direction that is down. The daily relative volume is 2.62265 while the RSI sits at 42.7504.
One potential mechanism for over-trading is the justification of effort. If you spend hours studying the daily change of 7.84141, you might feel compelled to act simply because you worked hard. This is a common trap. Consider a counterexample: a disciplined analyst identifies the resistance at 901.56 and the support at 877.84, then chooses to wait. Even though they did not execute a trade, their research was successful because it prevented a low-probability entry.
To reassess your interpretation, try this practical self-check: if your current trade setup disappeared, would you feel relieved or anxious? If you feel relief, you might be trading to satisfy a need for activity rather than following a plan. High volume and price movements like -1.69223 often trigger a fear of being idle. True productivity involves recognizing when the best action is no action at all.
Probabilistic market research, not a recommendation or guaranteed return.
In your own routine, how do you measure a successful research day when you take zero trades?
#SNDKB #TradingPsychology #CryptoLearning
Activity vs Productivity in $SNDKB Charts
Does doing more work lead to better results? In crypto, we often equate the number of trades with the level of professional effort. This thought experiment explores if over-trading serves as a false badge of productivity. When a market shows high activity, a researcher might feel that staying busy is the only way to capture value. Currently, $SNDKB has an hourly direction that is down. The daily relative volume is 2.62265 while the RSI sits at 42.7504.
One potential mechanism for over-trading is the justification of effort. If you spend hours studying the daily change of 7.84141, you might feel compelled to act simply because you worked hard. This is a common trap. Consider a counterexample: a disciplined analyst identifies the resistance at 901.56 and the support at 877.84, then chooses to wait. Even though they did not execute a trade, their research was successful because it prevented a low-probability entry.
To reassess your interpretation, try this practical self-check: if your current trade setup disappeared, would you feel relieved or anxious? If you feel relief, you might be trading to satisfy a need for activity rather than following a plan. High volume and price movements like -1.69223 often trigger a fear of being idle. True productivity involves recognizing when the best action is no action at all.
Probabilistic market research, not a recommendation or guaranteed return.
In your own routine, how do you measure a successful research day when you take zero trades?
#SNDKB #TradingPsychology #CryptoLearning
Does doing more work lead to better results? In crypto, we often equate the number of trades with the level of professional effort. This thought experiment explores if over-trading serves as a false badge of productivity. When a market shows high activity, a researcher might feel that staying busy is the only way to capture value. Currently, $SNDKB has an hourly direction that is down. The daily relative volume is 2.62265 while the RSI sits at 42.7504.
One potential mechanism for over-trading is the justification of effort. If you spend hours studying the daily change of 7.84141, you might feel compelled to act simply because you worked hard. This is a common trap. Consider a counterexample: a disciplined analyst identifies the resistance at 901.56 and the support at 877.84, then chooses to wait. Even though they did not execute a trade, their research was successful because it prevented a low-probability entry.
To reassess your interpretation, try this practical self-check: if your current trade setup disappeared, would you feel relieved or anxious? If you feel relief, you might be trading to satisfy a need for activity rather than following a plan. High volume and price movements like -1.69223 often trigger a fear of being idle. True productivity involves recognizing when the best action is no action at all.
Probabilistic market research, not a recommendation or guaranteed return.
In your own routine, how do you measure a successful research day when you take zero trades?
#SNDKB #TradingPsychology #CryptoLearning
26
Log in to explore more content
Join global crypto users on Binance Square
⚡️ Get latest and useful information about crypto.
💬 Trusted by the world’s largest crypto exchange.
👍 Discover real insights from verified creators.
Email / Phone number
Trending Topics
1
#AnthropicRejectsIPODelayValuationinQuestion
407,546 views
3,480 Discussing
2
#ZcashFallsBelow$1000ForFirstTimeSinceSeptember
18,836 views
120 Discussing
3
#CanNvidiaEarningsEaseMarketConcerns?
134,528 views
1,522 Discussing
4
#HotCPIDecemberHikePriced
420,833 views
3,564 Discussing
5
#StablecoinSupplyDrops$14.2BIn30Days
21 views
2 Discussing
6
#TradFiForBeginners
473,034 views
3,143 Discussing
7
#BitcoinETFsLose$1.6BInNovember
15,023 views
74 Discussing
8
#AnthropicDisclosesOver$10BNewComputeDeals
3,005 views
42 Discussing
9
#CoreWeaveJumps10%On168%RevenueGrowth
37,207 views
598 Discussing
10
#BarclaysRaisesBlackRockBitcoinETFStake48%
30,841 views
427 Discussing