Binance Square
#rsineutral

rsineutral

11 views
2 Discussing
KriptoVIPTrader
·
--
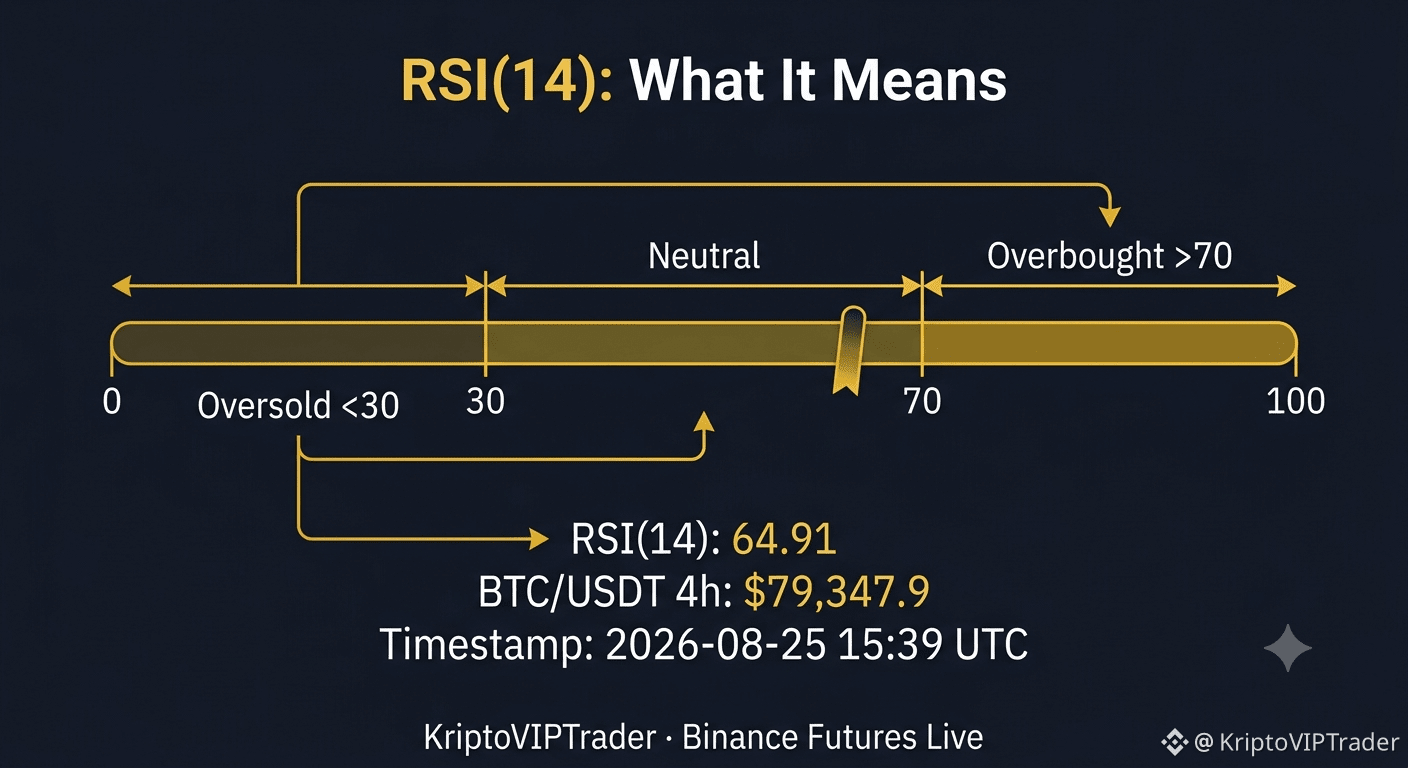
BTC is currently hovering around $79,347.9, showing a slight -0.26% dip over the last 24 hours. But let’s look deeper than just the price. On the BTC/USDT 4-hour chart, the RSI(14) is sitting at 64.91. This is an important metric. It measures the relative strength of recent price gains compared to recent losses, giving us a clearer view of momentum. While many see RSI over 70 as overbought, 64.91 indicates strong momentum that has carried over from the broader multi-day move, even if the immediate 24-hour action is cool. It’s not about speed; it's about strength. $BTC #RSIneutral {future}(BTCUSDT)
BTC is currently hovering around $79,347.9, showing a slight -0.26% dip over the last 24 hours. But let’s look deeper than just the price. On the BTC/USDT 4-hour chart, the RSI(14) is sitting at 64.91. This is an important metric. It measures the relative strength of recent price gains compared to recent losses, giving us a clearer view of momentum. While many see RSI over 70 as overbought, 64.91 indicates strong momentum that has carried over from the broader multi-day move, even if the immediate 24-hour action is cool. It’s not about speed; it's about strength. $BTC #RSIneutral
Log in to explore more content
Join global crypto users on Binance Square
⚡️ Get latest and useful information about crypto.
💬 Trusted by the world’s largest crypto exchange.
👍 Discover real insights from verified creators.
Email / Phone number