

#penta
penta
3 views
4 Discussing
Hot
Latest

Why is a coin up 45% in a day, yet every timeframe I look at is screaming lower?
That’s the question I kept asking when I pulled up $PNT.
**The Read:**
This isn’t a pump with legs. It’s a violent bounce inside a bigger downtrend.
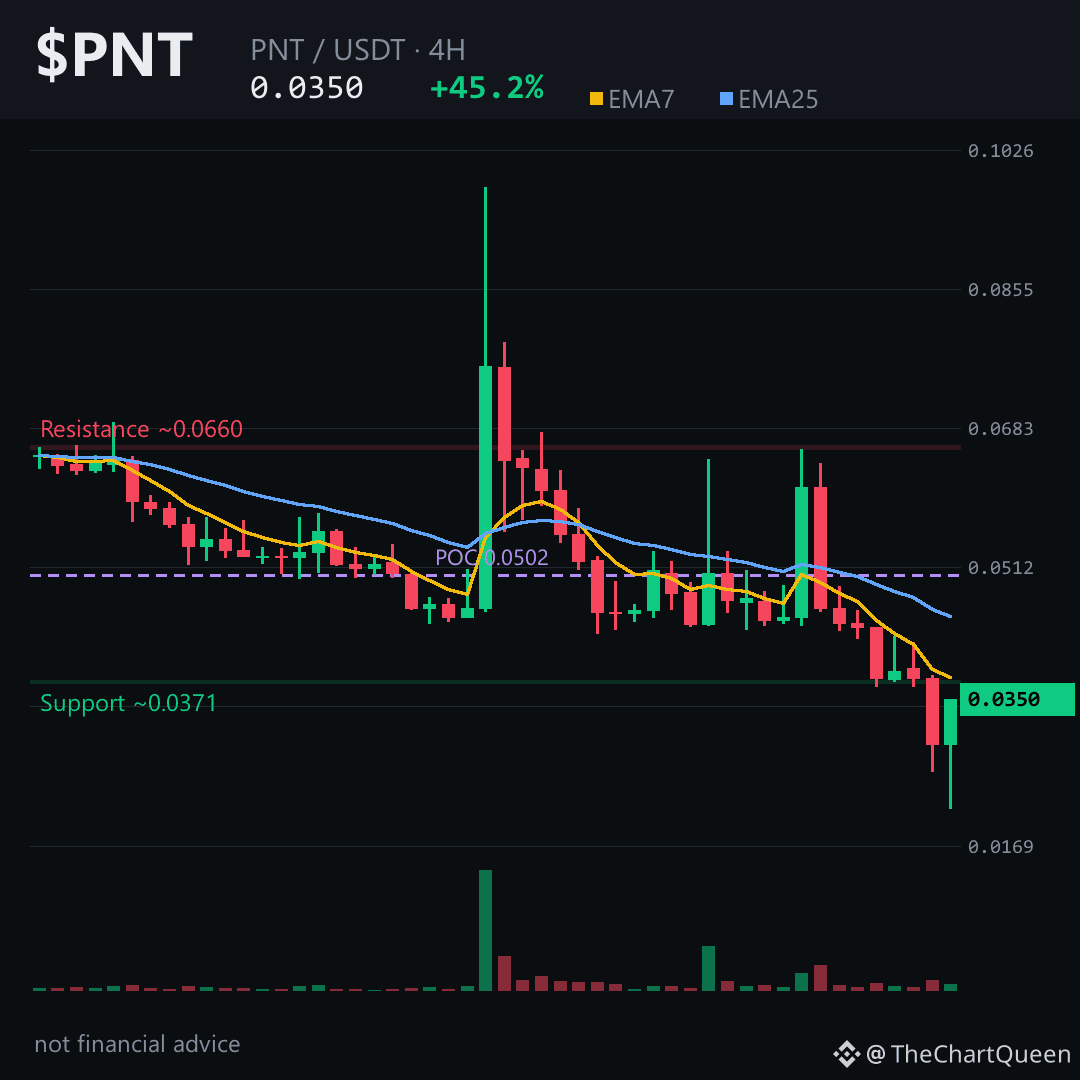
The 4-hour chart shows price still trading below both key moving averages — the short-term trend line and the longer one. That’s a classic bearish structure.
RSI is trying to recover from oversold, but it remains weak. No real futures volume behind this move either. Open interest is practically zero. This is spot-driven, thin, and fragile.
**The Levels That Matter:**
On the 4-hour picture, the area around 0.037 is the line in the sand.
If $PNT can’t reclaim that zone, the path of least resistance stays lower.
The next natural magnet sits near the 0.032 area — a prior consolidation pocket.
Lose that and the macro chart points toward the 0.022 region, which was the launchpad before this spike.
A close back above 0.037 flips the short-term read and puts 0.040–0.042 in focus.
**My read:**
This is a high-risk bounce, not a trend reversal. Until buyers prove they can hold above 0.037, I trust the downtrend more than the green candle.
I’ll revisit $PNT if that 0.037 area gets tested from below — follow along so the update finds you.
What’s the one level you’re watching on PNT?
⚠️ Not financial advice. DYOR.
#PNT #Penta #Crypto #BinanceSquare
Why is a coin up 45% in a day, yet every timeframe I look at is screaming lower?
That’s the question I kept asking when I pulled up $PNT.
**The Read:**
This isn’t a pump with legs. It’s a violent bounce inside a bigger downtrend.
The 4-hour chart shows price still trading below both key moving averages — the short-term trend line and the longer one. That’s a classic bearish structure.
RSI is trying to recover from oversold, but it remains weak. No real futures volume behind this move either. Open interest is practically zero. This is spot-driven, thin, and fragile.
**The Levels That Matter:**
On the 4-hour picture, the area around 0.037 is the line in the sand.
If $PNT can’t reclaim that zone, the path of least resistance stays lower.
The next natural magnet sits near the 0.032 area — a prior consolidation pocket.
Lose that and the macro chart points toward the 0.022 region, which was the launchpad before this spike.
A close back above 0.037 flips the short-term read and puts 0.040–0.042 in focus.
**My read:**
This is a high-risk bounce, not a trend reversal. Until buyers prove they can hold above 0.037, I trust the downtrend more than the green candle.
I’ll revisit $PNT if that 0.037 area gets tested from below — follow along so the update finds you.
What’s the one level you’re watching on PNT?
⚠️ Not financial advice. DYOR.
#PNT #Penta #Crypto #BinanceSquare
That’s the question I kept asking when I pulled up $PNT.
**The Read:**
This isn’t a pump with legs. It’s a violent bounce inside a bigger downtrend.
The 4-hour chart shows price still trading below both key moving averages — the short-term trend line and the longer one. That’s a classic bearish structure.
RSI is trying to recover from oversold, but it remains weak. No real futures volume behind this move either. Open interest is practically zero. This is spot-driven, thin, and fragile.
**The Levels That Matter:**
On the 4-hour picture, the area around 0.037 is the line in the sand.
If $PNT can’t reclaim that zone, the path of least resistance stays lower.
The next natural magnet sits near the 0.032 area — a prior consolidation pocket.
Lose that and the macro chart points toward the 0.022 region, which was the launchpad before this spike.
A close back above 0.037 flips the short-term read and puts 0.040–0.042 in focus.
**My read:**
This is a high-risk bounce, not a trend reversal. Until buyers prove they can hold above 0.037, I trust the downtrend more than the green candle.
I’ll revisit $PNT if that 0.037 area gets tested from below — follow along so the update finds you.
What’s the one level you’re watching on PNT?
⚠️ Not financial advice. DYOR.
#PNT #Penta #Crypto #BinanceSquare
5
+45% on the day and the chart still looks like it's bleeding out. That's the kind of top-gainer move that makes you feel smart for five minutes, then poor for a week.
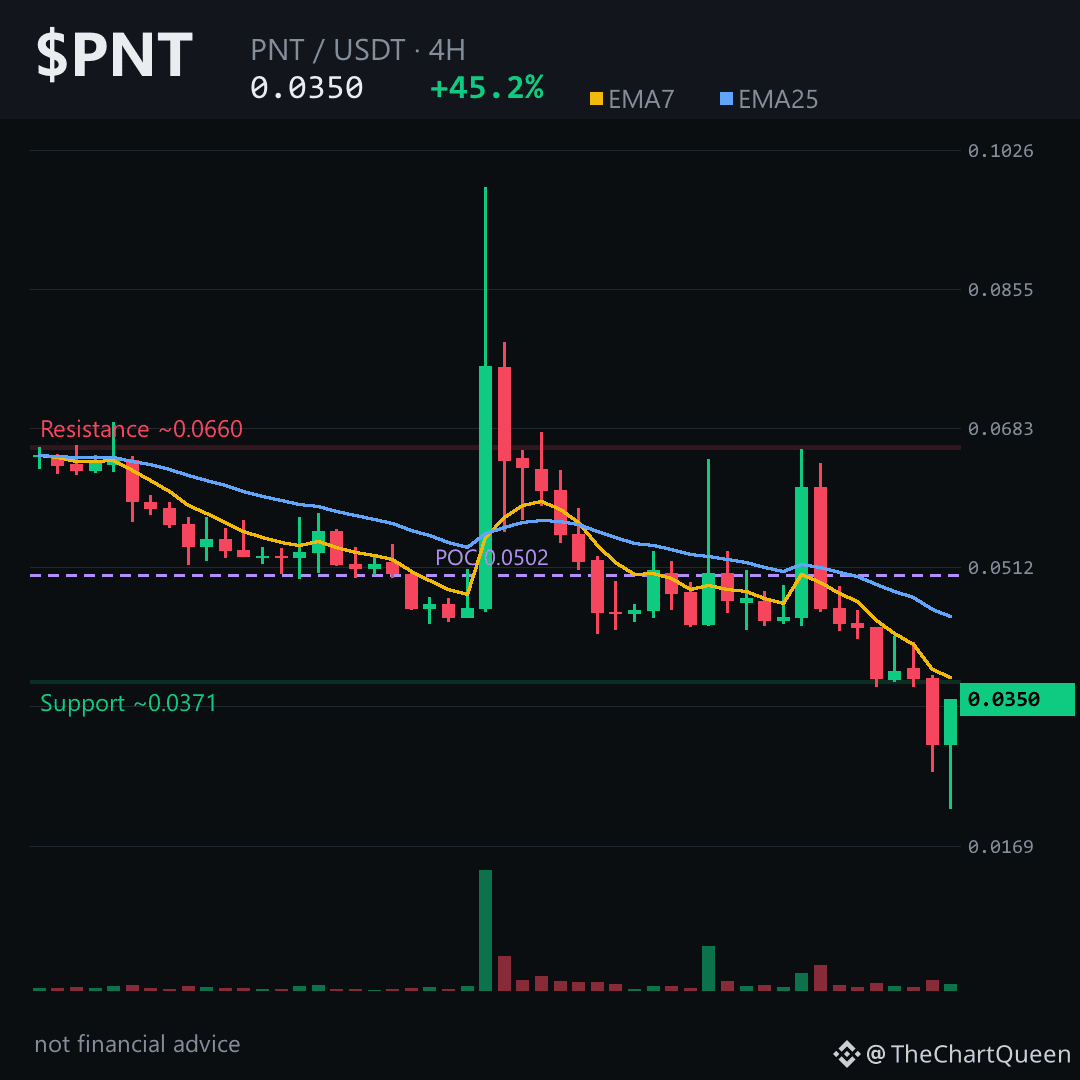
The 4H shows a violent spike to 0.065, then a straight flush back down. Classic distribution wick. Price is hovering around 0.035, every bounce getting sold. EMA7 buried under EMA25, RSI stuck in the low 40s. That's not a pullback — that's a descending staircase with the lights off.
Daily is worse. RSI under 28 — oversold in a downtrend just means sellers are winning efficiently. Massive bearish gap overhead between 0.126 and 0.172 never got filled. That's a ceiling, not a target.
The levels that matter: if $PNT loses 0.034 on a 4H close, next stop is 0.032, then the daily objective opens toward 0.030. The only way this flips is a clean reclaim above 0.037 — that's where the last breakdown happened. Until then, bounces are noise.
My read: a falling knife wrapped in a green candle. The 24-hour gain is real, but the structure underneath it is not bullish. The risk isn't missing the next leg up — it's catching a bid on something that hasn't found a floor yet.
I'll update this if the 0.034 area holds or breaks decisively — follow so that read lands in your feed.
What level are you watching on $PNT right now 👇
Not financial advice. DYOR.
#PNT #Penta #Crypto #BinanceSquare
+45% on the day and the chart still looks like it's bleeding out. That's the kind of top-gainer move that makes you feel smart for five minutes, then poor for a week.
The 4H shows a violent spike to 0.065, then a straight flush back down. Classic distribution wick. Price is hovering around 0.035, every bounce getting sold. EMA7 buried under EMA25, RSI stuck in the low 40s. That's not a pullback — that's a descending staircase with the lights off.
Daily is worse. RSI under 28 — oversold in a downtrend just means sellers are winning efficiently. Massive bearish gap overhead between 0.126 and 0.172 never got filled. That's a ceiling, not a target.
The levels that matter: if $PNT loses 0.034 on a 4H close, next stop is 0.032, then the daily objective opens toward 0.030. The only way this flips is a clean reclaim above 0.037 — that's where the last breakdown happened. Until then, bounces are noise.
My read: a falling knife wrapped in a green candle. The 24-hour gain is real, but the structure underneath it is not bullish. The risk isn't missing the next leg up — it's catching a bid on something that hasn't found a floor yet.
I'll update this if the 0.034 area holds or breaks decisively — follow so that read lands in your feed.
What level are you watching on $PNT right now 👇
Not financial advice. DYOR.
#PNT #Penta #Crypto #BinanceSquare
The 4H shows a violent spike to 0.065, then a straight flush back down. Classic distribution wick. Price is hovering around 0.035, every bounce getting sold. EMA7 buried under EMA25, RSI stuck in the low 40s. That's not a pullback — that's a descending staircase with the lights off.
Daily is worse. RSI under 28 — oversold in a downtrend just means sellers are winning efficiently. Massive bearish gap overhead between 0.126 and 0.172 never got filled. That's a ceiling, not a target.
The levels that matter: if $PNT loses 0.034 on a 4H close, next stop is 0.032, then the daily objective opens toward 0.030. The only way this flips is a clean reclaim above 0.037 — that's where the last breakdown happened. Until then, bounces are noise.
My read: a falling knife wrapped in a green candle. The 24-hour gain is real, but the structure underneath it is not bullish. The risk isn't missing the next leg up — it's catching a bid on something that hasn't found a floor yet.
I'll update this if the 0.034 area holds or breaks decisively — follow so that read lands in your feed.
What level are you watching on $PNT right now 👇
Not financial advice. DYOR.
#PNT #Penta #Crypto #BinanceSquare
3
Log in to explore more content
Join global crypto users on Binance Square
⚡️ Get latest and useful information about crypto.
💬 Trusted by the world’s largest crypto exchange.
👍 Discover real insights from verified creators.
Email / Phone number
Trending Topics
1
#FedMinutesFocusOnOctoberPause
81,656 views
954 Discussing
2
#BinanceLaunchesBinanceIntelligence
1M views
6,212 Discussing
3
#EvernorthDelaysNasdaqDebutToOct12
4,568 views
185 Discussing
4
#RobinhoodAdds$25MInBitcoinToBalanceSheet
2,277 views
59 Discussing
5
#SP500AndNasdaqHitRecordHighs
12,993 views
369 Discussing
6
#USMortgageRatesRiseTo7.49%
15,600 views
321 Discussing
7
#BTCFallsBelow$84K
99,893 views
219 Discussing
8
#DubaiVARAIssuesReserveAssetAuditCircular
39,555 views
899 Discussing
9
#SECApproves3XBitcoinETF
37,128 views
735 Discussing
10
#WinklevossFilesSpotZcashETFApplication
45,182 views
842 Discussing