
#paxgtrading
paxgtrading
8,587 views
45 Discussing
Hot
Latest

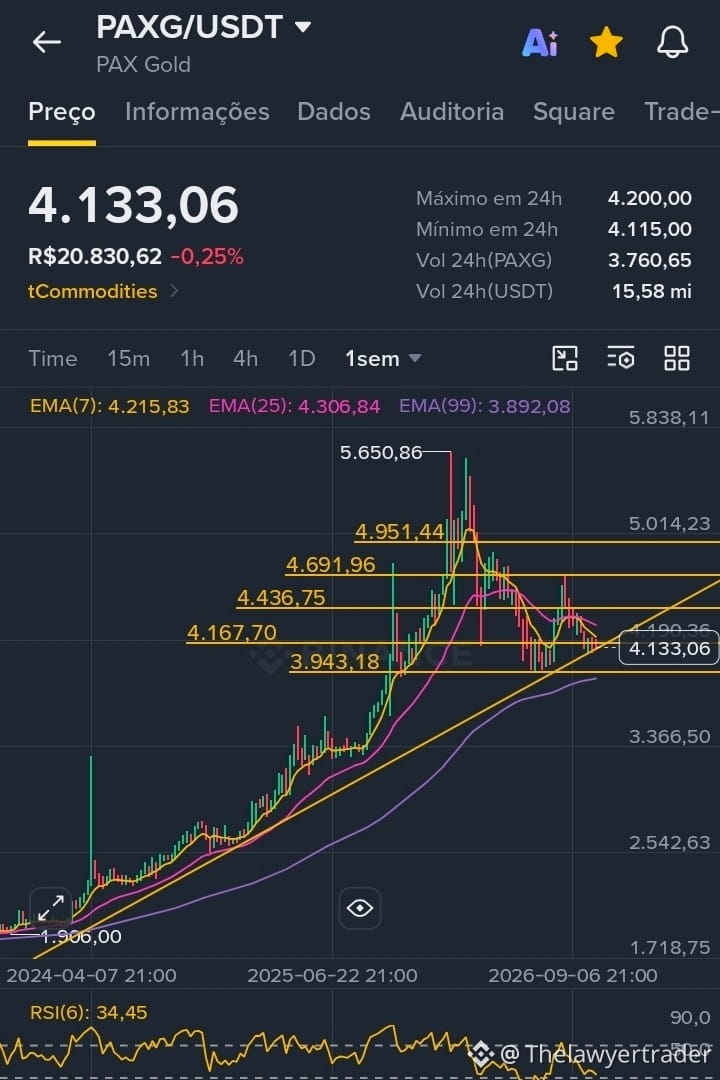
PAXG/USDT (PAX Gold) Analysis – weekly chart, 20/10/2026
PAXG is trading around US$4,133, down 0.25% over the past 24 hours. On the weekly chart, the asset has been correcting after reaching an all-time high near US$5,650. It is currently below the short-term moving averages, EMA(7) at 4,215 and EMA(25) at 4,306, but remains above EMA(99) at 3,892, preserving the long-term uptrend that began near 1,906. RSI(6) is at 34.45, in oversold territory, indicating short-term selling pressure, though there is room for a rebound.
Key levels:
🟢 Main support: ~US$3,943, reinforced by EMA(99) at 3,892
🔴 Main resistance: ~US$4,436, followed by 4,691
Chart pattern: There is no clear, confirmed chart pattern at the moment. The price is testing the support area at 4,167 after correcting from its peak, potentially forming a pullback within an uptrend. A reversal on volume above the short-term EMAs would strengthen the case for continuation; a break below 3,943 could open the way for deeper tests.
⚠️ This analysis is for informational and educational purposes only and does not constitute investment advice.
#PAXGTrading #PAXGUSDT $PAXG
PAXG/USDT (PAX Gold) Analysis – weekly chart, 20/10/2026
PAXG is trading around US$4,133, down 0.25% over the past 24 hours. On the weekly chart, the asset has been correcting after reaching an all-time high near US$5,650. It is currently below the short-term moving averages, EMA(7) at 4,215 and EMA(25) at 4,306, but remains above EMA(99) at 3,892, preserving the long-term uptrend that began near 1,906. RSI(6) is at 34.45, in oversold territory, indicating short-term selling pressure, though there is room for a rebound.
Key levels:
🟢 Main support: ~US$3,943, reinforced by EMA(99) at 3,892
🔴 Main resistance: ~US$4,436, followed by 4,691
Chart pattern: There is no clear, confirmed chart pattern at the moment. The price is testing the support area at 4,167 after correcting from its peak, potentially forming a pullback within an uptrend. A reversal on volume above the short-term EMAs would strengthen the case for continuation; a break below 3,943 could open the way for deeper tests.
⚠️ This analysis is for informational and educational purposes only and does not constitute investment advice.
#PAXGTrading #PAXGUSDT $PAXG
PAXG is trading around US$4,133, down 0.25% over the past 24 hours. On the weekly chart, the asset has been correcting after reaching an all-time high near US$5,650. It is currently below the short-term moving averages, EMA(7) at 4,215 and EMA(25) at 4,306, but remains above EMA(99) at 3,892, preserving the long-term uptrend that began near 1,906. RSI(6) is at 34.45, in oversold territory, indicating short-term selling pressure, though there is room for a rebound.
Key levels:
🟢 Main support: ~US$3,943, reinforced by EMA(99) at 3,892
🔴 Main resistance: ~US$4,436, followed by 4,691
Chart pattern: There is no clear, confirmed chart pattern at the moment. The price is testing the support area at 4,167 after correcting from its peak, potentially forming a pullback within an uptrend. A reversal on volume above the short-term EMAs would strengthen the case for continuation; a break below 3,943 could open the way for deeper tests.
⚠️ This analysis is for informational and educational purposes only and does not constitute investment advice.
#PAXGTrading #PAXGUSDT $PAXG

142

·
--
#PAXGUSDT
🚨🔥 Gold is facing a critical moment… and the 4,450 level may spark the next move! 👀
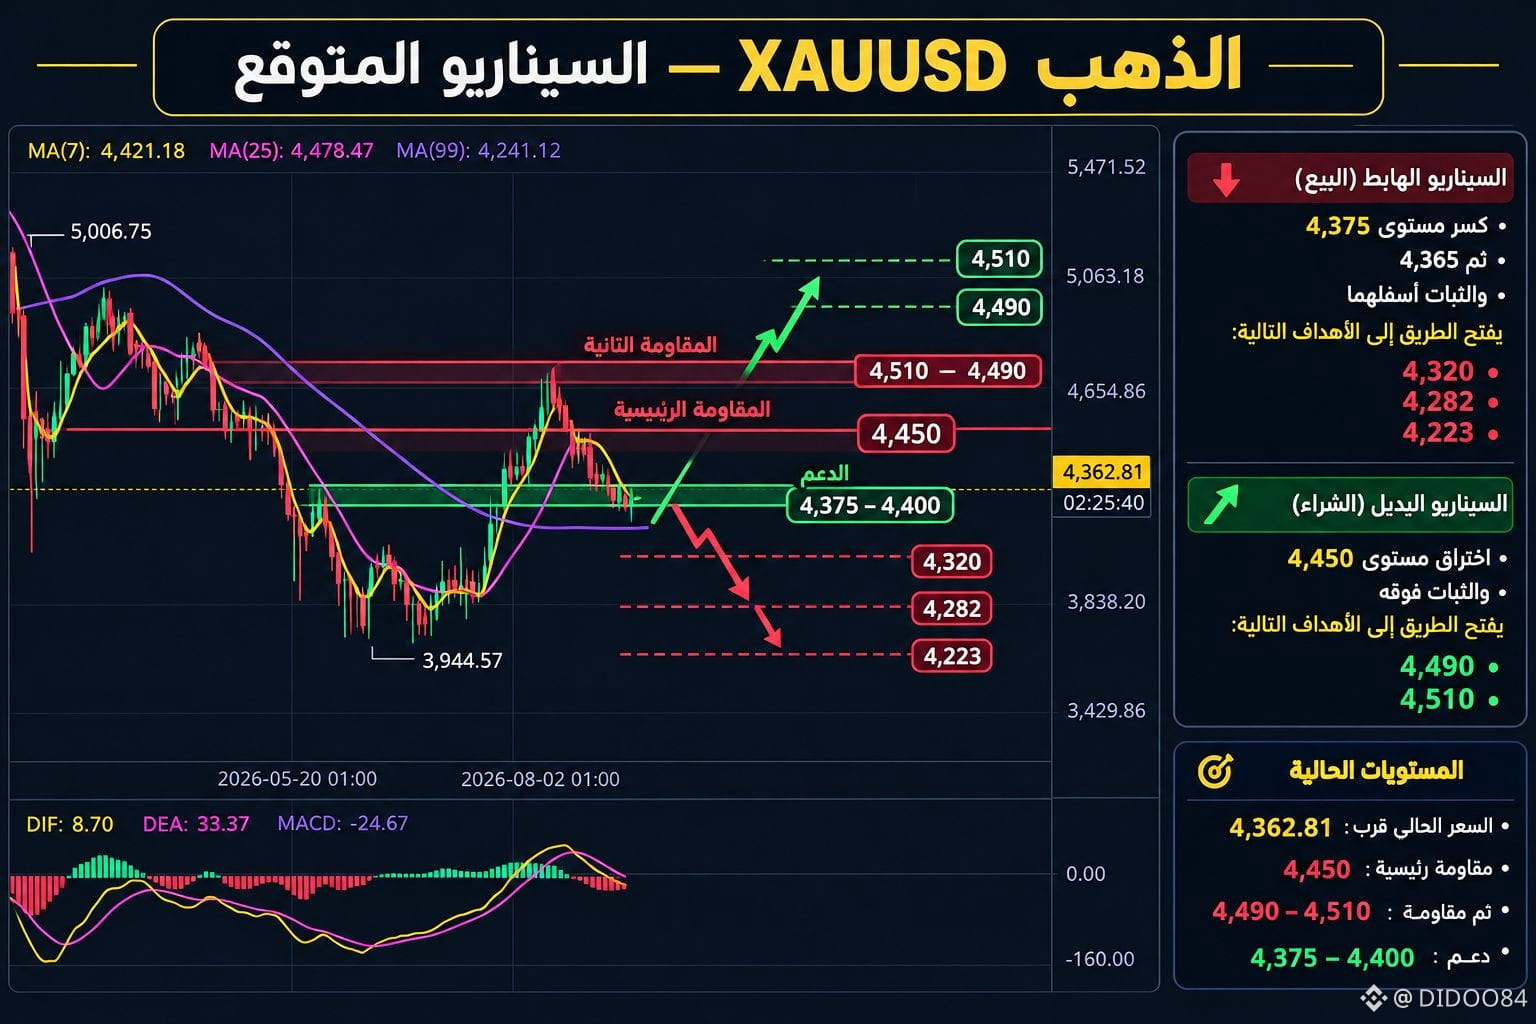
After gold failed to reclaim the 4,490–4,510 zone, sell pressure returned, pushing the price near 4,414, while the 4,375–4,400 area remains the most important line of defense for now.
🔴 The strongest scenario:
As long as gold stays below 4,450, the sell pressure remains the preferred outlook.
💥 A break of 4,375, then 4,365, along with holding below them could pave the way toward:
🎯 4,320
🎯 4,282
🎯 then 4,223
🟢 The alternative scenario:
A break above 4,450 and holding it could flip the picture in favor of buyers and open the path toward:
➡️ 4,490
➡️ 4,510
#PAXGUSDT
#PAXGTrading
#TradingCommunity
#Binance
{future}(PAXGUSDT)
#PAXGUSDT
🚨🔥 Gold is facing a critical moment… and the 4,450 level may spark the next move! 👀
After gold failed to reclaim the 4,490–4,510 zone, sell pressure returned, pushing the price near 4,414, while the 4,375–4,400 area remains the most important line of defense for now.
🔴 The strongest scenario:
As long as gold stays below 4,450, the sell pressure remains the preferred outlook.
💥 A break of 4,375, then 4,365, along with holding below them could pave the way toward:
🎯 4,320
🎯 4,282
🎯 then 4,223
🟢 The alternative scenario:
A break above 4,450 and holding it could flip the picture in favor of buyers and open the path toward:
➡️ 4,490
➡️ 4,510
#PAXGUSDT
#PAXGTrading
#TradingCommunity
#Binance
🚨🔥 Gold is facing a critical moment… and the 4,450 level may spark the next move! 👀
After gold failed to reclaim the 4,490–4,510 zone, sell pressure returned, pushing the price near 4,414, while the 4,375–4,400 area remains the most important line of defense for now.
🔴 The strongest scenario:
As long as gold stays below 4,450, the sell pressure remains the preferred outlook.
💥 A break of 4,375, then 4,365, along with holding below them could pave the way toward:
🎯 4,320
🎯 4,282
🎯 then 4,223
🟢 The alternative scenario:
A break above 4,450 and holding it could flip the picture in favor of buyers and open the path toward:
➡️ 4,490
➡️ 4,510
#PAXGUSDT
#PAXGTrading
#TradingCommunity
#Binance
1
284
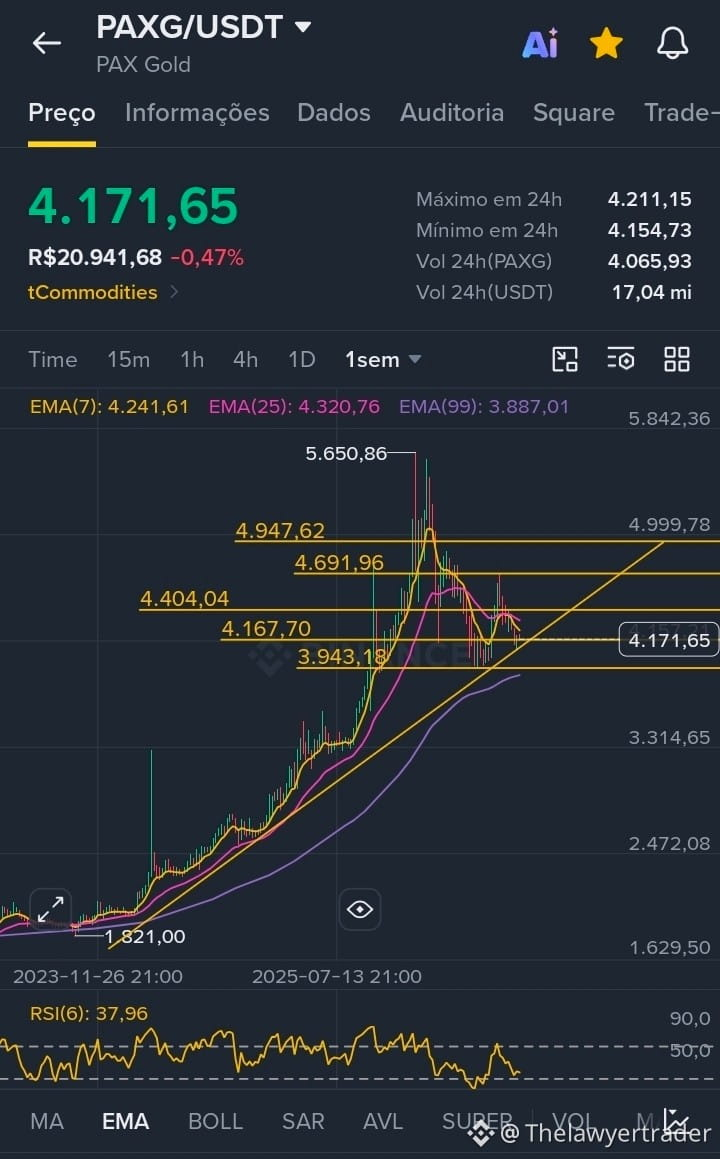
PAXG/USDT — Technical Analysis
PAX Gold is trading at 4,171.65 USDT, down slightly by 0.47% over the past 24 hours. The asset is trading below the short-term moving averages (EMA 7 and EMA 25), but remains above the EMA 99, indicating that the medium-term trend is still bullish, although there is selling pressure in the short term.
Support levels: 4,167.70 (current, historical) and 3,943.18.
Resistance levels: 4,404.04 and 4,691.96.
Chart pattern: The price is testing the historical support at 4,167.70, with the RSI(6) at 37.96 and approaching the oversold zone. This suggests that selling pressure is losing strength, but there is still no clear sign of a bullish reversal. Watch how the price reacts at this support level.
⚠️ This analysis does not constitute investment advice. It is based solely on the data shown in the chart.
#PAXGTutorialanalysis #PAXGTrading $PAXG
PAXG/USDT — Technical Analysis
PAX Gold is trading at 4,171.65 USDT, down slightly by 0.47% over the past 24 hours. The asset is trading below the short-term moving averages (EMA 7 and EMA 25), but remains above the EMA 99, indicating that the medium-term trend is still bullish, although there is selling pressure in the short term.
Support levels: 4,167.70 (current, historical) and 3,943.18.
Resistance levels: 4,404.04 and 4,691.96.
Chart pattern: The price is testing the historical support at 4,167.70, with the RSI(6) at 37.96 and approaching the oversold zone. This suggests that selling pressure is losing strength, but there is still no clear sign of a bullish reversal. Watch how the price reacts at this support level.
⚠️ This analysis does not constitute investment advice. It is based solely on the data shown in the chart.
#PAXGTutorialanalysis #PAXGTrading $PAXG
PAX Gold is trading at 4,171.65 USDT, down slightly by 0.47% over the past 24 hours. The asset is trading below the short-term moving averages (EMA 7 and EMA 25), but remains above the EMA 99, indicating that the medium-term trend is still bullish, although there is selling pressure in the short term.
Support levels: 4,167.70 (current, historical) and 3,943.18.
Resistance levels: 4,404.04 and 4,691.96.
Chart pattern: The price is testing the historical support at 4,167.70, with the RSI(6) at 37.96 and approaching the oversold zone. This suggests that selling pressure is losing strength, but there is still no clear sign of a bullish reversal. Watch how the price reacts at this support level.
⚠️ This analysis does not constitute investment advice. It is based solely on the data shown in the chart.
#PAXGTutorialanalysis #PAXGTrading $PAXG
1
312

·
--
Bullish
#PAXGUSDT #PAXGTrading #BinanceSquareFamily #GOLD Current rate. November 2026, #PAXG is estimated at approximately $3 720–$3 761 $PAXG (down 1–2% over the past 24 hours), while daily trading volume exceeds $PAXG $130 million, with a market capitalization of around $1.66 billion. Reason for the decline. No specific negative events within the project itself have been recorded—the token is following the movement of spot gold. The precious metal is falling amid a strengthening U.S. dollar and rising yields on U.S. Treasury bonds. Technical picture. The asset broke through a local upward trendline and is trading below its 7- and 30-day moving averages, indicating continued short-term selling pressure. According to analysts, the first signal of recovery will be a close above the $3 832 $PAXG
{future}(PAXGUSDT)
#PAXGUSDT #PAXGTrading #BinanceSquareFamily #GOLD Current rate. November 2026, #PAXG is estimated at approximately $3 720–$3 761 $PAXG (down 1–2% over the past 24 hours), while daily trading volume exceeds $PAXG $130 million, with a market capitalization of around $1.66 billion. Reason for the decline. No specific negative events within the project itself have been recorded—the token is following the movement of spot gold. The precious metal is falling amid a strengthening U.S. dollar and rising yields on U.S. Treasury bonds. Technical picture. The asset broke through a local upward trendline and is trading below its 7- and 30-day moving averages, indicating continued short-term selling pressure. According to analysts, the first signal of recovery will be a close above the $3 832 $PAXG


PAX Gold
From Crypto_Cion_Invest_IDX
Fully Claimed
1
46

$PAXG Gold-backed crypto, gaining demand as safe-haven asset during market uncertainty.Price closely follows gold, currently in consolidation with slight bullish bias.
#PAXG #PAXGUSDT #PAXGTrading #PAXGStrong
$PAXG
{future}(PAXGUSDT)
$PAXG Gold-backed crypto, gaining demand as safe-haven asset during market uncertainty.Price closely follows gold, currently in consolidation with slight bullish bias.
#PAXG #PAXGUSDT #PAXGTrading #PAXGStrong
$PAXG
#PAXG #PAXGUSDT #PAXGTrading #PAXGStrong
$PAXG
86

·
--
Global financial markets are falling today mainly for two reasons that go hand in hand:
Pricier oil and geopolitical conflicts: Tensions rose again after President Donald Trump rejected an Iran peace proposal. This raised alarms about a possible energy shortage in the Strait of Hormuz and pushed the price of Brent crude oil above $107.
Pressure from rising bond yields: The yield on U.S. debt continues to climb (the 30-year rate is nearing 5.5%). When this happens, borrowing becomes more expensive, fears grow that inflation will rise, and many investors prefer to pull their money out of stocks to keep it in safer options.
For these reasons, the main Wall Street indexes (the S&P 500, the Dow Jones, and the Nasdaq) opened in the red, spreading pessimism to stock exchanges around the world and to other higher-risk assets.
$NVDAB #PAXGTrading
Global financial markets are falling today mainly for two reasons that go hand in hand:
Pricier oil and geopolitical conflicts: Tensions rose again after President Donald Trump rejected an Iran peace proposal. This raised alarms about a possible energy shortage in the Strait of Hormuz and pushed the price of Brent crude oil above $107.
Pressure from rising bond yields: The yield on U.S. debt continues to climb (the 30-year rate is nearing 5.5%). When this happens, borrowing becomes more expensive, fears grow that inflation will rise, and many investors prefer to pull their money out of stocks to keep it in safer options.
For these reasons, the main Wall Street indexes (the S&P 500, the Dow Jones, and the Nasdaq) opened in the red, spreading pessimism to stock exchanges around the world and to other higher-risk assets.
$NVDAB #PAXGTrading
Pricier oil and geopolitical conflicts: Tensions rose again after President Donald Trump rejected an Iran peace proposal. This raised alarms about a possible energy shortage in the Strait of Hormuz and pushed the price of Brent crude oil above $107.
Pressure from rising bond yields: The yield on U.S. debt continues to climb (the 30-year rate is nearing 5.5%). When this happens, borrowing becomes more expensive, fears grow that inflation will rise, and many investors prefer to pull their money out of stocks to keep it in safer options.
For these reasons, the main Wall Street indexes (the S&P 500, the Dow Jones, and the Nasdaq) opened in the red, spreading pessimism to stock exchanges around the world and to other higher-risk assets.
$NVDAB #PAXGTrading
3
1
497

·
--
Bearish
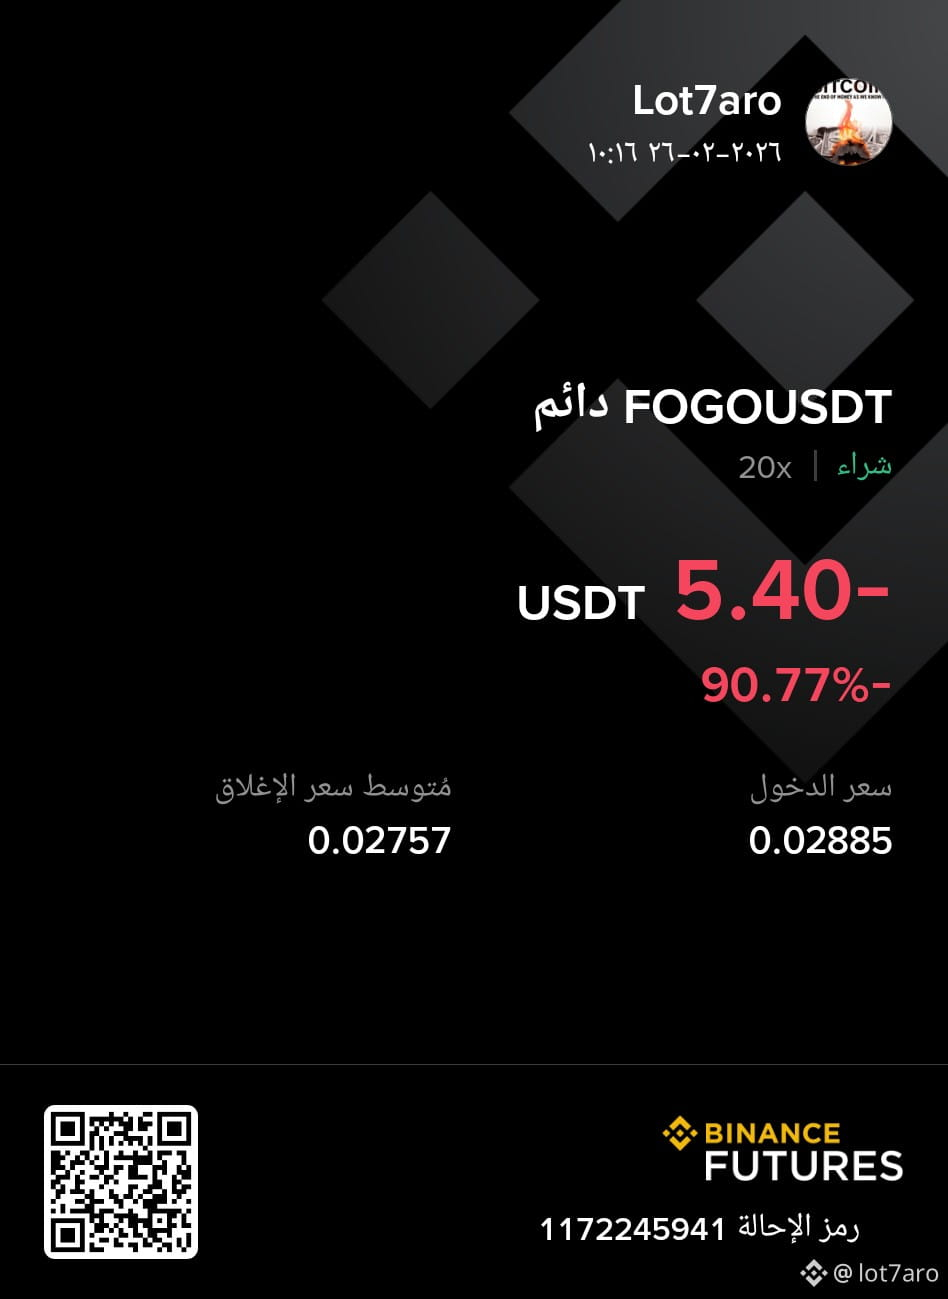
$FOGO
The market is about profit and loss
You are the primary responsible for your account and your money; no one else bears the responsibility
⚠️⚠️⚠️⚠️⚠️
👇👇👇👇👇
Keep in mind the stop-loss order
(Stop-Loss)
As much as you can bear in losses, do not take risks or defy the market
Bear your losses, and many opportunities will come; you will recover
@fogo #BitcoinGoogleSearchesSurge #英伟达财报超预期
#PAXGTrading
$FOGO
The market is about profit and loss
You are the primary responsible for your account and your money; no one else bears the responsibility
⚠️⚠️⚠️⚠️⚠️
👇👇👇👇👇
Keep in mind the stop-loss order
(Stop-Loss)
As much as you can bear in losses, do not take risks or defy the market
Bear your losses, and many opportunities will come; you will recover
@Fogo Official #BitcoinGoogleSearchesSurge #英伟达财报超预期
#PAXGTrading
The market is about profit and loss
You are the primary responsible for your account and your money; no one else bears the responsibility
⚠️⚠️⚠️⚠️⚠️
👇👇👇👇👇
Keep in mind the stop-loss order
(Stop-Loss)
As much as you can bear in losses, do not take risks or defy the market
Bear your losses, and many opportunities will come; you will recover
@Fogo Official #BitcoinGoogleSearchesSurge #英伟达财报超预期
#PAXGTrading
83
Log in to explore more content
Join global crypto users on Binance Square
⚡️ Get latest and useful information about crypto.
💬 Trusted by the world’s largest crypto exchange.
👍 Discover real insights from verified creators.
Email / Phone number
Trending Topics
1
#IsAnthropic’s$1.5TMarketCapJustified?
4,134 views
43 Discussing
2
#BTCRemainsUnderPressureAfterHawkishFOMCMinutes
178,258 views
1,886 Discussing
3
#NvidiaBoardReportedlySplitOverHuang’sReturn
85,618 views
999 Discussing
4
#StrategySTRCPreferredSlips3.65%Below$100Par
3,694 views
59 Discussing
5
#MASToUpgradeSGDTestnetToSGDigitalLedger
10,812 views
186 Discussing
6
#CanGTA6'sLaunchLiftTTWOShares?
58,766 views
740 Discussing
7
#Solana2027RoadmapTargetsDoubleComputeCapacity
2,914 views
89 Discussing
8
#InjectiveTokenizedRealEstateMortgagesTop$1.5B
819 views
27 Discussing
9
#TetherMakesStrategicInvestmentInSCRYPT
3,427 views
73 Discussing
10
#CapitalGroupAdds1264500StrategyShares
18,138 views
205 Discussing