
#okxorbit
okxorbit
1,161 views
55 Discussing
Hot
Latest

$ZEC Is Still Moving Fast… But This Is Where Discipline Matters. 👀
$ZEC just surged above $1,239, extending its impressive momentum after weeks of strong buying pressure.
The breakout above the 60 MA shows bulls are still in control, but price is also approaching an area where volatility can increase quickly.
After a rally like this, the key question isn't how high the next candle goes.
It's whether buyers can continue defending higher prices once profit-taking begins.
Watch these levels:
📈 Resistance: $1,245–1,300
🛡️ Support: $1,220–1,235
Strong trends can last longer than expected, but they can also reverse faster than most anticipate.
Focus on liquidity, volume, and market structure—not FOMO.
NFA. DYOR.
#ZEC #Zcash #Crypto #Trading #Altcoins #OKXOrbit #DailyOrbit #CreatorRewards
$ZEC Is Still Moving Fast… But This Is Where Discipline Matters. 👀
$ZEC just surged above $1,239, extending its impressive momentum after weeks of strong buying pressure.
The breakout above the 60 MA shows bulls are still in control, but price is also approaching an area where volatility can increase quickly.
After a rally like this, the key question isn't how high the next candle goes.
It's whether buyers can continue defending higher prices once profit-taking begins.
Watch these levels:
📈 Resistance: $1,245–1,300
🛡️ Support: $1,220–1,235
Strong trends can last longer than expected, but they can also reverse faster than most anticipate.
Focus on liquidity, volume, and market structure—not FOMO.
NFA. DYOR.
#ZEC #Zcash #Crypto #Trading #Altcoins #OKXOrbit #DailyOrbit #CreatorRewards
$ZEC just surged above $1,239, extending its impressive momentum after weeks of strong buying pressure.
The breakout above the 60 MA shows bulls are still in control, but price is also approaching an area where volatility can increase quickly.
After a rally like this, the key question isn't how high the next candle goes.
It's whether buyers can continue defending higher prices once profit-taking begins.
Watch these levels:
📈 Resistance: $1,245–1,300
🛡️ Support: $1,220–1,235
Strong trends can last longer than expected, but they can also reverse faster than most anticipate.
Focus on liquidity, volume, and market structure—not FOMO.
NFA. DYOR.
#ZEC #Zcash #Crypto #Trading #Altcoins #OKXOrbit #DailyOrbit #CreatorRewards
151

🚨 JUST IN 🚨
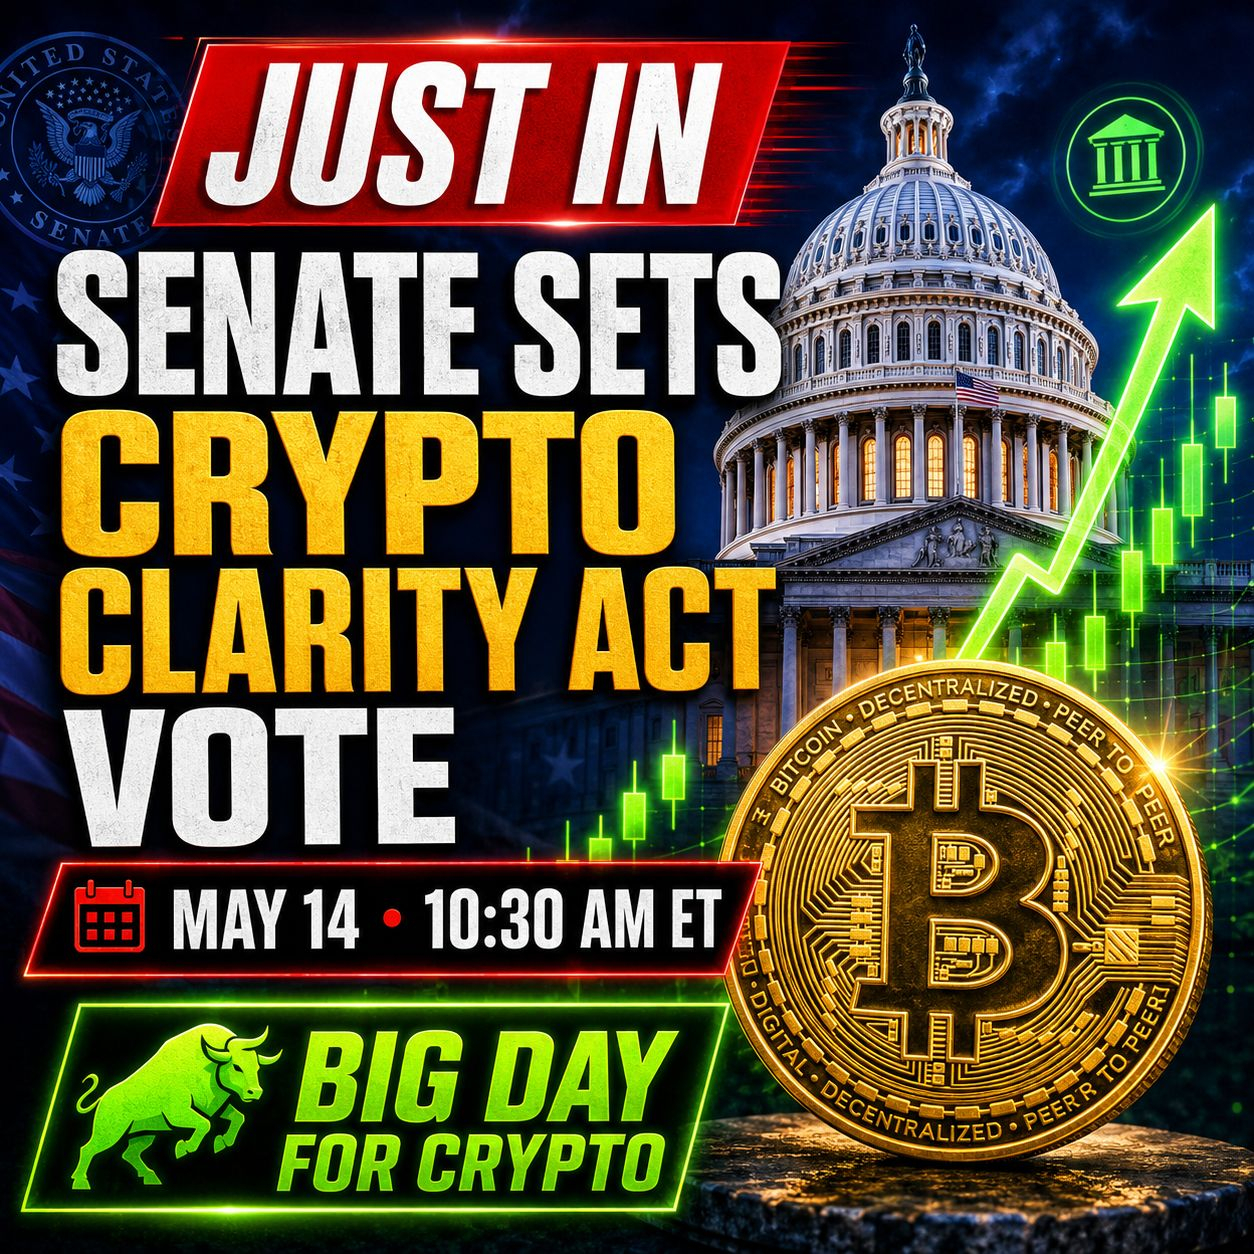
The U.S. Senate Banking Committee has officially scheduled a vote on the Crypto CLARITY Act for May 14 at 10:30 AM ET 🇺🇸
This is not a small update.
The bill could become one of the biggest steps toward clear crypto rules in the United States.
Clear rules mean more confidence.
More confidence means more institutions.
More institutions means crypto gets harder to ignore.
$BTC and the whole crypto market now have a major date to watch 👀
May 14 could be a big moment for crypto regulation.
Bullish for crypto or still too early? 🔥
#Bitcoin #BTC #Crypto #CryptoNews #CLARITYAct #OKXOrbit
$UNI $SUI
{future}(SUIUSDT)
{future}(UNIUSDT)
🚨 JUST IN 🚨
The U.S. Senate Banking Committee has officially scheduled a vote on the Crypto CLARITY Act for May 14 at 10:30 AM ET 🇺🇸
This is not a small update.
The bill could become one of the biggest steps toward clear crypto rules in the United States.
Clear rules mean more confidence.
More confidence means more institutions.
More institutions means crypto gets harder to ignore.
$BTC and the whole crypto market now have a major date to watch 👀
May 14 could be a big moment for crypto regulation.
Bullish for crypto or still too early? 🔥
#Bitcoin #BTC #Crypto #CryptoNews #CLARITYAct #OKXOrbit
$UNI $SUI
The U.S. Senate Banking Committee has officially scheduled a vote on the Crypto CLARITY Act for May 14 at 10:30 AM ET 🇺🇸
This is not a small update.
The bill could become one of the biggest steps toward clear crypto rules in the United States.
Clear rules mean more confidence.
More confidence means more institutions.
More institutions means crypto gets harder to ignore.
$BTC and the whole crypto market now have a major date to watch 👀
May 14 could be a big moment for crypto regulation.
Bullish for crypto or still too early? 🔥
#Bitcoin #BTC #Crypto #CryptoNews #CLARITYAct #OKXOrbit
$UNI $SUI
225

·
--
Fundamental research report $TSLA / Tesla (NMS electric vehicles/energy) $311.21 (24h +0.76%)Fundamental research report $TSLA / Tesla (NMS electric vehicles/energy) $311.21 (24h +0.76%)
2026-08-01 19:23 Public data snapshot
One-sentence conclusion: Tesla ($TSLA) has an overall score of 49/100, rating D—early-stage projects with insufficient validation. The business fundamentals are mainly driven by a growth narrative, and the market cap-to-revenue multiple is still within a reasonable range.
Tesla ($TSLA) is listed on NMS, in the electric vehicle/energy sector. In plain terms: electric vehicles + energy. Peer set: AMD and GOOGL. Growth in the EV business relies on ramping production capacity and delivery timing; the energy business depends on the installed capacity of energy storage. Valuation hinges on gross margin and profit per vehicle, while regulatory subsidies and carbon credits affect near-term earnings. It does not involve token economics or on-chain settlement logic. The protocol layer has been formally live, and active addresses can be tracked, but evidence of paid usage still needs to be completed. Latest version: not found. Effective submissions in the past 90 days: not found.
Fundamental research report $TSLA / Tesla (NMS electric vehicles/energy) $311.21 (24h +0.76%)
Fundamental research report $TSLA / Tesla (NMS electric vehicles/energy) $311.21 (24h +0.76%)
2026-08-01 19:23 Public data snapshot
One-sentence conclusion: Tesla ($TSLA ) has an overall score of 49/100, rating D—early-stage projects with insufficient validation. The business fundamentals are mainly driven by a growth narrative, and the market cap-to-revenue multiple is still within a reasonable range.
Tesla ($TSLA ) is listed on NMS, in the electric vehicle/energy sector. In plain terms: electric vehicles + energy. Peer set: AMD and GOOGL. Growth in the EV business relies on ramping production capacity and delivery timing; the energy business depends on the installed capacity of energy storage. Valuation hinges on gross margin and profit per vehicle, while regulatory subsidies and carbon credits affect near-term earnings. It does not involve token economics or on-chain settlement logic. The protocol layer has been formally live, and active addresses can be tracked, but evidence of paid usage still needs to be completed. Latest version: not found. Effective submissions in the past 90 days: not found.
2026-08-01 19:23 Public data snapshot
One-sentence conclusion: Tesla ($TSLA ) has an overall score of 49/100, rating D—early-stage projects with insufficient validation. The business fundamentals are mainly driven by a growth narrative, and the market cap-to-revenue multiple is still within a reasonable range.
Tesla ($TSLA ) is listed on NMS, in the electric vehicle/energy sector. In plain terms: electric vehicles + energy. Peer set: AMD and GOOGL. Growth in the EV business relies on ramping production capacity and delivery timing; the energy business depends on the installed capacity of energy storage. Valuation hinges on gross margin and profit per vehicle, while regulatory subsidies and carbon credits affect near-term earnings. It does not involve token economics or on-chain settlement logic. The protocol layer has been formally live, and active addresses can be tracked, but evidence of paid usage still needs to be completed. Latest version: not found. Effective submissions in the past 90 days: not found.
15
·
--
Fundamental analysis report $HOOD / Robinhood (NMS exchange/brokerage) $86.56 (24h -0.05%)Fundamental analysis report $HOOD / Robinhood (NMS exchange/brokerage) $86.56 (24h -0.05%)
2026-08-01 19:43 Public data snapshot
One-sentence takeaway: Robinhood ($HOOD) has a composite score of 43/100 and a D rating, as an early-stage project with insufficient validation. The business fundamentals are mainly driven by a growth narrative, and the market value-to-revenue multiple is still within a reasonable range.
Robinhood ($HOOD) is listed on the NMS, in the exchange/brokerage track. Plainly speaking: brokerage + crypto. It competes with COIN and MSFT. Exchange revenue comes from trading fees, margin/financing and securities lending interest, and custody fees. Revenue elasticity depends on user asset size and trading frequency, while regulatory licenses determine the business boundaries. It does not involve tokenomics or on-chain settlement logic. The protocol layer has been officially live; active addresses can be tracked, but evidence for paid usage still needs to be completed. The latest version was not found, and the effective submissions within the last 90 days were not found either.
Fundamental analysis report $HOOD / Robinhood (NMS exchange/brokerage) $86.56 (24h -0.05%)
Fundamental analysis report $HOOD / Robinhood (NMS exchange/brokerage) $86.56 (24h -0.05%)
2026-08-01 19:43 Public data snapshot
One-sentence takeaway: Robinhood ($HOOD ) has a composite score of 43/100 and a D rating, as an early-stage project with insufficient validation. The business fundamentals are mainly driven by a growth narrative, and the market value-to-revenue multiple is still within a reasonable range.
Robinhood ($HOOD ) is listed on the NMS, in the exchange/brokerage track. Plainly speaking: brokerage + crypto. It competes with COIN and MSFT. Exchange revenue comes from trading fees, margin/financing and securities lending interest, and custody fees. Revenue elasticity depends on user asset size and trading frequency, while regulatory licenses determine the business boundaries. It does not involve tokenomics or on-chain settlement logic. The protocol layer has been officially live; active addresses can be tracked, but evidence for paid usage still needs to be completed. The latest version was not found, and the effective submissions within the last 90 days were not found either.
2026-08-01 19:43 Public data snapshot
One-sentence takeaway: Robinhood ($HOOD ) has a composite score of 43/100 and a D rating, as an early-stage project with insufficient validation. The business fundamentals are mainly driven by a growth narrative, and the market value-to-revenue multiple is still within a reasonable range.
Robinhood ($HOOD ) is listed on the NMS, in the exchange/brokerage track. Plainly speaking: brokerage + crypto. It competes with COIN and MSFT. Exchange revenue comes from trading fees, margin/financing and securities lending interest, and custody fees. Revenue elasticity depends on user asset size and trading frequency, while regulatory licenses determine the business boundaries. It does not involve tokenomics or on-chain settlement logic. The protocol layer has been officially live; active addresses can be tracked, but evidence for paid usage still needs to be completed. The latest version was not found, and the effective submissions within the last 90 days were not found either.
7
·
--
Fundamentals Research Report $SMCI / Super Micro (NMS Server Hardware) $28.40 (24h +2.42%)Fundamentals research report $SMCI / Super Micro (NMS server hardware) $28.40 (24h +2.42%)
2026-08-01 20:23 Public data snapshot
One-sentence conclusion: Super Micro ($SMCI) has an overall score of 45/100, rated D for early-stage projects with insufficient validation. The business fundamentals are mainly driven by a growth narrative, and the market cap-to-revenue multiple remains within a reasonable range.
Super Micro ($SMCI) is listed on the NMS, in the server hardware space. Plainly speaking: server hardware. Comparable peers include NVDA and AMD. AI compute demand comes from large-model training and inference, with hyperscalers’ capital expenditure being the core driver. The price of a single AI server is $200,000–$500,000, with gross margins of 10–15 percentage points; scale effects determine profitability. It does not involve token economics or on-chain settlement logic. The protocol layer has been officially live, and active addresses can be tracked, but evidence of paid usage still needs to be completed. The latest version was not found, and submissions effective within the past 90 days were not found either.
Fundamentals Research Report $SMCI / Super Micro (NMS Server Hardware) $28.40 (24h +2.42%)
Fundamentals research report $SMCI / Super Micro (NMS server hardware) $28.40 (24h +2.42%)
2026-08-01 20:23 Public data snapshot
One-sentence conclusion: Super Micro ($SMCI ) has an overall score of 45/100, rated D for early-stage projects with insufficient validation. The business fundamentals are mainly driven by a growth narrative, and the market cap-to-revenue multiple remains within a reasonable range.
Super Micro ($SMCI ) is listed on the NMS, in the server hardware space. Plainly speaking: server hardware. Comparable peers include NVDA and AMD. AI compute demand comes from large-model training and inference, with hyperscalers’ capital expenditure being the core driver. The price of a single AI server is $200,000–$500,000, with gross margins of 10–15 percentage points; scale effects determine profitability. It does not involve token economics or on-chain settlement logic. The protocol layer has been officially live, and active addresses can be tracked, but evidence of paid usage still needs to be completed. The latest version was not found, and submissions effective within the past 90 days were not found either.
2026-08-01 20:23 Public data snapshot
One-sentence conclusion: Super Micro ($SMCI ) has an overall score of 45/100, rated D for early-stage projects with insufficient validation. The business fundamentals are mainly driven by a growth narrative, and the market cap-to-revenue multiple remains within a reasonable range.
Super Micro ($SMCI ) is listed on the NMS, in the server hardware space. Plainly speaking: server hardware. Comparable peers include NVDA and AMD. AI compute demand comes from large-model training and inference, with hyperscalers’ capital expenditure being the core driver. The price of a single AI server is $200,000–$500,000, with gross margins of 10–15 percentage points; scale effects determine profitability. It does not involve token economics or on-chain settlement logic. The protocol layer has been officially live, and active addresses can be tracked, but evidence of paid usage still needs to be completed. The latest version was not found, and submissions effective within the past 90 days were not found either.
27
·
--
Fundamentals research report $RIOT / Riot Platforms(NCM mining company)$20.17 (24h -8.82%)Fundamentals research report $RIOT / Riot Platforms(NCM mining company)$20.17 (24h -8.82%)
2026-08-01 20:03 public data snapshot
One-sentence conclusion: Riot Platforms ($RIOT) has an overall score of 45/100, rated D—an early-stage project with insufficient validation. The fundamental business outlook is mainly driven by a growth narrative, and the market cap/revenue multiple is still within a reasonable range.
Riot Platforms ($RIOT) is listed on the NCM, a mining-company track. Plainly put: BTC miners. Peers include MARA and MSTR. Miner revenue mainly comes from mining rewards and transaction fees, with the BTC halving cycle and coin price determining the timing of capacity expansion. Electricity costs and ASIC efficiency are the core competitive advantages; the hashing power determines market share. It does not involve token economics or on-chain settlement logic. The protocol layer has been officially live, and active addresses can be tracked, but evidence of paid usage is still to be completed. Latest version: not found. Submissions effective within the last 90 days: not found.
Fundamentals research report $RIOT / Riot Platforms(NCM mining company)$20.17 (24h -8.82%)
Fundamentals research report $RIOT / Riot Platforms(NCM mining company)$20.17 (24h -8.82%)
2026-08-01 20:03 public data snapshot
One-sentence conclusion: Riot Platforms ($RIOT) has an overall score of 45/100, rated D—an early-stage project with insufficient validation. The fundamental business outlook is mainly driven by a growth narrative, and the market cap/revenue multiple is still within a reasonable range.
Riot Platforms ($RIOT) is listed on the NCM, a mining-company track. Plainly put: BTC miners. Peers include MARA and MSTR. Miner revenue mainly comes from mining rewards and transaction fees, with the BTC halving cycle and coin price determining the timing of capacity expansion. Electricity costs and ASIC efficiency are the core competitive advantages; the hashing power determines market share. It does not involve token economics or on-chain settlement logic. The protocol layer has been officially live, and active addresses can be tracked, but evidence of paid usage is still to be completed. Latest version: not found. Submissions effective within the last 90 days: not found.
2026-08-01 20:03 public data snapshot
One-sentence conclusion: Riot Platforms ($RIOT) has an overall score of 45/100, rated D—an early-stage project with insufficient validation. The fundamental business outlook is mainly driven by a growth narrative, and the market cap/revenue multiple is still within a reasonable range.
Riot Platforms ($RIOT) is listed on the NCM, a mining-company track. Plainly put: BTC miners. Peers include MARA and MSTR. Miner revenue mainly comes from mining rewards and transaction fees, with the BTC halving cycle and coin price determining the timing of capacity expansion. Electricity costs and ASIC efficiency are the core competitive advantages; the hashing power determines market share. It does not involve token economics or on-chain settlement logic. The protocol layer has been officially live, and active addresses can be tracked, but evidence of paid usage is still to be completed. Latest version: not found. Submissions effective within the last 90 days: not found.
2
·
--
Fundamental analysis report $ETH / Ethereum (multi-exchange public chain/L1/L2) $1.87K (24h -1.10%)Fundamental analysis report $ETH / Ethereum (multi-exchange public chain/L1/L2) $1.87K (24h -1.10%)
2026-08-01 18:58 public data snapshot
One-sentence conclusion: Ethereum (token $ETH) has an overall score of 80/100 and receives a rating of A, with strong fundamentals. Breaking it down into three layers: the company team has cash reserves, the protocol network already shows paid usage, but the token value transmission still needs to be observed.
Ethereum (token $ETH), the public chain/L1/L2 track. It focuses on a smart-contract public blockchain. Competes with SOL and BNB. In traditional enterprise collaboration, work relies on cloud servers and contract reconciliation; under high concurrency, Gas can spike, TPS is limited, and cross-chain bridge security incidents happen frequently. Public chains use a unified state machine for trustless settlement, reducing reconciliation costs. Average deal size is $50–$500 per month, paid in USDC or fiat. This is a narrative-driven track, where usage can drop 60–80 percentage points in a bear market. Positioned as a specialized single-point tool. The protocol layer is already officially live; on-chain dashboards show protocol fees accumulating, with existing paid-usage signals. Latest version is v1.17.5; within the past 90 days, there have been 100 effective submissions.
Fundamental analysis report $ETH / Ethereum (multi-exchange public chain/L1/L2) $1.87K (24h -1.10%)
Fundamental analysis report $ETH / Ethereum (multi-exchange public chain/L1/L2) $1.87K (24h -1.10%)
2026-08-01 18:58 public data snapshot
One-sentence conclusion: Ethereum (token $ETH ) has an overall score of 80/100 and receives a rating of A, with strong fundamentals. Breaking it down into three layers: the company team has cash reserves, the protocol network already shows paid usage, but the token value transmission still needs to be observed.
Ethereum (token $ETH ), the public chain/L1/L2 track. It focuses on a smart-contract public blockchain. Competes with SOL and BNB. In traditional enterprise collaboration, work relies on cloud servers and contract reconciliation; under high concurrency, Gas can spike, TPS is limited, and cross-chain bridge security incidents happen frequently. Public chains use a unified state machine for trustless settlement, reducing reconciliation costs. Average deal size is $50–$500 per month, paid in USDC or fiat. This is a narrative-driven track, where usage can drop 60–80 percentage points in a bear market. Positioned as a specialized single-point tool. The protocol layer is already officially live; on-chain dashboards show protocol fees accumulating, with existing paid-usage signals. Latest version is v1.17.5; within the past 90 days, there have been 100 effective submissions.
2026-08-01 18:58 public data snapshot
One-sentence conclusion: Ethereum (token $ETH ) has an overall score of 80/100 and receives a rating of A, with strong fundamentals. Breaking it down into three layers: the company team has cash reserves, the protocol network already shows paid usage, but the token value transmission still needs to be observed.
Ethereum (token $ETH ), the public chain/L1/L2 track. It focuses on a smart-contract public blockchain. Competes with SOL and BNB. In traditional enterprise collaboration, work relies on cloud servers and contract reconciliation; under high concurrency, Gas can spike, TPS is limited, and cross-chain bridge security incidents happen frequently. Public chains use a unified state machine for trustless settlement, reducing reconciliation costs. Average deal size is $50–$500 per month, paid in USDC or fiat. This is a narrative-driven track, where usage can drop 60–80 percentage points in a bear market. Positioned as a specialized single-point tool. The protocol layer is already officially live; on-chain dashboards show protocol fees accumulating, with existing paid-usage signals. Latest version is v1.17.5; within the past 90 days, there have been 100 effective submissions.
49
·
--
Fundamentals research report $PLTR / Palantir (NMS AI/semiconductor) $123.06 (24h +0.65%)Fundamentals research report $PLTR / Palantir (NMS AI/semiconductor) $123.06 (24h +0.65%)
2026-08-01 20:13 Public data snapshot
One-sentence conclusion: Palantir ($PLTR) has an overall score of 47/100, rated D—early-stage projects with insufficient validation. The business fundamentals are mainly driven by a growth narrative, and the market cap to revenue multiple is still within a reasonable range.
Palantir ($PLTR) has been listed on NMS in the AI/semiconductor space. In plain terms: data analytics AI. Comparables include MSFT and GOOGL. AI compute demand is driven by large-model training and inference, with hyperscaler capital expenditures as the core impetus. The price of a single AI server is $200,000–$500,000, gross margin is 10–15 percentage points, and economies of scale determine profitability. It does not involve token economics or on-chain settlement logic. The protocol layer is officially live; active addresses can be tracked, but evidence of paid usage is still pending. The latest version has not been found; within the last 90 days, there are no effective submissions found.
Fundamentals research report $PLTR / Palantir (NMS AI/semiconductor) $123.06 (24h +0.65%)
Fundamentals research report $PLTR / Palantir (NMS AI/semiconductor) $123.06 (24h +0.65%)
2026-08-01 20:13 Public data snapshot
One-sentence conclusion: Palantir ($PLTR ) has an overall score of 47/100, rated D—early-stage projects with insufficient validation. The business fundamentals are mainly driven by a growth narrative, and the market cap to revenue multiple is still within a reasonable range.
Palantir ($PLTR ) has been listed on NMS in the AI/semiconductor space. In plain terms: data analytics AI. Comparables include MSFT and GOOGL. AI compute demand is driven by large-model training and inference, with hyperscaler capital expenditures as the core impetus. The price of a single AI server is $200,000–$500,000, gross margin is 10–15 percentage points, and economies of scale determine profitability. It does not involve token economics or on-chain settlement logic. The protocol layer is officially live; active addresses can be tracked, but evidence of paid usage is still pending. The latest version has not been found; within the last 90 days, there are no effective submissions found.
2026-08-01 20:13 Public data snapshot
One-sentence conclusion: Palantir ($PLTR ) has an overall score of 47/100, rated D—early-stage projects with insufficient validation. The business fundamentals are mainly driven by a growth narrative, and the market cap to revenue multiple is still within a reasonable range.
Palantir ($PLTR ) has been listed on NMS in the AI/semiconductor space. In plain terms: data analytics AI. Comparables include MSFT and GOOGL. AI compute demand is driven by large-model training and inference, with hyperscaler capital expenditures as the core impetus. The price of a single AI server is $200,000–$500,000, gross margin is 10–15 percentage points, and economies of scale determine profitability. It does not involve token economics or on-chain settlement logic. The protocol layer is officially live; active addresses can be tracked, but evidence of paid usage is still pending. The latest version has not been found; within the last 90 days, there are no effective submissions found.
9
·
--
Fundamental research report $GRASS / Grass (multi-exchange other) $0.00 (24h +0.00%)Fundamental research report $GRASS / Grass (multi-exchange other) $0.00 (24h +0.00%)
2026-08-01 20:28 Public data snapshot
One-sentence conclusion: Grass (token $GRASS) has a comprehensive score of 18/100, rated E. It relies mainly on narrative. When breaking it down into three layers: the company team’s resources are relatively tight, the protocol network’s use of evidence is weak, and the token value transmission still needs to be observed.
Grass (token $GRASS), other tracks. Focuses on bandwidth sharing. Competes with AKT and RNDR. Traditional centralized platforms take a 15–40% commission; users’ data is not under their own control. On-chain enables more trust-based transactions with lower transaction fees. Token incentives convert early users into contributors. Average monthly revenue per order is $50–$500; settlement requires USDC or fiat. This is a narrative-driven track—during bear markets, usage drops by 60–80%. Positioned as a niche single-point tool. The protocol layer is officially live; active addresses can be measured, but evidence of paid usage still needs to be completed. The latest version was not found; submissions within the past 90 days were not found either.
Fundamental research report $GRASS / Grass (multi-exchange other) $0.00 (24h +0.00%)
Fundamental research report $GRASS / Grass (multi-exchange other) $0.00 (24h +0.00%)
2026-08-01 20:28 Public data snapshot
One-sentence conclusion: Grass (token $GRASS ) has a comprehensive score of 18/100, rated E. It relies mainly on narrative. When breaking it down into three layers: the company team’s resources are relatively tight, the protocol network’s use of evidence is weak, and the token value transmission still needs to be observed.
Grass (token $GRASS ), other tracks. Focuses on bandwidth sharing. Competes with AKT and RNDR. Traditional centralized platforms take a 15–40% commission; users’ data is not under their own control. On-chain enables more trust-based transactions with lower transaction fees. Token incentives convert early users into contributors. Average monthly revenue per order is $50–$500; settlement requires USDC or fiat. This is a narrative-driven track—during bear markets, usage drops by 60–80%. Positioned as a niche single-point tool. The protocol layer is officially live; active addresses can be measured, but evidence of paid usage still needs to be completed. The latest version was not found; submissions within the past 90 days were not found either.
2026-08-01 20:28 Public data snapshot
One-sentence conclusion: Grass (token $GRASS ) has a comprehensive score of 18/100, rated E. It relies mainly on narrative. When breaking it down into three layers: the company team’s resources are relatively tight, the protocol network’s use of evidence is weak, and the token value transmission still needs to be observed.
Grass (token $GRASS ), other tracks. Focuses on bandwidth sharing. Competes with AKT and RNDR. Traditional centralized platforms take a 15–40% commission; users’ data is not under their own control. On-chain enables more trust-based transactions with lower transaction fees. Token incentives convert early users into contributors. Average monthly revenue per order is $50–$500; settlement requires USDC or fiat. This is a narrative-driven track—during bear markets, usage drops by 60–80%. Positioned as a niche single-point tool. The protocol layer is officially live; active addresses can be measured, but evidence of paid usage still needs to be completed. The latest version was not found; submissions within the past 90 days were not found either.
79
·
--
Verified
Fundamental analysis report $NOT / Notcoin (multi-exchange, others) $0.00 (24h +1.10%)Fundamental analysis report $NOT / Notcoin (multi-exchange, others) $0.00 (24h +1.10%)
2026-08-01 20:48 public data snapshot
One-sentence conclusion: Notcoin (token $NOT) has a composite score of 25/100, rated E, and relies mainly on narrative. Breaking it down in three layers: the company team and resources are relatively tight, the protocol network’s use of evidence is weak, and the value transmission of the token still needs to be observed.
Notcoin (token $NOT), another segment. It focuses on the Telegram ecosystem and is benchmarked against TON and DOGS. Traditional centralized platforms take 15–40 percentage points in commissions, and user data is not fully user-controlled. On-chain, trust-based transactions have lower fees, and token incentives convert early users into contributors. Average transaction value is 50–500 USD/month, requiring USDC or fiat settlement. This is a narrative-driven segment; during bear markets, usage drops by 60–80 percentage points. Positioning is a niche single-point tool. The protocol layer is already officially live; active addresses can be tracked, but evidence for paid usage still needs to be completed. Latest version: not found. Effective submissions in the past 90 days: not found.
Fundamental analysis report $NOT / Notcoin (multi-exchange, others) $0.00 (24h +1.10%)
Fundamental analysis report $NOT / Notcoin (multi-exchange, others) $0.00 (24h +1.10%)
2026-08-01 20:48 public data snapshot
One-sentence conclusion: Notcoin (token $NOT ) has a composite score of 25/100, rated E, and relies mainly on narrative. Breaking it down in three layers: the company team and resources are relatively tight, the protocol network’s use of evidence is weak, and the value transmission of the token still needs to be observed.
Notcoin (token $NOT ), another segment. It focuses on the Telegram ecosystem and is benchmarked against TON and DOGS. Traditional centralized platforms take 15–40 percentage points in commissions, and user data is not fully user-controlled. On-chain, trust-based transactions have lower fees, and token incentives convert early users into contributors. Average transaction value is 50–500 USD/month, requiring USDC or fiat settlement. This is a narrative-driven segment; during bear markets, usage drops by 60–80 percentage points. Positioning is a niche single-point tool. The protocol layer is already officially live; active addresses can be tracked, but evidence for paid usage still needs to be completed. Latest version: not found. Effective submissions in the past 90 days: not found.
2026-08-01 20:48 public data snapshot
One-sentence conclusion: Notcoin (token $NOT ) has a composite score of 25/100, rated E, and relies mainly on narrative. Breaking it down in three layers: the company team and resources are relatively tight, the protocol network’s use of evidence is weak, and the value transmission of the token still needs to be observed.
Notcoin (token $NOT ), another segment. It focuses on the Telegram ecosystem and is benchmarked against TON and DOGS. Traditional centralized platforms take 15–40 percentage points in commissions, and user data is not fully user-controlled. On-chain, trust-based transactions have lower fees, and token incentives convert early users into contributors. Average transaction value is 50–500 USD/month, requiring USDC or fiat settlement. This is a narrative-driven segment; during bear markets, usage drops by 60–80 percentage points. Positioning is a niche single-point tool. The protocol layer is already officially live; active addresses can be tracked, but evidence for paid usage still needs to be completed. Latest version: not found. Effective submissions in the past 90 days: not found.
141
·
--
Fundamental analysis report $STX / Stacks (multi-exchange public chain/L1/L2) $0.14 (24h -2.31%)Fundamental analysis report $STX / Stacks (multi-exchange public chain/L1/L2) $0.14 (24h -2.31%)
2026-08-01 21:33 public data snapshot
One-sentence conclusion: Stacks (token $STX) has an overall score of 45/100 and a rating of D—an early-stage project with insufficient validation. Break it down into layers: the company team has cash reserves; the protocol network already shows paid usage traces; however, token value transmission still needs to be observed.
Stacks (token $STX), the public chain/L1/L2 track. It focuses on BTC L2 and targets BTC and RSK. Traditional enterprise collaboration relies on cloud servers and contract reconciliation—when concurrency is high, Gas spikes and TPS is limited, and cross-chain bridge security incidents happen frequently. Public chains use a unified state machine for trustless settlement, reducing reconciliation costs. Average deal size is $50–$500 per month, requiring USDC or fiat settlement. This is a narrative-driven track; in a bear market, usage drops by 60–80 percentage points. Positioned as a niche single-point tool. The protocol layer is already officially live: the on-chain dashboard shows protocol fees are accumulating, and there are already traces of paid usage. The latest version was not found; submissions effective within the past 90 days were not found either.
Fundamental analysis report $STX / Stacks (multi-exchange public chain/L1/L2) $0.14 (24h -2.31%)
Fundamental analysis report $STX / Stacks (multi-exchange public chain/L1/L2) $0.14 (24h -2.31%)
2026-08-01 21:33 public data snapshot
One-sentence conclusion: Stacks (token $STX ) has an overall score of 45/100 and a rating of D—an early-stage project with insufficient validation. Break it down into layers: the company team has cash reserves; the protocol network already shows paid usage traces; however, token value transmission still needs to be observed.
Stacks (token $STX ), the public chain/L1/L2 track. It focuses on BTC L2 and targets BTC and RSK. Traditional enterprise collaboration relies on cloud servers and contract reconciliation—when concurrency is high, Gas spikes and TPS is limited, and cross-chain bridge security incidents happen frequently. Public chains use a unified state machine for trustless settlement, reducing reconciliation costs. Average deal size is $50–$500 per month, requiring USDC or fiat settlement. This is a narrative-driven track; in a bear market, usage drops by 60–80 percentage points. Positioned as a niche single-point tool. The protocol layer is already officially live: the on-chain dashboard shows protocol fees are accumulating, and there are already traces of paid usage. The latest version was not found; submissions effective within the past 90 days were not found either.
2026-08-01 21:33 public data snapshot
One-sentence conclusion: Stacks (token $STX ) has an overall score of 45/100 and a rating of D—an early-stage project with insufficient validation. Break it down into layers: the company team has cash reserves; the protocol network already shows paid usage traces; however, token value transmission still needs to be observed.
Stacks (token $STX ), the public chain/L1/L2 track. It focuses on BTC L2 and targets BTC and RSK. Traditional enterprise collaboration relies on cloud servers and contract reconciliation—when concurrency is high, Gas spikes and TPS is limited, and cross-chain bridge security incidents happen frequently. Public chains use a unified state machine for trustless settlement, reducing reconciliation costs. Average deal size is $50–$500 per month, requiring USDC or fiat settlement. This is a narrative-driven track; in a bear market, usage drops by 60–80 percentage points. Positioned as a niche single-point tool. The protocol layer is already officially live: the on-chain dashboard shows protocol fees are accumulating, and there are already traces of paid usage. The latest version was not found; submissions effective within the past 90 days were not found either.
92
·
--
Fundamental analysis report $SUI / Sui (multi-exchange public chain/L1/L2) $0.68 (24h -0.68%)Fundamental analysis report $SUI / Sui (multi-exchange public chain/L1/L2) $0.68 (24h -0.68%)
2026-08-01 21:28 Public data snapshot
One-sentence conclusion: Sui (token $SUI) has an overall score of 62/100 and is rated C—storytelling outweighs execution. When broken down into layers, the company team has cash reserves, the protocol network already shows paid usage, but the value transmission of the token still needs to be observed.
Sui (token $SUI), a public chain/L1/L2 track. It is mainly a Move-based blockchain. It competes with SEI and SOL. Traditional enterprise collaboration relies on cloud servers and contract reconciliation; under high concurrency, Gas spikes, TPS is limited, and cross-chain bridge security incidents happen frequently. Public chains use a unified state machine for trustless settlement, reducing reconciliation costs. Average deal size is $50–$500 per month, requiring USDC or fiat settlement. This is a narrative-driven segment; in a bear market, usage drops by 60–80 percentage points. It is positioned as a specialized single-point tool. The protocol layer is already officially live—on-chain dashboards show protocol fees are accumulating, and there are already traces of paid usage. Latest mainnet version is v1.76.1, with 100 valid submissions over the past 90 days.
Fundamental analysis report $SUI / Sui (multi-exchange public chain/L1/L2) $0.68 (24h -0.68%)
Fundamental analysis report $SUI / Sui (multi-exchange public chain/L1/L2) $0.68 (24h -0.68%)
2026-08-01 21:28 Public data snapshot
One-sentence conclusion: Sui (token $SUI ) has an overall score of 62/100 and is rated C—storytelling outweighs execution. When broken down into layers, the company team has cash reserves, the protocol network already shows paid usage, but the value transmission of the token still needs to be observed.
Sui (token $SUI ), a public chain/L1/L2 track. It is mainly a Move-based blockchain. It competes with SEI and SOL. Traditional enterprise collaboration relies on cloud servers and contract reconciliation; under high concurrency, Gas spikes, TPS is limited, and cross-chain bridge security incidents happen frequently. Public chains use a unified state machine for trustless settlement, reducing reconciliation costs. Average deal size is $50–$500 per month, requiring USDC or fiat settlement. This is a narrative-driven segment; in a bear market, usage drops by 60–80 percentage points. It is positioned as a specialized single-point tool. The protocol layer is already officially live—on-chain dashboards show protocol fees are accumulating, and there are already traces of paid usage. Latest mainnet version is v1.76.1, with 100 valid submissions over the past 90 days.
2026-08-01 21:28 Public data snapshot
One-sentence conclusion: Sui (token $SUI ) has an overall score of 62/100 and is rated C—storytelling outweighs execution. When broken down into layers, the company team has cash reserves, the protocol network already shows paid usage, but the value transmission of the token still needs to be observed.
Sui (token $SUI ), a public chain/L1/L2 track. It is mainly a Move-based blockchain. It competes with SEI and SOL. Traditional enterprise collaboration relies on cloud servers and contract reconciliation; under high concurrency, Gas spikes, TPS is limited, and cross-chain bridge security incidents happen frequently. Public chains use a unified state machine for trustless settlement, reducing reconciliation costs. Average deal size is $50–$500 per month, requiring USDC or fiat settlement. This is a narrative-driven segment; in a bear market, usage drops by 60–80 percentage points. It is positioned as a specialized single-point tool. The protocol layer is already officially live—on-chain dashboards show protocol fees are accumulating, and there are already traces of paid usage. Latest mainnet version is v1.76.1, with 100 valid submissions over the past 90 days.
137
·
--
Partly True
Fundamentals research report $CFG / Centrifuge (multi-exchange RWA/PayFi) $0.18 (24h +1.30%)Fundamentals research report $CFG / Centrifuge (multi-exchange RWA/PayFi) $0.18 (24h +1.30%)
2026-08-01 20:18 public data snapshot
One-sentence conclusion: Centrifuge (token $CFG) has an overall score of 24/100 and an E rating; it mainly relies on narrative. Breaking it down across three layers: the company team and resources are tight, the protocol network uses evidence that is relatively weak, and how token value transmits still needs to be observed.
Centrifuge (token $CFG), the RWA/PayFi sector. It focuses on RWA. Competitors/comparables include HUMA and RIO. For traditional small and mid-sized enterprises, receivables financing is typically done via bank factoring, with approval taking 30–90 days and interest rates of 12–24 points; funding arrives slowly. On-chain asset ownership is transparently verified, and liquidity provider (LP) pools enable second-level lending; RWA assets can be traded again to improve liquidity. Average deal size is $50–$500 per month, with settlement in USDC or fiat. It’s a narrative-driven track: in a bear market, usage drops by 60–80 percentage points. Positioned as a niche single-point tool. The protocol layer is already officially live; active addresses can be tracked, but evidence of paid usage still needs to be completed. Latest version: not found. Effective submissions within the past 90 days: not found.
Fundamentals research report $CFG / Centrifuge (multi-exchange RWA/PayFi) $0.18 (24h +1.30%)
Fundamentals research report $CFG / Centrifuge (multi-exchange RWA/PayFi) $0.18 (24h +1.30%)
2026-08-01 20:18 public data snapshot
One-sentence conclusion: Centrifuge (token $CFG ) has an overall score of 24/100 and an E rating; it mainly relies on narrative. Breaking it down across three layers: the company team and resources are tight, the protocol network uses evidence that is relatively weak, and how token value transmits still needs to be observed.
Centrifuge (token $CFG ), the RWA/PayFi sector. It focuses on RWA. Competitors/comparables include HUMA and RIO. For traditional small and mid-sized enterprises, receivables financing is typically done via bank factoring, with approval taking 30–90 days and interest rates of 12–24 points; funding arrives slowly. On-chain asset ownership is transparently verified, and liquidity provider (LP) pools enable second-level lending; RWA assets can be traded again to improve liquidity. Average deal size is $50–$500 per month, with settlement in USDC or fiat. It’s a narrative-driven track: in a bear market, usage drops by 60–80 percentage points. Positioned as a niche single-point tool. The protocol layer is already officially live; active addresses can be tracked, but evidence of paid usage still needs to be completed. Latest version: not found. Effective submissions within the past 90 days: not found.
2026-08-01 20:18 public data snapshot
One-sentence conclusion: Centrifuge (token $CFG ) has an overall score of 24/100 and an E rating; it mainly relies on narrative. Breaking it down across three layers: the company team and resources are tight, the protocol network uses evidence that is relatively weak, and how token value transmits still needs to be observed.
Centrifuge (token $CFG ), the RWA/PayFi sector. It focuses on RWA. Competitors/comparables include HUMA and RIO. For traditional small and mid-sized enterprises, receivables financing is typically done via bank factoring, with approval taking 30–90 days and interest rates of 12–24 points; funding arrives slowly. On-chain asset ownership is transparently verified, and liquidity provider (LP) pools enable second-level lending; RWA assets can be traded again to improve liquidity. Average deal size is $50–$500 per month, with settlement in USDC or fiat. It’s a narrative-driven track: in a bear market, usage drops by 60–80 percentage points. Positioned as a niche single-point tool. The protocol layer is already officially live; active addresses can be tracked, but evidence of paid usage still needs to be completed. Latest version: not found. Effective submissions within the past 90 days: not found.
106
·
--
Fundamental research report $SEI / Sei (multi-exchange public chain/L1/L2) $0.04 (24h -0.81%)Fundamental research report $SEI / Sei (multi-exchange public chain/L1/L2) $0.04 (24h -0.81%)
2026-08-01 21:23 public data snapshot
One-sentence conclusion: Sei (token $SEI) has an overall score of 56/100, rated C—storytelling outweighs execution. Break it down into three layers: the company and team have cash reserves; the protocol network already shows paid usage; but the token value transmission still needs to be observed.
Sei (token $SEI), the public chain/L1/L2 sector. Focuses on a high-performance public chain and targets SOL and SUI. Traditional enterprise collaboration relies on cloud servers and contract reconciliation; when concurrency increases, Gas spikes, TPS is constrained, and cross-chain bridge security incidents happen frequently. Public chains use a unified state machine for trustless settlement, reducing reconciliation costs. Average deal size is $50–$500 per month, requiring settlement in USDC or fiat. It’s a narrative-driven track—during bear markets, usage drops by 60–80 percentage points. Positioned as a niche single-point tool. The protocol layer is already officially live; on-chain dashboards show protocol fees are accumulating, and there are paid-usage traces. The latest version was not found; effective submissions within the last 90 days were not found either.
Fundamental research report $SEI / Sei (multi-exchange public chain/L1/L2) $0.04 (24h -0.81%)
Fundamental research report $SEI / Sei (multi-exchange public chain/L1/L2) $0.04 (24h -0.81%)
2026-08-01 21:23 public data snapshot
One-sentence conclusion: Sei (token $SEI ) has an overall score of 56/100, rated C—storytelling outweighs execution. Break it down into three layers: the company and team have cash reserves; the protocol network already shows paid usage; but the token value transmission still needs to be observed.
Sei (token $SEI ), the public chain/L1/L2 sector. Focuses on a high-performance public chain and targets SOL and SUI. Traditional enterprise collaboration relies on cloud servers and contract reconciliation; when concurrency increases, Gas spikes, TPS is constrained, and cross-chain bridge security incidents happen frequently. Public chains use a unified state machine for trustless settlement, reducing reconciliation costs. Average deal size is $50–$500 per month, requiring settlement in USDC or fiat. It’s a narrative-driven track—during bear markets, usage drops by 60–80 percentage points. Positioned as a niche single-point tool. The protocol layer is already officially live; on-chain dashboards show protocol fees are accumulating, and there are paid-usage traces. The latest version was not found; effective submissions within the last 90 days were not found either.
2026-08-01 21:23 public data snapshot
One-sentence conclusion: Sei (token $SEI ) has an overall score of 56/100, rated C—storytelling outweighs execution. Break it down into three layers: the company and team have cash reserves; the protocol network already shows paid usage; but the token value transmission still needs to be observed.
Sei (token $SEI ), the public chain/L1/L2 sector. Focuses on a high-performance public chain and targets SOL and SUI. Traditional enterprise collaboration relies on cloud servers and contract reconciliation; when concurrency increases, Gas spikes, TPS is constrained, and cross-chain bridge security incidents happen frequently. Public chains use a unified state machine for trustless settlement, reducing reconciliation costs. Average deal size is $50–$500 per month, requiring settlement in USDC or fiat. It’s a narrative-driven track—during bear markets, usage drops by 60–80 percentage points. Positioned as a niche single-point tool. The protocol layer is already officially live; on-chain dashboards show protocol fees are accumulating, and there are paid-usage traces. The latest version was not found; effective submissions within the last 90 days were not found either.
44
·
--
Sector Rotation | L1 Public Chains +1.89% Leading / ETH L2 +0.00% Lagging
Breakdown of the top 5 segments in the first layer: L1 public chains +1.89% / Meme +1.75% / AI/DePIN +0.00% / DeFi +0.00% / ETH L2 +0.00%. The strongest L1 public chains average +1.89%, the weakest ETH L2 average +0.00%, scissors spread 1.89 percentage points.
In the second layer, the L1 public chain segment covers 8 tracked assets, averaging +1.89%, with funds flowing in concentratedly. The leading token $ADA $0.19 (24h +9.30%), trading volume $517.04M, market cap $6.96B.
In the third cut, looking specifically at the ETH L2 segment, it covers 0 tracked assets, averaging +0.00%, with profit-taking concentratedly realized.
In the fourth layer, look at: rotation direction—moving from ETH L2 to L1 public chains, while the middle tier AI/DePIN averages +0.00%. Smart money grabs the front row; those at the back only get scraps or even get hit. The typical segment-switch cycle is generally 3–7 days; watch for pullbacks in the leading token to catch the continuation.
At the end of the day: comparing each segment’s leader—L1 public chains = $ADA +9.30%, Meme = $SHIB +3.10%.
Judgment: chase strength, not weakness. When segments rotate, focus on pullbacks of the leader in the strongest segment to get in. A scissors spread over 10 points indicates highly concentrated capital; over 15 points, be cautious of a reversal.
Market data comes from OKX’s public API and does not constitute any investment advice.
The signal has been sent—whether you act or not is your choice.
#盘面动态 #加密 #研究 #OKXOrbit
Sector Rotation | L1 Public Chains +1.89% Leading / ETH L2 +0.00% Lagging
Breakdown of the top 5 segments in the first layer: L1 public chains +1.89% / Meme +1.75% / AI/DePIN +0.00% / DeFi +0.00% / ETH L2 +0.00%. The strongest L1 public chains average +1.89%, the weakest ETH L2 average +0.00%, scissors spread 1.89 percentage points.
In the second layer, the L1 public chain segment covers 8 tracked assets, averaging +1.89%, with funds flowing in concentratedly. The leading token $ADA $0.19 (24h +9.30%), trading volume $517.04M, market cap $6.96B.
In the third cut, looking specifically at the ETH L2 segment, it covers 0 tracked assets, averaging +0.00%, with profit-taking concentratedly realized.
In the fourth layer, look at: rotation direction—moving from ETH L2 to L1 public chains, while the middle tier AI/DePIN averages +0.00%. Smart money grabs the front row; those at the back only get scraps or even get hit. The typical segment-switch cycle is generally 3–7 days; watch for pullbacks in the leading token to catch the continuation.
At the end of the day: comparing each segment’s leader—L1 public chains = $ADA +9.30%, Meme = $SHIB +3.10%.
Judgment: chase strength, not weakness. When segments rotate, focus on pullbacks of the leader in the strongest segment to get in. A scissors spread over 10 points indicates highly concentrated capital; over 15 points, be cautious of a reversal.
Market data comes from OKX’s public API and does not constitute any investment advice.
The signal has been sent—whether you act or not is your choice.
#盘面动态 #加密 #研究 #OKXOrbit
Breakdown of the top 5 segments in the first layer: L1 public chains +1.89% / Meme +1.75% / AI/DePIN +0.00% / DeFi +0.00% / ETH L2 +0.00%. The strongest L1 public chains average +1.89%, the weakest ETH L2 average +0.00%, scissors spread 1.89 percentage points.
In the second layer, the L1 public chain segment covers 8 tracked assets, averaging +1.89%, with funds flowing in concentratedly. The leading token $ADA $0.19 (24h +9.30%), trading volume $517.04M, market cap $6.96B.
In the third cut, looking specifically at the ETH L2 segment, it covers 0 tracked assets, averaging +0.00%, with profit-taking concentratedly realized.
In the fourth layer, look at: rotation direction—moving from ETH L2 to L1 public chains, while the middle tier AI/DePIN averages +0.00%. Smart money grabs the front row; those at the back only get scraps or even get hit. The typical segment-switch cycle is generally 3–7 days; watch for pullbacks in the leading token to catch the continuation.
At the end of the day: comparing each segment’s leader—L1 public chains = $ADA +9.30%, Meme = $SHIB +3.10%.
Judgment: chase strength, not weakness. When segments rotate, focus on pullbacks of the leader in the strongest segment to get in. A scissors spread over 10 points indicates highly concentrated capital; over 15 points, be cautious of a reversal.
Market data comes from OKX’s public API and does not constitute any investment advice.
The signal has been sent—whether you act or not is your choice.
#盘面动态 #加密 #研究 #OKXOrbit
196
·
--
Fundamentals research report $TSM / TSMC(NYQ AI/Semiconductor)$404.25 (24h +0.23%)Fundamentals research report $TSM / TSMC(NYQ AI/Semiconductor)$404.25 (24h +0.23%)
2026-08-01 21:03 Public data snapshot
One-sentence conclusion: TSMC ($TSM) has an overall score of 49/100, rated D. It’s an early-stage project with insufficient validation. The business fundamentals are mainly driven by a growth narrative, and the market value-to-revenue multiple is still within a reasonable range.
TSMC ($TSM) is listed on the NYQ exchange, in the AI/semiconductor sector. In plain terms: chip foundry. Peer comparisons: NVDA and AMD. AI compute demand comes from large model training and inference, and hyperscaler capital expenditures are the core driver. A single AI server costs $200,000–$500,000, with a gross margin of 10–15 percentage points; economies of scale determine profitability. It does not involve token economics or on-chain settlement logic. The protocol layer has been officially live, and active addresses can be tracked, but evidence of paid usage is still missing. Latest version not found; submissions with validity over the past 90 days not found either.
Fundamentals research report $TSM / TSMC(NYQ AI/Semiconductor)$404.25 (24h +0.23%)
Fundamentals research report $TSM / TSMC(NYQ AI/Semiconductor)$404.25 (24h +0.23%)
2026-08-01 21:03 Public data snapshot
One-sentence conclusion: TSMC ($TSM ) has an overall score of 49/100, rated D. It’s an early-stage project with insufficient validation. The business fundamentals are mainly driven by a growth narrative, and the market value-to-revenue multiple is still within a reasonable range.
TSMC ($TSM ) is listed on the NYQ exchange, in the AI/semiconductor sector. In plain terms: chip foundry. Peer comparisons: NVDA and AMD. AI compute demand comes from large model training and inference, and hyperscaler capital expenditures are the core driver. A single AI server costs $200,000–$500,000, with a gross margin of 10–15 percentage points; economies of scale determine profitability. It does not involve token economics or on-chain settlement logic. The protocol layer has been officially live, and active addresses can be tracked, but evidence of paid usage is still missing. Latest version not found; submissions with validity over the past 90 days not found either.
2026-08-01 21:03 Public data snapshot
One-sentence conclusion: TSMC ($TSM ) has an overall score of 49/100, rated D. It’s an early-stage project with insufficient validation. The business fundamentals are mainly driven by a growth narrative, and the market value-to-revenue multiple is still within a reasonable range.
TSMC ($TSM ) is listed on the NYQ exchange, in the AI/semiconductor sector. In plain terms: chip foundry. Peer comparisons: NVDA and AMD. AI compute demand comes from large model training and inference, and hyperscaler capital expenditures are the core driver. A single AI server costs $200,000–$500,000, with a gross margin of 10–15 percentage points; economies of scale determine profitability. It does not involve token economics or on-chain settlement logic. The protocol layer has been officially live, and active addresses can be tracked, but evidence of paid usage is still missing. Latest version not found; submissions with validity over the past 90 days not found either.
32
·
--
Fundamental research report $RNDR / Render (multi-exchange compute/GPU)$ 1.37 (24h -0.82%)Fundamental research report $RNDR / Render (multi-exchange compute/GPU)$ 1.37 (24h -0.82%)
2026-08-01 19:38 public data snapshot
One-sentence takeaway: Render (token $RNDR) overall score 34/100, rating E, mainly relying on narrative. Breaking it down into three layers: the company team and resources are somewhat tight, protocol network usage evidence is weak, and the token value transmission still needs to be observed.
Render(token $RNDR), the computing/power/GPU sector. Focuses on distributed GPUs. Targets TAO and AKT. Traditional compute rental is done by giants like AWS and CoreWeave, billed by GPU hours; the monthly rent for an A100 is $12,000–$25,000—expensive and with high barriers. On-chain solutions fragment compute into bidding for power; providers don’t need centralized approvals, and idle GPUs become usable supply. Average customer ticket: $50–$500/month, requiring USDC or fiat settlement. A narrative-driven sector; in a bear market, usage can drop by 60–80 percentage points. Positioning as a niche single-point tool. The protocol layer is already officially running; active addresses can be tracked, but evidence of paid usage still needs to be completed. Latest version not found; submissions effective within the last 90 days not found.
Fundamental research report $RNDR / Render (multi-exchange compute/GPU)$ 1.37 (24h -0.82%)
Fundamental research report $RNDR / Render (multi-exchange compute/GPU)$ 1.37 (24h -0.82%)
2026-08-01 19:38 public data snapshot
One-sentence takeaway: Render (token $RNDR) overall score 34/100, rating E, mainly relying on narrative. Breaking it down into three layers: the company team and resources are somewhat tight, protocol network usage evidence is weak, and the token value transmission still needs to be observed.
Render(token $RNDR), the computing/power/GPU sector. Focuses on distributed GPUs. Targets TAO and AKT. Traditional compute rental is done by giants like AWS and CoreWeave, billed by GPU hours; the monthly rent for an A100 is $12,000–$25,000—expensive and with high barriers. On-chain solutions fragment compute into bidding for power; providers don’t need centralized approvals, and idle GPUs become usable supply. Average customer ticket: $50–$500/month, requiring USDC or fiat settlement. A narrative-driven sector; in a bear market, usage can drop by 60–80 percentage points. Positioning as a niche single-point tool. The protocol layer is already officially running; active addresses can be tracked, but evidence of paid usage still needs to be completed. Latest version not found; submissions effective within the last 90 days not found.
2026-08-01 19:38 public data snapshot
One-sentence takeaway: Render (token $RNDR) overall score 34/100, rating E, mainly relying on narrative. Breaking it down into three layers: the company team and resources are somewhat tight, protocol network usage evidence is weak, and the token value transmission still needs to be observed.
Render(token $RNDR), the computing/power/GPU sector. Focuses on distributed GPUs. Targets TAO and AKT. Traditional compute rental is done by giants like AWS and CoreWeave, billed by GPU hours; the monthly rent for an A100 is $12,000–$25,000—expensive and with high barriers. On-chain solutions fragment compute into bidding for power; providers don’t need centralized approvals, and idle GPUs become usable supply. Average customer ticket: $50–$500/month, requiring USDC or fiat settlement. A narrative-driven sector; in a bear market, usage can drop by 60–80 percentage points. Positioning as a niche single-point tool. The protocol layer is already officially running; active addresses can be tracked, but evidence of paid usage still needs to be completed. Latest version not found; submissions effective within the last 90 days not found.
4
·
--
Fundamentals research report $COIN / Coinbase (NMS exchange/broker) $146.26 (24h -10.59%)Fundamentals research report $COIN / Coinbase (NMS exchange/broker) $146.26 (24h -10.59%)
2026-08-01 19:13 Public data snapshot
One-sentence conclusion: Coinbase ($COIN) has an overall score of 45/100, a rating of D—an early-stage project with insufficient validation. The business fundamentals are mainly driven by a growth narrative, and the market cap to revenue multiple is still within a reasonable range.
Coinbase ($COIN) is listed on the NMS, in the exchange/brokerage sector. In plain terms: it’s an exchange. Peers include HOOD and MARA. Exchange revenue comes from trading fees, margin lending/interest, and custody fees. Revenue sensitivity depends on user asset size and trading frequency, while regulatory licenses determine the business boundaries. It does not involve token economics or on-chain settlement logic. The protocol layer has been officially operational, and active addresses can be tracked, but evidence of paid usage still needs to be completed. The latest version hasn’t been found; submissions effective within the past 90 days haven’t been found either.
Fundamentals research report $COIN / Coinbase (NMS exchange/broker) $146.26 (24h -10.59%)
Fundamentals research report $COIN / Coinbase (NMS exchange/broker) $146.26 (24h -10.59%)
2026-08-01 19:13 Public data snapshot
One-sentence conclusion: Coinbase ($COIN ) has an overall score of 45/100, a rating of D—an early-stage project with insufficient validation. The business fundamentals are mainly driven by a growth narrative, and the market cap to revenue multiple is still within a reasonable range.
Coinbase ($COIN ) is listed on the NMS, in the exchange/brokerage sector. In plain terms: it’s an exchange. Peers include HOOD and MARA. Exchange revenue comes from trading fees, margin lending/interest, and custody fees. Revenue sensitivity depends on user asset size and trading frequency, while regulatory licenses determine the business boundaries. It does not involve token economics or on-chain settlement logic. The protocol layer has been officially operational, and active addresses can be tracked, but evidence of paid usage still needs to be completed. The latest version hasn’t been found; submissions effective within the past 90 days haven’t been found either.
2026-08-01 19:13 Public data snapshot
One-sentence conclusion: Coinbase ($COIN ) has an overall score of 45/100, a rating of D—an early-stage project with insufficient validation. The business fundamentals are mainly driven by a growth narrative, and the market cap to revenue multiple is still within a reasonable range.
Coinbase ($COIN ) is listed on the NMS, in the exchange/brokerage sector. In plain terms: it’s an exchange. Peers include HOOD and MARA. Exchange revenue comes from trading fees, margin lending/interest, and custody fees. Revenue sensitivity depends on user asset size and trading frequency, while regulatory licenses determine the business boundaries. It does not involve token economics or on-chain settlement logic. The protocol layer has been officially operational, and active addresses can be tracked, but evidence of paid usage still needs to be completed. The latest version hasn’t been found; submissions effective within the past 90 days haven’t been found either.
15
·
--
Fundamentals research report $TAO / Bittensor (multi-exchange AI/semiconductor) $194.57 (24h +0.27%)Fundamentals research report $TAO / Bittensor (multi-exchange AI/semiconductor) $194.57 (24h +0.27%)
2026-08-01 19:28 Public data snapshot
One-sentence conclusion: Bittensor (token $TAO) has a composite score of 50/100, rated C—its narrative outweighs execution. Split into three layers: the company team has cash reserves; the protocol network already shows paid usage; however, how token value propagates still needs to be observed.
Bittensor (token $TAO), in the AI/semiconductor sector. It focuses on AI + blockchain. Benchmarked against RNDR and FET. Traditional centralized platforms take 15–40% in fees, and user data is not under users’ control. Moving on-chain enables trust-based transactions with lower fees; token incentives convert early users into contributors. Average spend per customer is $50–$500 per month, requiring USDC or fiat settlement. A narrative-driven track—during bear markets, usage drops by 60–80%. Positioned as a niche, single-point tool. The protocol layer is already officially live; the on-chain dashboard shows protocol fees are accumulating, with paid usage evidence already present. Latest version v10.5.0, with 100 effective submissions in the past 90 days.
Fundamentals research report $TAO / Bittensor (multi-exchange AI/semiconductor) $194.57 (24h +0.27%)
Fundamentals research report $TAO / Bittensor (multi-exchange AI/semiconductor) $194.57 (24h +0.27%)
2026-08-01 19:28 Public data snapshot
One-sentence conclusion: Bittensor (token $TAO ) has a composite score of 50/100, rated C—its narrative outweighs execution. Split into three layers: the company team has cash reserves; the protocol network already shows paid usage; however, how token value propagates still needs to be observed.
Bittensor (token $TAO ), in the AI/semiconductor sector. It focuses on AI + blockchain. Benchmarked against RNDR and FET. Traditional centralized platforms take 15–40% in fees, and user data is not under users’ control. Moving on-chain enables trust-based transactions with lower fees; token incentives convert early users into contributors. Average spend per customer is $50–$500 per month, requiring USDC or fiat settlement. A narrative-driven track—during bear markets, usage drops by 60–80%. Positioned as a niche, single-point tool. The protocol layer is already officially live; the on-chain dashboard shows protocol fees are accumulating, with paid usage evidence already present. Latest version v10.5.0, with 100 effective submissions in the past 90 days.
2026-08-01 19:28 Public data snapshot
One-sentence conclusion: Bittensor (token $TAO ) has a composite score of 50/100, rated C—its narrative outweighs execution. Split into three layers: the company team has cash reserves; the protocol network already shows paid usage; however, how token value propagates still needs to be observed.
Bittensor (token $TAO ), in the AI/semiconductor sector. It focuses on AI + blockchain. Benchmarked against RNDR and FET. Traditional centralized platforms take 15–40% in fees, and user data is not under users’ control. Moving on-chain enables trust-based transactions with lower fees; token incentives convert early users into contributors. Average spend per customer is $50–$500 per month, requiring USDC or fiat settlement. A narrative-driven track—during bear markets, usage drops by 60–80%. Positioned as a niche, single-point tool. The protocol layer is already officially live; the on-chain dashboard shows protocol fees are accumulating, with paid usage evidence already present. Latest version v10.5.0, with 100 effective submissions in the past 90 days.
65
·
--
Partly True
Fundamentals research report $SOL / Solana (multi-exchange public chain/L1/L2) $72.75 (24h -1.12%)Fundamentals research report $SOL / Solana (multi-exchange public chain/L1/L2) $72.75 (24h -1.12%)
2026-08-01 19:08 public data snapshot
One-sentence conclusion: Solana (token $SOL) has an overall score of 74/100, earning a rating of B. The fundamentals meet expectations but have some flaws. Breaking it down into layers: the company team has cash reserves; the protocol network already shows paid usage; and how value flows through the token still needs observation.
Solana (token $SOL), the public chain/L1/L2 sector. It focuses on a high-performance blockchain, competing with ETH and AVAX. Traditional enterprise collaboration relies on cloud servers and contract reconciliation; under high concurrency, Gas spikes, TPS is capped, and cross-chain bridges see frequent security incidents. Public chains use a unified state machine for trustless settlement, reducing reconciliation costs. Average customer spend is $50–$500 per month, requiring USDC or fiat settlement. It’s a narrative-driven track: in a bear market, usage can drop by 60–80 percentage points. Positioning as a tool for a specific niche. The protocol layer is already live; the on-chain dashboard shows protocol fees accumulating, with evidence of paid usage. Latest version v1.18.26; within the past 90 days, effective submissions: not found.
Fundamentals research report $SOL / Solana (multi-exchange public chain/L1/L2) $72.75 (24h -1.12%)
Fundamentals research report $SOL / Solana (multi-exchange public chain/L1/L2) $72.75 (24h -1.12%)
2026-08-01 19:08 public data snapshot
One-sentence conclusion: Solana (token $SOL ) has an overall score of 74/100, earning a rating of B. The fundamentals meet expectations but have some flaws. Breaking it down into layers: the company team has cash reserves; the protocol network already shows paid usage; and how value flows through the token still needs observation.
Solana (token $SOL ), the public chain/L1/L2 sector. It focuses on a high-performance blockchain, competing with ETH and AVAX. Traditional enterprise collaboration relies on cloud servers and contract reconciliation; under high concurrency, Gas spikes, TPS is capped, and cross-chain bridges see frequent security incidents. Public chains use a unified state machine for trustless settlement, reducing reconciliation costs. Average customer spend is $50–$500 per month, requiring USDC or fiat settlement. It’s a narrative-driven track: in a bear market, usage can drop by 60–80 percentage points. Positioning as a tool for a specific niche. The protocol layer is already live; the on-chain dashboard shows protocol fees accumulating, with evidence of paid usage. Latest version v1.18.26; within the past 90 days, effective submissions: not found.
2026-08-01 19:08 public data snapshot
One-sentence conclusion: Solana (token $SOL ) has an overall score of 74/100, earning a rating of B. The fundamentals meet expectations but have some flaws. Breaking it down into layers: the company team has cash reserves; the protocol network already shows paid usage; and how value flows through the token still needs observation.
Solana (token $SOL ), the public chain/L1/L2 sector. It focuses on a high-performance blockchain, competing with ETH and AVAX. Traditional enterprise collaboration relies on cloud servers and contract reconciliation; under high concurrency, Gas spikes, TPS is capped, and cross-chain bridges see frequent security incidents. Public chains use a unified state machine for trustless settlement, reducing reconciliation costs. Average customer spend is $50–$500 per month, requiring USDC or fiat settlement. It’s a narrative-driven track: in a bear market, usage can drop by 60–80 percentage points. Positioning as a tool for a specific niche. The protocol layer is already live; the on-chain dashboard shows protocol fees accumulating, with evidence of paid usage. Latest version v1.18.26; within the past 90 days, effective submissions: not found.
221
Log in to explore more content
Join global crypto users on Binance Square
⚡️ Get latest and useful information about crypto.
💬 Trusted by the world’s largest crypto exchange.
👍 Discover real insights from verified creators.
Email / Phone number
Trending Topics
1
#AppleDebutsFoldablePhone
44,897 views
900 Discussing
2
#TSMCAugustRevenueUp53.3%YoY
9,937 views
286 Discussing
3
#IranSaysReadyToEscalateWarWithUS
12,586 views
285 Discussing
4
#EUExtendsCentralContactPointToCASPs
13,269 views
337 Discussing
5
#US10YTreasuryYieldHitsHighestSinceNov2023
35,814 views
561 Discussing
6
#USTreasuryToBuyBackUpTo$6BLongDatedDebt
21,019 views
180 Discussing
7
#BitcoinSurpasses$79K
73,747 views
293 Discussing
8
#BrentCrudeTops$100
133,030 views
422 Discussing
9
#USADPWeeklyEmploymentRises12000
124,103 views
1,467 Discussing
10
#BankOfAmericaGroupPilotsUSBDCStablecoin
92,349 views
1,152 Discussing