
#korub
korub
87,637 views
1,605 Discussing
Hot
Latest

·
--
$KORUB +9.33% | $SOPH +9.28% | $LITEB +8.85%
#KORUB nudged up to $7.03, gaining +9.33% on a solid $6.2 M of trades, suggesting fresh buying pressure.
#SOPH slipped higher to $0.00106000, climbing +9.28% with $4.4 M moving through its order book, a notable lift for a micro‑cap.
#LITEB pushed to $588.76, up +8.85% on $1.6 M of volume, showing the broad‑market rally reaching higher‑priced assets as well.
Watch how the relative volume strength of KORUB versus LITEB could signal where short‑term momentum may linger.
#Write2Earn #Binance
$KORUB +9.33% | $SOPH +9.28% | $LITEB +8.85%
#KORUB nudged up to $7.03, gaining +9.33% on a solid $6.2 M of trades, suggesting fresh buying pressure.
#SOPH slipped higher to $0.00106000, climbing +9.28% with $4.4 M moving through its order book, a notable lift for a micro‑cap.
#LITEB pushed to $588.76, up +8.85% on $1.6 M of volume, showing the broad‑market rally reaching higher‑priced assets as well.
Watch how the relative volume strength of KORUB versus LITEB could signal where short‑term momentum may linger.
#Write2Earn #Binance
#KORUB nudged up to $7.03, gaining +9.33% on a solid $6.2 M of trades, suggesting fresh buying pressure.
#SOPH slipped higher to $0.00106000, climbing +9.28% with $4.4 M moving through its order book, a notable lift for a micro‑cap.
#LITEB pushed to $588.76, up +8.85% on $1.6 M of volume, showing the broad‑market rally reaching higher‑priced assets as well.
Watch how the relative volume strength of KORUB versus LITEB could signal where short‑term momentum may linger.
#Write2Earn #Binance
13
·
--
$KORUB +6.68% | $RUNE +6.37% | $KAVA +5.56%
#KORUB is holding at $6.87, up +6.68% on a solid $7.2 M of volume, suggesting fresh buying pressure.
#RUNE nudges higher to $0.5510, gaining +6.37% with $3.4 M changing hands, a modest lift that keeps it in view.
#KAVA climbs to $0.0286, posting +5.56% on $4.1 M of trade, a steady advance that hints at broader market optimism.
📈 Worth watching whether the relative volume gap between KORUB and the others narrows, which could signal a shift in short‑term momentum.
#Write2Earn #Binance
$KORUB +6.68% | $RUNE +6.37% | $KAVA +5.56%
#KORUB is holding at $6.87, up +6.68% on a solid $7.2 M of volume, suggesting fresh buying pressure.
#RUNE nudges higher to $0.5510, gaining +6.37% with $3.4 M changing hands, a modest lift that keeps it in view.
#KAVA climbs to $0.0286, posting +5.56% on $4.1 M of trade, a steady advance that hints at broader market optimism.
📈 Worth watching whether the relative volume gap between KORUB and the others narrows, which could signal a shift in short‑term momentum.
#Write2Earn #Binance
#KORUB is holding at $6.87, up +6.68% on a solid $7.2 M of volume, suggesting fresh buying pressure.
#RUNE nudges higher to $0.5510, gaining +6.37% with $3.4 M changing hands, a modest lift that keeps it in view.
#KAVA climbs to $0.0286, posting +5.56% on $4.1 M of trade, a steady advance that hints at broader market optimism.
📈 Worth watching whether the relative volume gap between KORUB and the others narrows, which could signal a shift in short‑term momentum.
#Write2Earn #Binance
7

·
--
$KORUB looks ready to go higher from here
Trading volume is almost double the usual average
Entry zone 6.9667 to 7.1708
Stop 6.2744
Targets 8.4134 then 9.2690 then 10.5524
Holding right near today high without dropping back
RSI is at 64 showing strength left 🚀
Sitting inside the zone as I type this
Tap $KORUB to buy
Taking it or watching it
#KORUB #TradingSignals
$KORUB looks ready to go higher from here
Trading volume is almost double the usual average
Entry zone 6.9667 to 7.1708
Stop 6.2744
Targets 8.4134 then 9.2690 then 10.5524
Holding right near today high without dropping back
RSI is at 64 showing strength left 🚀
Sitting inside the zone as I type this
Tap $KORUB to buy
Taking it or watching it
#KORUB #TradingSignals
Trading volume is almost double the usual average
Entry zone 6.9667 to 7.1708
Stop 6.2744
Targets 8.4134 then 9.2690 then 10.5524
Holding right near today high without dropping back
RSI is at 64 showing strength left 🚀
Sitting inside the zone as I type this
Tap $KORUB to buy
Taking it or watching it
#KORUB #TradingSignals

·
--
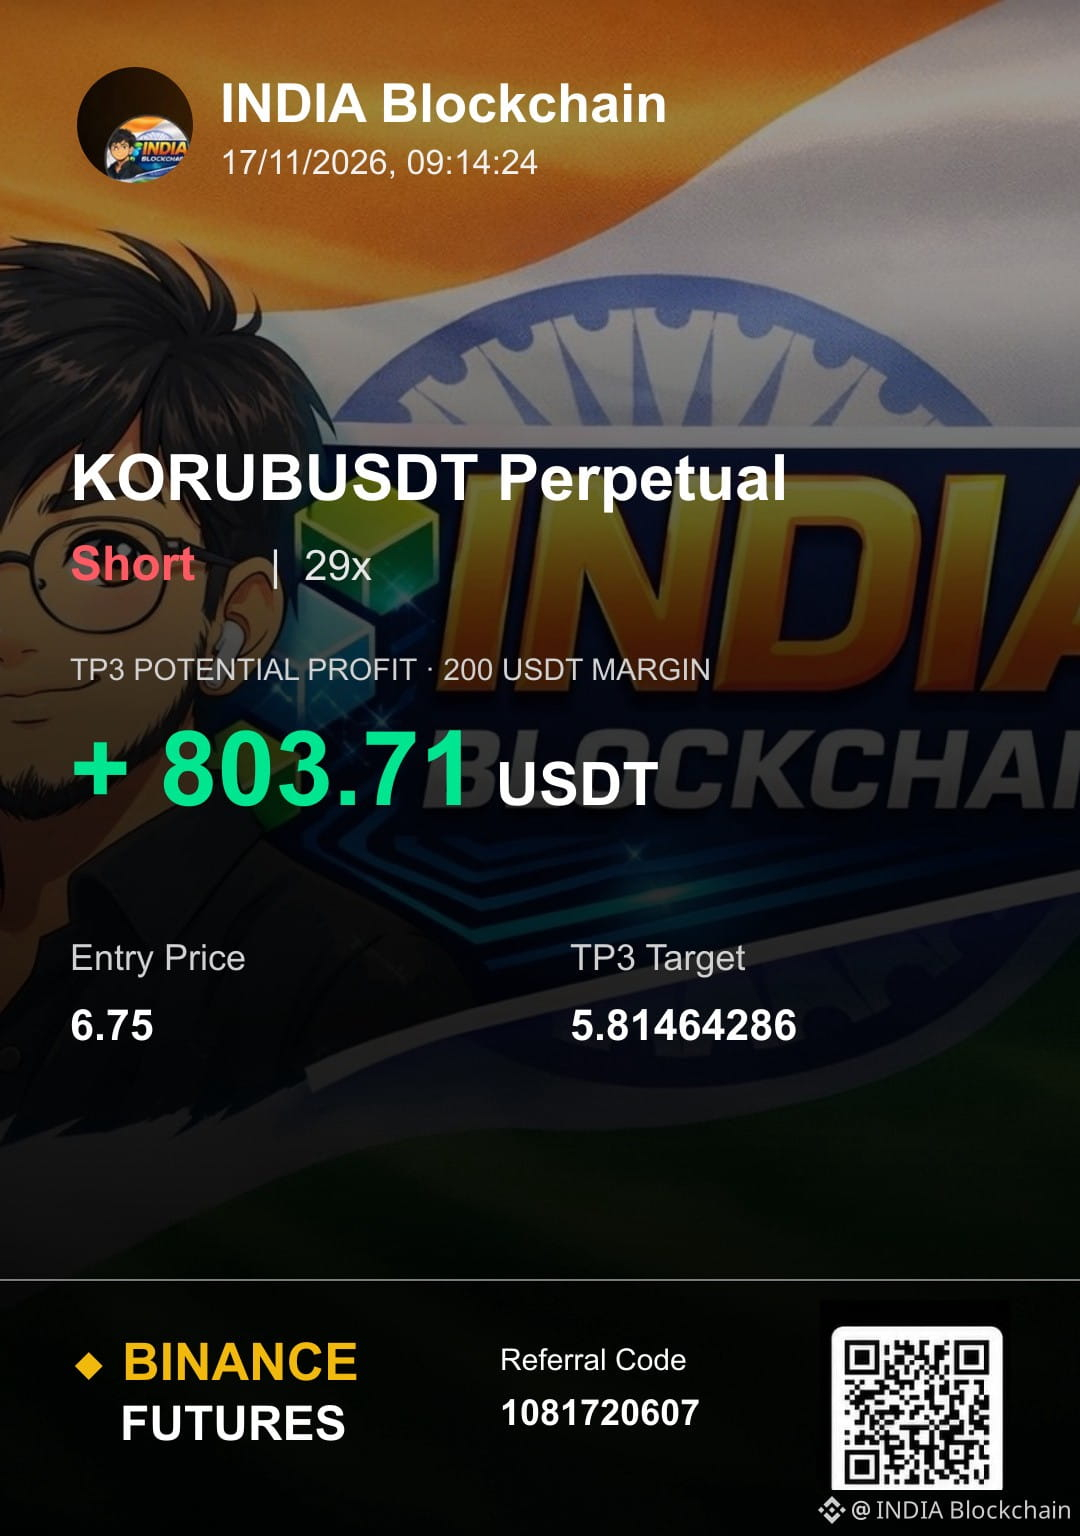
🔻 $KORUB SHORT SETUP 🔴
Sellers are stepping in — here's the setup. ⚡
KORUB is currently displaying strong bearish momentum, evidenced by a nearly 9.13% price drop over the last 24 hours on considerable volume. This indicates a decisive break below recent support levels, suggesting further downside potential.
📊 24h: -9.13% | Vol: $12,281,401
Trade Plan
Entry: 6.47
Stop Loss: 6.66
TP1: 6.31
TP2: 6.18
TP3: 6.05
⚖️ Risk:Reward (TP1) — 1:0.84
Trigger:
Continuation of bearish momentum following significant daily decline.
Risk Note:
Trading cryptocurrencies involves substantial risk and is not suitable for all investors. Only risk capital you can afford to lose. Past performance is not indicative of future results.
Let the market confirm before you act.
#KORUB #korub
🔻 $KORUB SHORT SETUP 🔴
Sellers are stepping in — here's the setup. ⚡
KORUB is currently displaying strong bearish momentum, evidenced by a nearly 9.13% price drop over the last 24 hours on considerable volume. This indicates a decisive break below recent support levels, suggesting further downside potential.
📊 24h: -9.13% | Vol: $12,281,401
Trade Plan
Entry: 6.47
Stop Loss: 6.66
TP1: 6.31
TP2: 6.18
TP3: 6.05
⚖️ Risk:Reward (TP1) — 1:0.84
Trigger:
Continuation of bearish momentum following significant daily decline.
Risk Note:
Trading cryptocurrencies involves substantial risk and is not suitable for all investors. Only risk capital you can afford to lose. Past performance is not indicative of future results.
Let the market confirm before you act.
#KORUB #korub
Sellers are stepping in — here's the setup. ⚡
KORUB is currently displaying strong bearish momentum, evidenced by a nearly 9.13% price drop over the last 24 hours on considerable volume. This indicates a decisive break below recent support levels, suggesting further downside potential.
📊 24h: -9.13% | Vol: $12,281,401
Trade Plan
Entry: 6.47
Stop Loss: 6.66
TP1: 6.31
TP2: 6.18
TP3: 6.05
⚖️ Risk:Reward (TP1) — 1:0.84
Trigger:
Continuation of bearish momentum following significant daily decline.
Risk Note:
Trading cryptocurrencies involves substantial risk and is not suitable for all investors. Only risk capital you can afford to lose. Past performance is not indicative of future results.
Let the market confirm before you act.
#KORUB #korub
196
·
--
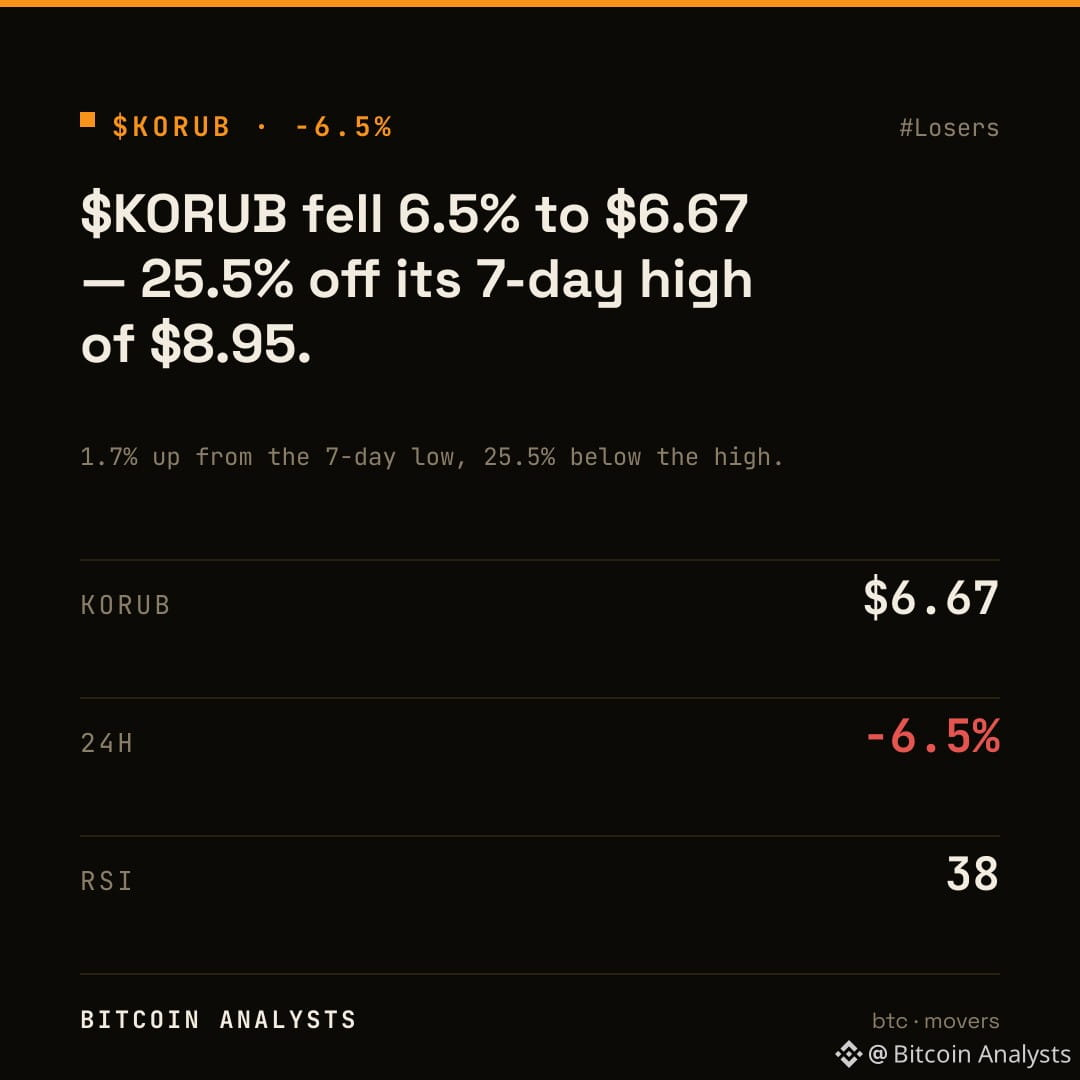
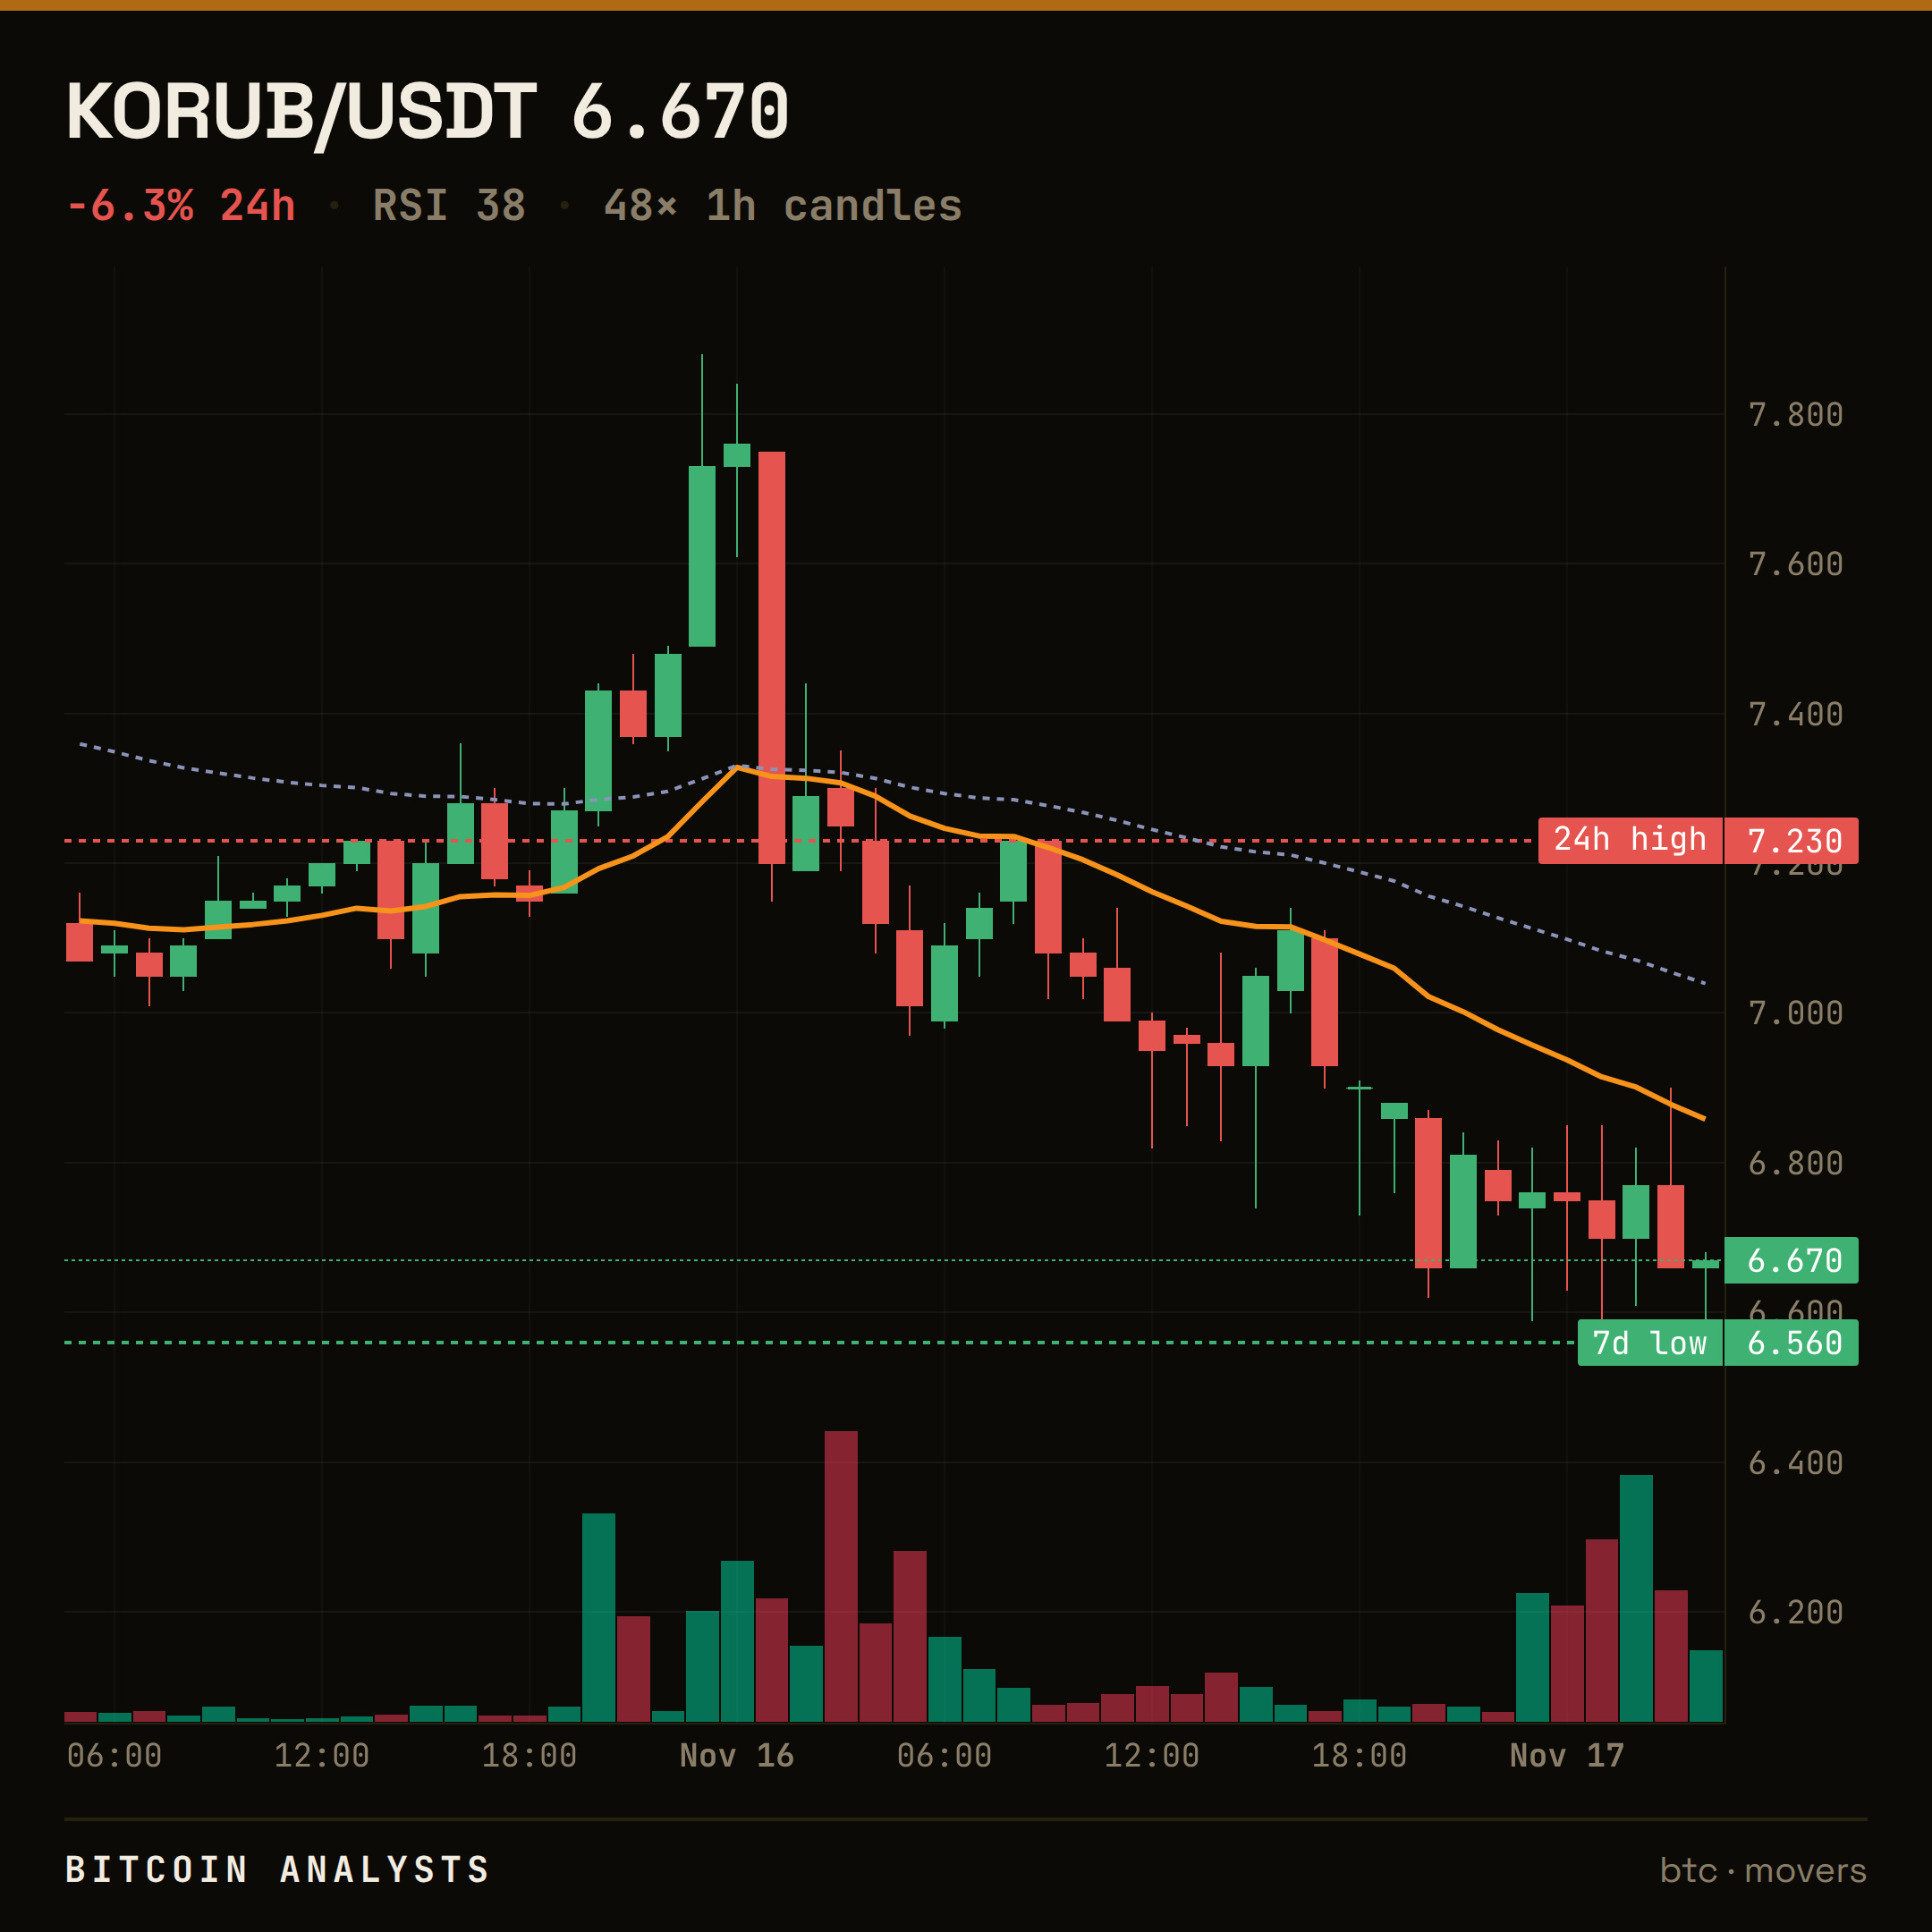
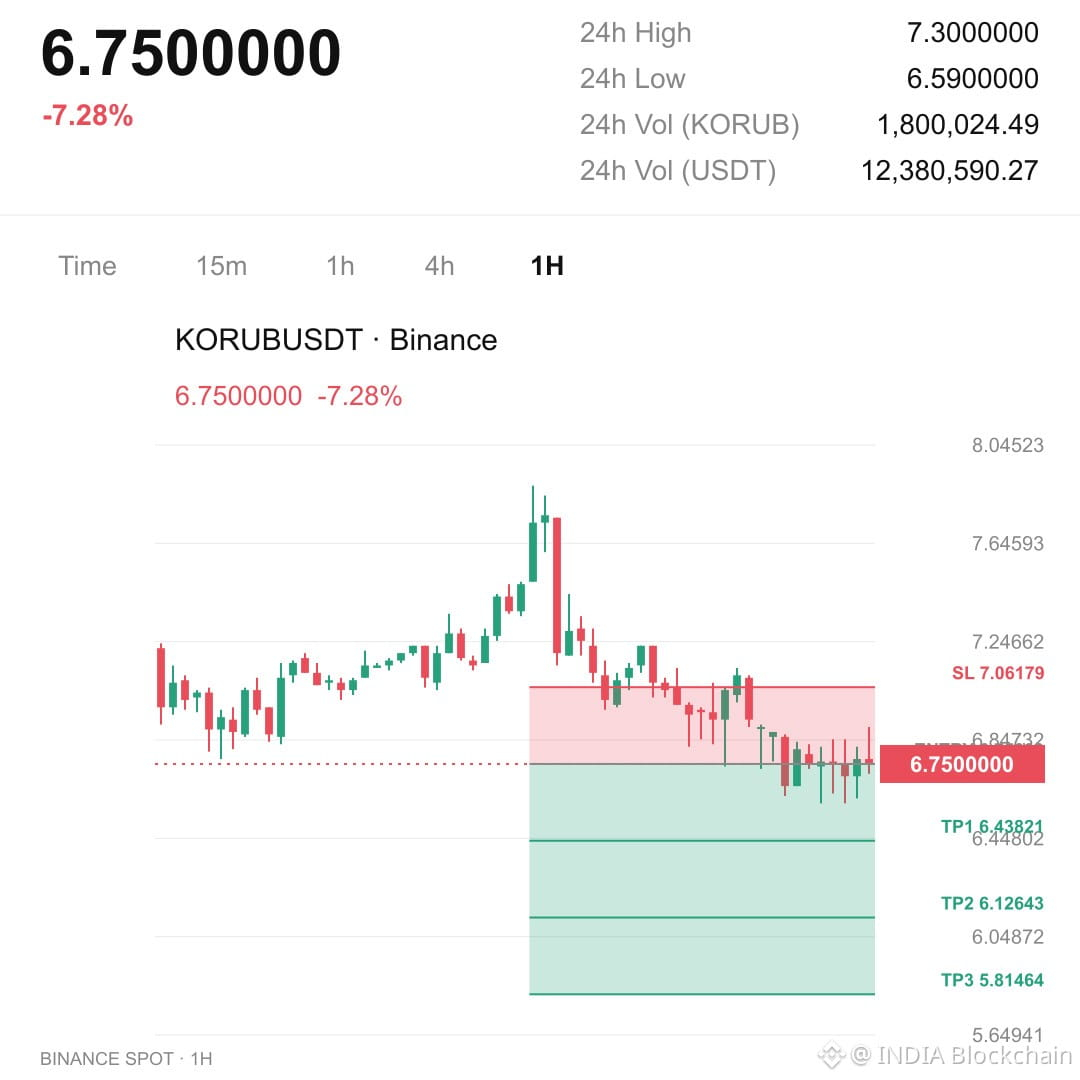
Price stabilization at 6.58 suggests selling exhaustion after a 6.53% dip.
While $KORUB is trading below the recent 7.23 high, the latest hourly volume is 1.24x the preceding average, signaling active liquidity absorption at current levels. A reclaim of the 6.59 previous range floor could indicate a shift in buyer sentiment. Conversely, if volume dries up and the price fails to hold 6.58, the recent pullback may deepen further.
Do you see the current volume spike as a re-accumulation phase or a distribution trap for late entrants?
Tap $KORUB for the live chart. #KORUB #BinanceSquare
Price stabilization at 6.58 suggests selling exhaustion after a 6.53% dip.
While $KORUB is trading below the recent 7.23 high, the latest hourly volume is 1.24x the preceding average, signaling active liquidity absorption at current levels. A reclaim of the 6.59 previous range floor could indicate a shift in buyer sentiment. Conversely, if volume dries up and the price fails to hold 6.58, the recent pullback may deepen further.
Do you see the current volume spike as a re-accumulation phase or a distribution trap for late entrants?
Tap $KORUB for the live chart. #KORUB #BinanceSquare
While $KORUB is trading below the recent 7.23 high, the latest hourly volume is 1.24x the preceding average, signaling active liquidity absorption at current levels. A reclaim of the 6.59 previous range floor could indicate a shift in buyer sentiment. Conversely, if volume dries up and the price fails to hold 6.58, the recent pullback may deepen further.
Do you see the current volume spike as a re-accumulation phase or a distribution trap for late entrants?
Tap $KORUB for the live chart. #KORUB #BinanceSquare
9



·
--
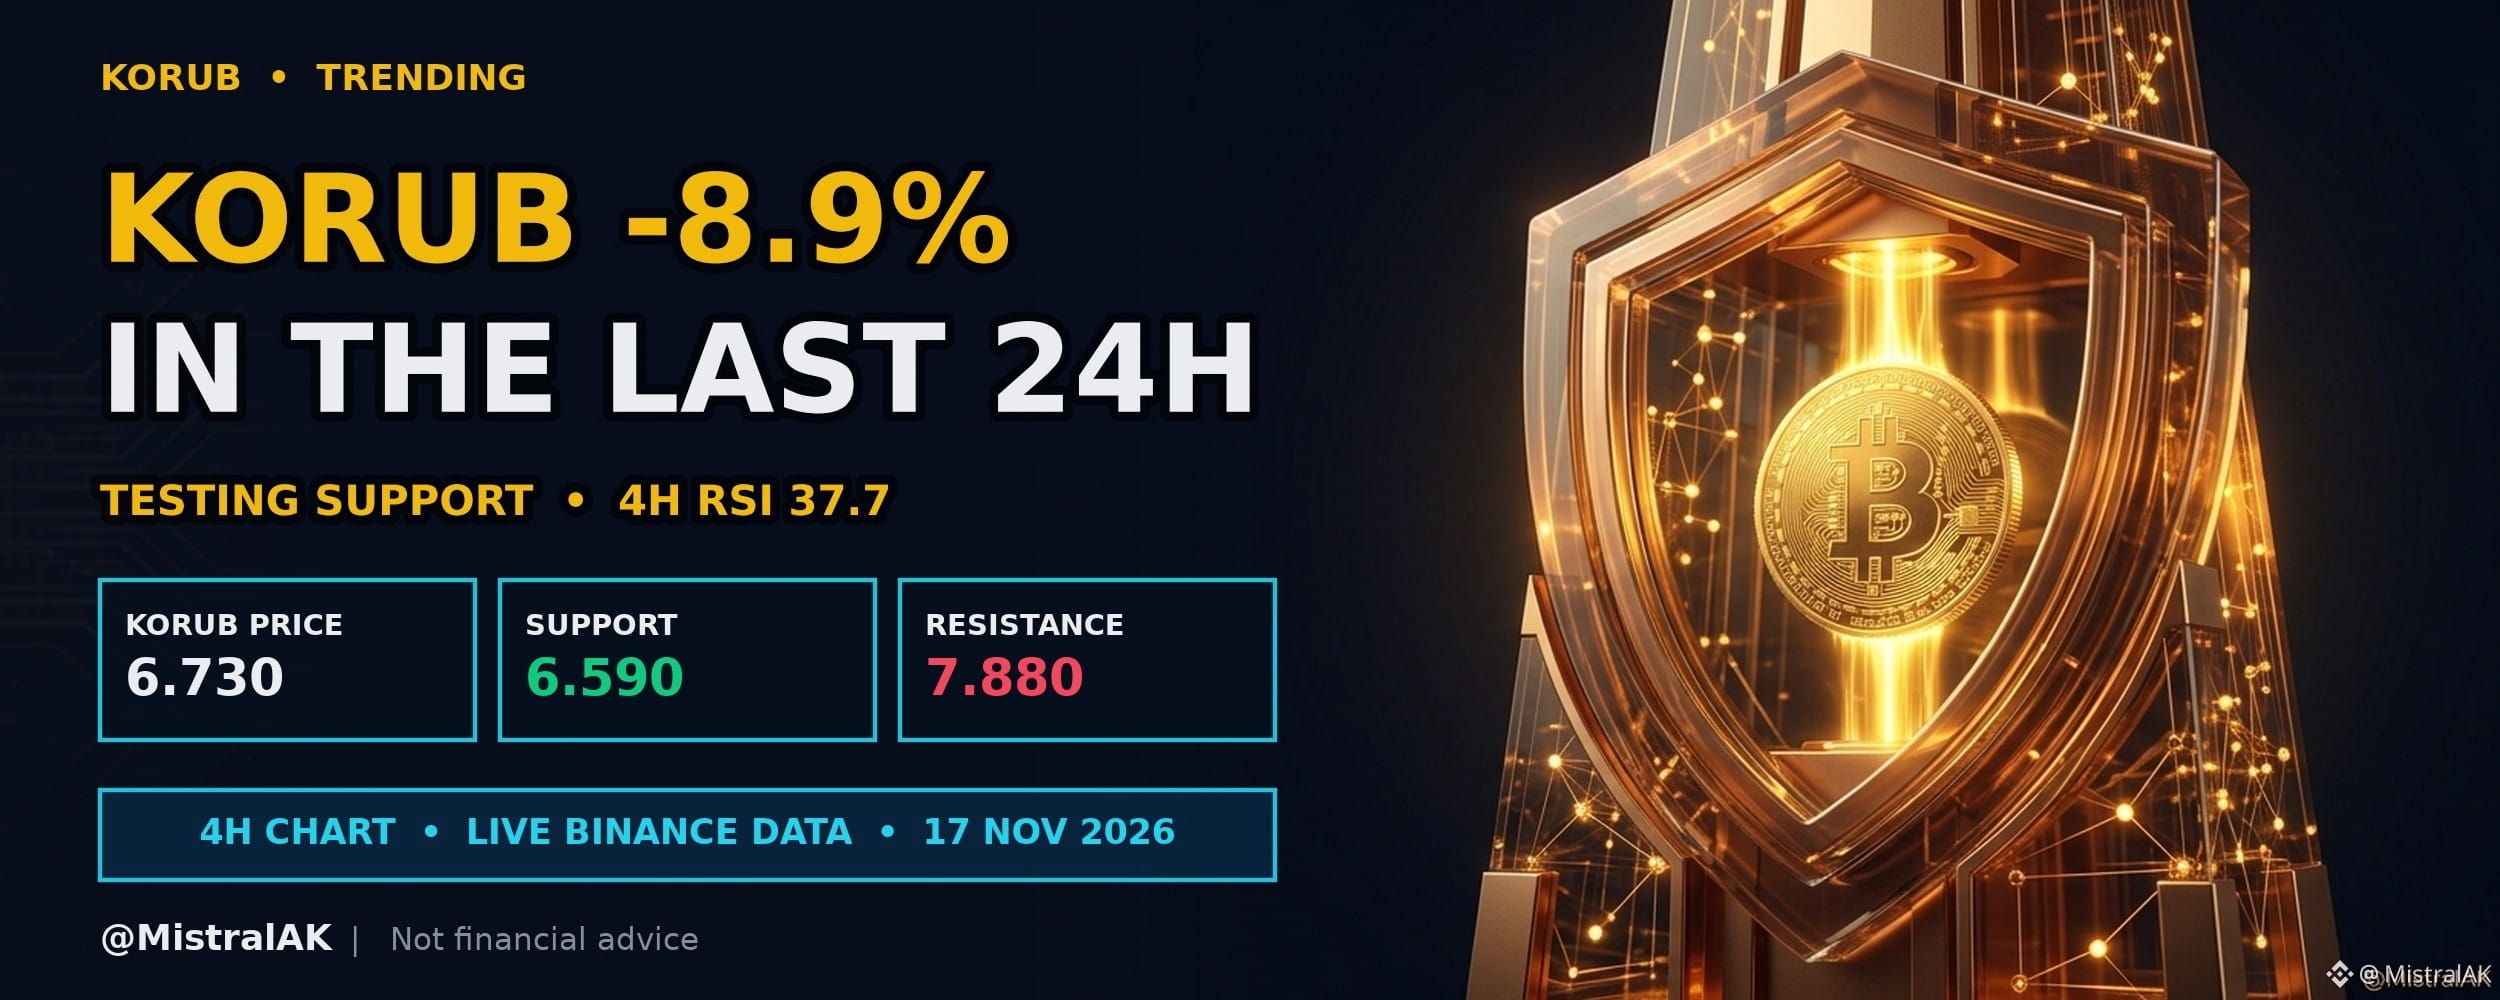
$KORUB Price Tests Swing Low After Recent Downward Move
$KORUB trades at 6.730 USD, down 8.9% over the past 24 hours, with 4H RSI at 37.7 (neutral).
Downward movement over the past twenty-four hours has pushed price to test its recent swing low on the four-hour chart. With the four-hour relative strength index in a balanced zone, traders are watching for confirmation at this level.
WHY IT IS ON THE RADAR
▪️ 24h move: -8.9%
▪️ 24h volume: 14M USDT (#26 among liquid USDT pairs)
KEY LEVELS
▪️ Resistance: 7.880 USD (20-candle 4H swing high)
▪️ Support: 6.590 USD (20-candle 4H swing low)
WHAT WOULD CONFIRM A HOLD
▪️ 4H candles defending 6.590 USD with a recovery above EMA 20 (7.188 USD)
WHAT WOULD INVALIDATE IT
▪️ A 4H close below 6.590 USD
Do you expect this swing low support to hold, or will downward movement continue?
Not financial advice. Always DYOR.
Like & Follow for Daily Trade Analytics & Insider News. @MistralAK
#KORUB #TradingSignals #TrendingTopic
$KORUB Price Tests Swing Low After Recent Downward Move
$KORUB trades at 6.730 USD, down 8.9% over the past 24 hours, with 4H RSI at 37.7 (neutral).
Downward movement over the past twenty-four hours has pushed price to test its recent swing low on the four-hour chart. With the four-hour relative strength index in a balanced zone, traders are watching for confirmation at this level.
WHY IT IS ON THE RADAR
▪️ 24h move: -8.9%
▪️ 24h volume: 14M USDT (#26 among liquid USDT pairs)
KEY LEVELS
▪️ Resistance: 7.880 USD (20-candle 4H swing high)
▪️ Support: 6.590 USD (20-candle 4H swing low)
WHAT WOULD CONFIRM A HOLD
▪️ 4H candles defending 6.590 USD with a recovery above EMA 20 (7.188 USD)
WHAT WOULD INVALIDATE IT
▪️ A 4H close below 6.590 USD
Do you expect this swing low support to hold, or will downward movement continue?
Not financial advice. Always DYOR.
Like & Follow for Daily Trade Analytics & Insider News. @MistralAK
#KORUB #TradingSignals #TrendingTopic
$KORUB trades at 6.730 USD, down 8.9% over the past 24 hours, with 4H RSI at 37.7 (neutral).
Downward movement over the past twenty-four hours has pushed price to test its recent swing low on the four-hour chart. With the four-hour relative strength index in a balanced zone, traders are watching for confirmation at this level.
WHY IT IS ON THE RADAR
▪️ 24h move: -8.9%
▪️ 24h volume: 14M USDT (#26 among liquid USDT pairs)
KEY LEVELS
▪️ Resistance: 7.880 USD (20-candle 4H swing high)
▪️ Support: 6.590 USD (20-candle 4H swing low)
WHAT WOULD CONFIRM A HOLD
▪️ 4H candles defending 6.590 USD with a recovery above EMA 20 (7.188 USD)
WHAT WOULD INVALIDATE IT
▪️ A 4H close below 6.590 USD
Do you expect this swing low support to hold, or will downward movement continue?
Not financial advice. Always DYOR.
Like & Follow for Daily Trade Analytics & Insider News. @MistralAK
#KORUB #TradingSignals #TrendingTopic
318


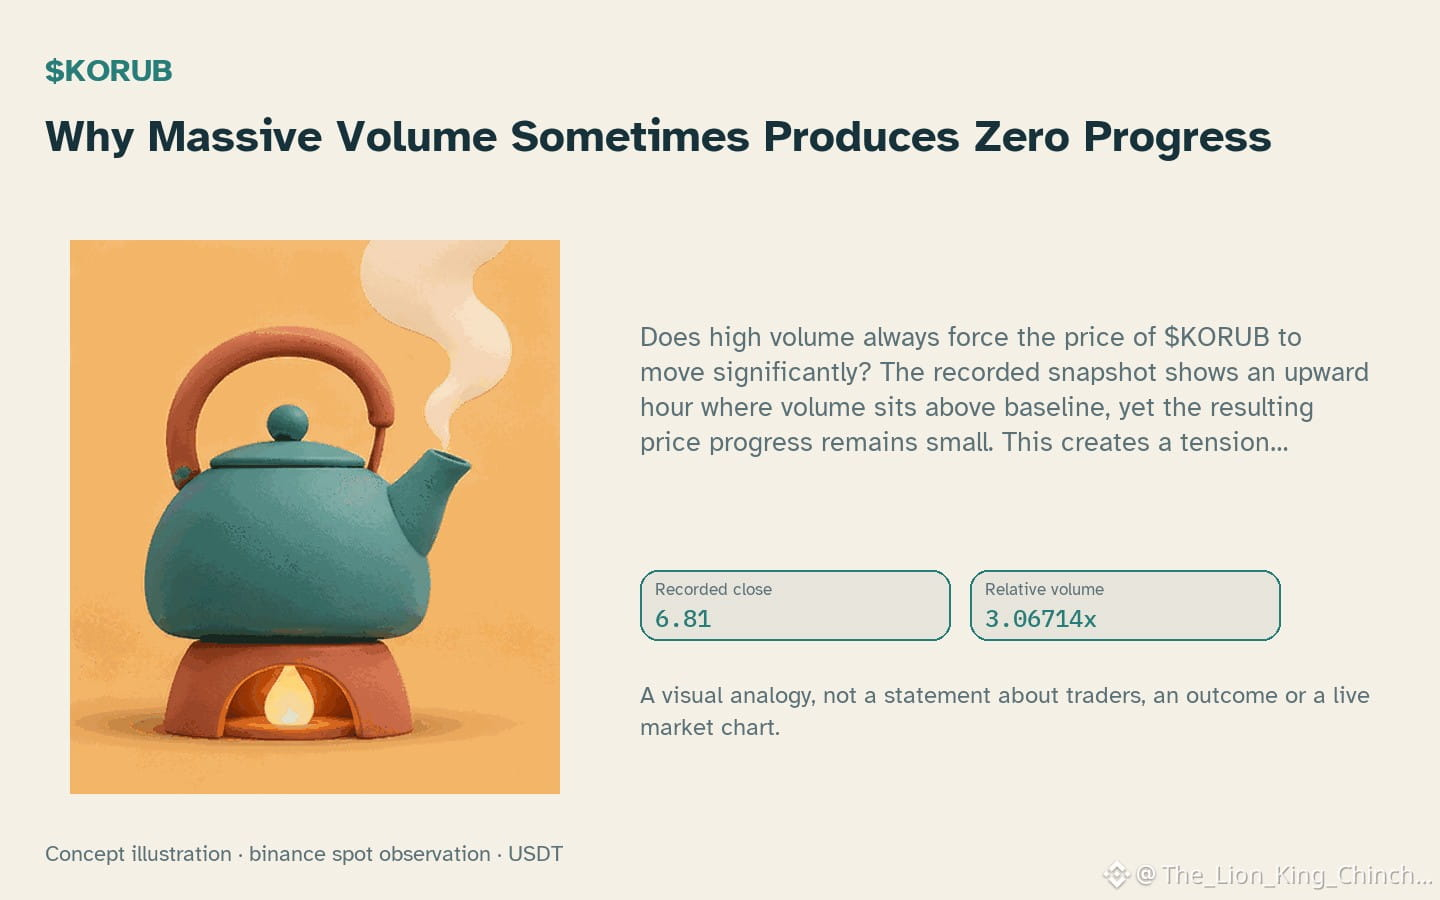
$KORUB: Why Massive Volume Sometimes Produces Zero Progress
Does high volume always force the price of $KORUB to move significantly? The recorded snapshot shows an upward hour where volume sits above baseline, yet the resulting price progress remains small. This creates a tension regarding how volume relates to price action. Standard teaching suggests that heavy trading activity needs to drive prices. However, this can be wrong when market participants cancel pending orders efficiently. When one side does not permanently remove limit orders, large trades simply get absorbed into the order book. This phenomenon is known as absorption. It exists as a hypothetical mechanism. Candles alone cannot prove that specific limit orders are being cancelled or filled. Observing relative volume at 3.07x baseline confirms trading intensity. It does not confirm who is buying or selling. The RSI reading at 52.0 provides a snapshot of momentum. It does not predict the next candle. A counterexample is a large block of orders placed at a specific resistance level. This can soak up buying pressure without the price rising. The price remains near the 6.85 level. A practical self-check involves observing the range. If the price stays inside the recorded bounds despite high volume, the interpretation of aggressive buying weakens. Future closed-candle evidence showing a break above 6.85 would suggest the orders were overwhelmed. Conversely, a failure to break would support the absorption idea. This process distinguishes a thought experiment from current facts. The data defines the observed state. It does not confirm intent. Rely on the supplied tokens for specific numeric values. This ensures the analysis remains grounded in verified observations rather than speculation.
Probabilistic market research, not a recommendation or guaranteed return.
#KORUB #CryptoLearning
$KORUB : Why Massive Volume Sometimes Produces Zero Progress
Does high volume always force the price of $KORUB to move significantly? The recorded snapshot shows an upward hour where volume sits above baseline, yet the resulting price progress remains small. This creates a tension regarding how volume relates to price action. Standard teaching suggests that heavy trading activity needs to drive prices. However, this can be wrong when market participants cancel pending orders efficiently. When one side does not permanently remove limit orders, large trades simply get absorbed into the order book. This phenomenon is known as absorption. It exists as a hypothetical mechanism. Candles alone cannot prove that specific limit orders are being cancelled or filled. Observing relative volume at 3.07x baseline confirms trading intensity. It does not confirm who is buying or selling. The RSI reading at 52.0 provides a snapshot of momentum. It does not predict the next candle. A counterexample is a large block of orders placed at a specific resistance level. This can soak up buying pressure without the price rising. The price remains near the 6.85 level. A practical self-check involves observing the range. If the price stays inside the recorded bounds despite high volume, the interpretation of aggressive buying weakens. Future closed-candle evidence showing a break above 6.85 would suggest the orders were overwhelmed. Conversely, a failure to break would support the absorption idea. This process distinguishes a thought experiment from current facts. The data defines the observed state. It does not confirm intent. Rely on the supplied tokens for specific numeric values. This ensures the analysis remains grounded in verified observations rather than speculation.
Probabilistic market research, not a recommendation or guaranteed return.
#KORUB #CryptoLearning
Does high volume always force the price of $KORUB to move significantly? The recorded snapshot shows an upward hour where volume sits above baseline, yet the resulting price progress remains small. This creates a tension regarding how volume relates to price action. Standard teaching suggests that heavy trading activity needs to drive prices. However, this can be wrong when market participants cancel pending orders efficiently. When one side does not permanently remove limit orders, large trades simply get absorbed into the order book. This phenomenon is known as absorption. It exists as a hypothetical mechanism. Candles alone cannot prove that specific limit orders are being cancelled or filled. Observing relative volume at 3.07x baseline confirms trading intensity. It does not confirm who is buying or selling. The RSI reading at 52.0 provides a snapshot of momentum. It does not predict the next candle. A counterexample is a large block of orders placed at a specific resistance level. This can soak up buying pressure without the price rising. The price remains near the 6.85 level. A practical self-check involves observing the range. If the price stays inside the recorded bounds despite high volume, the interpretation of aggressive buying weakens. Future closed-candle evidence showing a break above 6.85 would suggest the orders were overwhelmed. Conversely, a failure to break would support the absorption idea. This process distinguishes a thought experiment from current facts. The data defines the observed state. It does not confirm intent. Rely on the supplied tokens for specific numeric values. This ensures the analysis remains grounded in verified observations rather than speculation.
Probabilistic market research, not a recommendation or guaranteed return.
#KORUB #CryptoLearning
36

·
--
$KORUB -8.86% | $BTC -0.28% | $ETH +0.18%
#KORUB sits at $6.79, down 8.86% on $12.3 M of volume, a noticeable dip that could signal short‑term pressure.
Bitcoin trades around $64,711.11, slipping 0.28% despite $1.38 B of daily volume, holding steady as the flagship crypto remains anchored by its broad market base.
Ethereum is priced at $1,818.79, up 0.18% with $541.8 M moving, hinting at modest buyer interest after recent network upgrades.
👀 Keep an eye on how the modest rise in #ETH compares to #BTC’s flatness; a divergence may emerge if demand shifts toward DeFi activity.
#Write2Earn #Binance
$KORUB -8.86% | $BTC -0.28% | $ETH +0.18%
#KORUB sits at $6.79, down 8.86% on $12.3 M of volume, a noticeable dip that could signal short‑term pressure.
Bitcoin trades around $64,711.11, slipping 0.28% despite $1.38 B of daily volume, holding steady as the flagship crypto remains anchored by its broad market base.
Ethereum is priced at $1,818.79, up 0.18% with $541.8 M moving, hinting at modest buyer interest after recent network upgrades.
👀 Keep an eye on how the modest rise in #ETH compares to #BTC’s flatness; a divergence may emerge if demand shifts toward DeFi activity.
#Write2Earn #Binance
#KORUB sits at $6.79, down 8.86% on $12.3 M of volume, a noticeable dip that could signal short‑term pressure.
Bitcoin trades around $64,711.11, slipping 0.28% despite $1.38 B of daily volume, holding steady as the flagship crypto remains anchored by its broad market base.
Ethereum is priced at $1,818.79, up 0.18% with $541.8 M moving, hinting at modest buyer interest after recent network upgrades.
👀 Keep an eye on how the modest rise in #ETH compares to #BTC’s flatness; a divergence may emerge if demand shifts toward DeFi activity.
#Write2Earn #Binance
1

👀 Spotting KORUB on the chart feels like watching a subtle tide retreat – the last hour nudged a touch lower after a brief bounce from a slightly higher level. Remember, a quiet dip isn’t a green light on its own; it’s just the market taking a breath. If you’re curious, watch how the next candles respond before reading too much into the dip. 🌊 📰
Not financial advice.
#CryptoWatch #KORUB #MarketMood #ChartTalk #Write2Earn
👀 Spotting KORUB on the chart feels like watching a subtle tide retreat – the last hour nudged a touch lower after a brief bounce from a slightly higher level. Remember, a quiet dip isn’t a green light on its own; it’s just the market taking a breath. If you’re curious, watch how the next candles respond before reading too much into the dip. 🌊 📰
Not financial advice.
#CryptoWatch #KORUB #MarketMood #ChartTalk #Write2Earn
Not financial advice.
#CryptoWatch #KORUB #MarketMood #ChartTalk #Write2Earn
520
·
--
$KORUB has one major level holding up today at $7.8800
We sit just 1.3 percent below that spot right now with an RSI of 71 🪞
An hourly close higher opens the door while rejection points straight back toward $6.8300 support
Open $KORUB and set an alert at that level
Break or reject? 👀
#KORUB #PriceAction
$KORUB has one major level holding up today at $7.8800
We sit just 1.3 percent below that spot right now with an RSI of 71 🪞
An hourly close higher opens the door while rejection points straight back toward $6.8300 support
Open $KORUB and set an alert at that level
Break or reject? 👀
#KORUB #PriceAction
We sit just 1.3 percent below that spot right now with an RSI of 71 🪞
An hourly close higher opens the door while rejection points straight back toward $6.8300 support
Open $KORUB and set an alert at that level
Break or reject? 👀
#KORUB #PriceAction
77

·
--
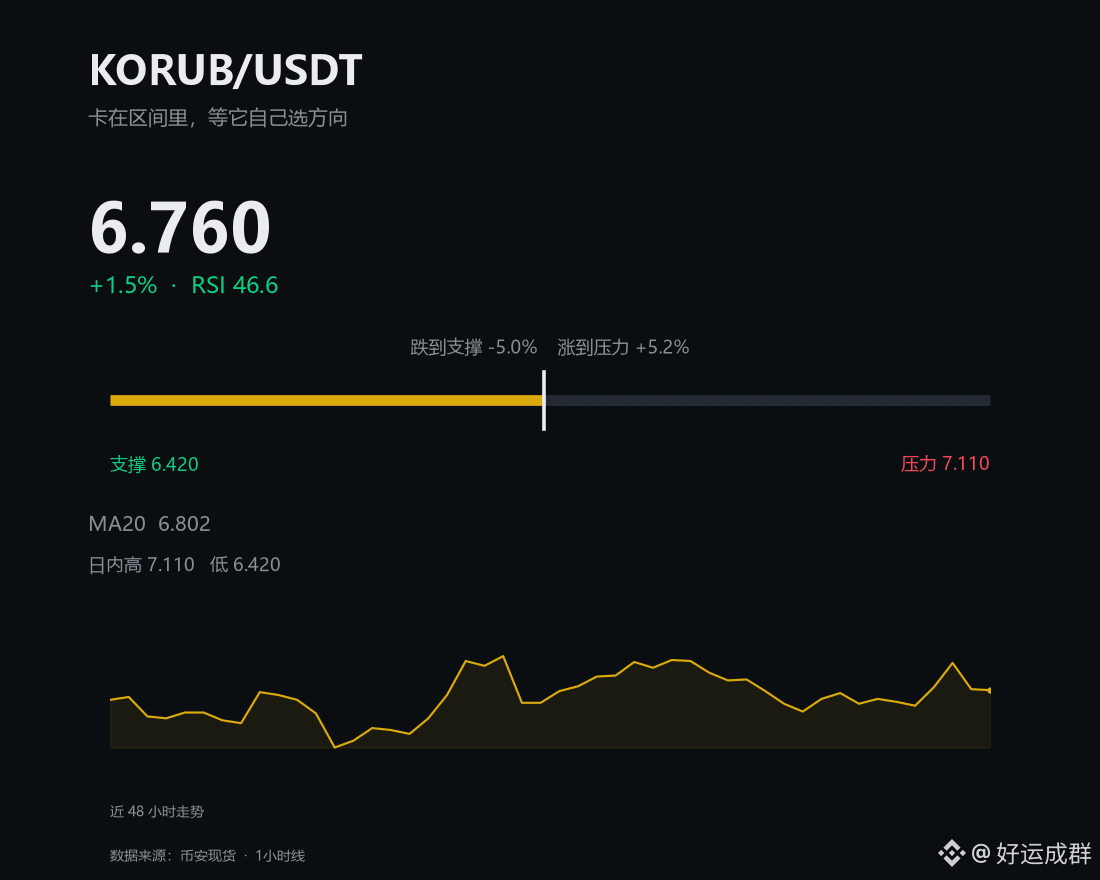
$KORUB is up 1.5% today, leaving Bitcoin well behind. $BTC is down 2.5% today.
The easiest mistake to make at a level like this is to mistake a bounce for a reversal.
Current price: 6.76, resistance: 7.11, support: 6.42, RSI: 46.6.
If you’re going to buy, wait until it holds above 7.11. If it can’t, just sit tight for now—money in your hand won’t bite.
Would you add to your position here?
Don’t treat a single candlestick as the final verdict; it hasn’t even found its footing yet.
#币圈 #KORUB
$KORUB is up 1.5% today, leaving Bitcoin well behind. $BTC is down 2.5% today.
The easiest mistake to make at a level like this is to mistake a bounce for a reversal.
Current price: 6.76, resistance: 7.11, support: 6.42, RSI: 46.6.
If you’re going to buy, wait until it holds above 7.11. If it can’t, just sit tight for now—money in your hand won’t bite.
Would you add to your position here?
Don’t treat a single candlestick as the final verdict; it hasn’t even found its footing yet.
#币圈 #KORUB
The easiest mistake to make at a level like this is to mistake a bounce for a reversal.
Current price: 6.76, resistance: 7.11, support: 6.42, RSI: 46.6.
If you’re going to buy, wait until it holds above 7.11. If it can’t, just sit tight for now—money in your hand won’t bite.
Would you add to your position here?
Don’t treat a single candlestick as the final verdict; it hasn’t even found its footing yet.
#币圈 #KORUB
45

·
--

Article
KORUB | Data Note | 2026-11-18Amid all the buzz, keep an eye on the numbers—$KORUB ’s metric note: PRICE_CHANGE_24H recorded 6.72. The rolling 24-hour price change is +5.8270%, reaching the 5% watch threshold; this does not predict price direction
📊 Data Snapshot
· Metric: PRICE_CHANGE_24H
· Reading: 6.72
· Basis: Based on a sequence of closed candlesticks
There’s emotion behind the numbers
Would you wait for confirmation? 👇
## How to read this data
This observation is calculated from a sequence of closed candlesticks provided by the source API. The metric is a mathematical calculation based on historical prices; it describes only the observation at that point in time, does not predict price direction, and is not a buy or sell instruction.
KORUB | Data Note | 2026-11-18
Amid all the buzz, keep an eye on the numbers—$KORUB ’s metric note: PRICE_CHANGE_24H recorded 6.72. The rolling 24-hour price change is +5.8270%, reaching the 5% watch threshold; this does not predict price direction
📊 Data Snapshot
· Metric: PRICE_CHANGE_24H
· Reading: 6.72
· Basis: Based on a sequence of closed candlesticks
There’s emotion behind the numbers
Would you wait for confirmation? 👇
## How to read this data
This observation is calculated from a sequence of closed candlesticks provided by the source API. The metric is a mathematical calculation based on historical prices; it describes only the observation at that point in time, does not predict price direction, and is not a buy or sell instruction.
📊 Data Snapshot
· Metric: PRICE_CHANGE_24H
· Reading: 6.72
· Basis: Based on a sequence of closed candlesticks
There’s emotion behind the numbers
Would you wait for confirmation? 👇
## How to read this data
This observation is calculated from a sequence of closed candlesticks provided by the source API. The metric is a mathematical calculation based on historical prices; it describes only the observation at that point in time, does not predict price direction, and is not a buy or sell instruction.

·
--
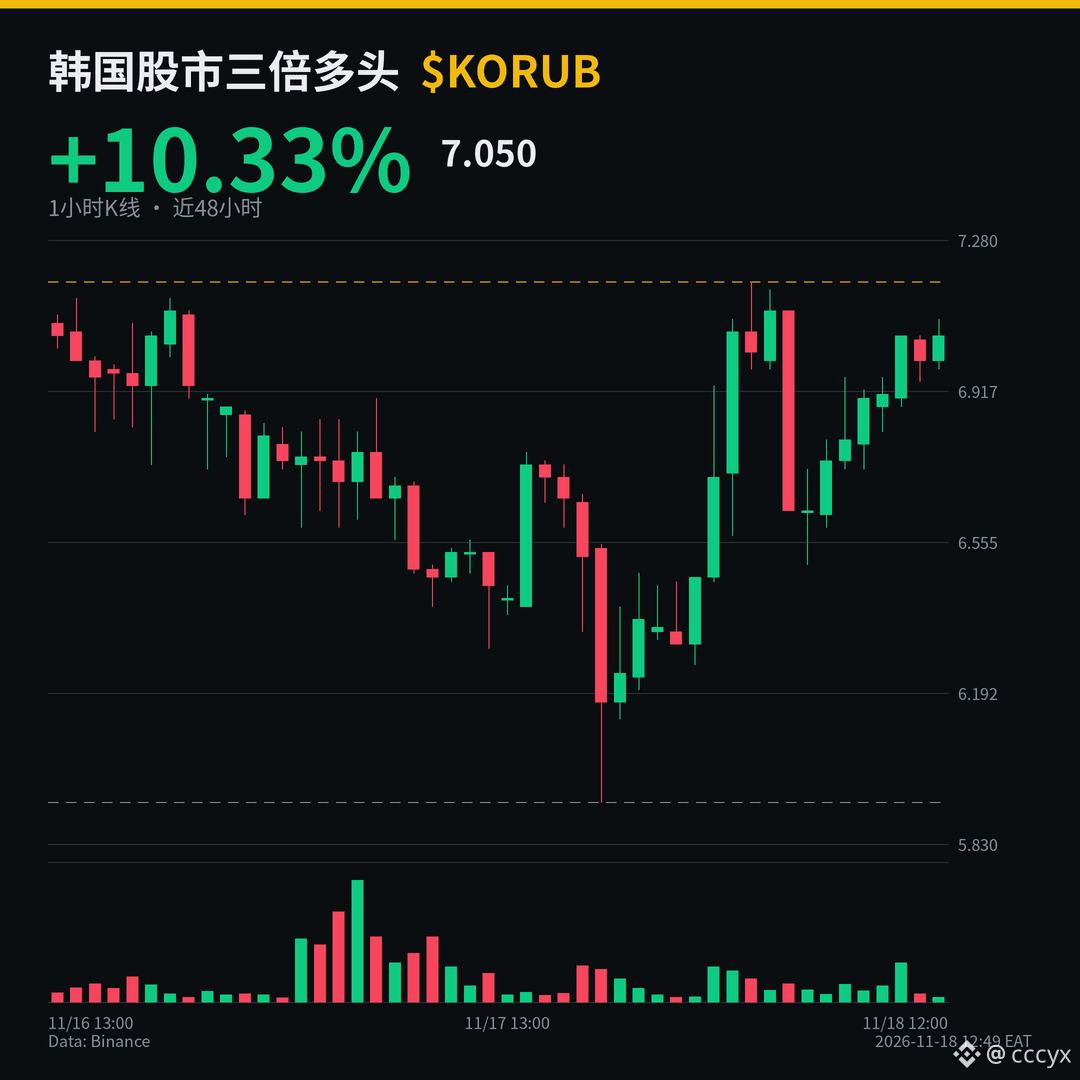
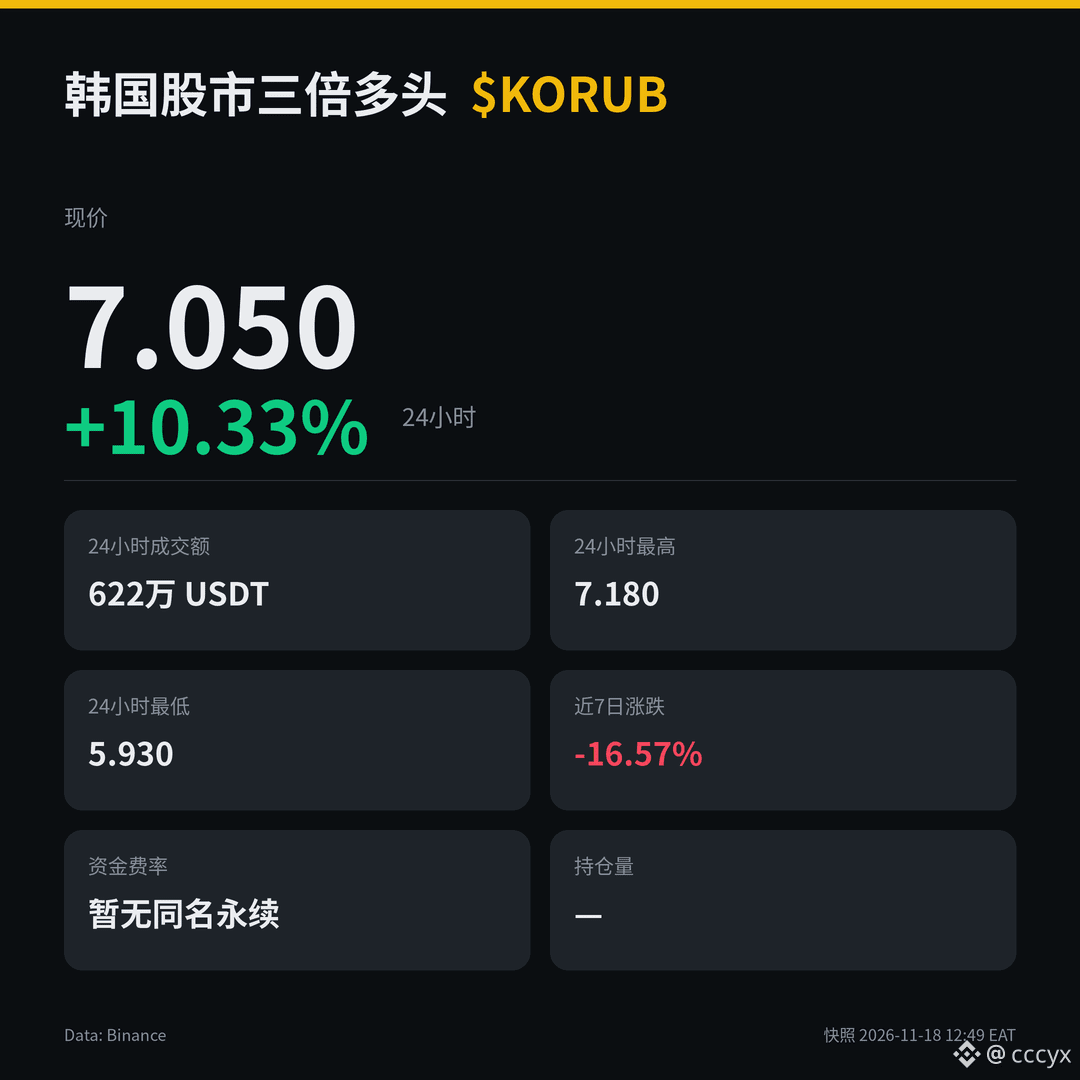
$KORUB It moved pretty aggressively today. This is a token tracking the Korea KOSPI 3x leveraged ETF. KOSPI closed up 1.99%, and KORU reached 7.04 in after-hours/pre-market trading. The token is now at 7.05, up 10.33% on the day, with volume of 6.22 million, a high of 7.18, and a low of 5.93. I opened a long around 6.40 and am still holding it, but getting close to 7.18 is making me a little nervous. The short-term bias is bullish, and 7.18 is the level to watch. It’s still down 16.57% over 7 days; if it can’t break through, it may keep trading sideways.
$KORUB #KORUB #BTC #ETH
$KORUB It moved pretty aggressively today. This is a token tracking the Korea KOSPI 3x leveraged ETF. KOSPI closed up 1.99%, and KORU reached 7.04 in after-hours/pre-market trading. The token is now at 7.05, up 10.33% on the day, with volume of 6.22 million, a high of 7.18, and a low of 5.93. I opened a long around 6.40 and am still holding it, but getting close to 7.18 is making me a little nervous. The short-term bias is bullish, and 7.18 is the level to watch. It’s still down 16.57% over 7 days; if it can’t break through, it may keep trading sideways.
$KORUB #KORUB #BTC #ETH
$KORUB #KORUB #BTC #ETH
161
·
--
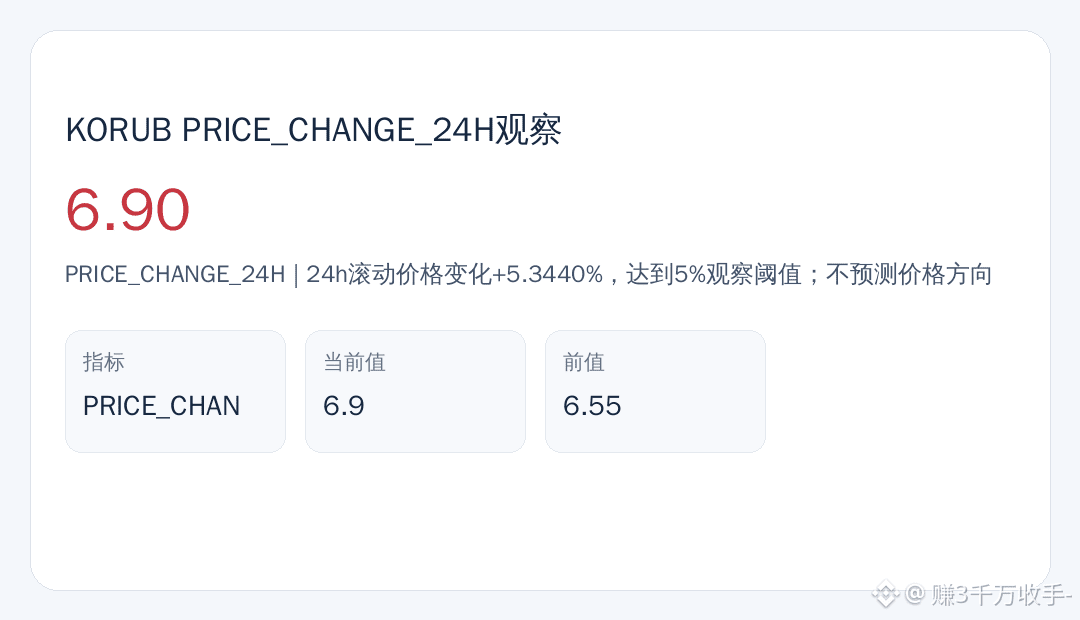
Let’s hold off on speculation—the metric notes for $KORUB : PRICE_CHANGE_24H recorded 6.90. The 24h rolling price change is +5.3440%, reaching the 5% watch threshold; no prediction of price direction
📊 Data snapshot
· Metric: PRICE_CHANGE_24H
· Reading: 6.90
· Basis: Closed candlestick sequence
Volatility doesn’t equal opportunity—don’t mistake noise for a signal
What’s your take on this move? 👇
#市场观察 #KORUB #Binance
Let’s hold off on speculation—the metric notes for $KORUB : PRICE_CHANGE_24H recorded 6.90. The 24h rolling price change is +5.3440%, reaching the 5% watch threshold; no prediction of price direction
📊 Data snapshot
· Metric: PRICE_CHANGE_24H
· Reading: 6.90
· Basis: Closed candlestick sequence
Volatility doesn’t equal opportunity—don’t mistake noise for a signal
What’s your take on this move? 👇
#市场观察 #KORUB #Binance
📊 Data snapshot
· Metric: PRICE_CHANGE_24H
· Reading: 6.90
· Basis: Closed candlestick sequence
Volatility doesn’t equal opportunity—don’t mistake noise for a signal
What’s your take on this move? 👇
#市场观察 #KORUB #Binance

·
--
SMART MONEY ACCUMULATION SIGNALS IMPENDING SUPPLY SHOCK
🟢 KORUB: 7.4 (+7.09%)
🟢 RARE: 0.01368 (+60.19%)
🟢 MEGA: 0.0492 (+8.01%)
Our on-chain analytics reveal significant institutional buying volume across these assets, indicating smart money is actively entering the market, potentially driving a localized supply shock.
Are you tracking these substantial smart money inflows and their implications?
#KORUB #RARE #MEGA #MarketUpdate #TechnicalAnalysis
SMART MONEY ACCUMULATION SIGNALS IMPENDING SUPPLY SHOCK
🟢 KORUB: 7.4 (+7.09%)
🟢 RARE: 0.01368 (+60.19%)
🟢 MEGA: 0.0492 (+8.01%)
Our on-chain analytics reveal significant institutional buying volume across these assets, indicating smart money is actively entering the market, potentially driving a localized supply shock.
Are you tracking these substantial smart money inflows and their implications?
#KORUB #RARE #MEGA #MarketUpdate #TechnicalAnalysis
🟢 KORUB: 7.4 (+7.09%)
🟢 RARE: 0.01368 (+60.19%)
🟢 MEGA: 0.0492 (+8.01%)
Our on-chain analytics reveal significant institutional buying volume across these assets, indicating smart money is actively entering the market, potentially driving a localized supply shock.
Are you tracking these substantial smart money inflows and their implications?
#KORUB #RARE #MEGA #MarketUpdate #TechnicalAnalysis
34

·
--
$KORUB
Korean 3x leveraged ETF tokenized certificate: down 8.4% over 24h, with $12.29M in trading volume. It’s still trending downward, and selling pressure remains. Wait for it to stabilize before deciding.
Reading the chart: 6.24 is the first support level, 6.11 is the last line of defense, and 6.62 is the short-term target above.
Trading approach: If it retests 6.24 and holds, consider a small position. If it falls below 6.11, exit unconditionally—don’t try to call the bottom.
Remember: Leveraged ETFs suffer from daily reset decay, so they’re suitable only for short-term trading, not long-term holding.
(Personal analysis; not investment advice.)
#KORUB
$KORUB
Korean 3x leveraged ETF tokenized certificate: down 8.4% over 24h, with $12.29M in trading volume. It’s still trending downward, and selling pressure remains. Wait for it to stabilize before deciding.
Reading the chart: 6.24 is the first support level, 6.11 is the last line of defense, and 6.62 is the short-term target above.
Trading approach: If it retests 6.24 and holds, consider a small position. If it falls below 6.11, exit unconditionally—don’t try to call the bottom.
Remember: Leveraged ETFs suffer from daily reset decay, so they’re suitable only for short-term trading, not long-term holding.
(Personal analysis; not investment advice.)
#KORUB
Korean 3x leveraged ETF tokenized certificate: down 8.4% over 24h, with $12.29M in trading volume. It’s still trending downward, and selling pressure remains. Wait for it to stabilize before deciding.
Reading the chart: 6.24 is the first support level, 6.11 is the last line of defense, and 6.62 is the short-term target above.
Trading approach: If it retests 6.24 and holds, consider a small position. If it falls below 6.11, exit unconditionally—don’t try to call the bottom.
Remember: Leveraged ETFs suffer from daily reset decay, so they’re suitable only for short-term trading, not long-term holding.
(Personal analysis; not investment advice.)
#KORUB
386
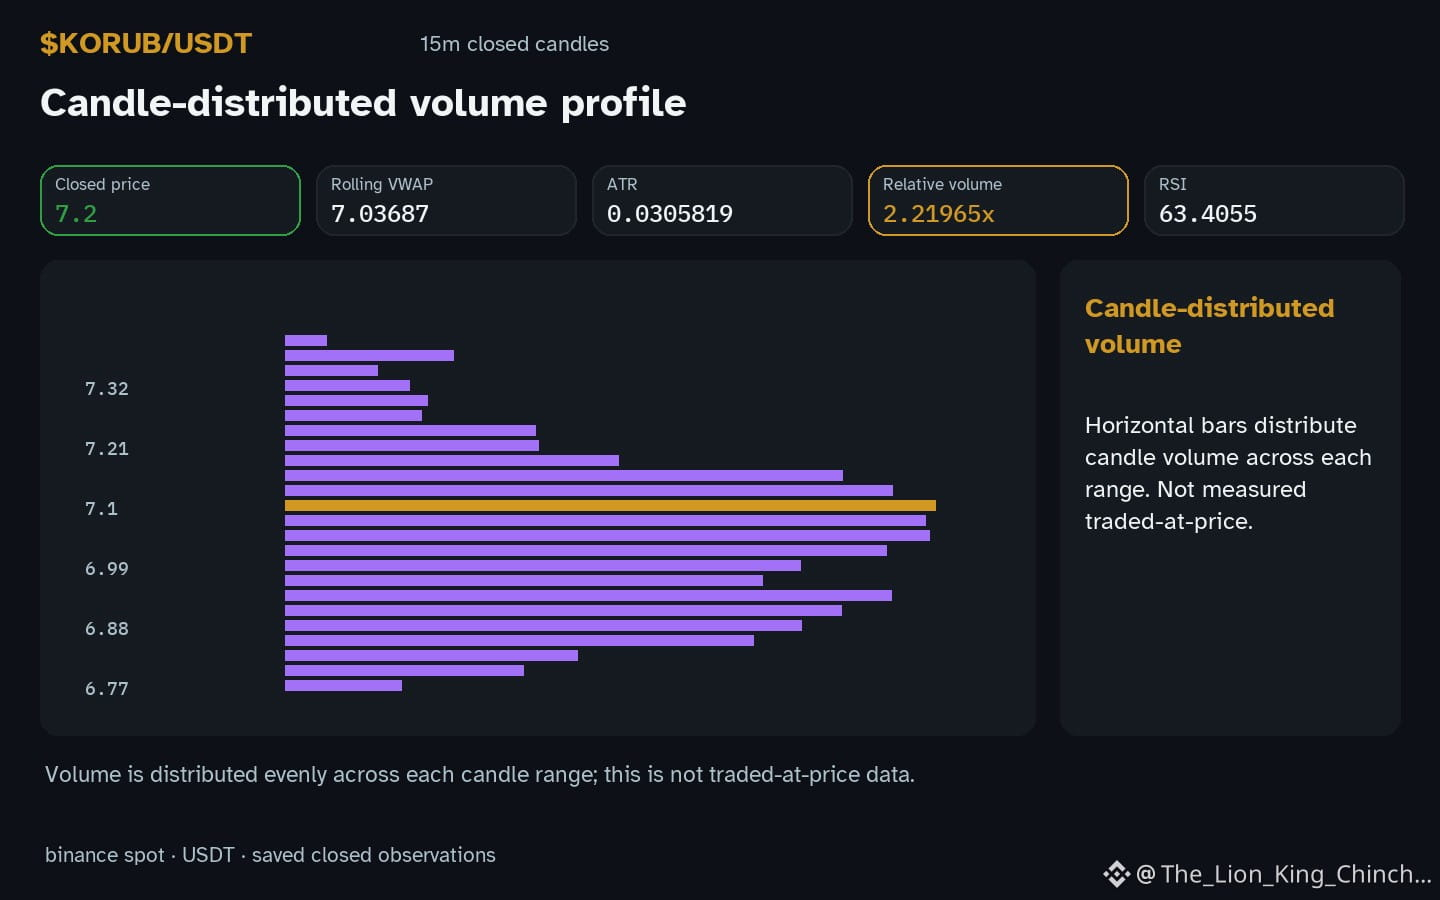
$KORUB: The Loud Auction Room: Why the Fastest Bidder Usually Overpays
$KORUB: KORUB shows an hourly up move while volume sits above baseline, prompting the question whether a live‑auction style dynamic could explain the candle shape.
A common assumption is that a sudden surge of buying pressure forces the price upward like an auctioneer raising the hammer quickly. In that view, each aggressive market order acts as a bid, and the candle’s upper wick reflects participants trying to outbid one another.
The counterexample to consider is a scenario where the same price rise occurs with modest relative volume 2.22x baseline. Here the candle may simply reflect a thin order book and a few limit orders being hit, rather than a competitive bidding war. The analogy breaks because an auction needs many participants raising the price, while low volume suggests limited interest.
What could change the reading is a future closed‑candle that shows both a higher relative volume and a narrowing spread, indicating many traders actively posting bids. If the next hourly candle closes higher with relative volume above 2.22x baseline and the spread contracts, the auction metaphor gains plausibility. Conversely, if volume remains low and the spread widens, the breakout is more likely a price slip through thin liquidity rather than a true competitive push. This conditional framing keeps the hypothesis testable while acknowledging the limits of candle‑only analysis.
Probabilistic market research, not a recommendation or guaranteed return.
The label or the mechanism behind it?
#KORUB #CryptoEducation #CryptoLearning
$KORUB : The Loud Auction Room: Why the Fastest Bidder Usually Overpays
$KORUB : KORUB shows an hourly up move while volume sits above baseline, prompting the question whether a live‑auction style dynamic could explain the candle shape.
A common assumption is that a sudden surge of buying pressure forces the price upward like an auctioneer raising the hammer quickly. In that view, each aggressive market order acts as a bid, and the candle’s upper wick reflects participants trying to outbid one another.
The counterexample to consider is a scenario where the same price rise occurs with modest relative volume 2.22x baseline. Here the candle may simply reflect a thin order book and a few limit orders being hit, rather than a competitive bidding war. The analogy breaks because an auction needs many participants raising the price, while low volume suggests limited interest.
What could change the reading is a future closed‑candle that shows both a higher relative volume and a narrowing spread, indicating many traders actively posting bids. If the next hourly candle closes higher with relative volume above 2.22x baseline and the spread contracts, the auction metaphor gains plausibility. Conversely, if volume remains low and the spread widens, the breakout is more likely a price slip through thin liquidity rather than a true competitive push. This conditional framing keeps the hypothesis testable while acknowledging the limits of candle‑only analysis.
Probabilistic market research, not a recommendation or guaranteed return.
The label or the mechanism behind it?
#KORUB #CryptoEducation #CryptoLearning
$KORUB : KORUB shows an hourly up move while volume sits above baseline, prompting the question whether a live‑auction style dynamic could explain the candle shape.
A common assumption is that a sudden surge of buying pressure forces the price upward like an auctioneer raising the hammer quickly. In that view, each aggressive market order acts as a bid, and the candle’s upper wick reflects participants trying to outbid one another.
The counterexample to consider is a scenario where the same price rise occurs with modest relative volume 2.22x baseline. Here the candle may simply reflect a thin order book and a few limit orders being hit, rather than a competitive bidding war. The analogy breaks because an auction needs many participants raising the price, while low volume suggests limited interest.
What could change the reading is a future closed‑candle that shows both a higher relative volume and a narrowing spread, indicating many traders actively posting bids. If the next hourly candle closes higher with relative volume above 2.22x baseline and the spread contracts, the auction metaphor gains plausibility. Conversely, if volume remains low and the spread widens, the breakout is more likely a price slip through thin liquidity rather than a true competitive push. This conditional framing keeps the hypothesis testable while acknowledging the limits of candle‑only analysis.
Probabilistic market research, not a recommendation or guaranteed return.
The label or the mechanism behind it?
#KORUB #CryptoEducation #CryptoLearning
32
Who here is in the KORUB community?
KORUB has gained traction thanks to volatility and liquidity; the private news isn’t clear enough yet, so I’m looking at the chart first.
Data: 6.36 · -11.30% 24h · Vol 12M USDT.
Overall market: BTC -0.42%, ETH 0.64% → mixed. Category: altcoin momentum. This move shouldn’t be read as the whole market moving together; watch out for isolated volatility.
I tend to avoid asking “how high will it go?” because no one knows. I’d rather ask: what’s the story behind this volatility?
Where do you see KORUB in the next 3–6 months?
#KORUB #CryptoCommunity #BinanceSquare
Who here is in the KORUB community?
KORUB has gained traction thanks to volatility and liquidity; the private news isn’t clear enough yet, so I’m looking at the chart first.
Data: 6.36 · -11.30% 24h · Vol 12M USDT.
Overall market: BTC -0.42%, ETH 0.64% → mixed. Category: altcoin momentum. This move shouldn’t be read as the whole market moving together; watch out for isolated volatility.
I tend to avoid asking “how high will it go?” because no one knows. I’d rather ask: what’s the story behind this volatility?
Where do you see KORUB in the next 3–6 months?
#KORUB #CryptoCommunity #BinanceSquare
KORUB has gained traction thanks to volatility and liquidity; the private news isn’t clear enough yet, so I’m looking at the chart first.
Data: 6.36 · -11.30% 24h · Vol 12M USDT.
Overall market: BTC -0.42%, ETH 0.64% → mixed. Category: altcoin momentum. This move shouldn’t be read as the whole market moving together; watch out for isolated volatility.
I tend to avoid asking “how high will it go?” because no one knows. I’d rather ask: what’s the story behind this volatility?
Where do you see KORUB in the next 3–6 months?
#KORUB #CryptoCommunity #BinanceSquare
Log in to explore more content
Join global crypto users on Binance Square
⚡️ Get latest and useful information about crypto.
💬 Trusted by the world’s largest crypto exchange.
👍 Discover real insights from verified creators.
Email / Phone number
Trending Topics
1
#BTCRemainsUnderPressureAfterHawkishFOMCMinutes
15,628 views
238 Discussing
2
#AnthropicToDebutAfter$83IPOPricing
6,083 views
32 Discussing
3
#NvidiaBoardReportedlySplitOverHuang’sReturn
721 views
34 Discussing
4
#CanGTA6'sLaunchLiftTTWOShares?
377 views
27 Discussing
5
#FOMCMinutesHighlightAIDebtRisks
2,691 views
71 Discussing
6
#SouthKoreaPlansToLet3500ListedFirmsBuyBitcoin
5,258 views
123 Discussing
7
#FedMinutesShowAlmostAllOfficialsExpectMoreHikes
0 views
2 Discussing
8
#GoldmanSachsQ3BitcoinETFHoldingsReach$1.283B
217 views
6 Discussing
9
#TetherBackedUSATStablecoinLaunchesOnAvalanche
241 views
17 Discussing
10
#NvidiaBeatsEstimatesWith$130BQ4Outlook
107,184 views
336 Discussing